Communication

Study on Traction Characteristics of Point Contact State under Oil–Air Lubrication

1
School of Mechatronics Engineering, Henan University of Science and Technology, Luoyang 471003, China
2
Luoyang LYC Automobile Bearing Technology Co., Ltd., Luoyang 471003, China
*
Author to whom correspondence should be addressed.
Lubricants 2024, 12(9), 299; https://doi.org/10.3390/lubricants12090299
Submission received: 5 July 2024 / Revised: 21 August 2024 / Accepted: 23 August 2024 / Published: 25 August 2024

Abstract

:
Oil–air lubrication technology is commonly utilized in the lubrication design of traditional components to reduce friction between contact pairs. This study focuses on testing the point-contact friction pairs of two quantitative valves using a self-made oil–air lubrication traction force machine with a G95Cr18 disk and ball as the friction pairs. The test data are analyzed using a four-parameter exponential model. Additionally, a calculation model of the oil–air lubrication flow field is established, defining boundary conditions and conducting flow field simulation analysis. The results of the ball and disk test show that the traction coefficient increases with load and decreases with entrainment speed. Furthermore, when the air-speed is 12 m/s, the traction coefficient is lower for the oil supply of 6 mL/min than for the oil supply of 1.5 mL/min. According to CFD analysis, the volume fraction of the oil phase in the contact area increases with the increase of entrainment speed when the slip–roll ratio is 0.1. The theoretical values from the four-parameter exponential model align well with the experimental results, and the fitting accuracy is higher than 0.95.

1. Introduction

Oil–air lubrication is an innovative method that uses compressed air to propel oil through a pipe, creating a wave-like motion along the inner wall and forming a continuous thin film distributed to the lubrication point. In the process of oil–air lubrication, the high-speed air blows the lubricating oil into fine droplets and accurately transmits them to the friction pair to reduce friction and prolong life [1,2]. Compared to traditional techniques, this technology offers advantages like reduced lubricant usage, lower costs, and less environmental impact [3,4]. By controlling the oil–air ratio and injection process, precise lubrication of bearings can be achieved, improving bearing capacity and operational precision.
In recent years, the ball and disk traction-testing machine has been widely used to evaluate the point contact traction force. This testing machine simulates the traction behavior between the steel ball and the raceway in the bearing, and can accurately reproduce the actual working condition of the bearing. SKF introduced a ball and disk testing machine to investigate elastohydrodynamic traction issues [5,6]. This machine allows for adjustment of the steel ball’s rotation speed and the contact stress of the loading system, enabling precise measurement of the traction force between the ball and the disk. Researchers at Imperial College London developed a ball-and-disk lubricant elastohydrodynamic traction tester (MTM) that considers the impact of spin on the traction coefficient of elastic flow. By varying the motor speed and load, different slip–roll ratios between the ball and disk can be controlled. The elastohydrodynamic friction between the ball and disk can be accurately assessed using a torque sensor mounted on the ball shaft. Jiaozuo Institute of Technology and Henan Polytechnic University independently created a double-disk testing machine for in-depth examination of high-end lubricant performance [7]. Liu, et al. [8] utilized an enhanced JPM-1 double-disk contact fatigue friction and wear testing machine to investigate traction characteristics.
The application of simulation in lubrication has become increasingly common with advancements in computing technology. Scholars [9,10] have investigated the impact of oil–air lubrication on point-contact friction pairs, establishing a test system to examine the significant influence of oil supply on oil film shape and lubrication state. Additionally, researchers [11,12] have utilized numerical simulation to explore the flow characteristics of oil–air two-phase flow in high-speed bearings and the behavior of micro-oil droplets in elastohydrodynamic lubrication contact areas. Duan and Zhang [13] studied the sliding characteristics of the point contact pair of the ball and disk under different lubrication conditions, revealing the variation of the traction coefficient with specific speed and contact stress. Hu, et al. [14] conducted a system simulation to analyze the impact of basic parameters on the lubrication state of ultra-high-speed bearings. Furthermore, Liu, et al. [15] investigated lubrication conditions at different oil supply temperatures, to further understand the working conditions of the lubrication system. Jeng and Gao [16], Li, et al. [17] studied the characteristics of oil–air lubrication and oil lubrication on high-speed bearings and conducted comparative experiments of oil–air lubrication and oil lubrication on a friction and wear testing machine, finding that when the applied load reaches a certain value, the friction torque under oil–air lubrication is significantly lower than that under oil lubrication. Jeng and Gao [16] established an experimental research device for oil–air lubrication of high-speed ball bearings and investigated the law of influence of factors such as load size, oil supply and speed on bearing temperature rise. The results show that the temperature in the bearing cavity increases significantly with the increase of the rotational speed, and the increasing range is also obvious. Lee, et al. [18], Yang, et al. [19,20,21], Lee et al. [18,19,20,21] studied the working characteristics of rolling bearings under oil–air lubrication, as well as the relationship between the working performance of bearing systems and temperature changes.
Some authors have studied the effects of rolling speed and lubricant viscosity on oil replenishment around the contact surface [22,23,24], and recently also by a few authors using numerical simulations [25,26,27]. Pemberton and Cameron [28] studied the oil flow around the point contact and noted that the oil flow forms two different shapes, depending on the rolling speed and lubricant viscosity. Lubricating oil flow can be divided into states I and II [28,29]. In state I, the center of the rolling channel is filled with oil. In this state, a fully lubricated film is formed. As the velocity and viscosity increase, a transition from state I to state II is observed. The flow pattern becomes a butterfly, forming two separate oil bands. This transition also depends on the surface tension and cavitation effect at the outlet of the contact surface [28,30]. explored the flow mode of lubricating oil flow fields in a low-temperature environment, established a test bench, and provided a numerical calculation method for a low-temperature lubrication flow field. Lin, et al. [31] utilized Ansys-Fluent software to model and analyze the two-phase flow of oil–air in transmissions, comparing the efficacy of various lubrication techniques. Zeng, et al. [32] introduced a design approach for oil–air lubrication in high-speed bearings, examining the impact of nozzle structure parameters on the distribution of oil–air through a combination of numerical simulations and experiments. Their findings indicated that a well-designed nozzle facilitates the dispersion of lubricating oil into smaller droplets, thereby enhancing lubrication efficiency. Liu, et al. [33] conducted friction and wear tests under oil–air lubrication conditions, investigating the distribution of the oil phase and pressure near contact areas using numerical simulations. Szydlo [34] studied the oil phase distribution in the lubricating oil conveying oil mist pipeline and discussed the influence of the change of oil–air ratio on the lubrication effect.
Most scholars focus on the flow state of lubricants under oil lubrication or grease lubrication, as well as the mechanism of lubricant replenishment and loss. The lubrication conditions and optimized design parameters are systematically analyzed, resulting in the relevant conclusions. However, the lubricant distribution in the contact area is not related to the traction coefficient obtained by the experiment. So far, research on oil–air lubrication has primarily focused on how system parameters like oil–air pressure and rotational speed affect bearing temperature rise, and there is a noticeable lack of studies on the oil–air lubrication mechanism in the sliding state of point-contact friction pairs. To fill this gap, this study establishes a test platform for the sliding state of point-contact friction pairs and examines how oil–air lubrication behavior influences the traction characteristics of these pairs under sliding conditions through flow field simulation. The findings aim to provide insights into the oil–air lubrication mechanism.

2. Oil–Air Lubrication Traction Test
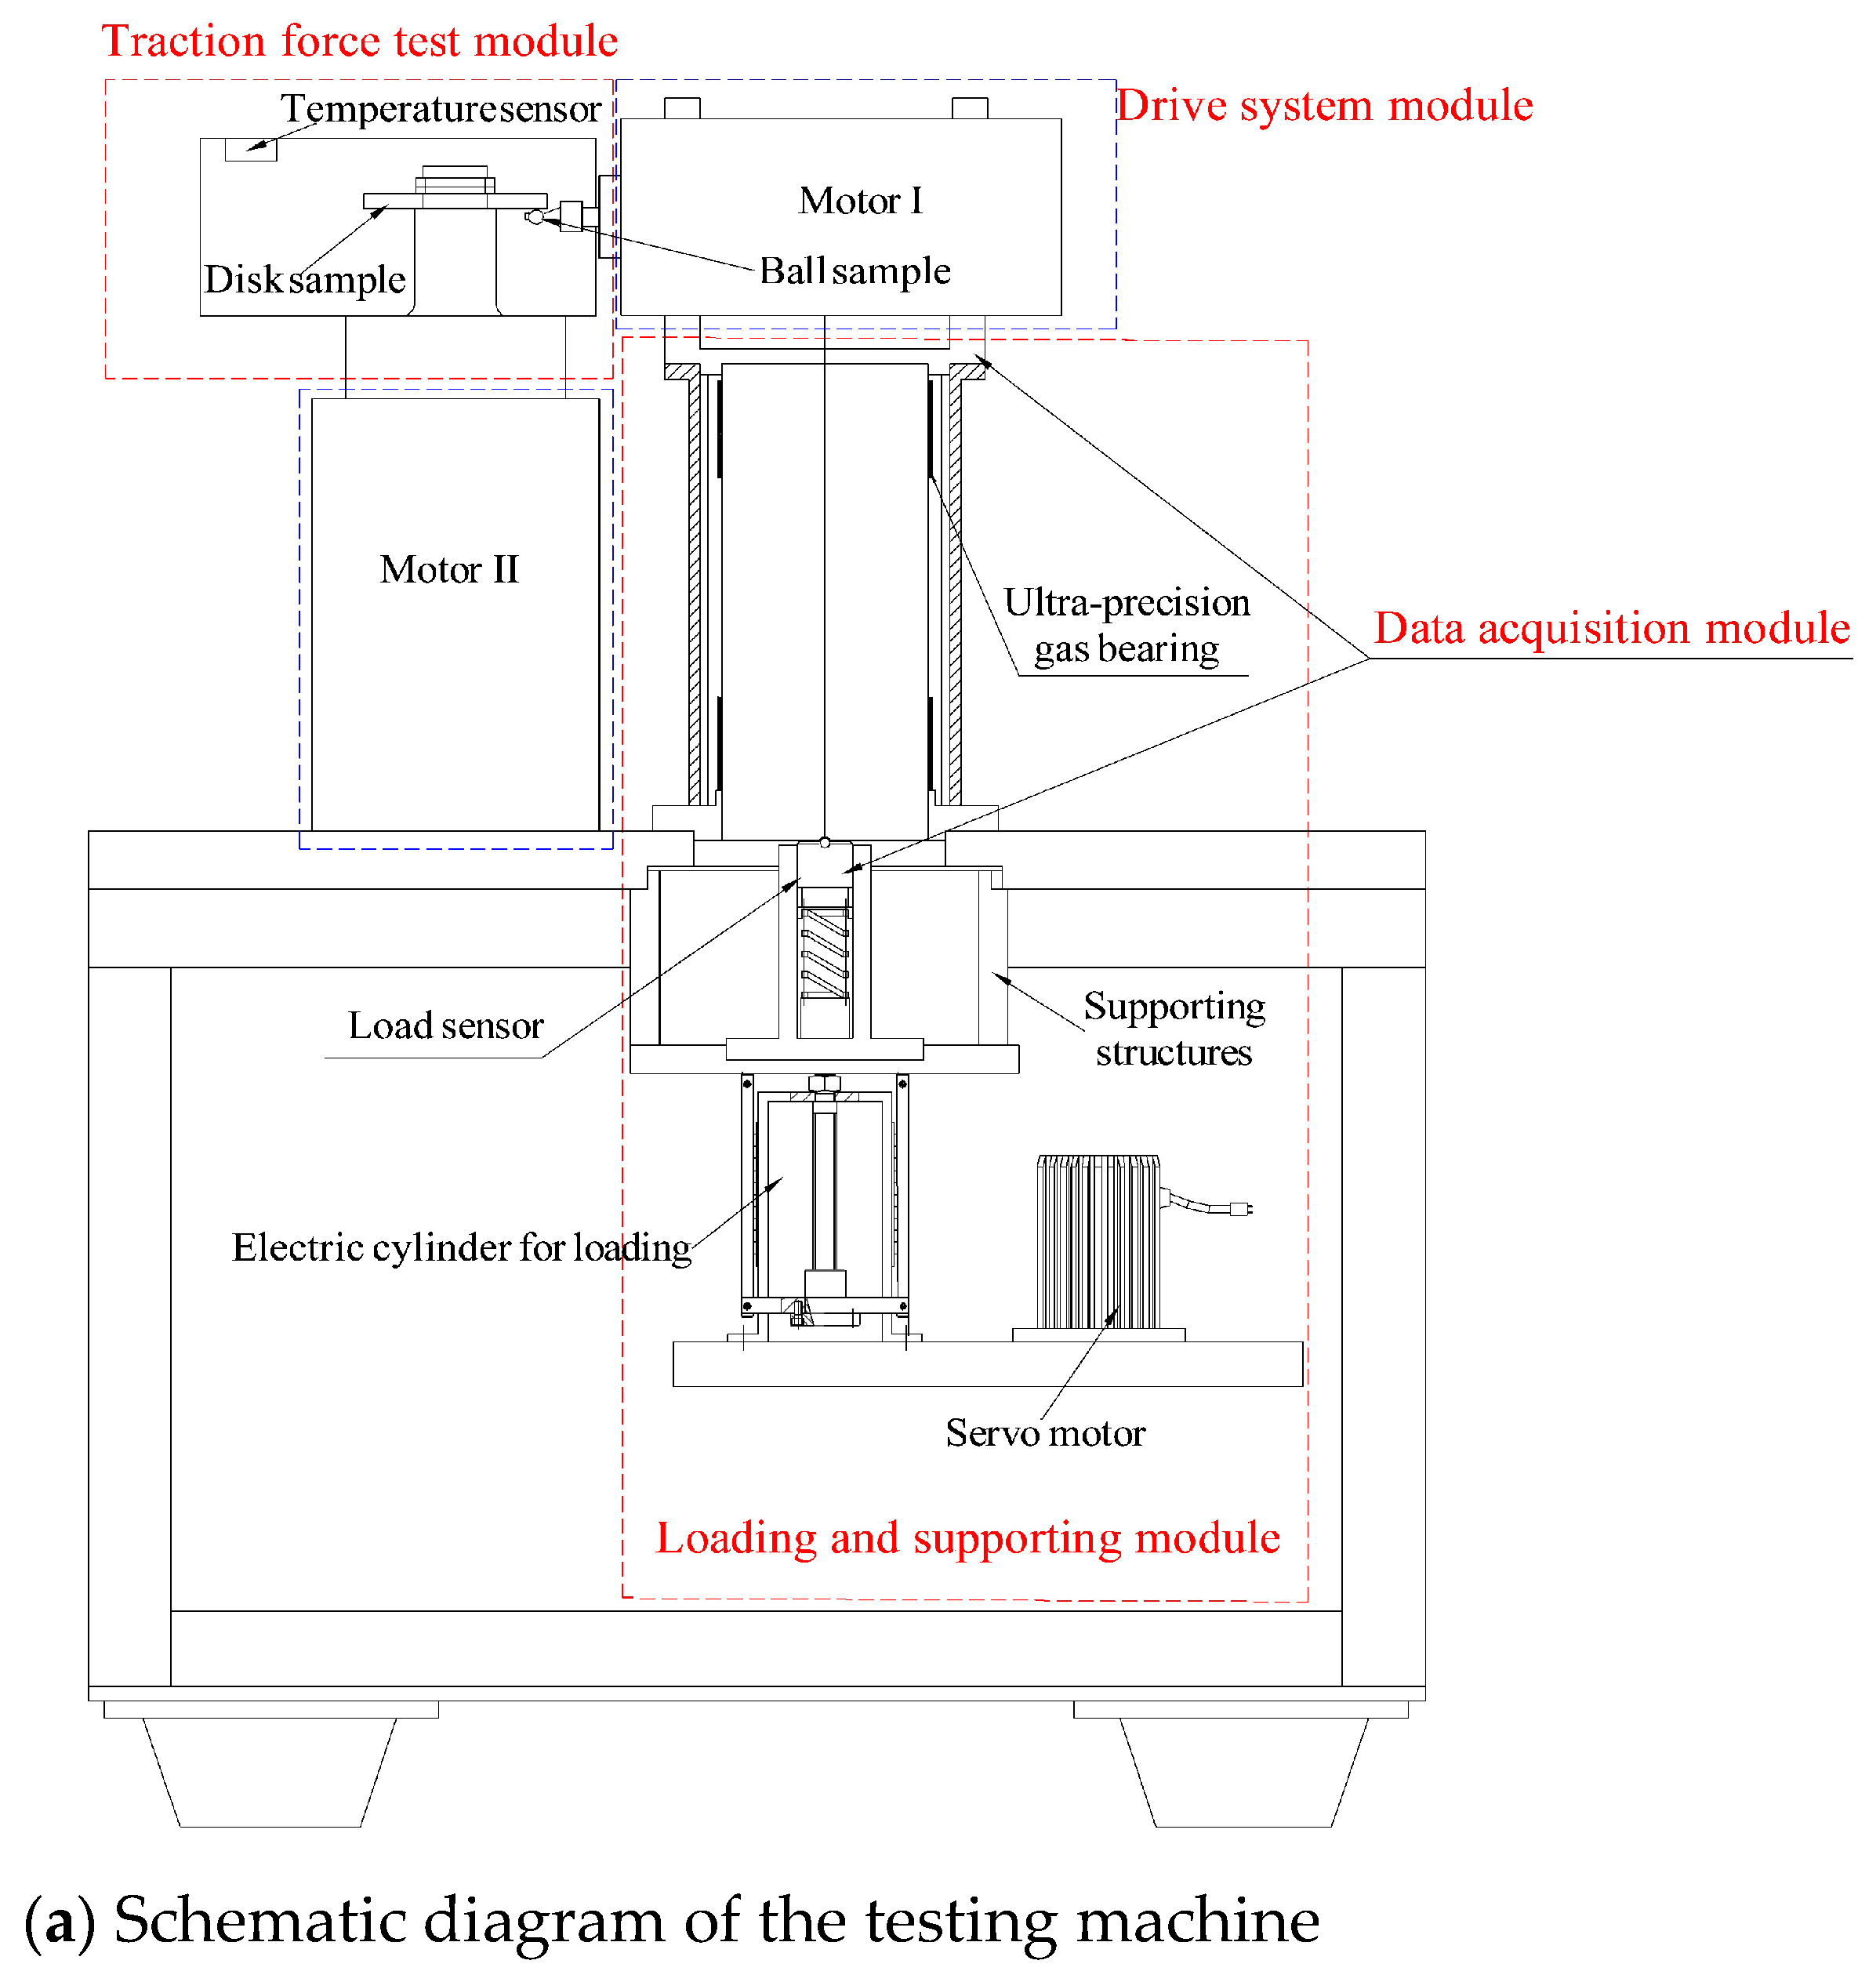
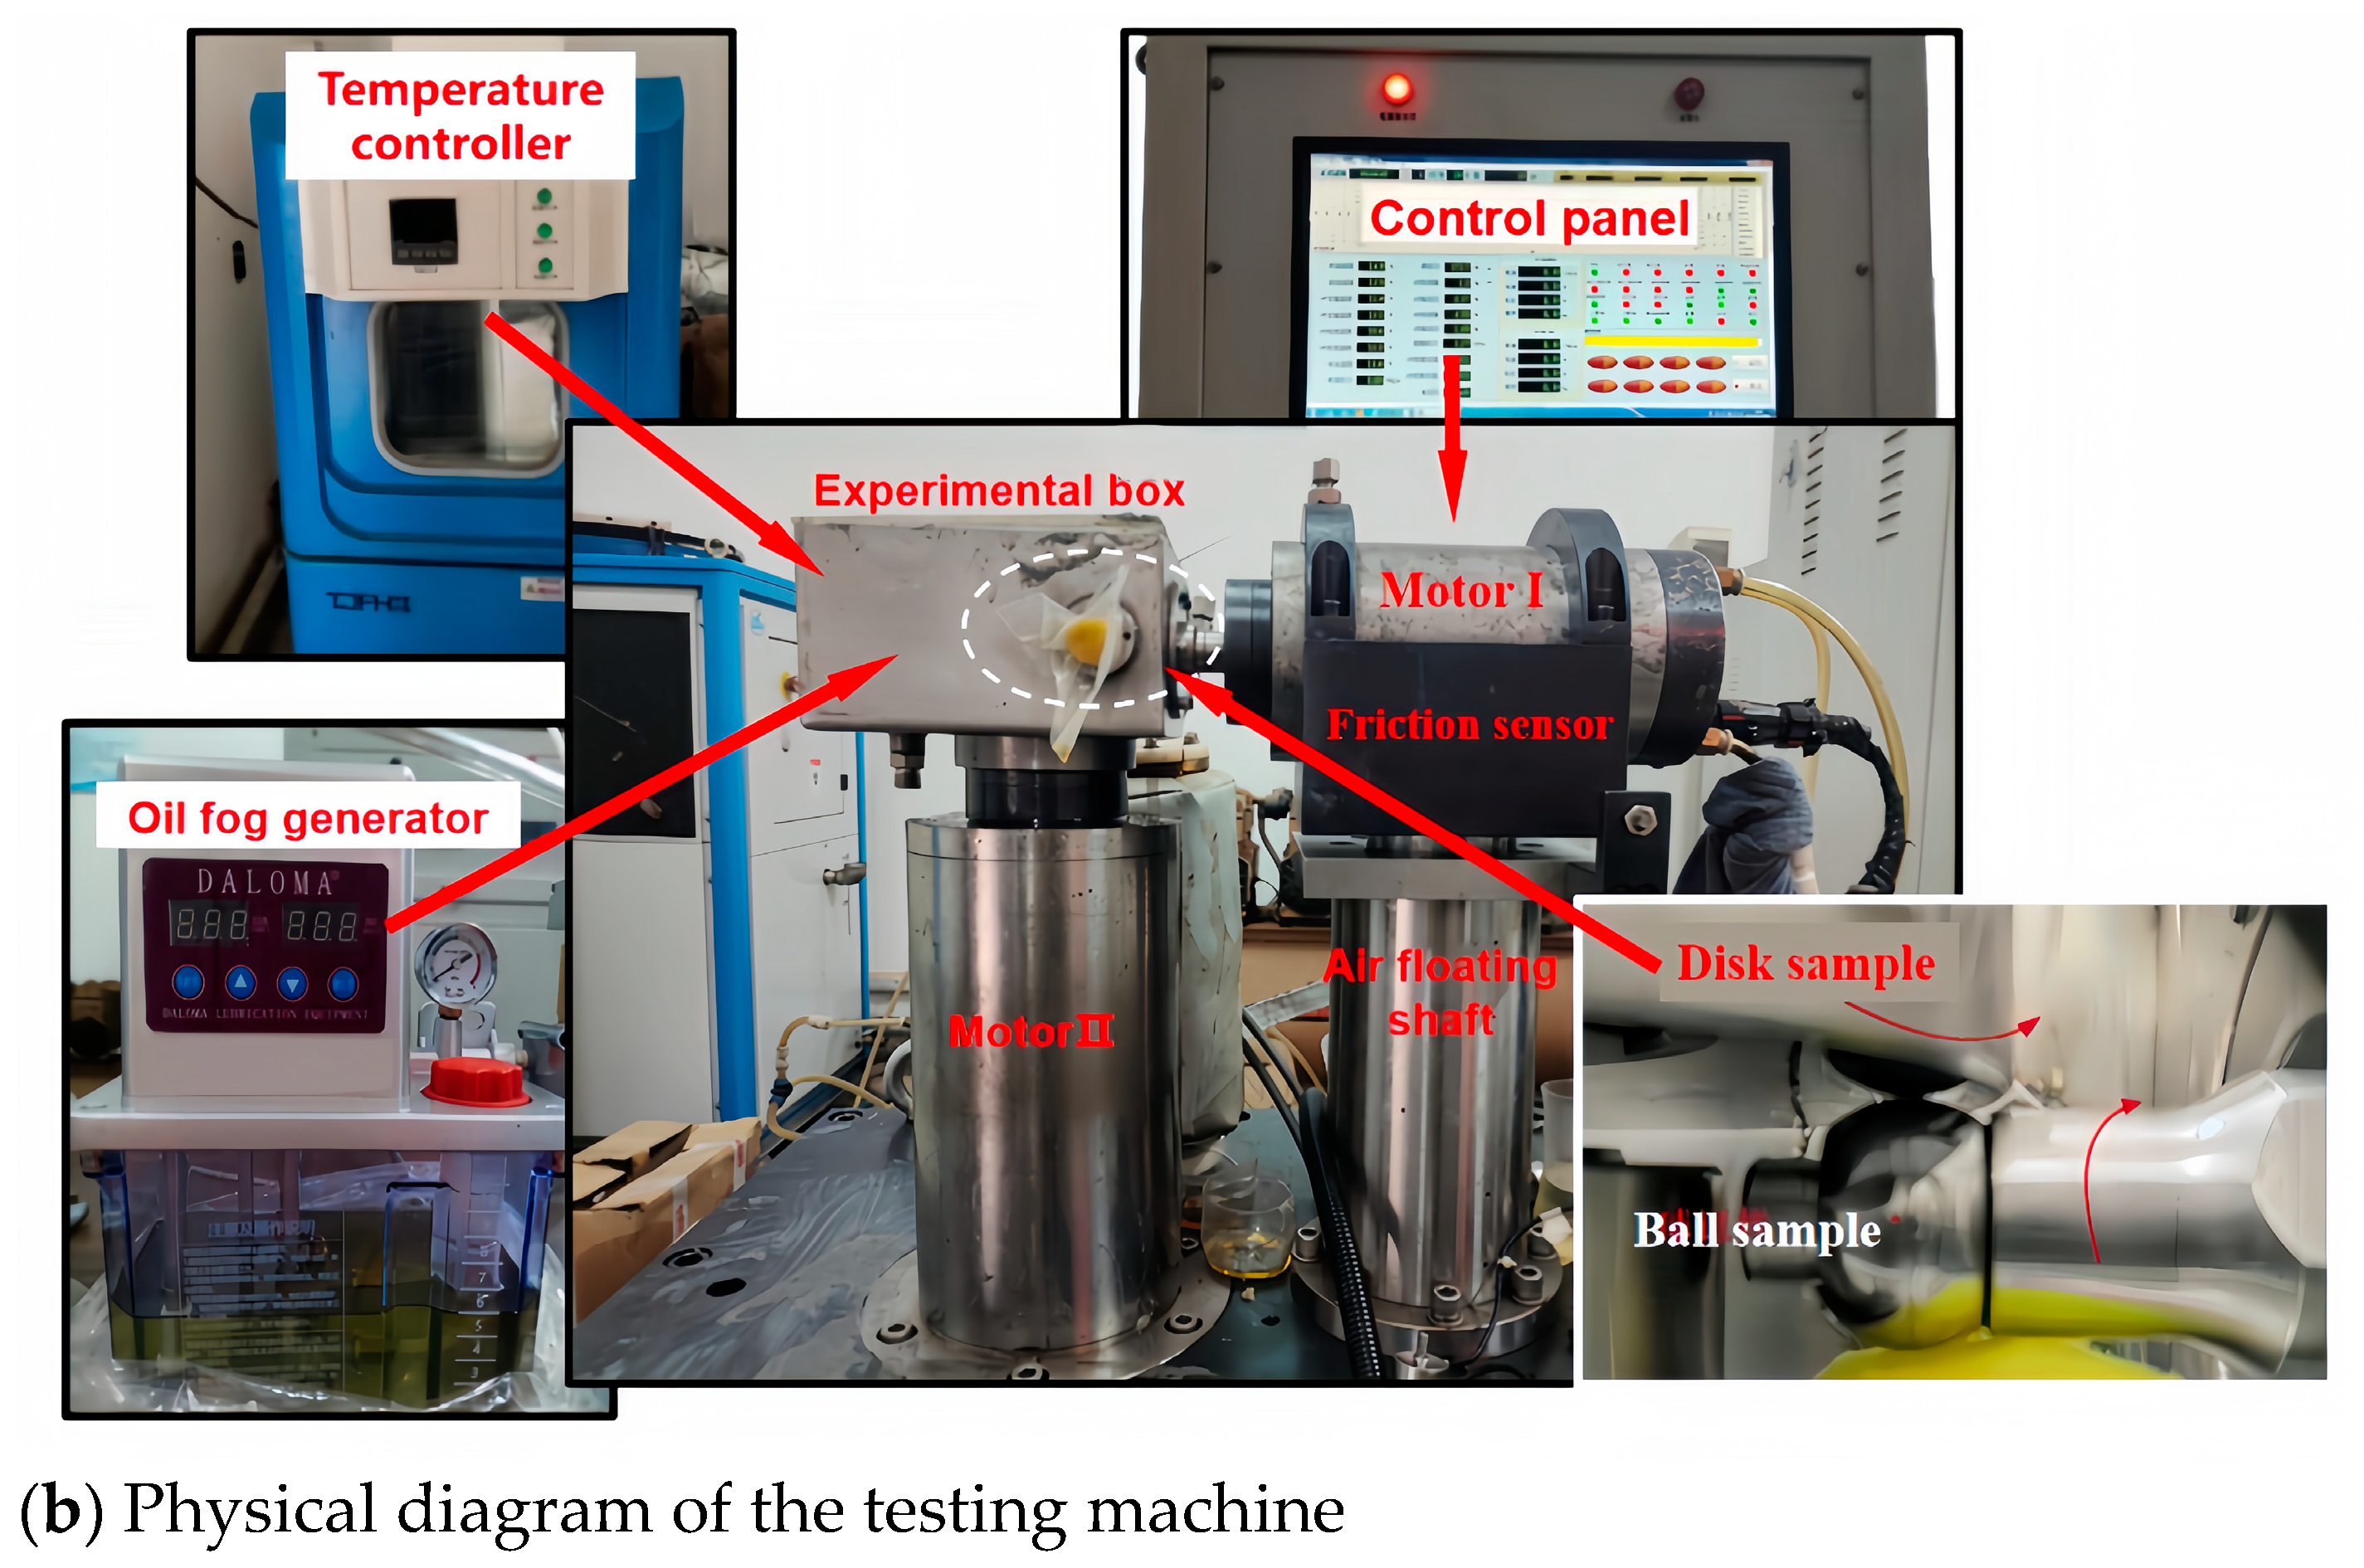
2.1. Test Apparatus

A custom-designed traction force testing machine utilizing oil–air lubrication was utilized in the experiment, with its structural details depicted in Figure 1a. The test machine is mainly composed of four modules, the traction force test module, the drive system module, the data acquisition module, and the loading support module.
The test specimens consisted of steel balls and steel disks, with the disk sample being driven by electric spindle II and the ball sample by electric spindle I. During the test, the disk sample and ball sample rotated at speeds u 1 and u 2 . The disk has a diameter of 90 mm, the ball has a diameter of 19.05 mm, and the horizontal distance from the origin to the center of the ball is 30 mm. The upward movement of the servo–electric cylinder makes the load sensor contact with the supporting steel ball and the air spindle core. When the air bearing shaft core was lifted, the electric spindle I above it was also lifted to drive the ball sample to contact the disk sample to achieve loading. The temperature controller avoids over-burning of the motor by circulating water. The oil fog generator tubing is inserted into the fixture through a small hole on the side of the test box to achieve oil and gas lubrication. The control panel can adjust the speed of spindle I and spindle II and the load between the ball and disk. Spindle I is supported by the air shaft below it because the air bearing has extremely low friction force. Therefore, when measuring the traction force, spindle I can keenly capture the change of force between the ball and disk specimen, resulting in a slight swing, pressing the sensors on both sides to achieve the collection of traction force.
The principle of the oil–air lubrication device is illustrated in Figure 1b. Before testing, the oil–air lubrication device was initiated, with the oil mist generator set to supply oil at intervals of 2 s. The test was conducted under two different oil supply conditions: when the oil supply quantity valve was set to 0.05 mL per time, the total oil supply amounted to 1.5 mL per minute; and when the valve was set to 0.2 mL per time, the total oil supply amounted to 6 mL per minute. The actual oil supply per minute from the quantitative valve was calculated using a measuring cup and a small electronic balance. The test commenced once a stable oil supply was achieved at the output end.

2.2. Test Scheme

The test utilized 5# spindle oil, which is ISO VG 5 according to ISO-3448-1992 [35]. The dynamic test for oil–air-lubricated towing was conducted at a room temperature of 25 °C. To account for the delay of the electric cylinder, the ball and disk speeds were adjusted to achieve a pure rolling state before loading. Subsequently, the speed of the ball and disk were automatically adjusted to reach the corresponding sliding state for testing upon loading.
The slip-to-roll ratio (The ratio of sliding speed to rolling speed) is calculated as follows. In oil–air lubrication traction force testing, the traction force F is measured at various slip–roll ratios (by altering the speed of the ball and disk) under a constant load W and entrainment speed u. The objective is to derive the test curve showing the variation of traction coefficient μ with the slip–roll ratio S . The equation of the entrainment speed and the slip-to-roll ratio is as follows:
u = ( u 1 + u 2 ) / 2
S = ( u 1 u 2 ) / u
in this equation, u is the entrainment speed, u1 is the speed of the disk, u2 is the speed of the ball, and S is the slip–roll ratio. The test range of the ball and disk traction force testing machine is shown in Table 1.
The test condition parameters in this paper included entrainment speeds of 2, 4, 6, and 8 m/s and nominal loads of 80 N, 100 N, 120 N, and 140 N, resulting in maximum Hertzian stresses of 1.25, 1.35, 1.45, and 1.55 GPa, respectively. A total of 32 sets of traction coefficient curves for the lubricating oil under different working conditions were measured with the slip–roll ratio S .

3. Oil–Air Lubrication Flow Field Simulation

In order to study the volume fraction of lubricating oil in the contact zone of the point contact ball and disk under different oil supply conditions, a simulation model of oil–gas lubrication fluid was established. The mathematical model of multiphase flow and governing equation is established and the boundary conditions of the physical model are set up.

3.1. Multiphase Flow Model and Governing Equation

The mass conservation and momentum conservation equations are the basic governing equations in fluid mechanics. According to the law of conservation of mass, the decrease in mass within a control volume as a result of density changes over time is equal to the mass of fluid leaving the volume during the same period. This equilibrium relationship leads to the derivation of the mass equation for fluid motion:
ρ t + ( ρ v x ) x + ( ρ v y ) y + ( ρ v z ) z = 0
in the equation, t is time; ρ is density; and vx, vy, and vz represent the speed in x, y, and z directions, respectively.
The momentum conservation equation should adhere to the principle that the total of external forces acting on the fluid equals the rate of change of velocity of individual particles. By this equilibrium, the momentum conservation equation can be expressed as follows:
( ρ v x ) t + ( ρ v x v r ) = ( p ) x + τ x x x + τ x y y + τ z x z + ρ f x + F
( ρ v y ) t + ( ρ v y v r ) = ( p ) y + τ x x x + τ x y y + τ z x z + ρ f y + F
( ρ v z ) t + ( ρ v z v r ) = ( p ) z + τ x x x + τ x y y + τ z x z + ρ f z + F
where fx, fy, and fz are unit mass force; p is the pressure on the element; τ I (i = xx, xy and xz) is the viscous stress; and F is the force due to the surface tension at the interface, calculated by Ref. [29].
F = σ o i l , a i r k α
where σ is the surface tension of oil, k is the curvature of the fluid surface, and α is the volume fraction of oil.
The characteristic length of the flow field L takes the diameter of the disk, and when the entrainment speed of the ball and disk is 2 m/s, the oil-only Reynolds number is 2076. Thus, the oil–air two-phase flow field cannot be treated as a laminar flow in the high-speed rotation. The k-e renormalization group (RNG) turbulence model is employed in this study. The RNG k-e model considers the influence of high strain rate, large curvature overflowing, and other factors, which can improve the accuracy under rotational flow.
Re = ρ v L / μ
where Re is the Reynolds number, μ is dynamic viscosity, L is the characteristic length of the flow field (the default is the disk diameter), and v is speed.
To observe the flow and distribution of oil and air clearly, the characteristics of the intersection interface of air–liquid two-phase flow are also observed. The study of the multiphase flow model in oil–air lubrication selects the VOF model, which is mainly suitable for the calculation of two or more fluids that do not fuse [35,36]. The VOF model is often used to analyze the flow characteristics of two phases of oil and air in pipelines, and can also calculate the volume fraction of each phase.
There are many cell grids in the VOF model. Assuming that the total volume fraction of each cell grid is 1, the ratio of the volume of each phase fluid flowing through the cell grid to the total volume of the cell grid can be defined as α , the phase volume fraction. There are three possibilities for a defined table of phase volume fractions:
α o i l = 0 No   oil   phase   in   the   grid   α o i l = 1 Only   the   oil   phase   is   in   the   grid   0 < α o i l < 1 Oil   and   other   phases   in   the   grid
The phase interface is tracked by solving one (or more) continuity equations containing the volume fraction of the phase. For the oil phase and air phase, the equation has the following form:
1 ρ o i l t ( α o i l ρ o i l ) + · ( α o i l ρ o i l v o i l ) = S α oil + m · air o i l m · o i l air
where v is oil flow velocity, m · air o i l is the mass transfer from air phase to oil phase, m · o i l air is the mass transfer from oil phase to air phase, and S α oil is the source entry and can define its value.

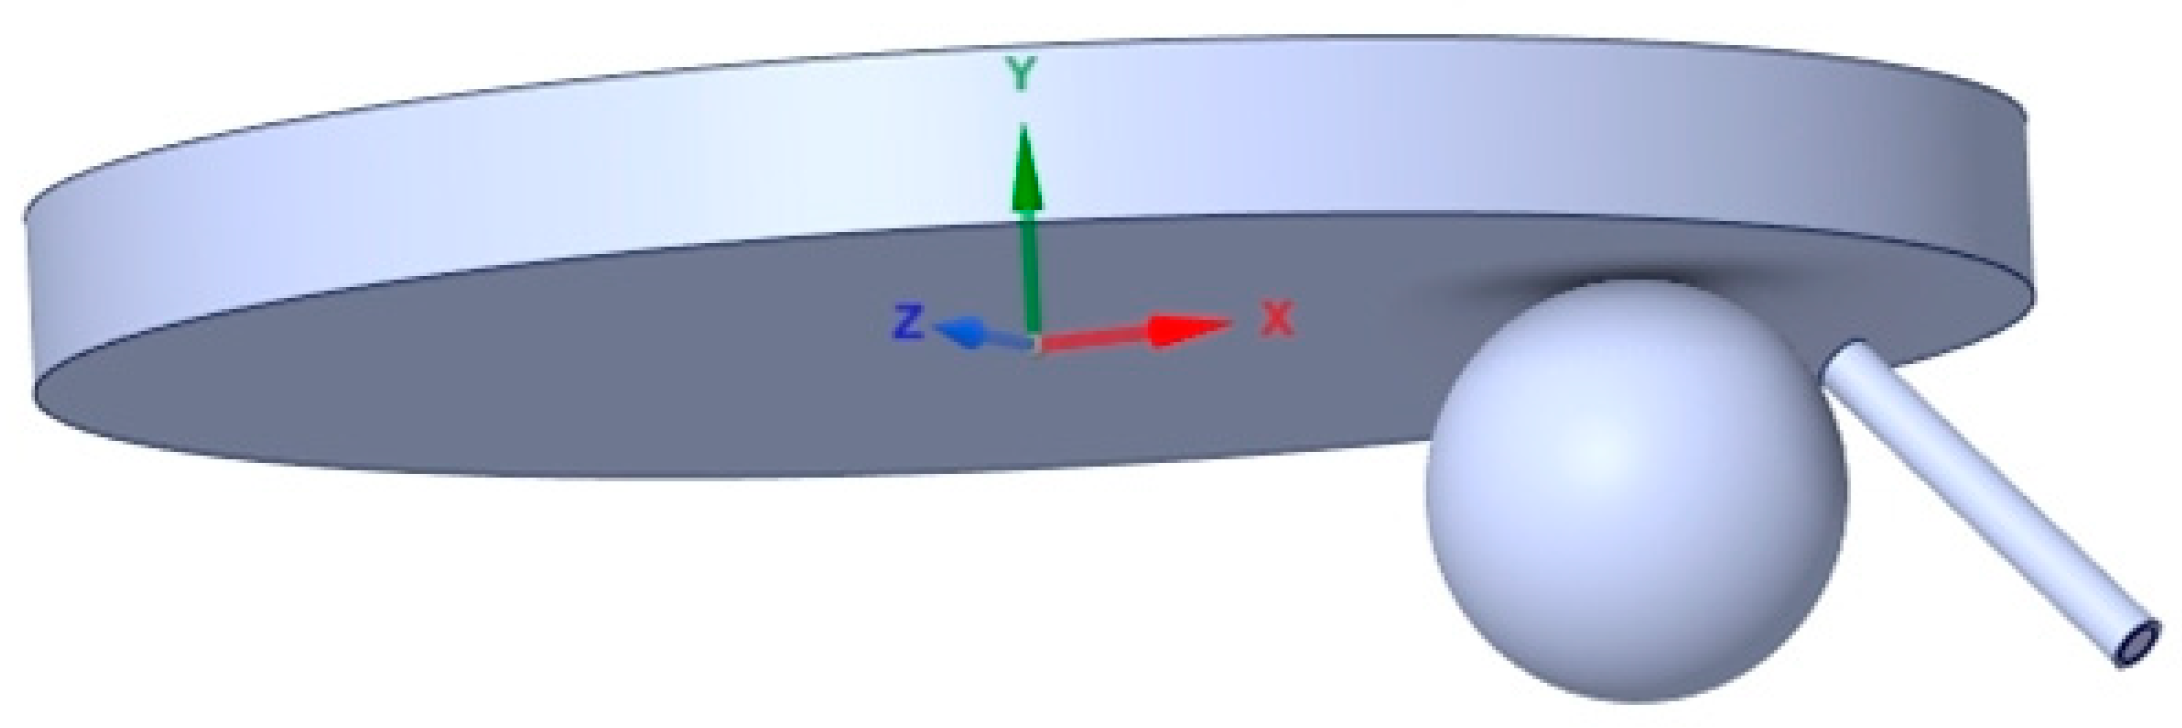
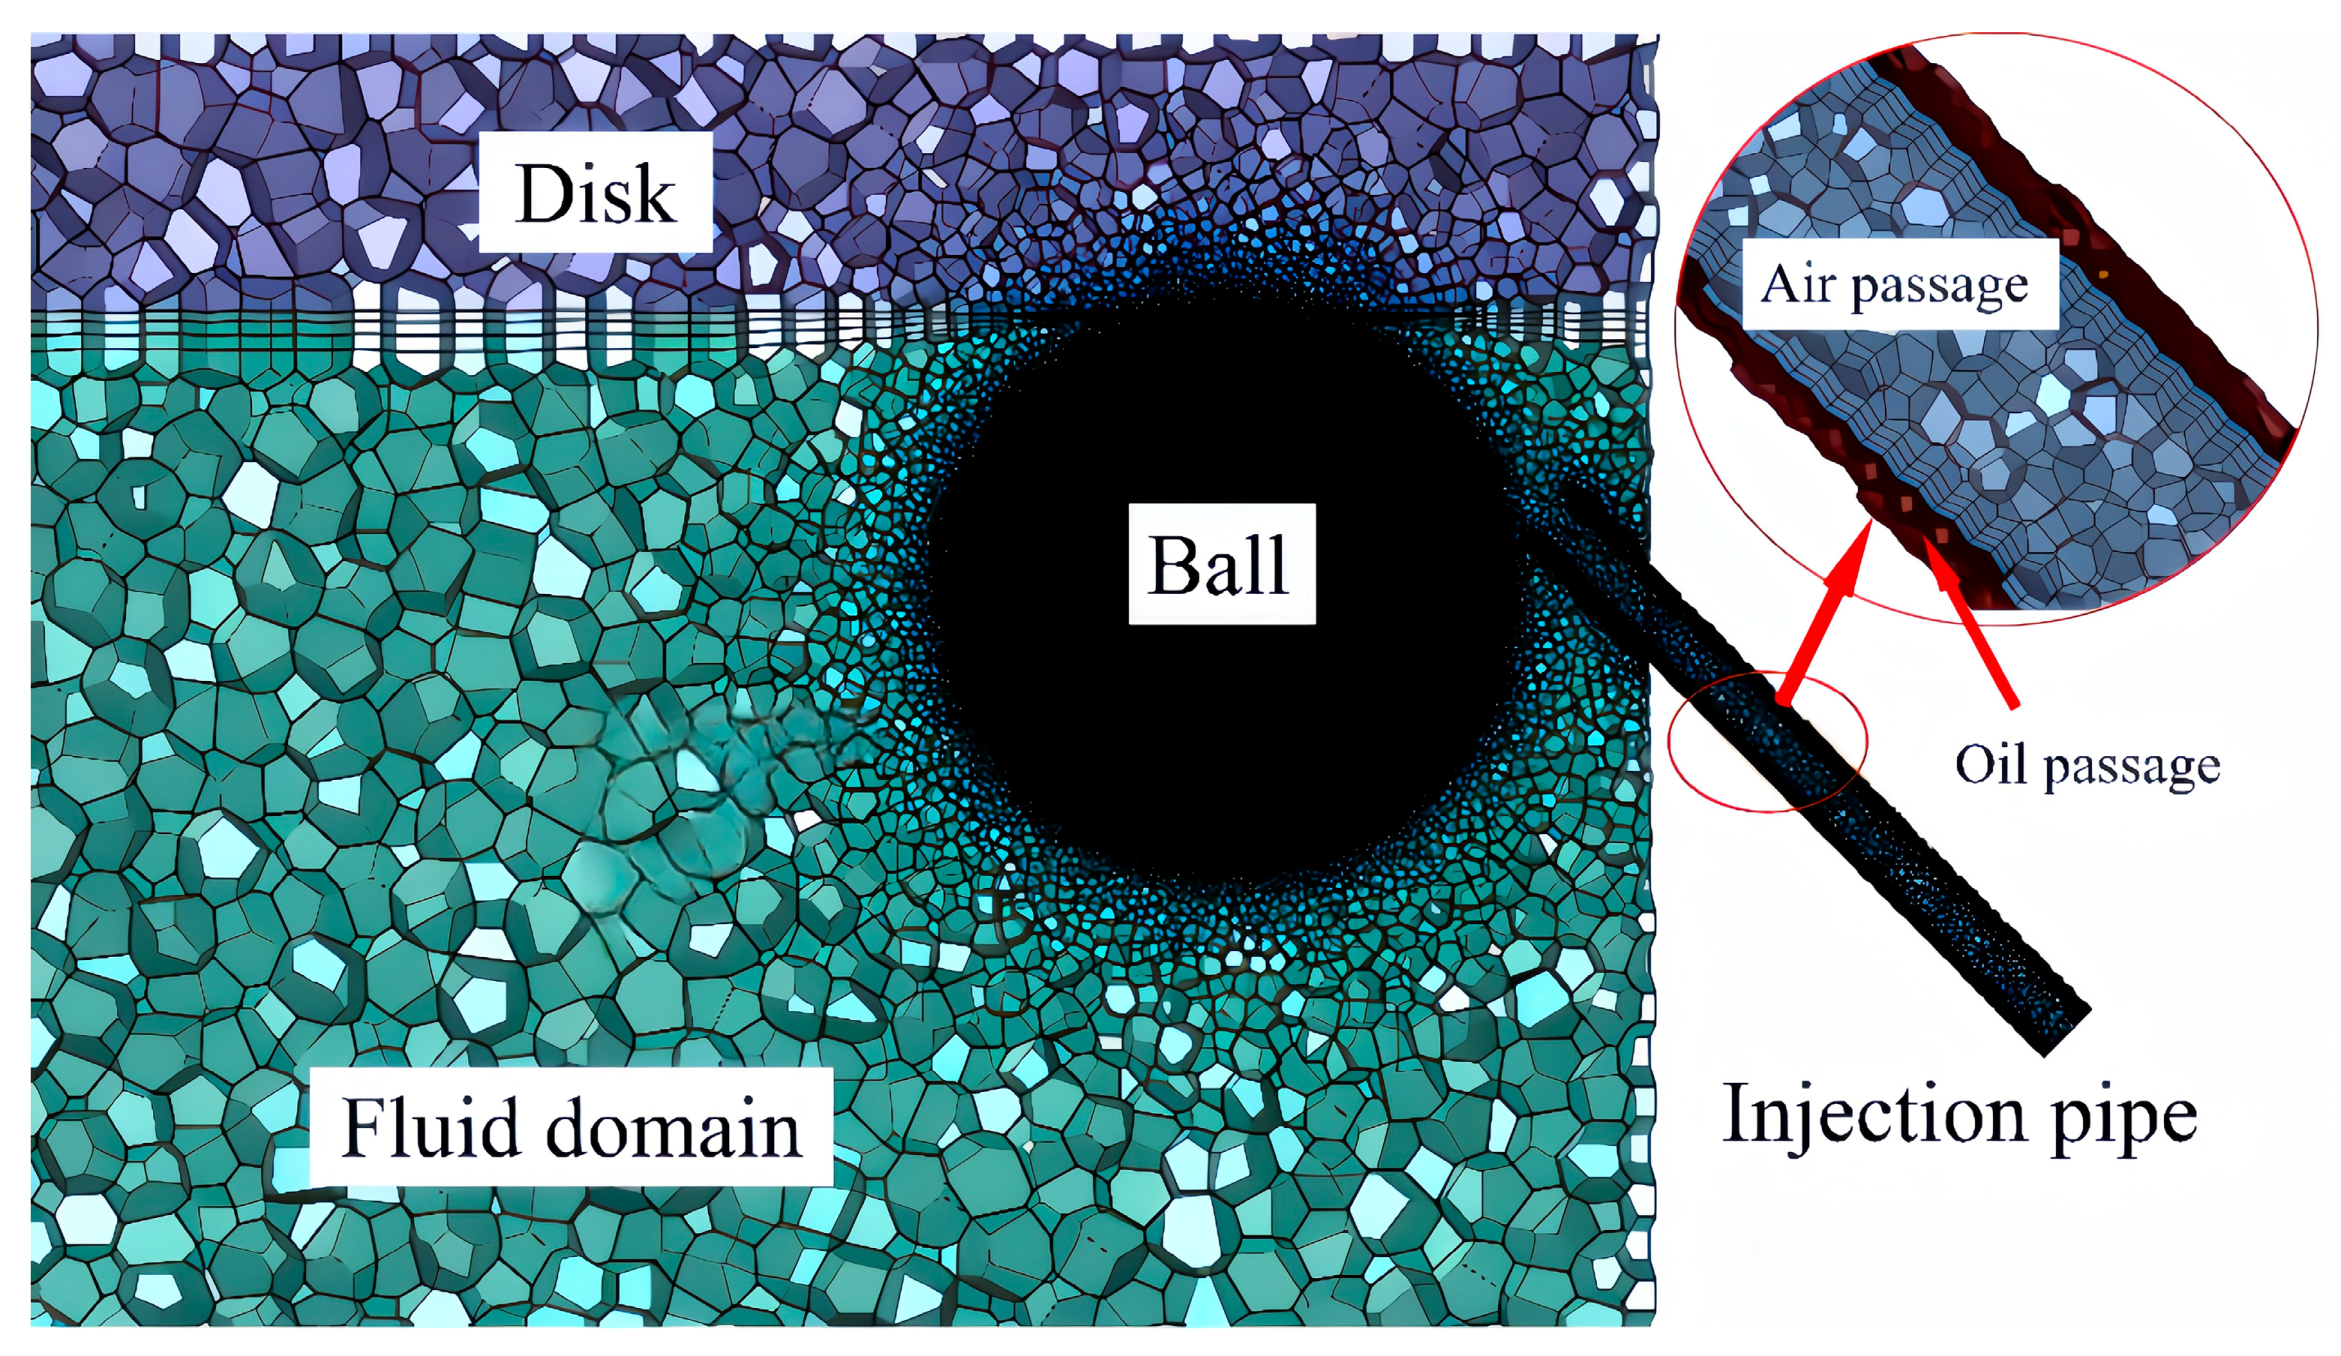
3.2. Oil–Air Lubrication Flow Field Calculation Domain Model

Figure 2 illustrates the schematic diagram of the point-contact oil–air lubrication model, consisting of a ball, a disk, and an oil–air nozzle. The disk has a diameter of 90 mm, the ball has a diameter of 19.05 mm, and the horizontal distance from the origin to the center of the ball is 30 mm. The disk rotates at speed n 1 in the Y direction around its center of rotation, while the ball rotates at speed n 2 in the X direction. The pipe diameter is 2.5 mm (the compressed air inlet diameter is 2 mm), with a length of 20 mm and a nozzle injection angle of 45°. In the modeling process, the actual existence of the oil film needs to be considered. A gap is left in the point contact area and encryption is used to build a more accurate and reliable simulation model. The mesh of the calculation model is shown in Figure 3.
In this model, the mesh is divided by Fluent Mesh, the mesh size of the ball is 0.02 mm, and the minimum mesh of the jet pipe is 0.05 mm. The mesh meets the requirements of simulation calculation. The injection parameters of the model (40 °C) are shown in Table 2, and adopt 5# spindle oil, which is ISO VG 5 according to ISO-3448-1992 [35].
The air phase is designated as the primary phase, while the lubricating oil phase is considered the secondary phase. The air outlet boundary condition is defined as a pressure outlet with a pressure value of 1.01 × 10⁵ Pa. The numerical model is solved using the PISO method.

4. Traction Test and Simulation Result

The results of the traction experiment and fluid simulation under two different oil supply conditions are as follows.

4.1. The Quantitative Valve Is 0.05 mL/Time

The experimental results show that, when the quantitative valve is 0.05 mL/time, the traction coefficient changes with the slip–roll ratio under different loads and entrainment speeds, as shown in Figure 4.
It can be seen from the Figure 4b experimental results and Figure 5 simulation results that under the same oil supply and load, the oil phase volume fraction and traction coefficient decrease with the increase of entrainment velocity. According to the oil film thickness equation, when the entrainment speed increases, the oil film thickness will increase, and the traction coefficient will decrease.
It can be seen from Figure 5 that the oil phase volume fraction increases with the increase of entrainment velocity. When the entrainment speed increases from 2 to 6 m/s, the oil phase volume fraction increases greatly and approximately linearly, while when the entrainment speed increases from 6 to 8 m/s, the increase amplitude becomes slow. This is because the speed of the ball and disk is very high when the entrainment speed is increased from 6 to 8 m/s. Due to the fixed amount of oil supply, the speed of the ball and disk increases, resulting in the lubricating oil moving to both sides of the injection center under the action of the speed of the ball and disk. The lubricating oil may be taken away by the high speed of the ball, resulting in a slow increase in the volume fraction of the oil phase.

4.2. The Quantitative Valve Is 0.2 mL/Time

The experimental results show that, when the quantitative valve is 0.2 mL/time, the traction coefficient changes with the slip–roll ratio under different loads and entrainment speeds, as shown in Figure 6.
As can be seen from Figure 6a, in the initial stage, with the increase of the slip–roll ratio, the greater the load, the greater the increase rate of the friction coefficient. Then, the friction coefficient increases slowly and tends to be stable with the increase of the slip–roll ratio. The greater the load, the faster it stabilizes.
It can be seen from Figure 4 and Figure 6 that the friction curves obtained under different working conditions have similar characteristics. When the slip–roll ratio is 0 (pure rolling state between the ball and disk samples), the friction coefficient is 0. In the range of 0~0.05, the friction coefficient increases linearly with the increase of the slip–roll ratio. When the slip–roll ratio is greater than 0.05, the friction coefficient increases slowly with the increase of the slip–roll ratio, and there is a nonlinear relationship between the two. At this time, the lubricating oil shows obvious non-Newtonian fluid characteristics. As the slip–roll ratio continues to increase, the friction curve in Figure 4 increases slowly and gradually becomes stable, while the tail of the friction curve in Figure 6 decreases slightly.
As can be seen from Figure 7, with the increase of entrainment velocity, the difference in oil phase distribution is relatively small. This is because the amount of oil and the entrainment speed are relatively large, and the lubricating oil is sprayed from the outlet of the pipeline in the form of small oil droplets to the lubrication point area, and the lubricating oil film is evenly distributed on the surface of the ball and disk. When the entrainment speed increases from 4 to 8 m/s, the lubricating oil film formed on the surface of the ball and disk becomes more and more uniform, so the difference in oil phase distribution is relatively small.

4.3. Comparison between Experimental Results and Simulation Results

The friction coefficient curves of 1.5 mL/min and 6 mL/min oil supply conditions under the same load and entrainment speed were compared through the ball and disk traction test, as shown in Figure 8.
In the experimental data, at a small slip–roll ratio, the difference between 1.5 mL/time and 6 mL/time is not very large, while at a large slip–roll ratio (0.1~0.2), the difference between 1.5 mL/time and 6 mL/time is large. In order to explore the relationship between the volume fraction of lubricating oil on the spherical surface of the contact area of the ball and disk under different entrainment speeds and the traction coefficient, the slip–roll ratio was taken as 0.1 and a load of 100 N in the simulation data was taken, as shown in Figure 9.
As illustrated in Figure 8, when other working conditions remain constant, the traction coefficient gradually decreases as the entrainment speed increases from 2 to 8 m/s. Concurrently, in Figure 9, the volume fraction of lubricating oil on the spherical surface of the contact area increases. Notably, the traction coefficient and the volume fraction of oil on the surface of the contact area exhibit opposing trends in their variations. At a low oil supply, the distribution of lubricating oil on the surface of the ball is minimal; however, as the oil supply increases, the volume fraction of lubricating oil on the surface of the ball becomes significantly larger. With an increase in oil supply within the point contact inlet area, the oil film shape improves, resulting in a reduction of the average friction coefficient by approximately 0.02. This increase in oil supply positively influences lubrication.

5. Analysis of the Four-Parameter Exponential Model

The expression of the four-parameter exponential model is as follows:
μ = A + B S e C S + D
The coefficients A, B, C, and D are only related to the dimensionless load parameter ( W ¯ ) and the dimensionless enshrinement velocity parameter ( u ¯ ), and have an approximate exponential relationship:
W ¯ = W E * R 2 u ¯ = η 0 u E * R A = A 0 W ¯ A 1 u ¯ A 2 B = B 0 W ¯ B 1 u ¯ B 2 C = C 0 W ¯ C 1 u ¯ C 2 D = D 0 W ¯ D 1 u ¯ D 2
where w is the load, u is the entrainment velocity, E * is the equivalent elastic modulus, and R is the equivalent radius of curvature, whose value is 9.525 mm because the test specimens are a ball and a disk, and the disk is flat without a curved surface. The equivalent radius of curvature at this condition is the radius of the ball specimen.
The fitting values of A, B, C, and D under different working conditions are calculated by the least square method and are listed in Table 3.
As can be seen from the table, the fitting results show that the maximum residual standard deviation is 0.0009, and the correlation coefficients are basically above 99%. The results show that the model has a good fitting effect on the test data and can accurately reflect the relationship between the drag coefficient and the slip–roll ratio.
The model is obtained by analyzing the trend of the lubricating oil traction characteristic curve from a purely mathematical point of view. When the slip–roll ratio S is small, e−CS is approximately 1, and the model expression is approximately a first-order function. The model expression’s nonlinearity increases with the slip ratio S. Figure 10 shows the curve fitting the oil traction coefficient by using the four-parameter exponential model.
As can be seen from Figure 10, there is a good agreement between the theoretical predicted value and the test value of the friction coefficient of spindle oil by using the four-parameter exponential model, and the fitting accuracy of the test data is high, which is suitable for engineering applications.

6. Conclusions

In this paper, the lubrication characteristics of the point contact state under oil–gas lubrication conditions were studied. Firstly, the point contact traction force under two different injection rates was obtained through the ball and disk traction experiment, and the volume fraction of lubricating oil in the point contact area was obtained through flow field simulation analysis, which corresponds to the results obtained by the traction experiment. Finally, the traction curve was obtained by fitting the four-parameter exponential model. The main findings are as follows:
(1)
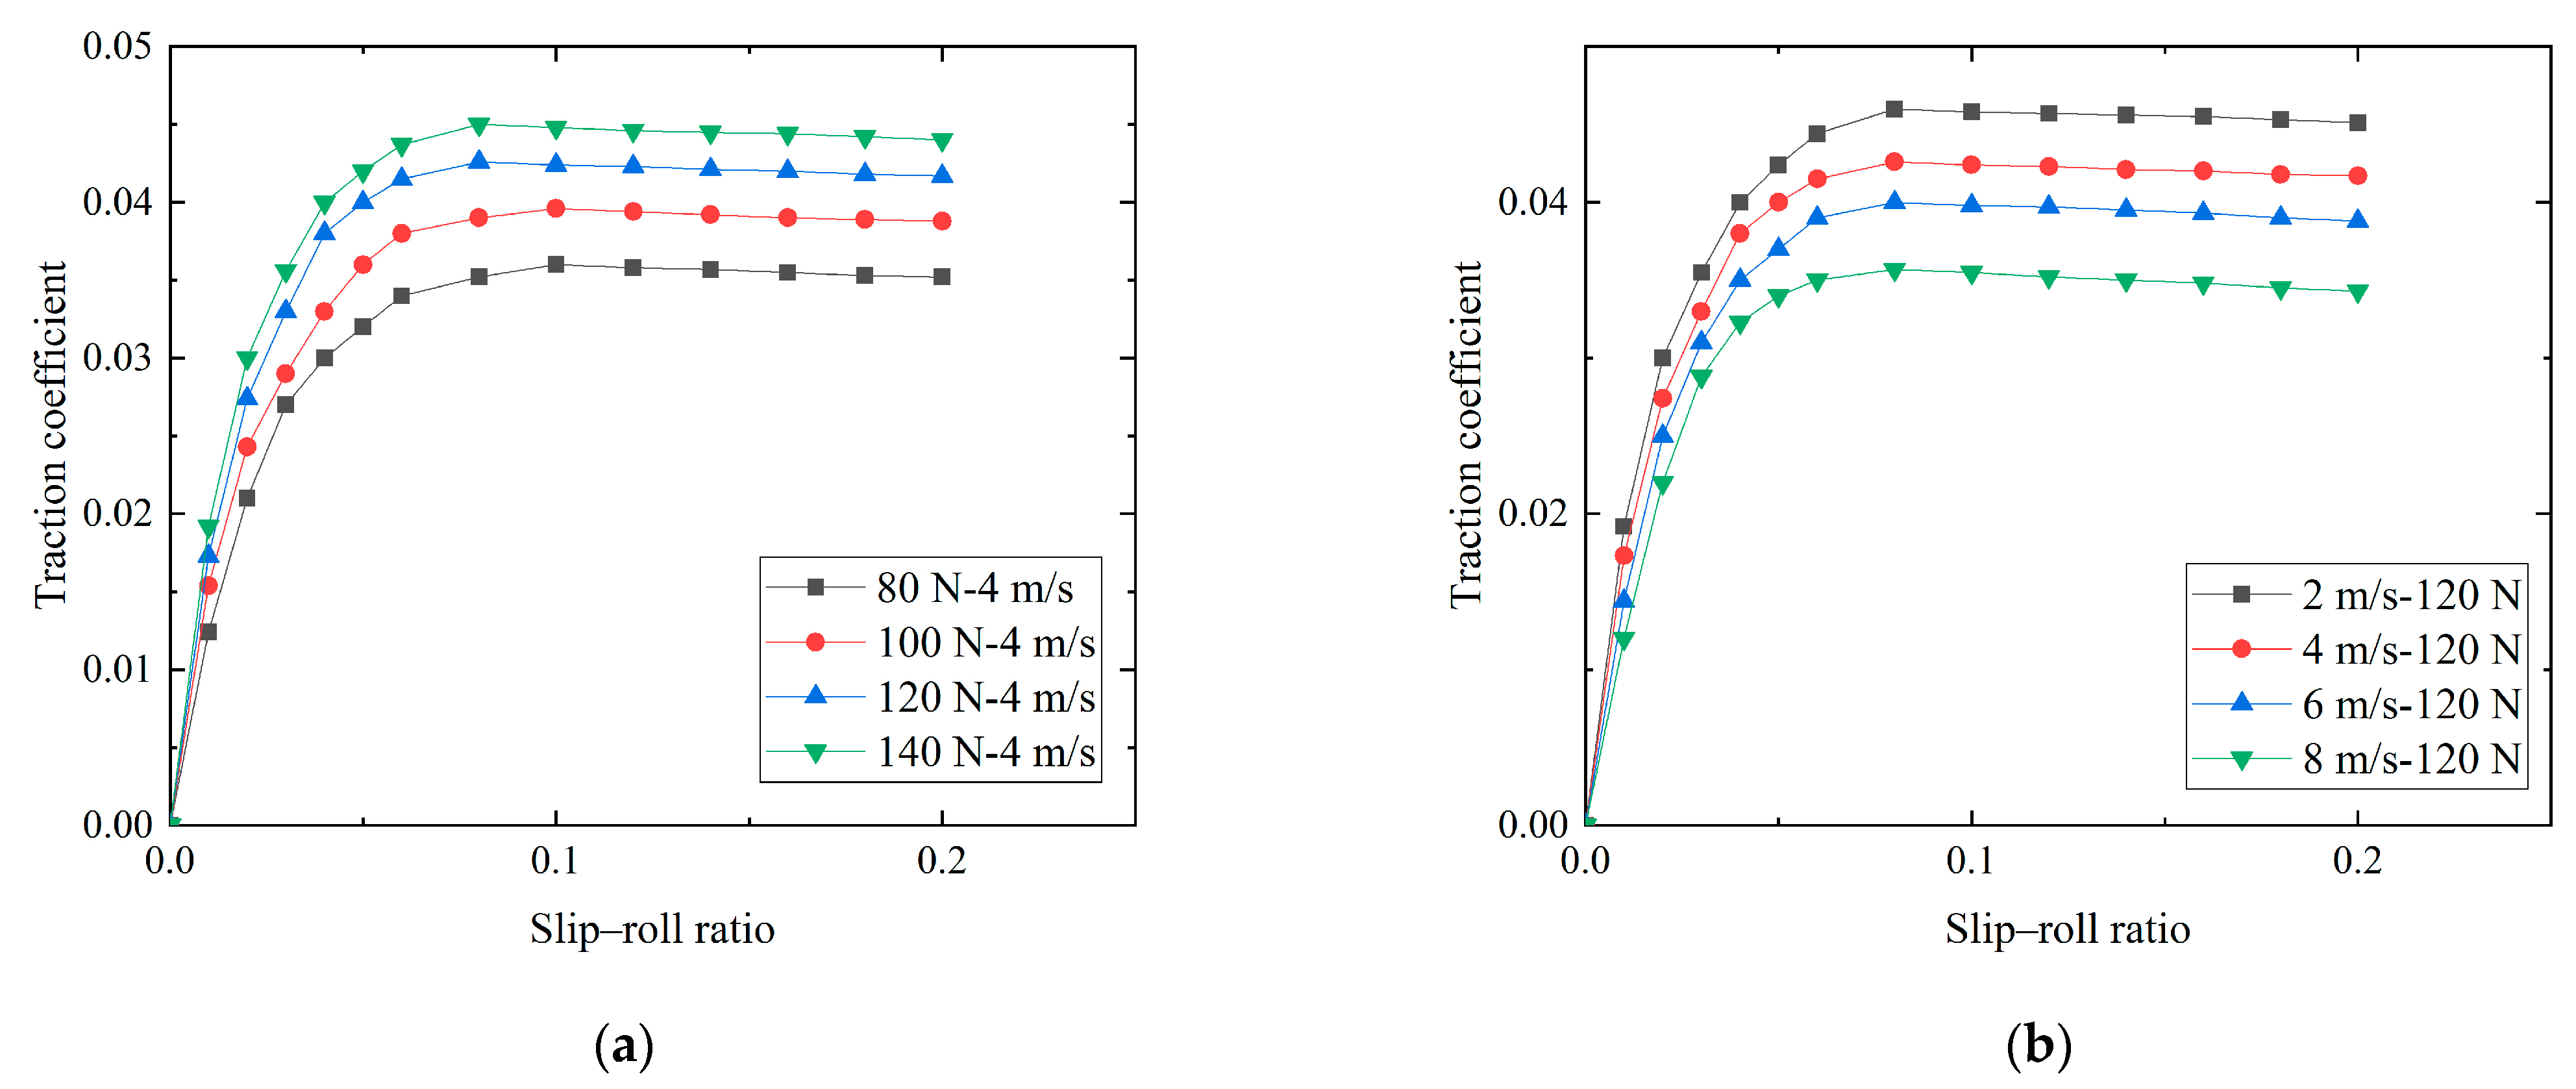
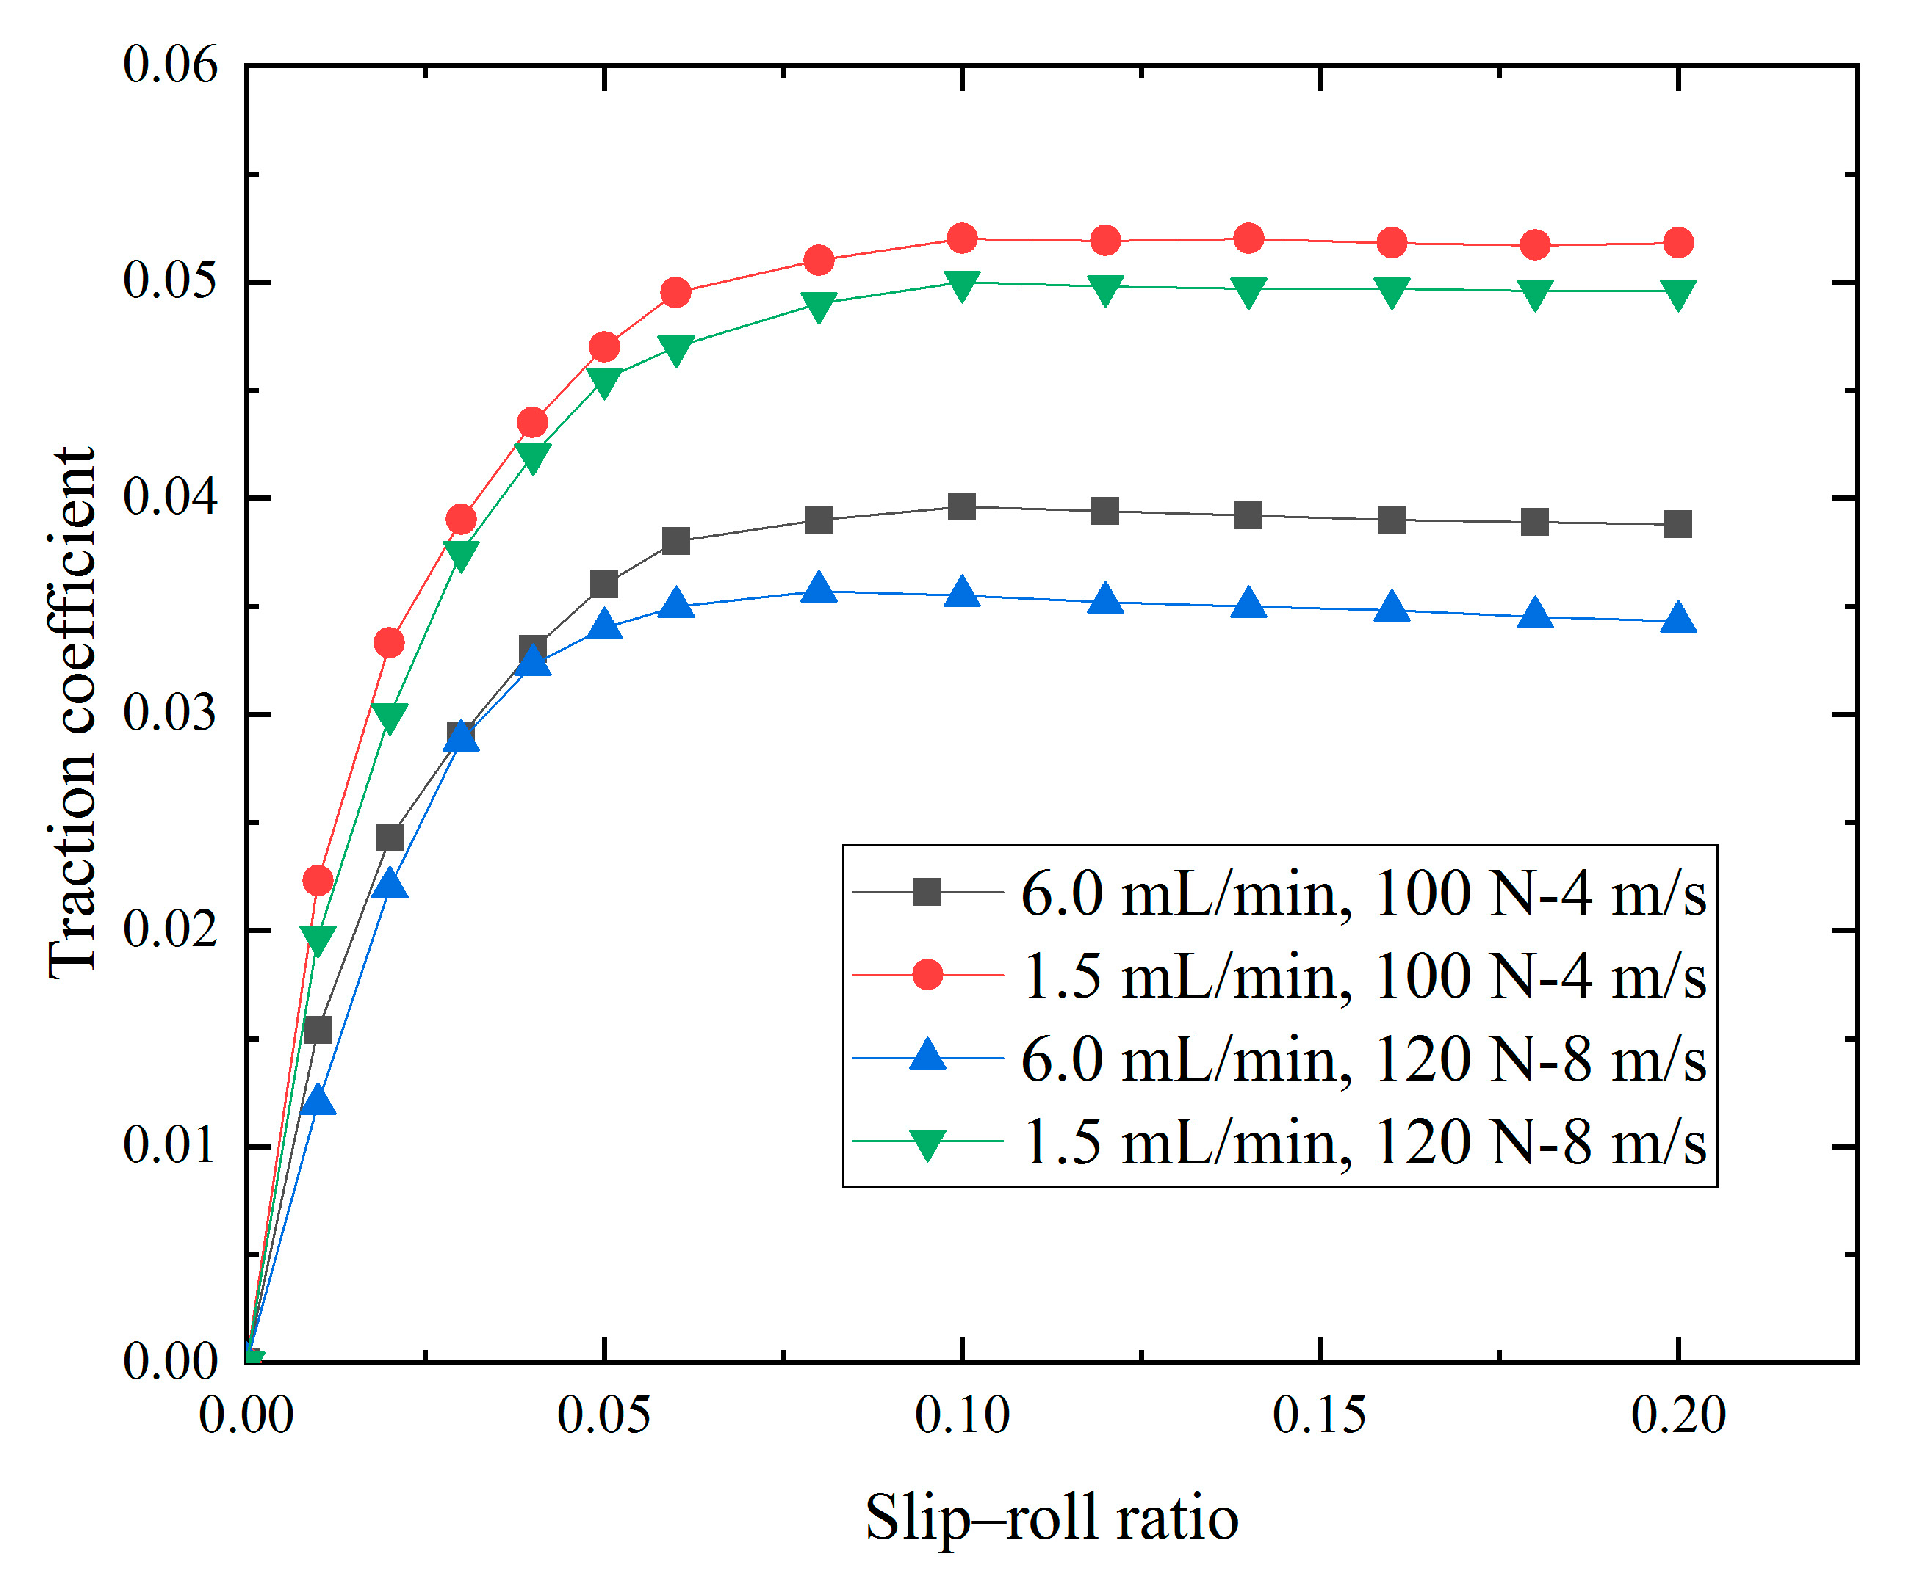
The traction characteristics of oil–air lubrication were tested under different quantitative valve working conditions of 1.5 mL/min and 6 mL/min using the traction power testing machine. The curve of the traction coefficient varying with the slip–roll ratio was obtained. The experimental results show that under the condition of 12 m/s air-speed, the traction coefficient of 6 mL/min oil supply is smaller than that of 1.5 mL/min oil supply. When the entrainment speed is constant, the traction coefficient increases with the increase of the load. When the load is constant, the traction coefficient decreases with the increase of entrainment speed.
(2)
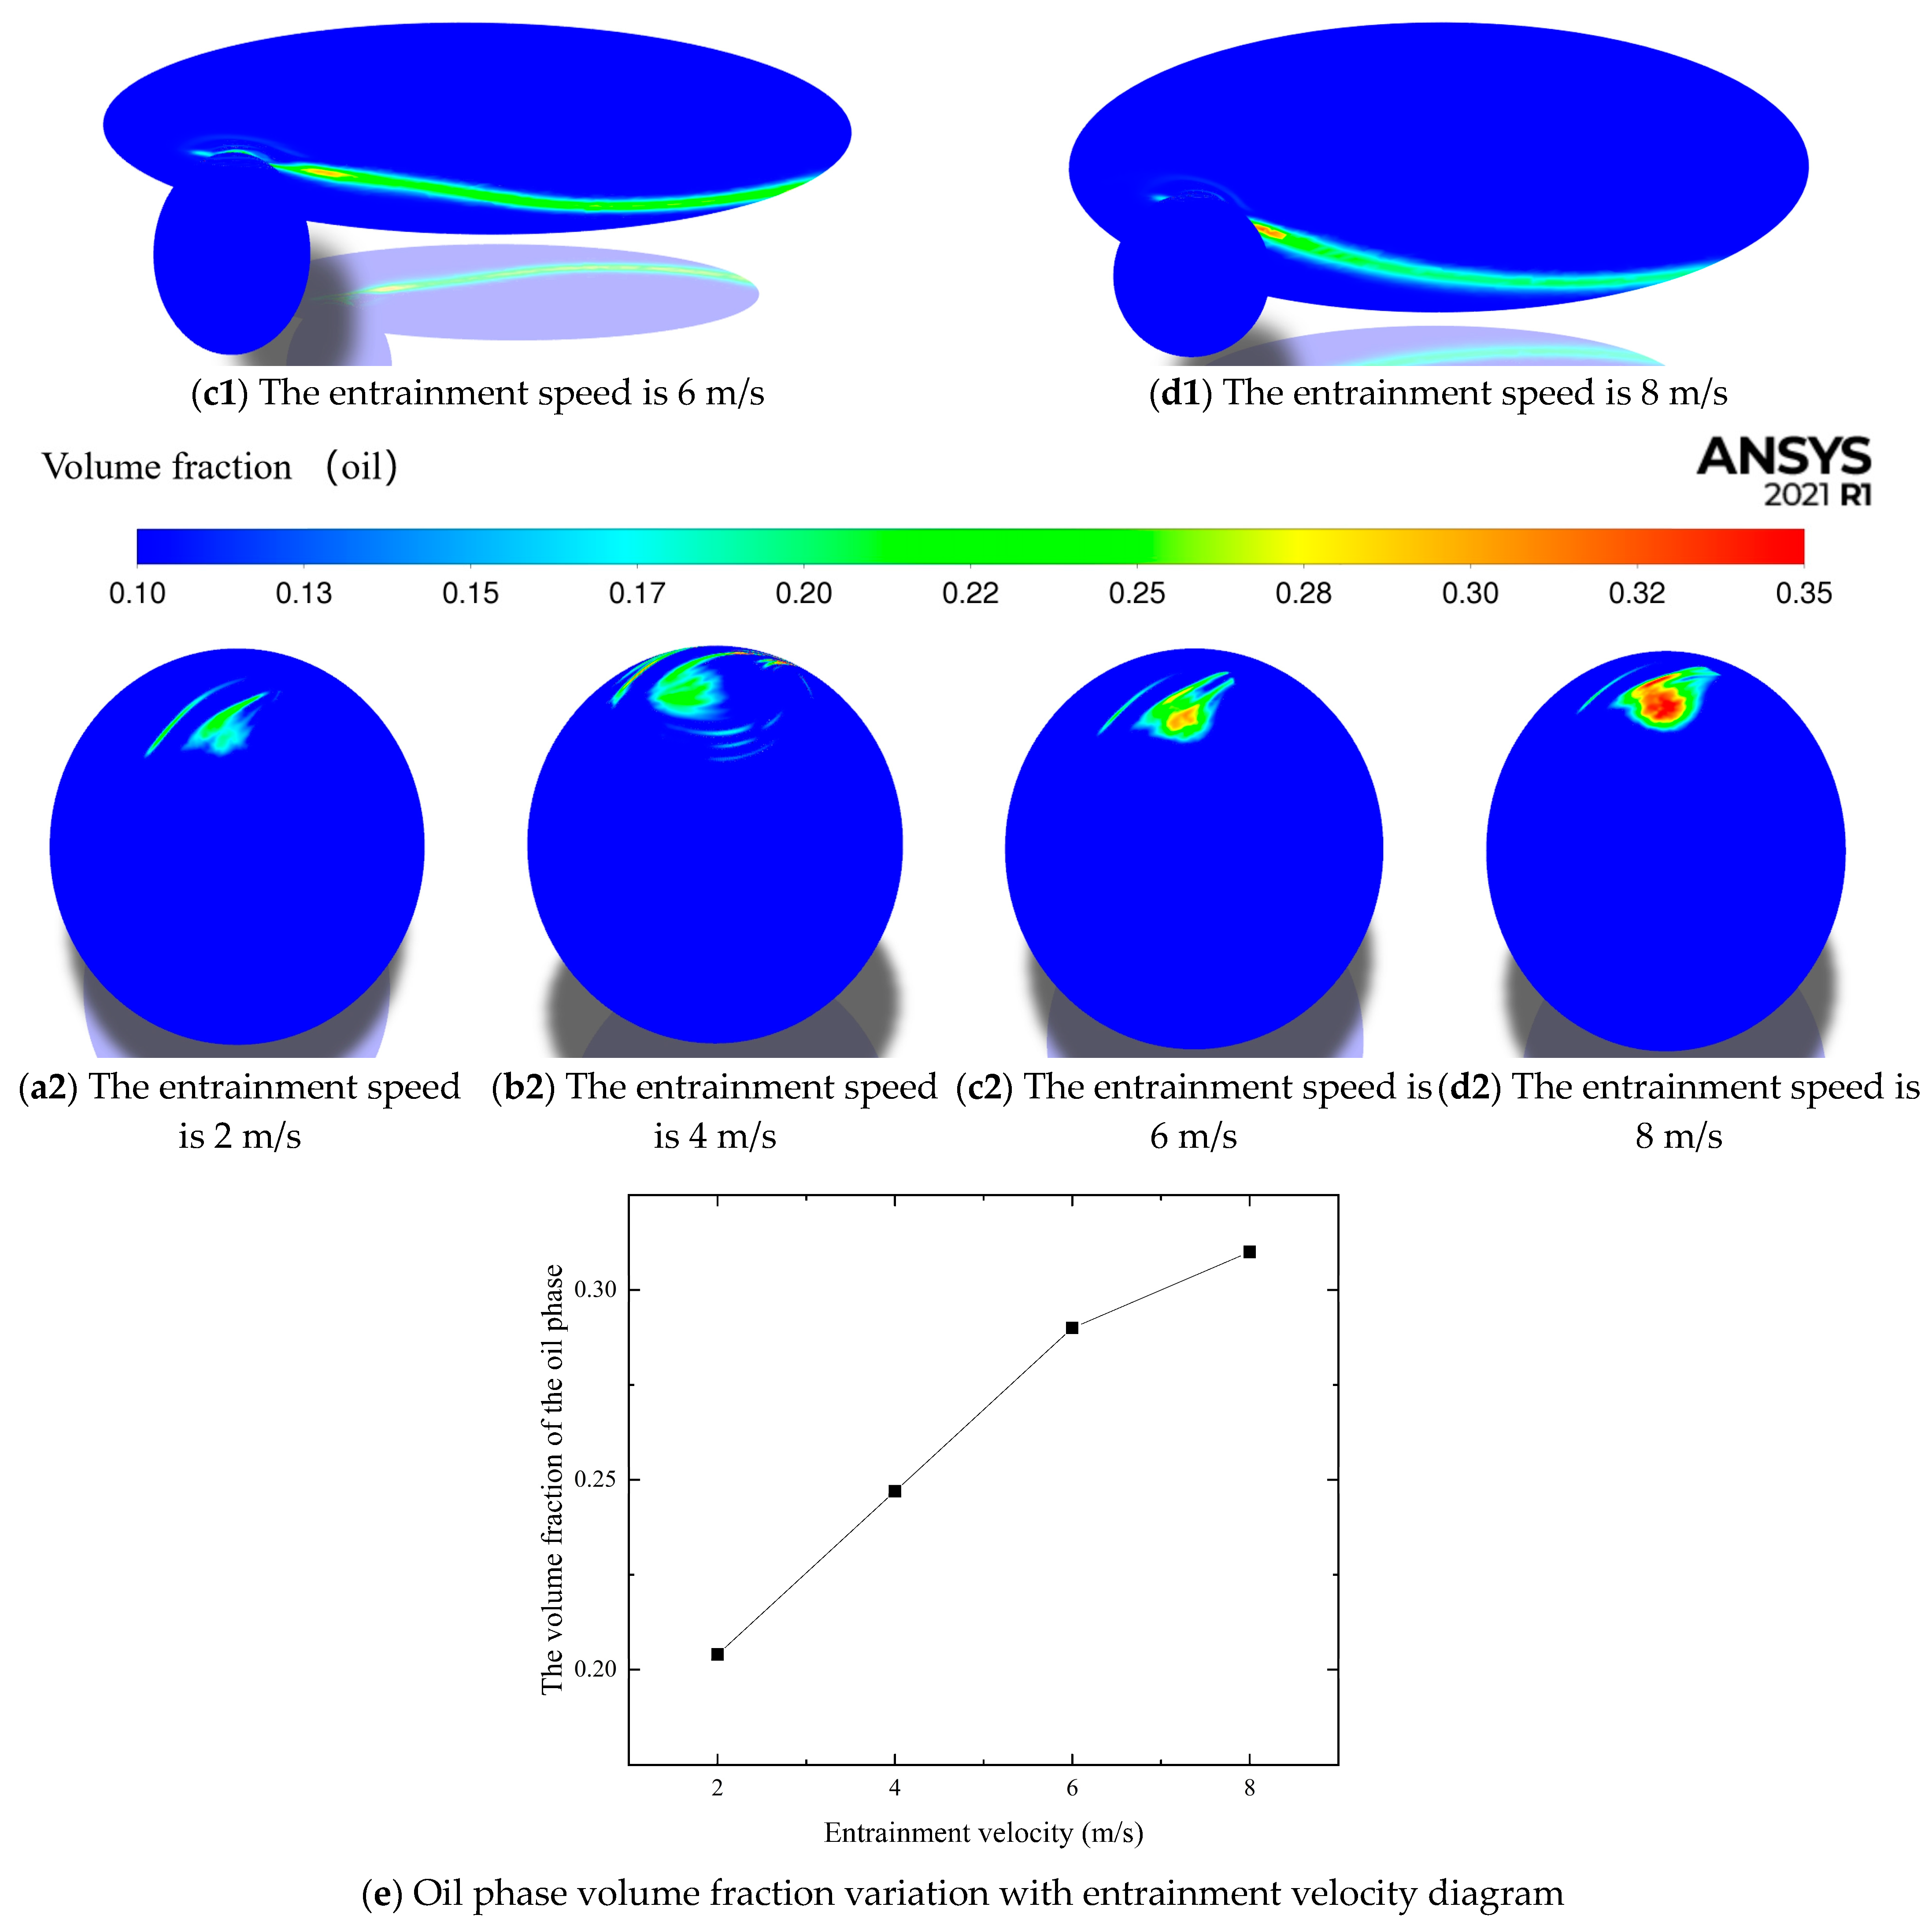
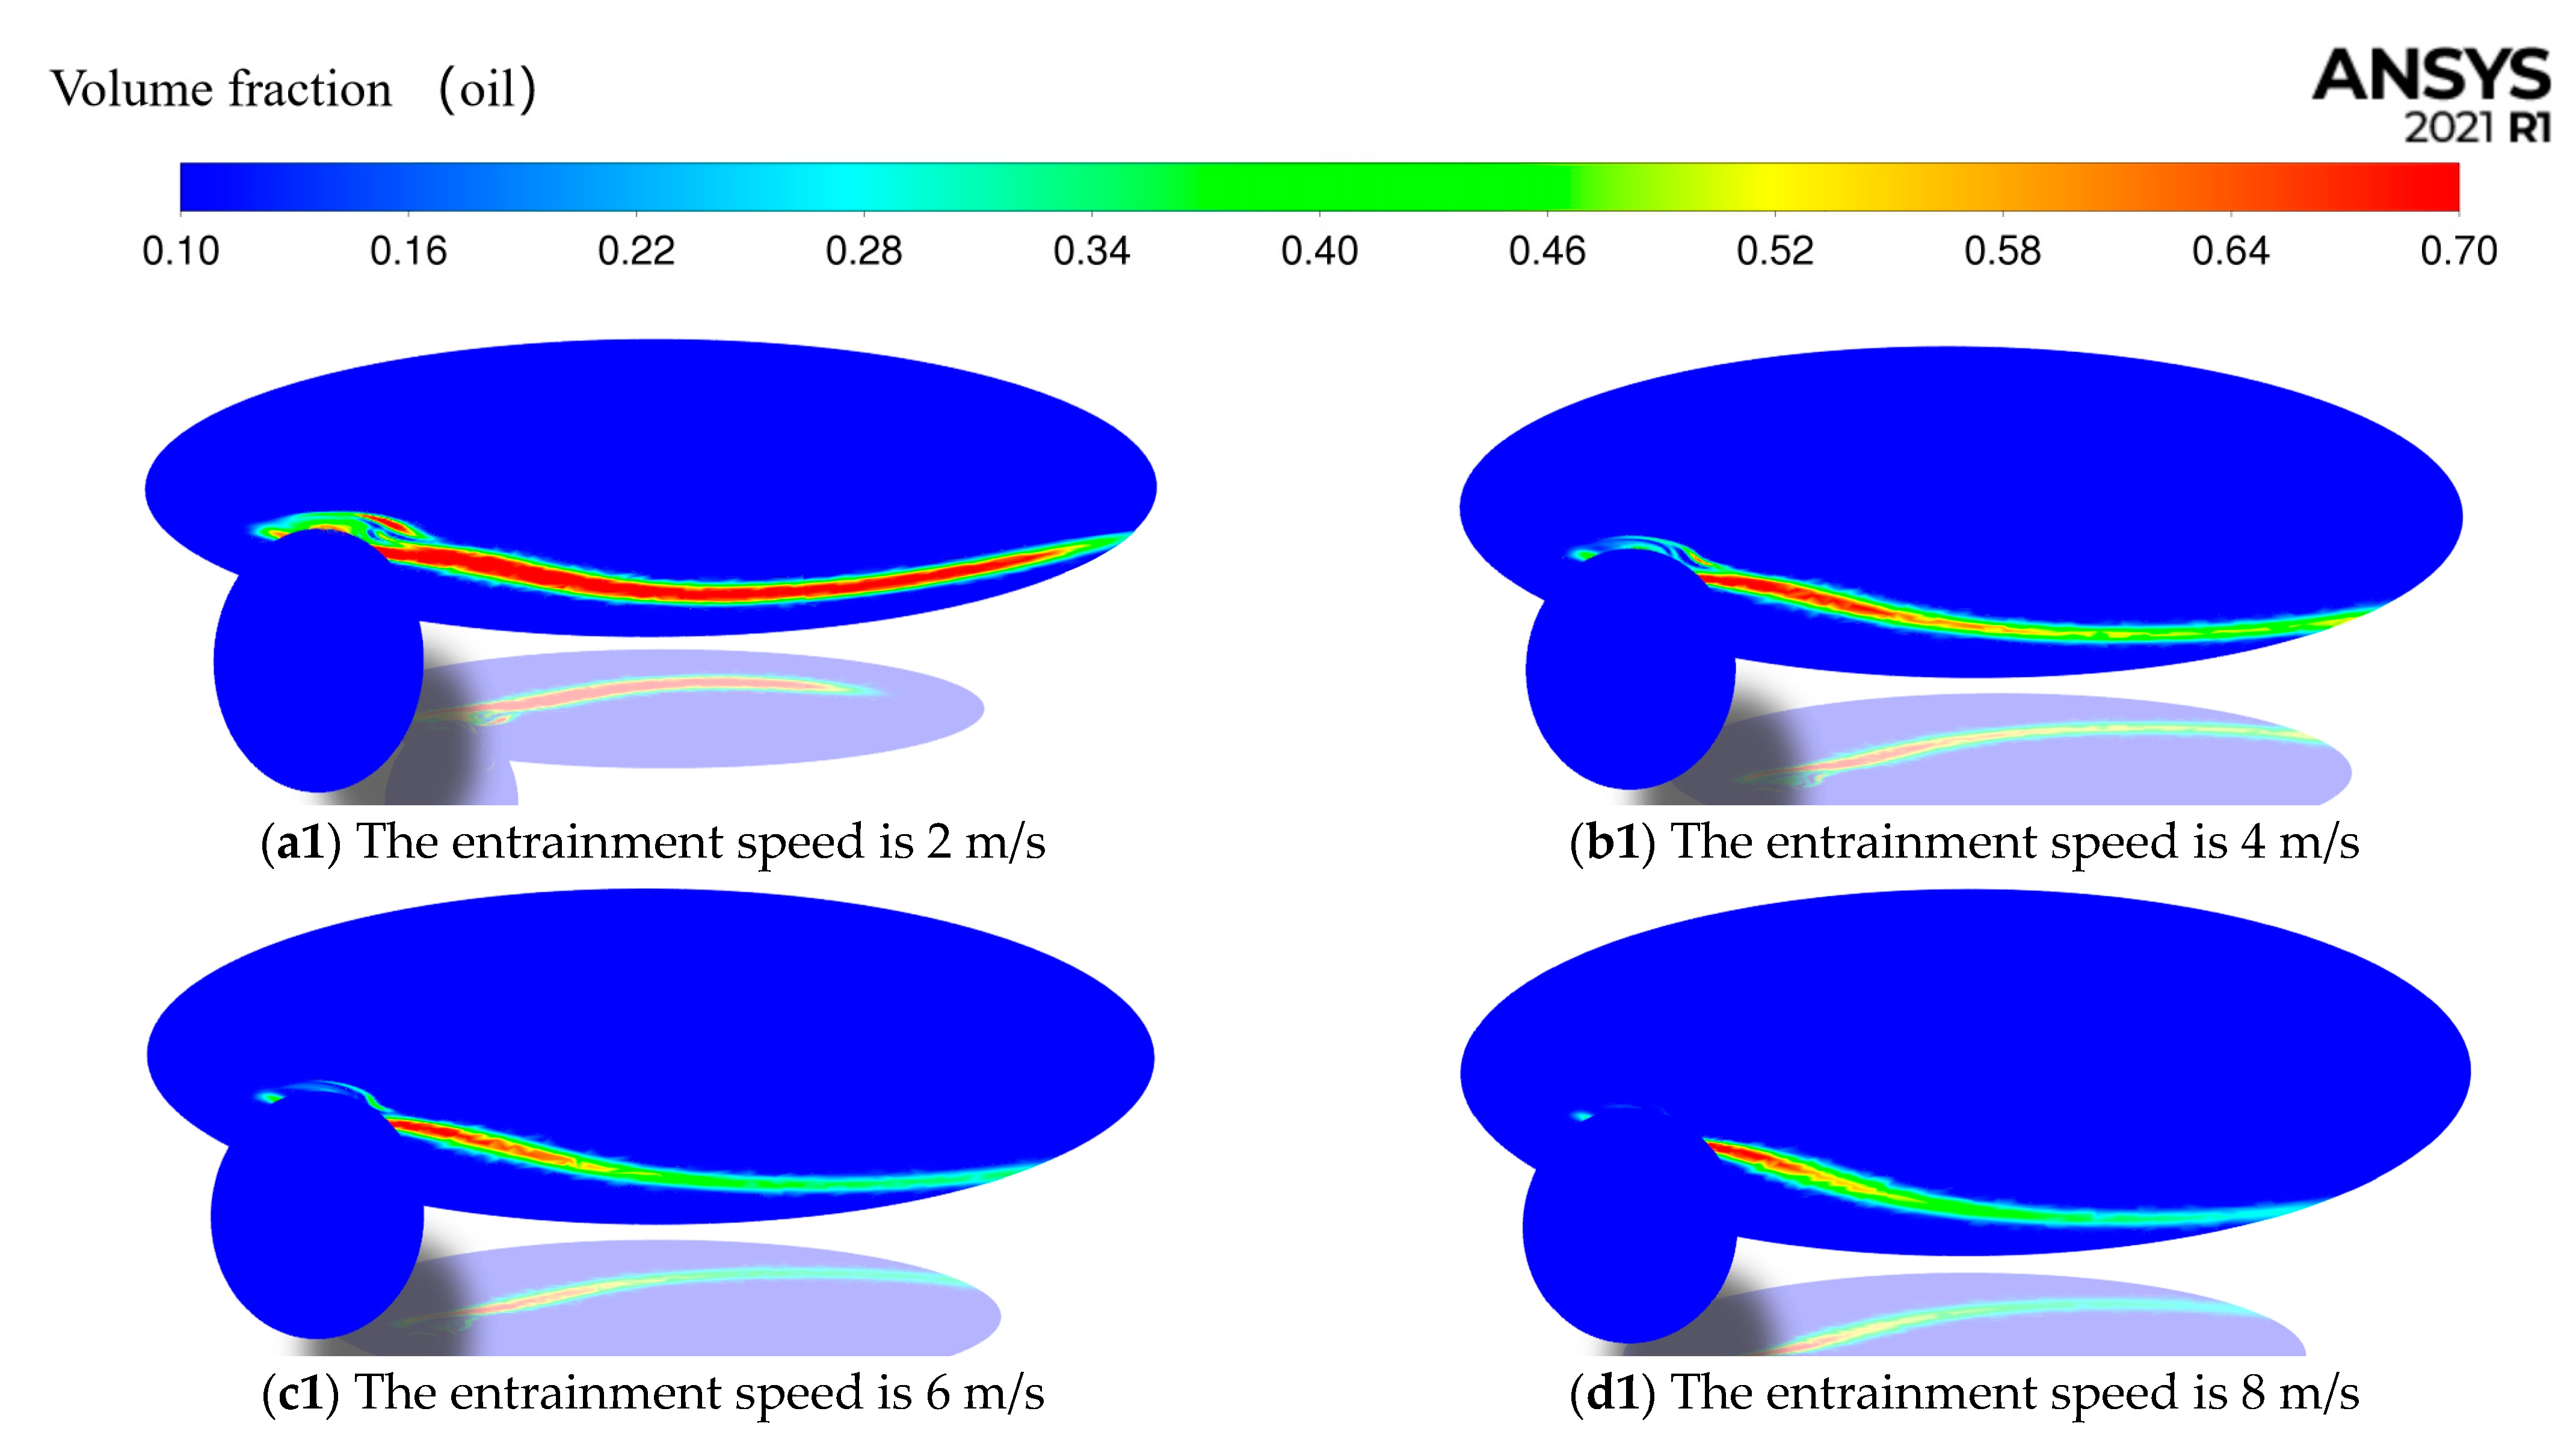
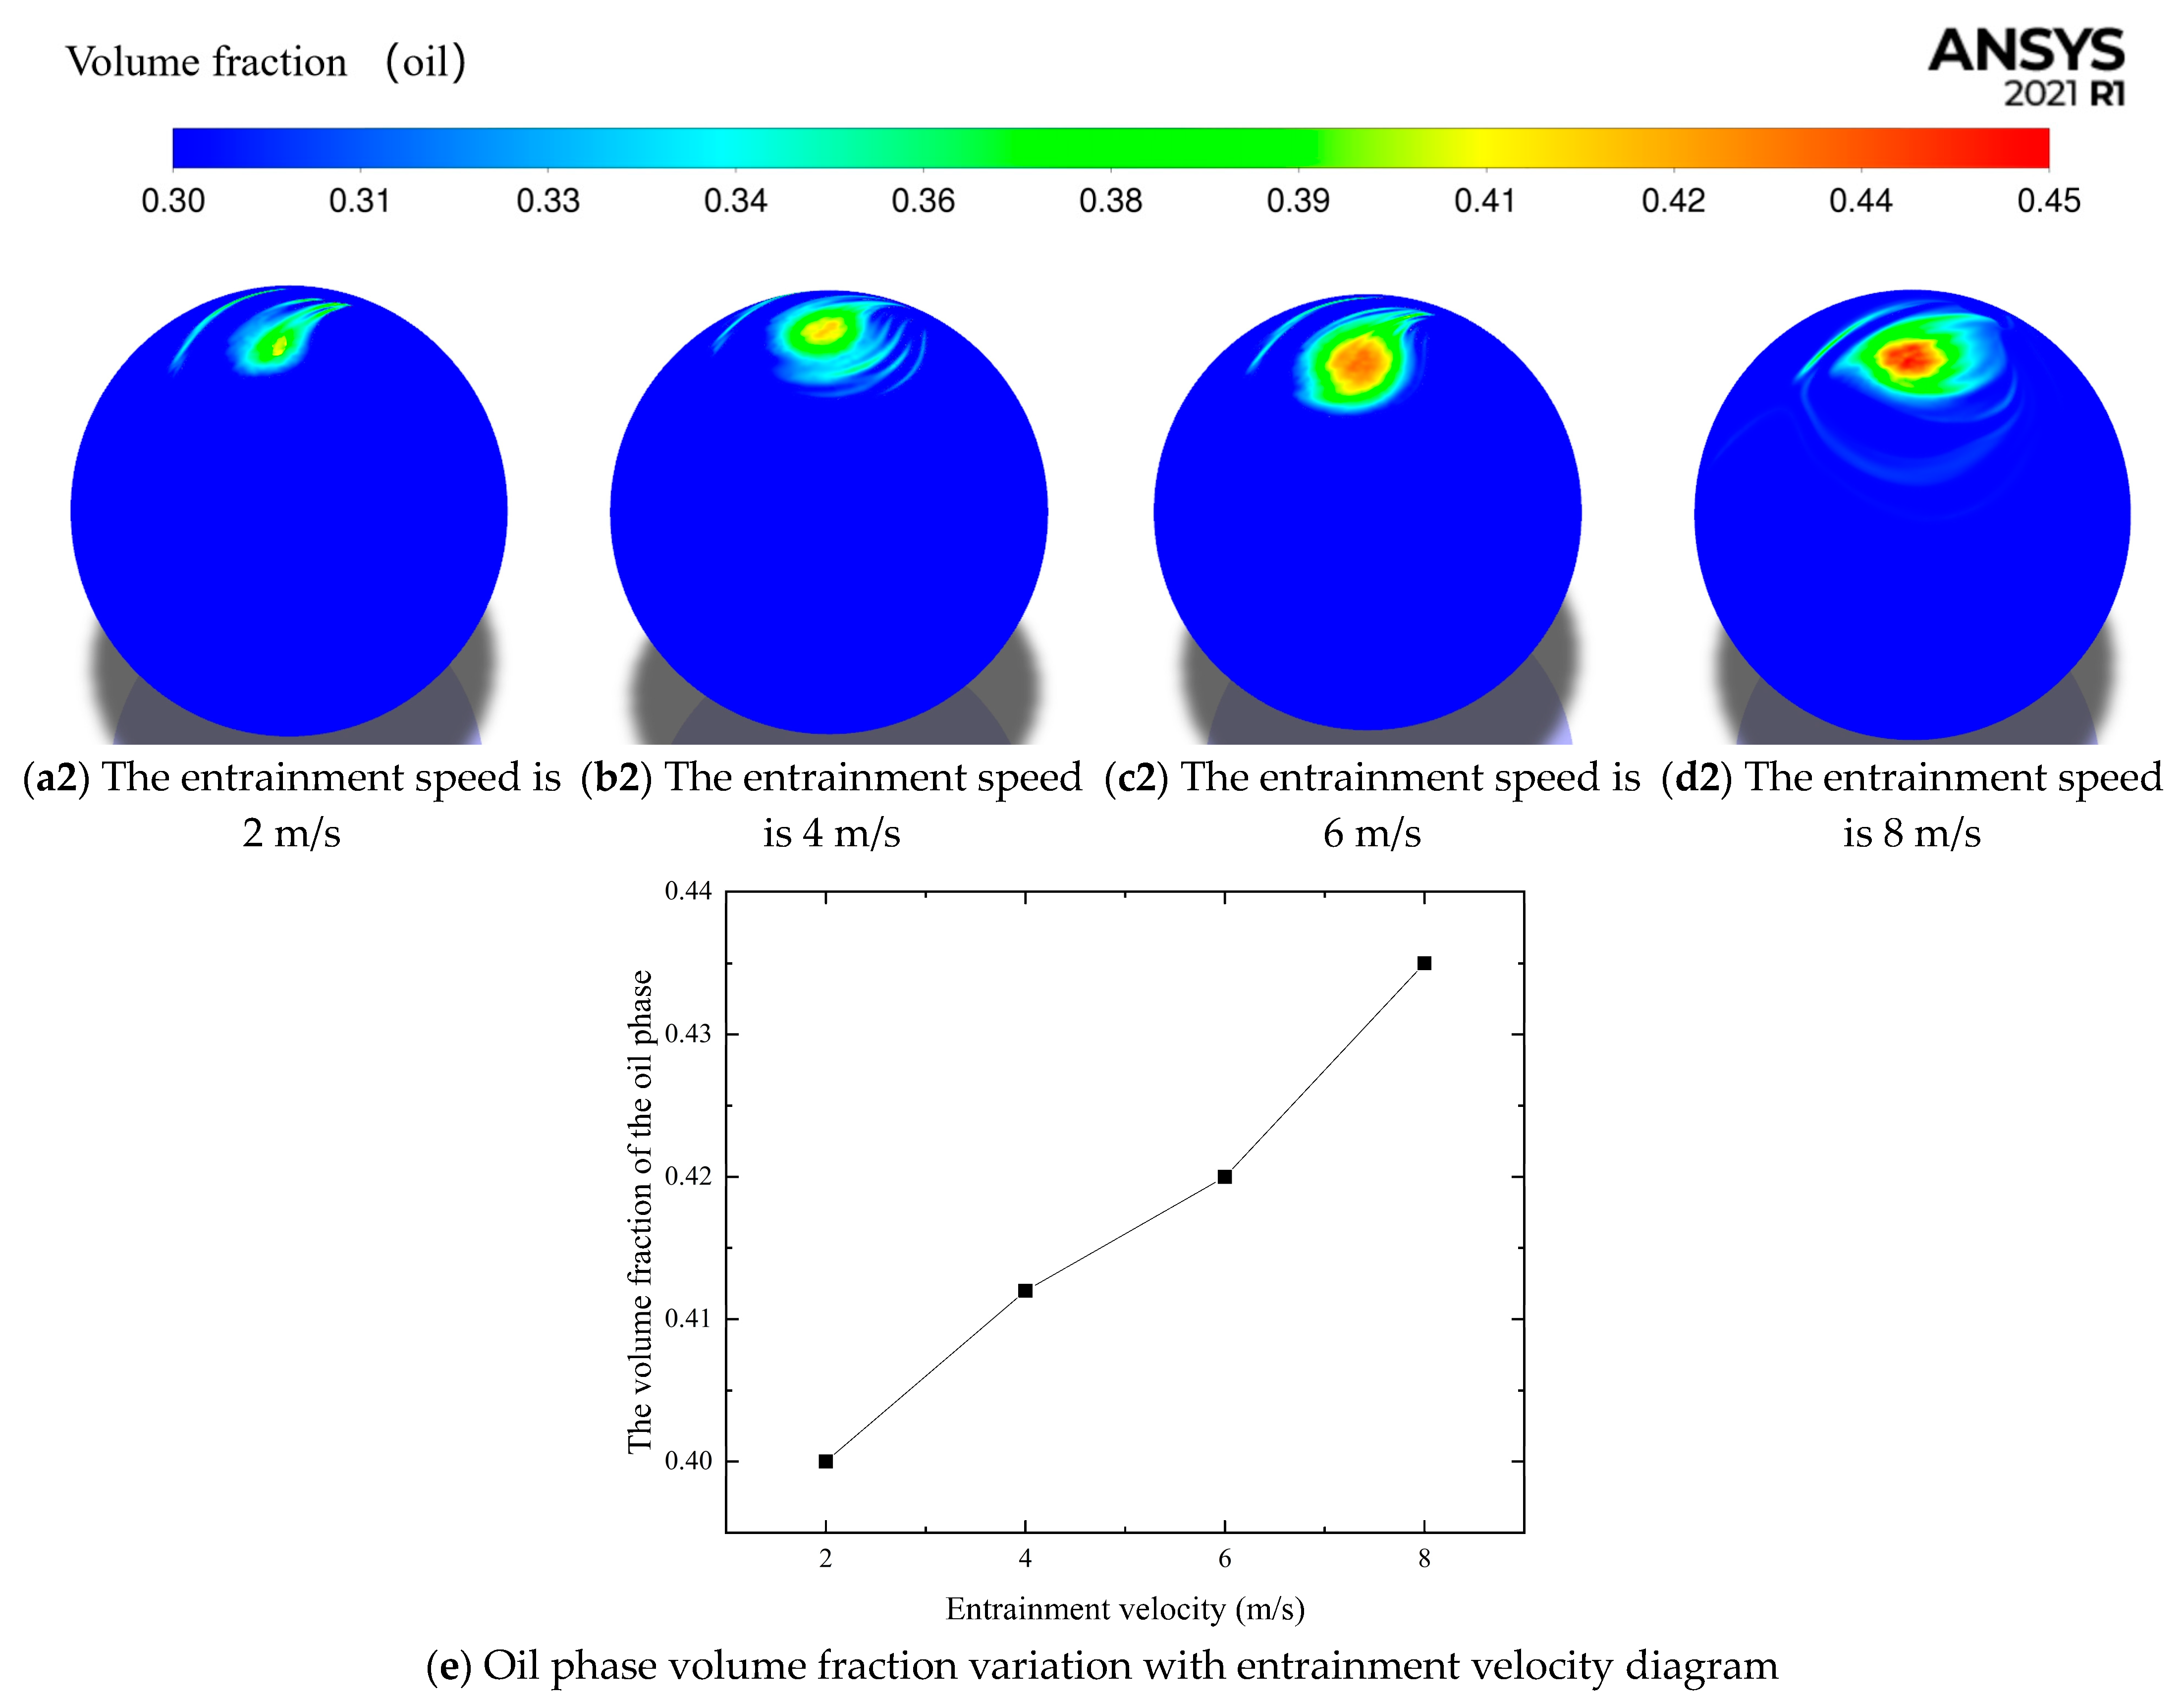
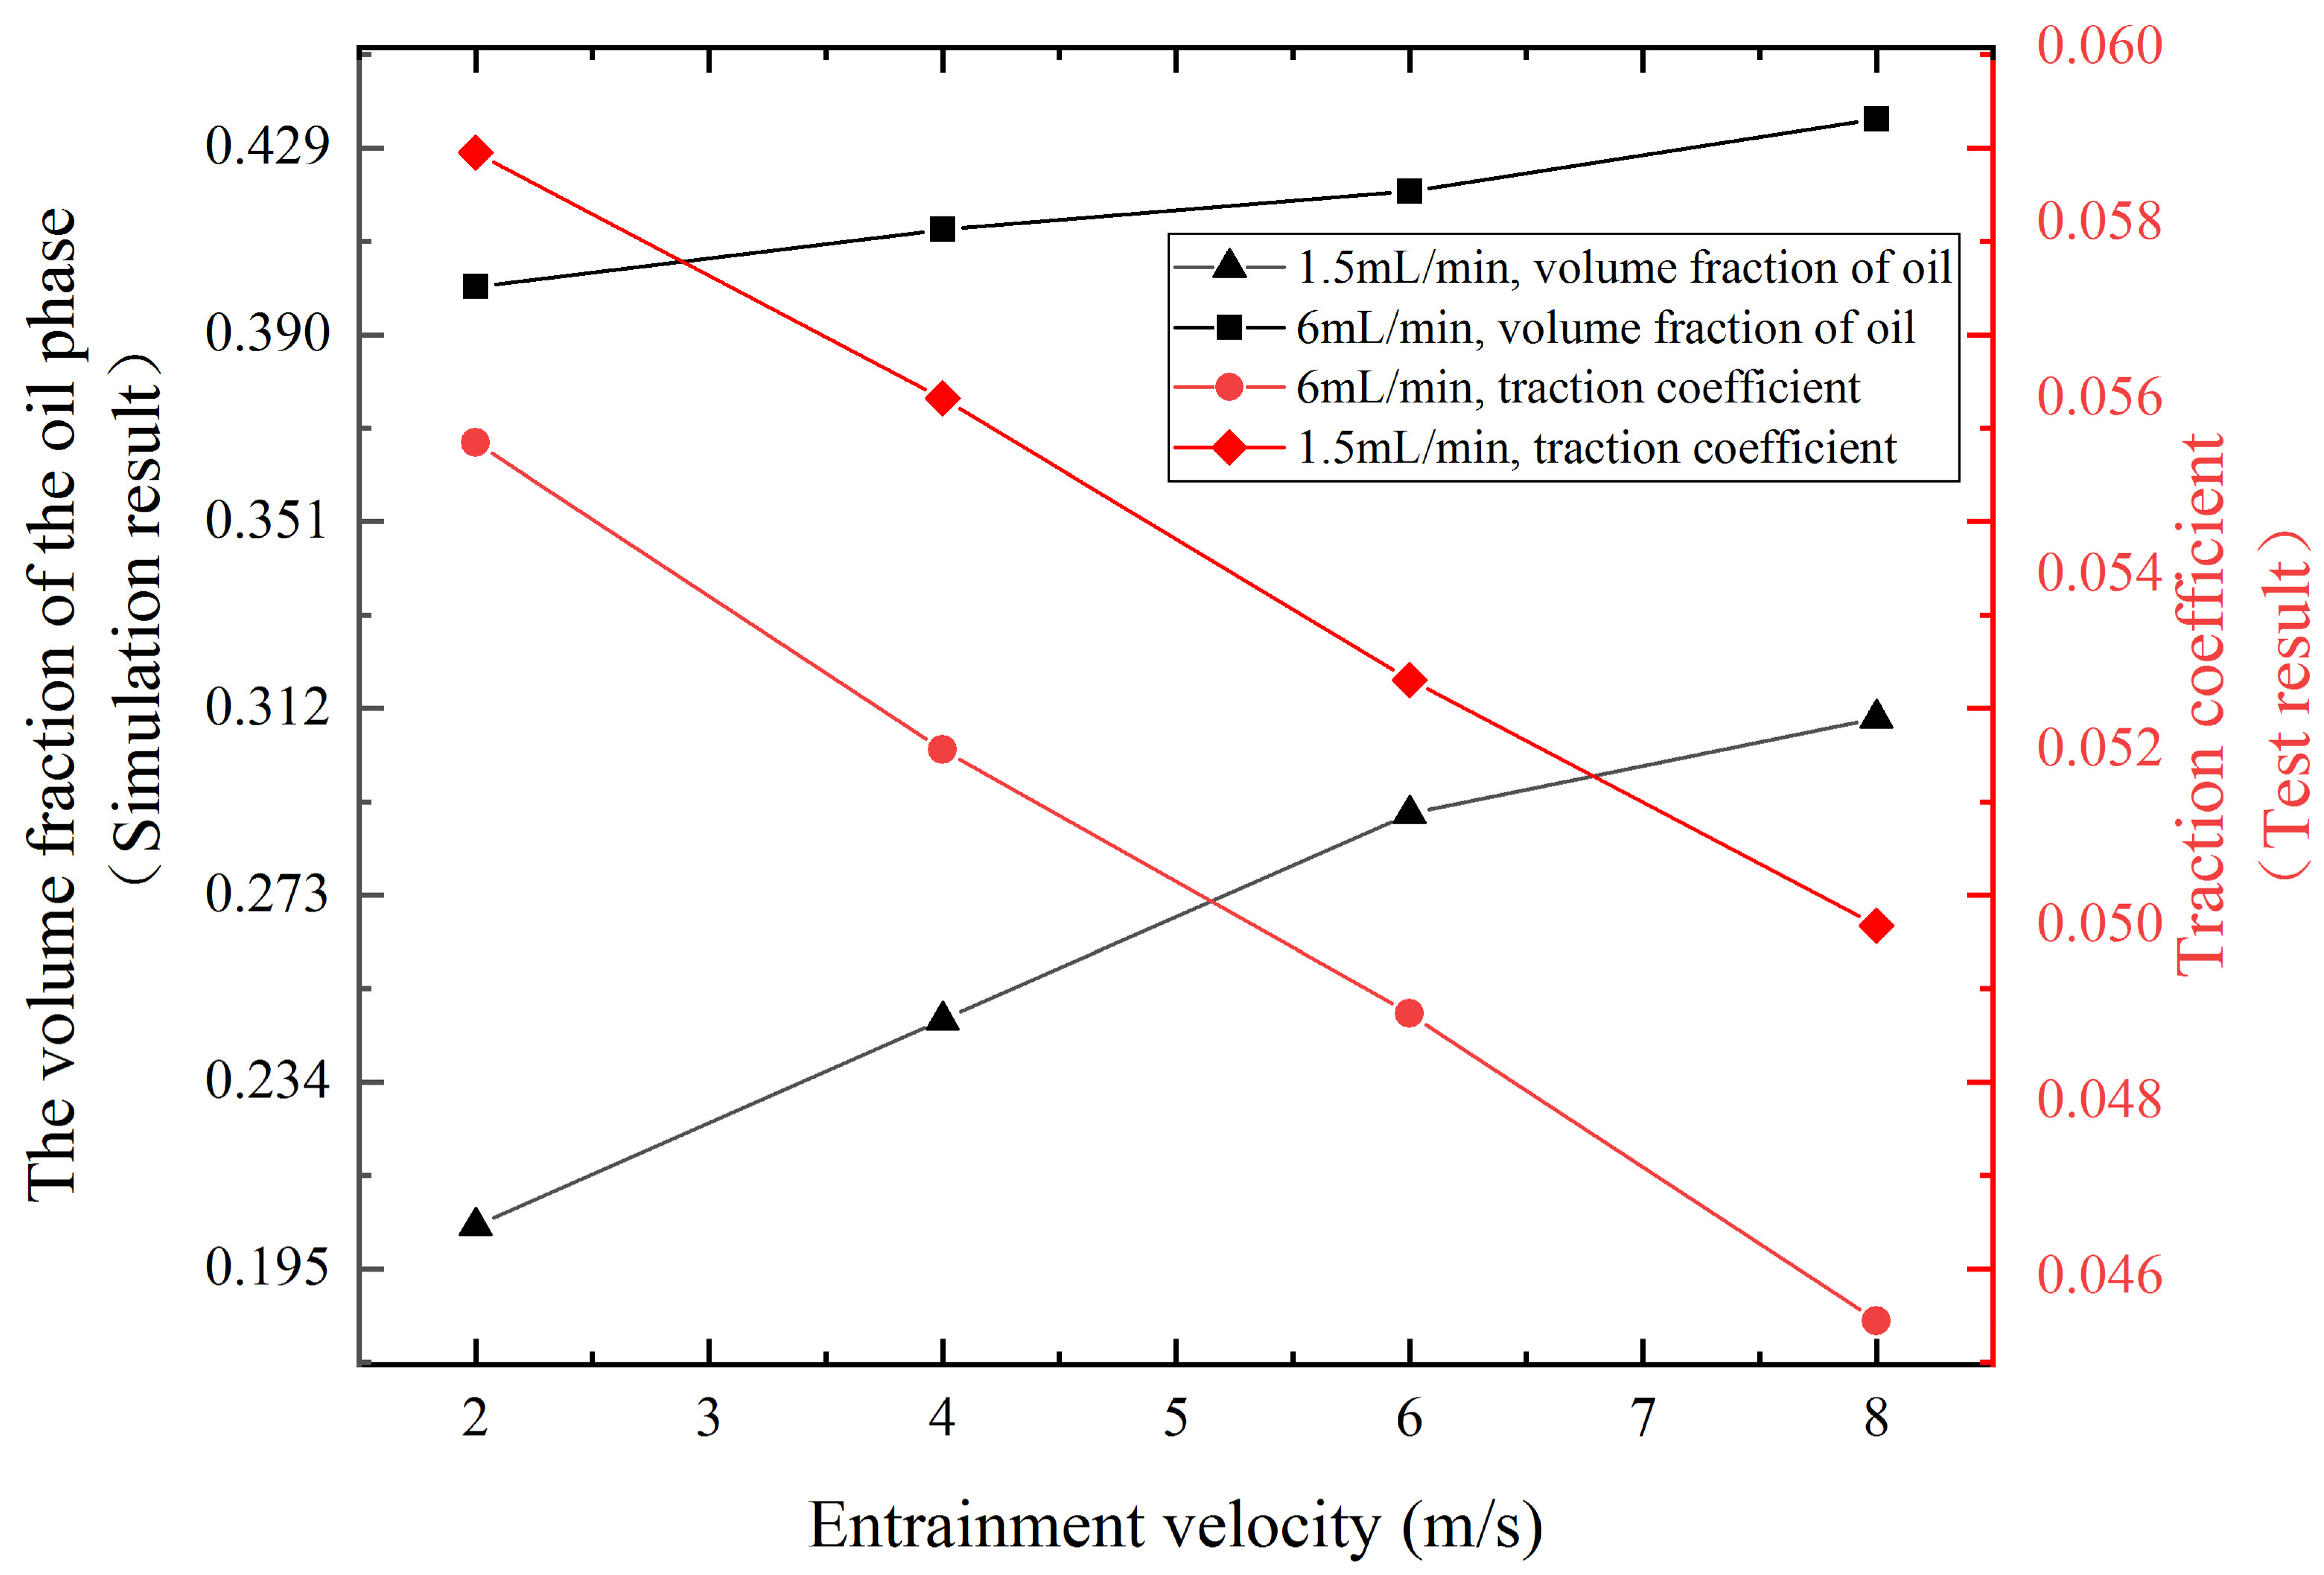
The oil–air lubrication flow field simulation model was established, and the oil supply conditions of 1.5 mL/min and 6 mL/min were simulated and analyzed. With the increase of entrainment speed, the oil volume fraction on the spherical surface of the contact region also increases. Furthermore, under the oil supply condition of 6 mL/min, the oil volume fraction on the spherical surface of the contact region exceeds that observed at 1.5 mL/min.
(3)
Fluid simulation analysis is closely related to the results of the traction test. When the slip–roll ratio is 0.1, the traction coefficient shows a downward trend with the change of the entrainment speed from 2 to 8 m/s, and the volume fraction of lubricating oil on the spherical surface of the contact area gradually increases.
(4)
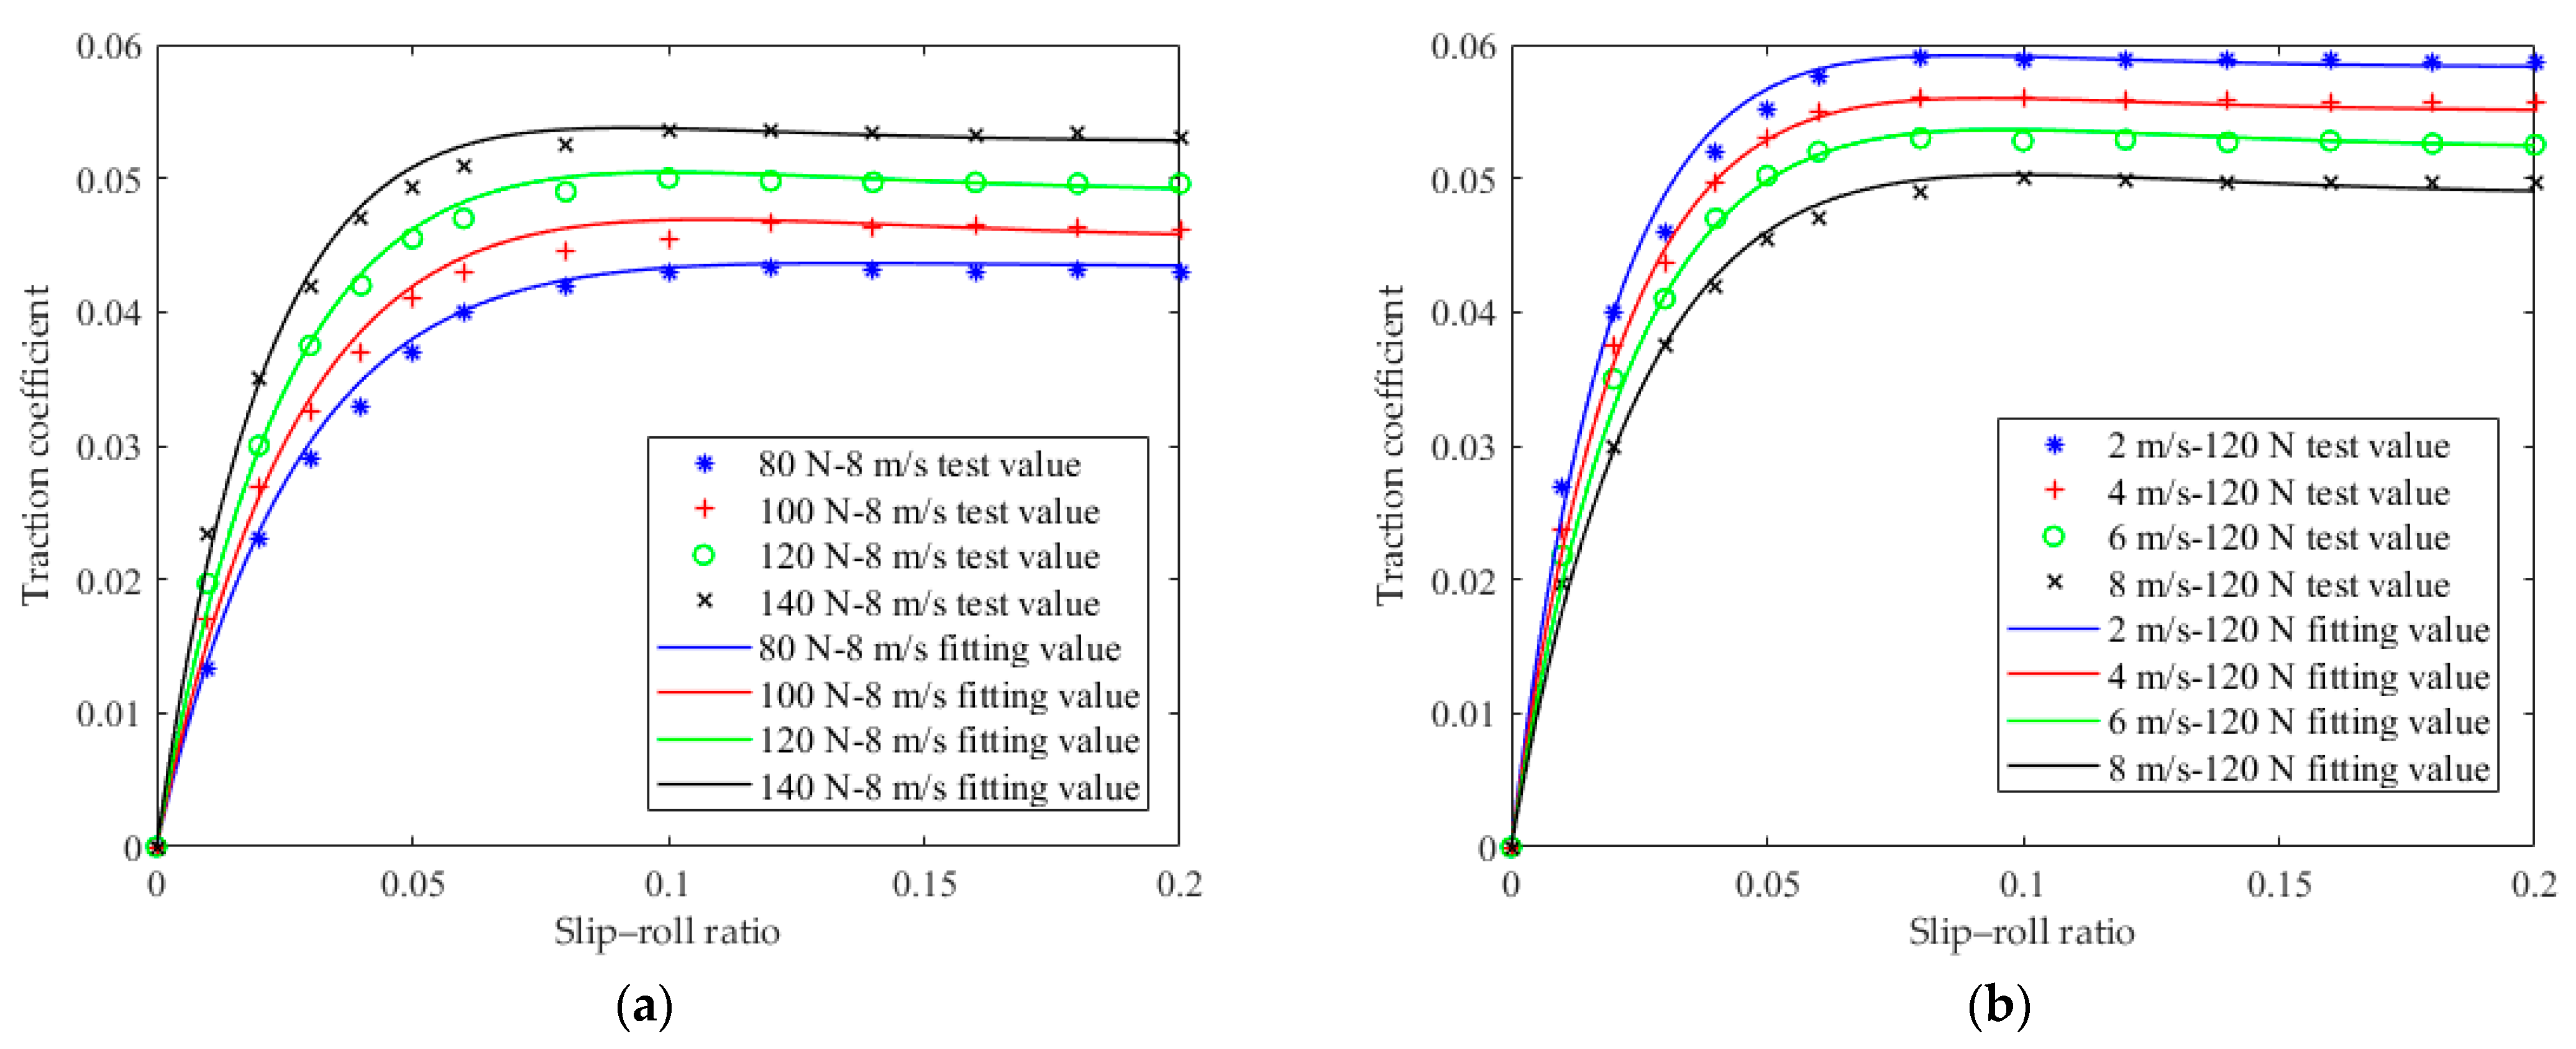
The four-parameter exponential model was used for the fitting analysis of the test data, and it was found that the theoretically predicted value of the four-parameter exponential model was in good agreement with the experimental value, and the fitting accuracy was above 0.95.
Subsequently, the authors will continue to explore the point contact lubrication mechanism and apply it to the dynamic performance analysis of point contact ball bearings as well as to explore the changes in bearing traction force under different lubrication conditions, which causes the changes of bearing friction torque and temperature. This paper lays a theoretical foundation for studying the dynamic performance of bearings under different working conditions.

Author Contributions

Conceptualization, B.S., H.L. and J.R.; Data curation, H.L. and J.R.; Formal analysis, H.L. and Z.G.; Investigation, J.R., B.S. and H.L.; Methodology, B.S. and H.L.; Project administration, B.S. and Z.G.; Resources, Z.G.; Software, H.L. and Z.G.; Supervision, B.S.; Validation, Z.G., B.S. and J.R.; Writing—original draft, B.S. and H.L.; Writing—review and editing, B.S. and J.R. All authors have read and agreed to the published version of the manuscript.

Funding

The research is funded by the Key Research and Development Program of Shandong Province (2020CXGC011003).

Data Availability Statement

The data used to support the findings of this study are available from the corresponding author upon request.

Conflicts of Interest

Author Jiongli Ren was employed by the company Luoyang LYC Automobile Bearing Technology Co., Ltd. The remaining authors declare that the research was conducted in the absence of any commercial or financial relationships that could be construed as a potential conflict of interest.

References

  1. Yao, J.; Kong, X.D.; Meng, Z.Y.; Ai, C.; Yu, B. Research on Flow Characteristics of Air-oil Two Phase Annular Flow for Oil-air Lubrication. Lubr. Eng. 2012, 37, 65–69. [Google Scholar]
  2. Yao, J. A New Type of Lubrication System—Oil-Air Lubrication System. Lubr. Eng. 1996, 6, 56–57. [Google Scholar]
  3. Zeng, Q.; Liu, C.; Zhang, J. Application Status and Study of Oil-air Lubrication System for High Speed Rolling Bearing. Lubr. Eng. 2015, 40, 103–108. [Google Scholar] [CrossRef]
  4. Yang, H.; Liu, H. Turbolub Oil-air Lubrication Technology (5). Lubr. Eng. 2003, 5, 92–95, 91. [Google Scholar] [CrossRef]
  5. Su, B.; Li, H.; Zhang, G.; Liu, F.; Cui, Y. Study on Cage Stability of Solid-Lubricated Angular Contact Ball Bearings in an Ultra-Low Temperature Environment. Lubricants 2024, 12, 124. [Google Scholar] [CrossRef]
  6. Yang, Y.; Yang, B.; Feng, Q. Research on Critical Technology of Elastohydrodynamic Traction Experiment System. J. Luoyang Inst. Sci. Technol. (Soc. Sci. Ed.) 2003, 18, 23–27. [Google Scholar] [CrossRef]
  7. Qiang, X.; Li, J.; Niu, Y.; Wu, L. The Discussing on Traction Force of Elastohydrodynamic Lubricants under Line Contact. J. Zhongyuan Univ. Technol. 2001, 12, 27–28, 39. [Google Scholar] [CrossRef]
  8. Liu, K.; Bing, L.; Liu, X.; Wang, W. Experimental Study on EHL Friction under Big Slide-roll Ratio Conditions. China Mech. Eng. 2008, 19, 2573–2576. [Google Scholar]
  9. Guo, K.; Yuan, S.; Shao, Z. Study on Oil-Air Two-Phase Flow Inside the High-Speed Bearing Cavity with Jet Lubrication. Trans. Beijing Inst. Technol. 2012, 32, 1022–1025, 1041. [Google Scholar] [CrossRef]
  10. Wu, L.; Tong, B.; Guo, D.; Ma, L.; Hu, X. Influence of Oil—Air Lubrication Flow Behavior on Frictional Characteristics of Point Contact. Tribology 2018, 38, 700–710. [Google Scholar] [CrossRef]
  11. Liu, C.; Li, X.; Guo, F.; Li, S.; Wan, Y. Experimental Observation of EHL Behavior under Single Oil Droplet Supply. Tribology 2017, 37, 340–347. [Google Scholar] [CrossRef]
  12. Tan, H.; Yang, P.; Yin, C. Analysis of the Oil Starvation in EHL Point Contacts under a Special Oil-supply Condition. Tribology 2007, 27, 357–361. [Google Scholar] [CrossRef]
  13. Duan, J.; Zhang, D. Lubricated Sliding-rolling of a Ball-on-disc Configuration at Low Speed and Light Load. Tribology 2010, 30, 431–436. [Google Scholar] [CrossRef]
  14. Hu, Z.; Li, S.; Chen, P.; Wang, Y.; Gu, J.; Fu, L. Analysis of Lubricating Status in Ultra High-speed Spindle Bearings. Lubr. Eng. 2009, 34, 31–35, 40. [Google Scholar]
  15. Liu, J.; Yang, P.; Ma, Z.; Li, M.; Jin, X.; Gao, J. Experimental and Numerical Observation of Oil-Feeding Temperature on Lubrication States. Tribology 2024, 44, 40–48. [Google Scholar] [CrossRef]
  16. Jeng, Y.R.; Gao, C.C. Investigation of the ball-bearing temperature rise under an oil-air lubrication system. Proc. Inst. Mech. Eng. Part J J. Eng. Tribol. 2001, 215, 139–148. [Google Scholar] [CrossRef]
  17. Li, L.; Liu, S.G.; Wang, J.L. The Research on Oil-Air Lubrication and Oil Lubrication in the Sliding Bearing. Key Eng. Mater. 2013, 572, 393–396. [Google Scholar] [CrossRef]
  18. Lee, J.-H.; Lee, J.-H.; Yang, S.-H. Thermal Error Modeling of a Horizontal Machining Center Using Fuzzy Logic Strategy. J. Manuf. Process. 2001, 3, 120–127. [Google Scholar] [CrossRef]
  19. Yang, J.; Yuan, J.; Ni, J. Thermal error mode analysis and robust modeling for error compensation on a CNC turning center. Int. J. Mach. Tools Manuf. 1999, 39, 1367–1381. [Google Scholar] [CrossRef]
  20. Meng, H.C.; Ludema, K.C. Wear models and predictive equations: Their form and content. Wear 1995, 181–183, 443–457. [Google Scholar] [CrossRef]
  21. Jiang, S.; Mao, H. Investigation of the High Speed Rolling Bearing Temperature Rise With Oil-Air Lubrication. J. Tribol. 2011, 133, 021101. [Google Scholar] [CrossRef]
  22. Kostal, D.; Sperka, P.; Svoboda, P.; Krupka, I.; Hartl, M. Influence of Lubricant Inlet Film Thickness on Elastohydrodynamically Lubricated Contact Starvation. J. Tribol. 2017, 139, 051503. [Google Scholar] [CrossRef]
  23. Li, X.M.; Guo, F.; Wong, P.L.; Zhao, Y. Regulation of lubricant supply by wettability gradient in rolling EHL contacts. Tribol. Int. 2018, 120, 565–574. [Google Scholar] [CrossRef]
  24. van Emden, E.; Venner, C.H.; Morales-Espejel, G.E. Aspects of flow and cavitation around an EHL contact. Tribol. Int. 2016, 95, 435–448. [Google Scholar] [CrossRef]
  25. Nogi, T.; Shiomi, H.; Matsuoka, N. Starved Elastohydrodynamic Lubrication With Reflow in Elliptical Contacts. J. Tribol. 2017, 140, 011501. [Google Scholar] [CrossRef]
  26. Nogi, T. Film Thickness and Rolling Resistance in Starved Elastohydrodynamic Lubrication of Point Contacts with Reflow. J. Tribol. 2015, 137, 041502. [Google Scholar] [CrossRef]
  27. Chan, R.T.F.; Martinez-Botas, R.; Gohar, R.J.L.S. Isoviscous flow past a rigid sphere partially immersed in a thin oil film. Lubr. Sci. 2007, 19, 197–212. [Google Scholar] [CrossRef]
  28. Pemberton, J.; Cameron, A. A mechanism of fluid replenishment in elastohydrodynamic contacts. Wear 1976, 37, 185–190. [Google Scholar] [CrossRef]
  29. Riva, E.; Del Col, D. Numerical Simulation of Laminar Liquid Film Condensation in a Horizontal Circular Minichannel. J. Heat Transf. 2012, 134, 051019. [Google Scholar] [CrossRef]
  30. Chiu, Y.P. An Analysis and Prediction of Lubricant Film Starvation in Rolling Contact Systems. ASLE Trans. 1974, 17, 22–35. [Google Scholar] [CrossRef]
  31. Lin, Y.; Hu, Z.; Xiong, C.; Zang, M.; Jia, Y.; Chen, Y.; Luo, D.; Zhao, F. Research of Flow Field Simulation for Lubrication System and Effect Evaluation on a 7-Speed Dual Clutch Transmission. In Proceedings of the FISITA 2012 World Automotive Congress; Springer: Berlin/Heidelberg, Germany, 2013; pp. 285–298. [Google Scholar]
  32. Zeng, Q.; Zhang, J.; Hong, J.; Liu, C. A comparative study on simulation and experiment of oil-air lubrication unit for high speed bearing. Ind. Lubr. Tribol. 2016, 68, 325–335. [Google Scholar] [CrossRef]
  33. Liu, C.; Tong, B.; Zhang, G.; Xu, P.m.; Wang, W.; Liu, K. Effect of air supply speed on point contact sliding wear characteristics under oil-air lubrication conditions. Lubr. Sci. 2019, 31, 273–284. [Google Scholar] [CrossRef]
  34. Szydlo, Z. Effective oil/air ratio in industrial oil mist lubricating systems. Ind. Lubr. Tribol. 2007, 59, 4–11. [Google Scholar] [CrossRef]
  35. ISO-3448; Industrial Liquid Lubricants—ISO Vicosity Classification. International Organization for Standardization: Geneva, Switzerland, 1992.
  36. Hirt, C.W.; Nichols, B.D. Volume of fluid (VOF) method for the dynamics of free boundaries. J. Comput. Phys. 1981, 39, 201–225. [Google Scholar] [CrossRef]
Figure 1. Diagram of the traction ball disk testing machine.
Lubricants 12 00299 g001aLubricants 12 00299 g001b
Figure 2. Schematic diagram of point contact model.
Lubricants 12 00299 g002
Figure 3. The mesh of the computational model.
Lubricants 12 00299 g003
Figure 4. Variation of coefficient of traction with slip-to-roll ratio. (a) Changes in traction coefficient with the slip–roll ratio under different loads. (b) Changes in traction coefficient with the slip–roll ratio at different entrainment speeds.
Lubricants 12 00299 g004
Figure 5. At injection speed of 0.05 mL/min, oil phase volume distribution of simulation results at different entrainment speeds with a slip–roll ratio of 0.1.
Lubricants 12 00299 g005aLubricants 12 00299 g005b
Figure 6. Variation of coefficient of traction with slip–roll ratio. (a) Changes in traction coefficient with the slip–roll ratio under different loads. (b) Changes in traction coefficient with the slip–roll ratio at different entrainment speeds.
Lubricants 12 00299 g006
Figure 7. At injection speed of 0.2 mL/min, oil phase volume distribution of simulation results at different entrainment speeds with a slip–roll ratio of 0.1.
Lubricants 12 00299 g007aLubricants 12 00299 g007b
Figure 8. Traction coefficient curve changes with different oil supplies.
Lubricants 12 00299 g008
Figure 9. Simulation and test comparison of different oil supplies.
Lubricants 12 00299 g009
Figure 10. Fitting results of the four-parameter exponential model. (a) The quantitative valve is 0.05 mL/time, and the load is different. (b) The quantitative valve is 0.05 mL/time, and the entrainment speed is different. (c) The quantitative valve is 0.2 mL/time, and the load is different. (d) The quantitative valve is 0.2 mL/time, and the entrainment speed is different.
Lubricants 12 00299 g010aLubricants 12 00299 g010b
Table 1. Ball and disk traction testing machine test conditions range.
Condition ParameterSymbolRange of Value
Entrainment speed of ball and disk contact area u 1~50 m/s
Speed range of electric spindle I n 1 0~48,000 r/min
Speed range of electric spindle II n 2 0~24,000 r/min
Test temperature rangeT−175~150 °C
Slip–roll ratio rangeS0~0.35
Loading rangeW10~500 N
Hertz contact stress rangeW20~3.5 GPa
Table 2. Oil–air lubrication medium parameters.
PhaseParameterDensityDynamic Viscosity
air12 m/s1.128 kg/m31.7894 × 10−2 mPa·s
oil1.2 (6.0) mL/min865 kg/m34.325 mPa·s
Table 3. Fitting value of coefficients.
Working Condition
N-m/s
ABCDResidual Standard DeviationDetermination Coefficient
80-2−0.0498−0.000144.12720.0510.00090.9982
100-2−0.0539−0.00150.65980.05510.00110.9979
120-2−0.0583055.52390.05890.00080.9989
140-2−0.06340.509650.11880.06380.00060.9994
80-4−0.04810.296836.09320.04890.0090.9982
100-4−0.051049.13170.05180.00080.9988
120-4−0.05540.68239.8190.05570.00050.9995
140-4−0.06110.442654.59410.06090.00080.9991
80-6−0.0451041.43340.04570.00070.9989
100-6−0.04840.000147.47360.0490.00080.9985
120-6−0.05230.719536.84740.05220.00050.9995
140-6−0.05660.745745.65210.05660.00020.9999
80-8−0.04230.479124.62410.04250.00040.9997
100-8−0.0459−0.000141.87550.04660.00050.9994
120-8−0.04950.329239.72910.04980.00050.9993
140-80.0529053.40280.05330.00040.9997
Disclaimer/Publisher’s Note: The statements, opinions and data contained in all publications are solely those of the individual author(s) and contributor(s) and not of MDPI and/or the editor(s). MDPI and/or the editor(s) disclaim responsibility for any injury to people or property resulting from any ideas, methods, instructions or products referred to in the content.

