Article

Laboratory Test of a Gear Hydraulic Pump during the Application of an Environmentally Friendly Hydraulic Fluid with Constant Pressure and Temperature

Faculty of Engineering, Institute of Agricultural Engineering, Transport and Bioenergetics, Slovak University of Agriculture in Nitra, Tr. A. Hlinku 2, 949 76 Nitra, Slovakia
*
Author to whom correspondence should be addressed.
Lubricants 2024, 12(9), 304; https://doi.org/10.3390/lubricants12090304 (registering DOI)
Submission received: 9 July 2024 / Revised: 25 August 2024 / Accepted: 27 August 2024 / Published: 29 August 2024
(This article belongs to the Special Issue Recent Advances in Green Lubricants)

Abstract

:
The use of environmentally friendly hydraulic fluids is frequently influenced by the temperature reached in the hydraulic circuit. This paper presents an analysis of the effect of temperature on the lifetime of the hydraulic fluid and the hydraulic pump. The test was carried out by continuous loading with a pressure of 21 MPa and a temperature of 96 °C for 100 h. A pressure valve was used for the continuous loading and the temperature was maintained using a cooler. At intervals of 25 h, the flow characteristics of the hydraulic pump were measured and oil sampling was carried out. Subsequently, a comprehensive chemical and physical analysis was carried out. In the present paper, a comprehensive analysis of the influence of eco-friendly hydraulic fluid on the operation of a gear hydraulic pump has been carried out. The study itself did not show the negative influence of the eco-friendly hydraulic fluid on the operation of the gear hydraulic pump. It can be expected that the results of the study will enable the use of eco-friendly hydraulic fluids in environmentally sensitive areas.

1. Introduction

Gear hydraulic pumps are widely used in technical practice [1] and belong to a separate group of positive displacement pumps [2]. The use of hydraulic power transmission has advantages in terms of high load resistance and high power density [3]. The most advantageous use of gear hydraulic pumps is in areas of need for small displacement volume [4]; the disadvantages are large flow ripple, fixed geometric volume and noise [5]. In the recent past, several studies have been carried out to evaluate the performance of gear hydraulic pumps. Several authors are concerned with the measurement of hydraulic–mechanical efficiency [6,7]. The most important parameter of gear hydraulic pumps is the flow efficiency [8], which determines the overall lifetime of the hydraulic pump [9,10]. In general, it can be stated that the overall lifetime of the hydraulic pump, or wear, is influenced by the fluid temperature and the method of loading [11]. The wear of gear hydraulic pumps increases the gap between the gears [12]. The reduction in flow efficiency is caused by the wear of gears [13]. In a study by Guo et al. [14] present a method to determine the wear condition of gear pumps by analyzing the flow efficiencies.
Wear of the hydraulic pump also results in the formation of wear particles that repeatedly enter the sliding pairs [15]. Despite the location of the filter in the hydraulic circuit, the wear particles move in the hydraulic circuit [16]. The level of cleanliness (amount of wear particles) allows for the prediction of the lifetime of the gear hydraulic pump [17,18]. Based on the condition of the hydraulic fluid, the potential failure of the gear hydraulic pump is possible [19,20]. The lifetime of hydraulic fluids is influenced by their physical properties, especially kinematic viscosity [21,22].
The present paper deals with the effect of continuous load (21 MPa) and fluid temperature (96 °C) on the lifetime of a gear hydraulic pump. Based on the above, the condition of abrasive particle contamination, change in kinematic viscosity and change in flow efficiency of the hydraulic pump were monitored during the laboratory test.

2. Materials and Methods

The laboratory test was carried out by continuous loading at a pressure of 21 MPa and a temperature of 96 °C for 100 h. Figure 1 shows the wiring diagram of the hydraulic test circuit. The test was carried out continuously for 100 h. The test was carried out using the gear hydraulic generator GHD1-17R-S2D1-SG05G04-N (Jihostroj, Velešín, Czech Republic) (technical data in Table 1). The loading of the hydraulic circuit was carried out using a pressure valve.
For the laboratory test, an environmentally friendly hydraulic fluid based on synthetic esters was used. The environmentally friendly hydraulic fluid has a minimum ecological content of 80% (ASTM D6866) [23] and is biodegradable by more than 60% after 28 days (OECD 301 B). The critical temperature for using the fluid is 95 °C.

2.1. Conditions for Measuring Flow Characteristics

Measurement of the flow characteristics was performed using an EVS 3108-H-0300-000 flow meter. The measurement of the flow characteristics was carried out at an interval of 25 h. The measurement lasted 60 s with a recording interval of 20 ms (a total of 3000 flow data recorded). The flow efficiency was then calculated from the mean value. The calibration protocol of the sensor ETS 4148-H-006-000 (Hydac, Sulzbach, Germany) in accordance with calibration standard DKD-K-04701 [24] and DIN EN ISO 9001 [25] is shown in Figure 2.
The measurement of the flow characteristics was carried out at different speeds from 500 to 2750 min−1 with an interval of 250 min−1.

2.2. Hydraulic Fluid Contamination Measurement

The Spectroil Q100 elemental spectrometer (Spectro Scientific, Chelmsford, MA, USA) (Figure 3) was used to measure the content of chemical elements in crude oil samples and served to determine the content of ferrous metals, contaminants and additives. The Spectroil Q100 meets the requirements of the standard method ASTM D6595 [26] for determination of wear metals and contaminants in the oil samples. It measures the content of particles of elements that are soluble and deposited as fine elements in mineral, synthetic and ecological liquids.
Acting as a laser particle counter, the particle classifier is used to determine the number of particles and classify the particles. The instrument is used for the analysis of hydraulic and lubricating oils in the field of Tribotechnics. LNF (LaserNetFines) technology determines particle count and the particle classification in lubricating oils. With the help of the laser counter, we obtain information about the current state of the hydraulic fluid and the wear of the technical condition of the equipment. The instrument identifies particles up to 100 µm in size. The LNF (Figure 4) also determines the water content in ppm and distinguishes contaminants from machine debris. It determines particle counts and abnormal abrasion classification codes.
The following instruments were used to measure the basic physical properties of hydraulic oil:
  • Kinematic Viscosity—Spectro VISC Q300 (Spectro Scientific, Chelmsford, MA, USA),
  • Acidity number—FluidScan Q1000 (Spectro Scientific, Chelmsford, MA, USA) and Titra—Lube Tan Test Kit (DEXSIL, Hamden, CT, USA).

3. Results

Table 2 shows the mean fluid flow rates at different speeds during the laboratory test.
Figure 5 shows the increase in liquid flow in the hydraulic circuit depending on the revolutions of the hydraulic pump at the beginning and at the end of the laboratory test. The observed facts show a linear dependence of the flow depending on the increasing revolutions of the hydraulic pump.
Figure 6 shows the course of the volumetric efficiency of the hydraulic pump depending on its speed during the laboratory test. As the speed increases, the volumetric efficiency increases. After reaching the rated revolutions of the hydraulic pump (n = 1500 min−1), the increase in volumetric efficiency decreases depending on the revolutions of the hydraulic pump. The mentioned fact is caused by the reduction in flow losses in the tooth gaps of the hydraulic pump [27]. After the end of the laboratory test, the highest value of the flow efficiency was found, which indicates the end of the run-in phase of the hydraulic pump.
Figure 7 shows a comparison of the volumetric efficiencies at the beginning and end of the laboratory test.
The volumetric efficiency waveforms correspond to the measurement results of Yoshida and Inaguma [28], where the authors stated that the given volumetric efficiency waveform is due to the fluid remaining in the tooth gaps, while the centrifugal force acting on the fluid increases with increasing speed. Consequently, the losses due to the fluid remaining in the tooth gaps are reduced and the flow efficiency itself increases. According to the above-mentioned authors, the effect of centrifugal force on the fluid is greatest after a speed of approximately 1500 min−1; after this speed, the effect of centrifugal force on the fluid has only a slightly increasing characteristic. Consequently, the dynamic viscosity of the fluid, which can no longer be overcome by the centrifugal force at high speeds, also has an effect on the increase.
In the analysis of the degradation process of the universal liquid, the chemical elements representing the contamination process were monitored. We paid attention to the following chemical elements in the process of contamination of the liquid: Barium (Ba), Copper (Cu), Potassium (K), Molybdenum (Mo), Sodium (Na), Silicon (Si), Tin (Sn), Aluminum (Al) and Titanium (Ti). Tin (Sn), as a contaminant, comes from the wear of the gear hydraulic pump bearings. Molybdenum (Mo), Titanium (Ti) and Aluminum (Al) were created as a contaminant from the wear of the gears and the hydraulic pump block, where they are part of the alloy. For the other elements, the value of pollution is practically negligible.
Figure 8 shows the degradation process of the chemical elements representing the contamination of the universal fluid during the laboratory test. Tin (Sn) and molybdenum (Mo) represent the largest degree of liquid contamination.
Acting as a laser particle counter, the LNF-C particle classifier is used to record particles ranging from 20 µm to 100 µm in size. Particles below 20 µm are not scanned by the classifier and the number of particles is counted. The maximum diameter for non-circular particles is classified as the longest bowstring. Table 3 shows the classification of wear particles by LaserNET Fines with respect to hours worked for a biodegradable universal oil sample.
The laboratory test was performed with a new gear hydraulic pump. The liquid sampling itself at the beginning of the laboratory test took place after the environmentally friendly liquid was poured into the hydraulic circuit and the hydraulic pump was briefly run. Despite the fact that the hydraulic circuit was cleaned at the beginning of the test, wear particles are found in the liquid based on the LaserNET test. The process of creating wear particles is caused by the run-in wear of the hydraulic pump. The hydraulic pump has been subjected to high pressure and high temperature since the beginning of the laboratory test. The wear particles also arose from the production process of the hydraulic pump. Subsequently, Table 3 shows a gradual increase in individual wear components despite the filter used.
Figure 9 shows the kinematic viscosity at 40 °C with respect to the number of hours worked. We have used the guideline value, the kinematic viscosity of the new sample, which has taken the value of 62.33 mm2.s−1. Based on ISO 15380:2016 [29], there cannot be a change of more than 20% in the kinematic viscosity value compared to the initial test condition. We have determined the limit values, finding that the upper limit value of kinematic viscosity is 74.8 mm2.s−1 and the lower limit value is 49.86 mm2.s−1. After 100 h of work, the kinematic viscosity at 40 °C had a value of 55.97 mm2.s−1, which represents a decrease value of 10.2%. Based on the measured data, the limit value for the change in kinematic viscosity at 40 °C specified in ISO 15380:2016 was not exceeded.
Figure 10 shows the kinematic viscosity at 100 °C with respect to the number of hours worked. We have taken the guideline value, the kinematic viscosity of the new sample, which has taken the value of 20.59 mm2.s−1. Based on ISO 15380:2016, there cannot be a change of more than 20% in the kinematic viscosity value compared to the initial test condition. We have determined the limit values, finding that the upper limit value of kinematic viscosity is 24.7 mm2.s−1 and the lower limit value is 16.47 mm2.s−1. After 100 h of work, the kinematic viscosity at 100 °C had a value of 17.66 mm2.s−1, which represents a 14.23% decrease value. Based on the measured data, the limit value for the change in kinematic viscosity at 100 °C specified in ISO 15380:2016 was not exceeded.
During the laboratory test of the environmentally friendly liquid, there was a continuous decrease in kinematic viscosity at 40 °C and at 100 °C. This decrease is due to the fact that the environmentally friendly liquid used during the laboratory test is a non-Newtonian fluid. The decrease in viscosity is caused by additives added to the base oil. Additives improve the biological degradability of the liquid and have an effect on the decrease in kinematic viscosity during the laboratory test.
“In a non-Newtonian fluid, the local shear stresses and the local shear rates in the fluid have a non-linear relation, where a proportionality constant can not be defined. Therefore, the viscosity is not a fixed scalar but a variable. Further, it is also important to note that the viscosity can be dependent on the shear rate or the time history of the shear rate” [30].
Figure 11 shows the dependence of the total acid number and the limit value with respect to the number of hours worked, with the total acid number increasing from a value of 1.56 mgKOHg−1 to a value of 1.59 mgKOHg−1, an overall increase of 1.9%, after 100 h of work. Based on ISO 15380:2016, the acid number limit value is set at 3.56 mgKOHg−1. The data shows that the acid number of the biodegradable universal liquid did not exceed the limit value.
In the case of environmentally friendly liquids, it is crucial to monitor the acidity number of the liquid. The acidity number determines the content of naphthenic acids and other acidic substances, which establish the extent of oil oxidation (degradation) associated with the oil’s corrosive potential [31].

4. Conclusions

The present paper deals with the effect of loading pressure and temperature on the operating characteristics of a gear hydraulic pump. During the laboratory test of the gear hydraulic pump, the following facts were found:
(1).
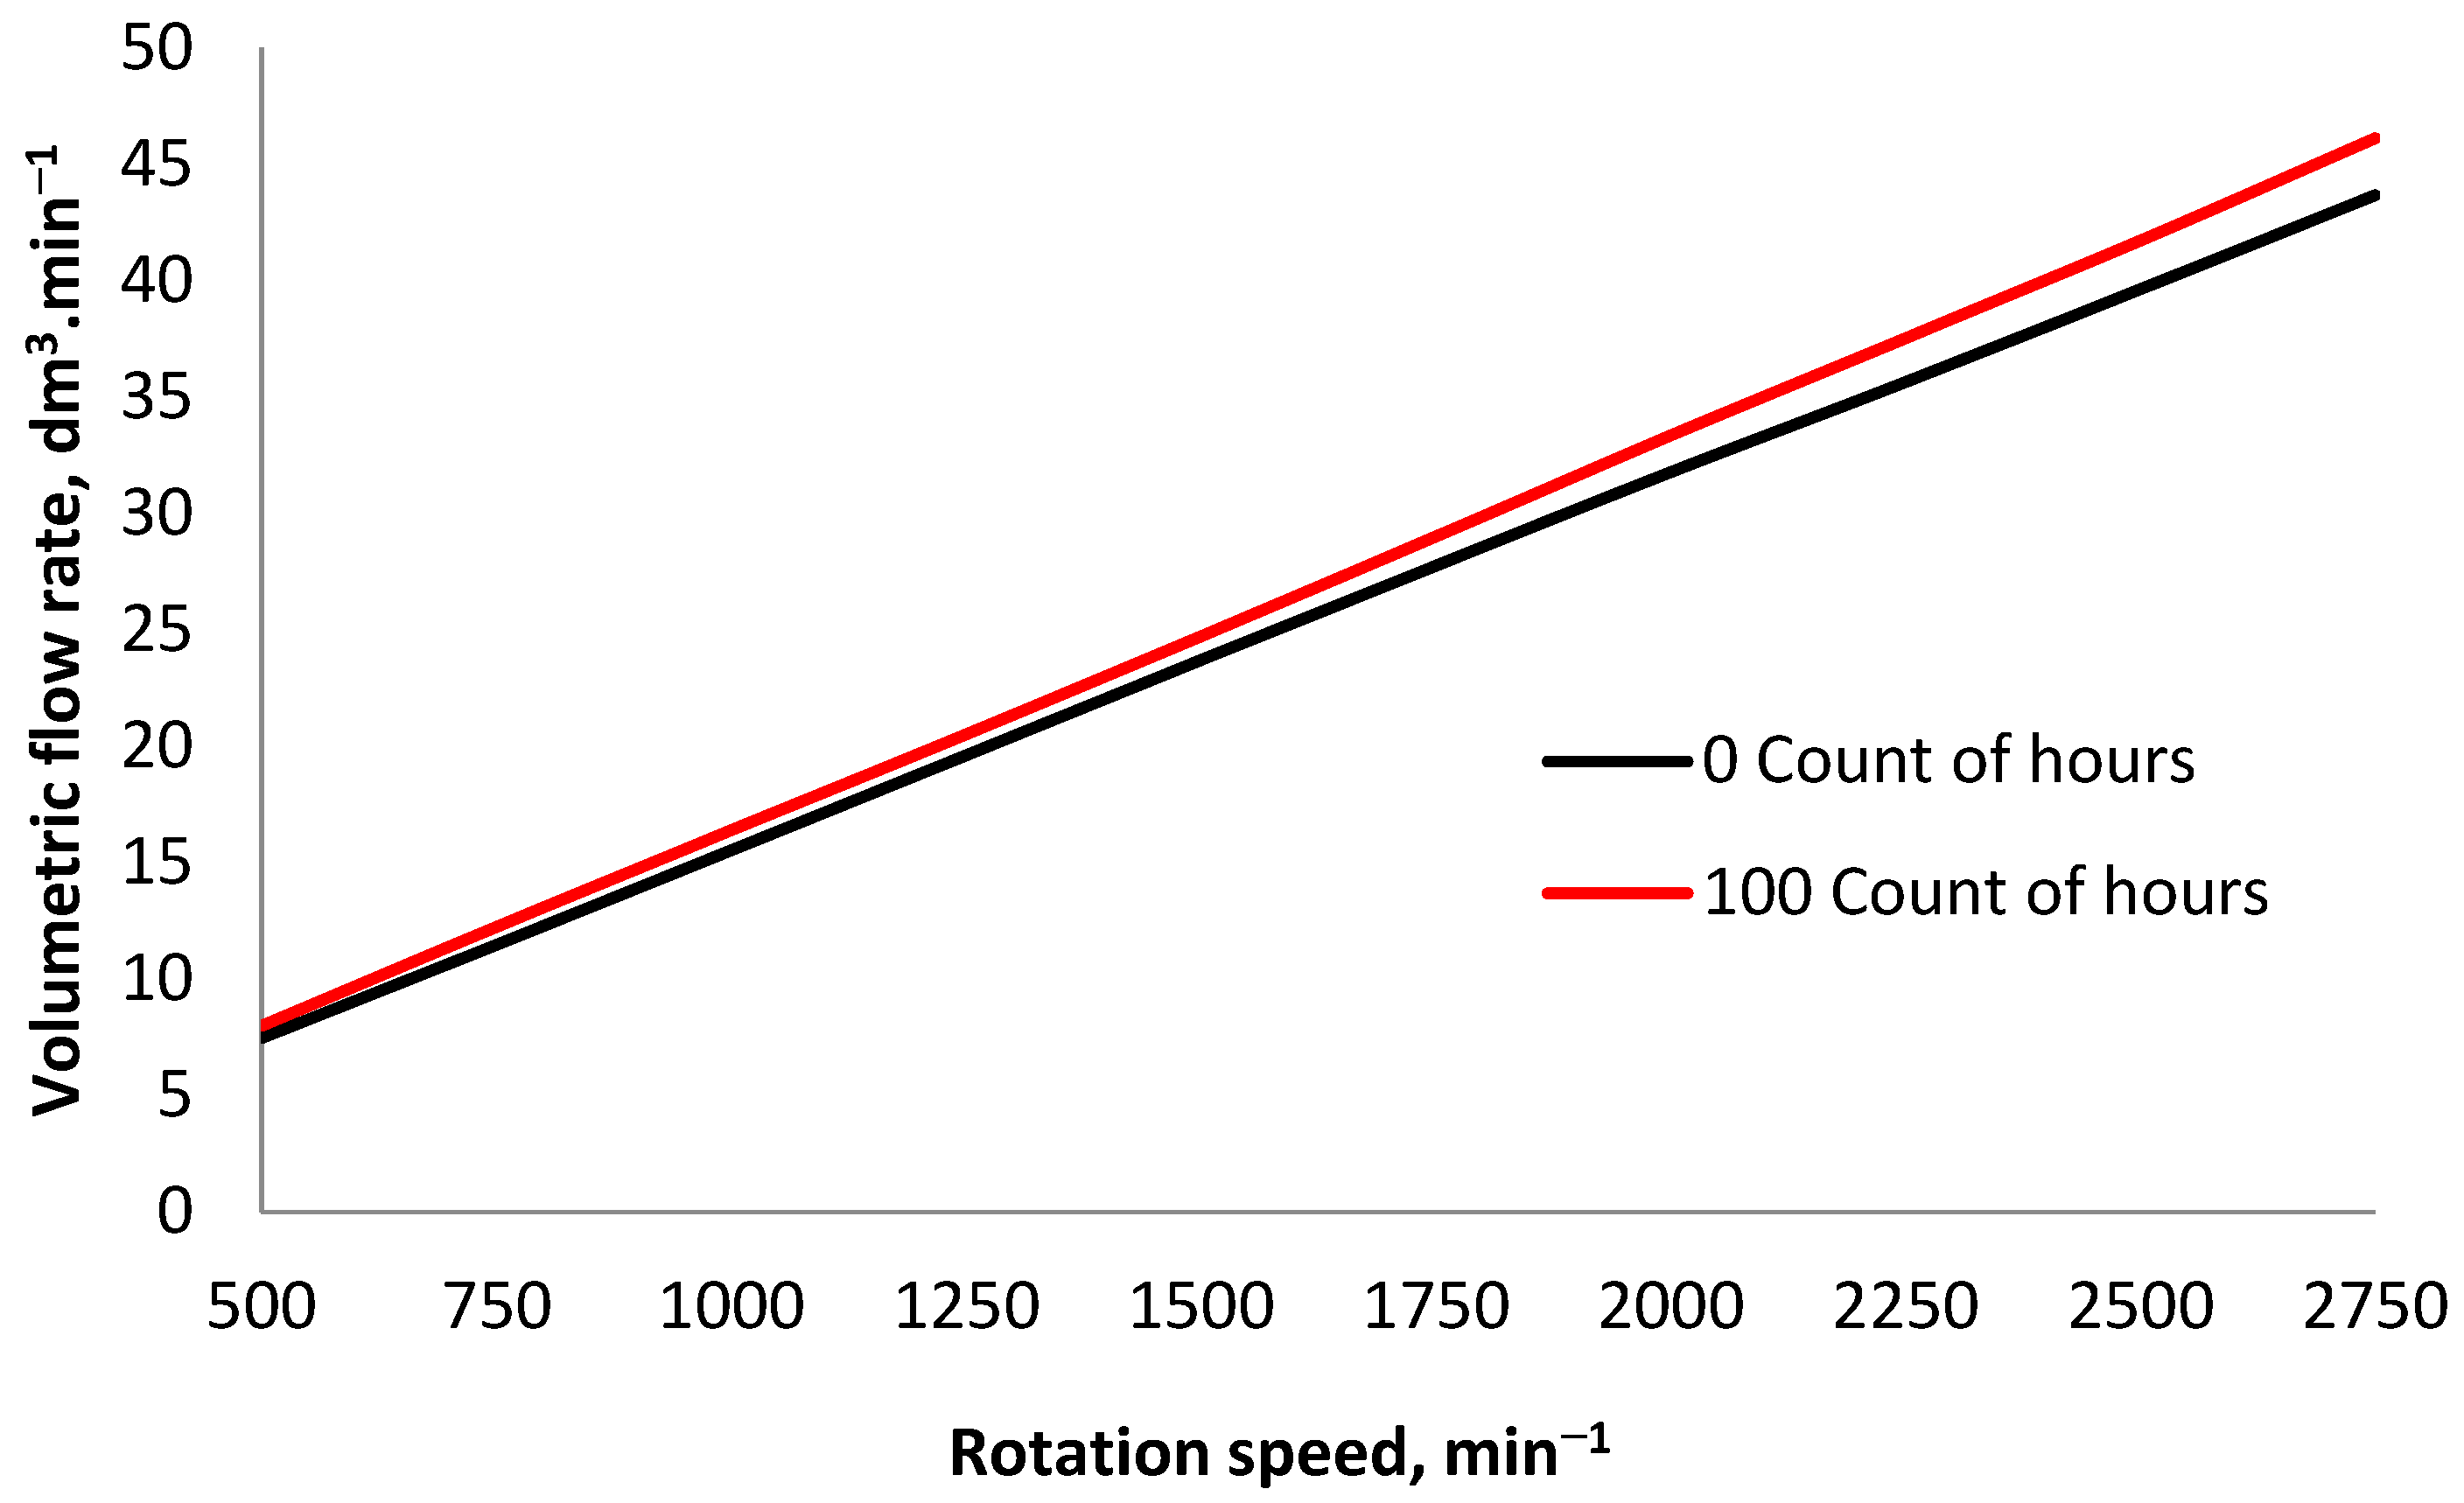
At the beginning of the laboratory test, the flow efficiency of the gear hydraulic pump at rated speed was 90.85%. After 25 h, the flow efficiency reached 98.82%. The above fact demonstrates that, after 25 h, the break-in phase of the gear hydraulic pump was completed.
(2).
After the completion of the laboratory test (100 h), the flow efficiency of the tooth hydraulic pump reached 99.42%. Compared to the time of measuring the flow characteristics after 25 h, there was a slight decrease in the flow efficiency of the tooth hydraulic pump, but this decrease is within the inaccuracy of the flow meter shown in Figure 2.
(3).
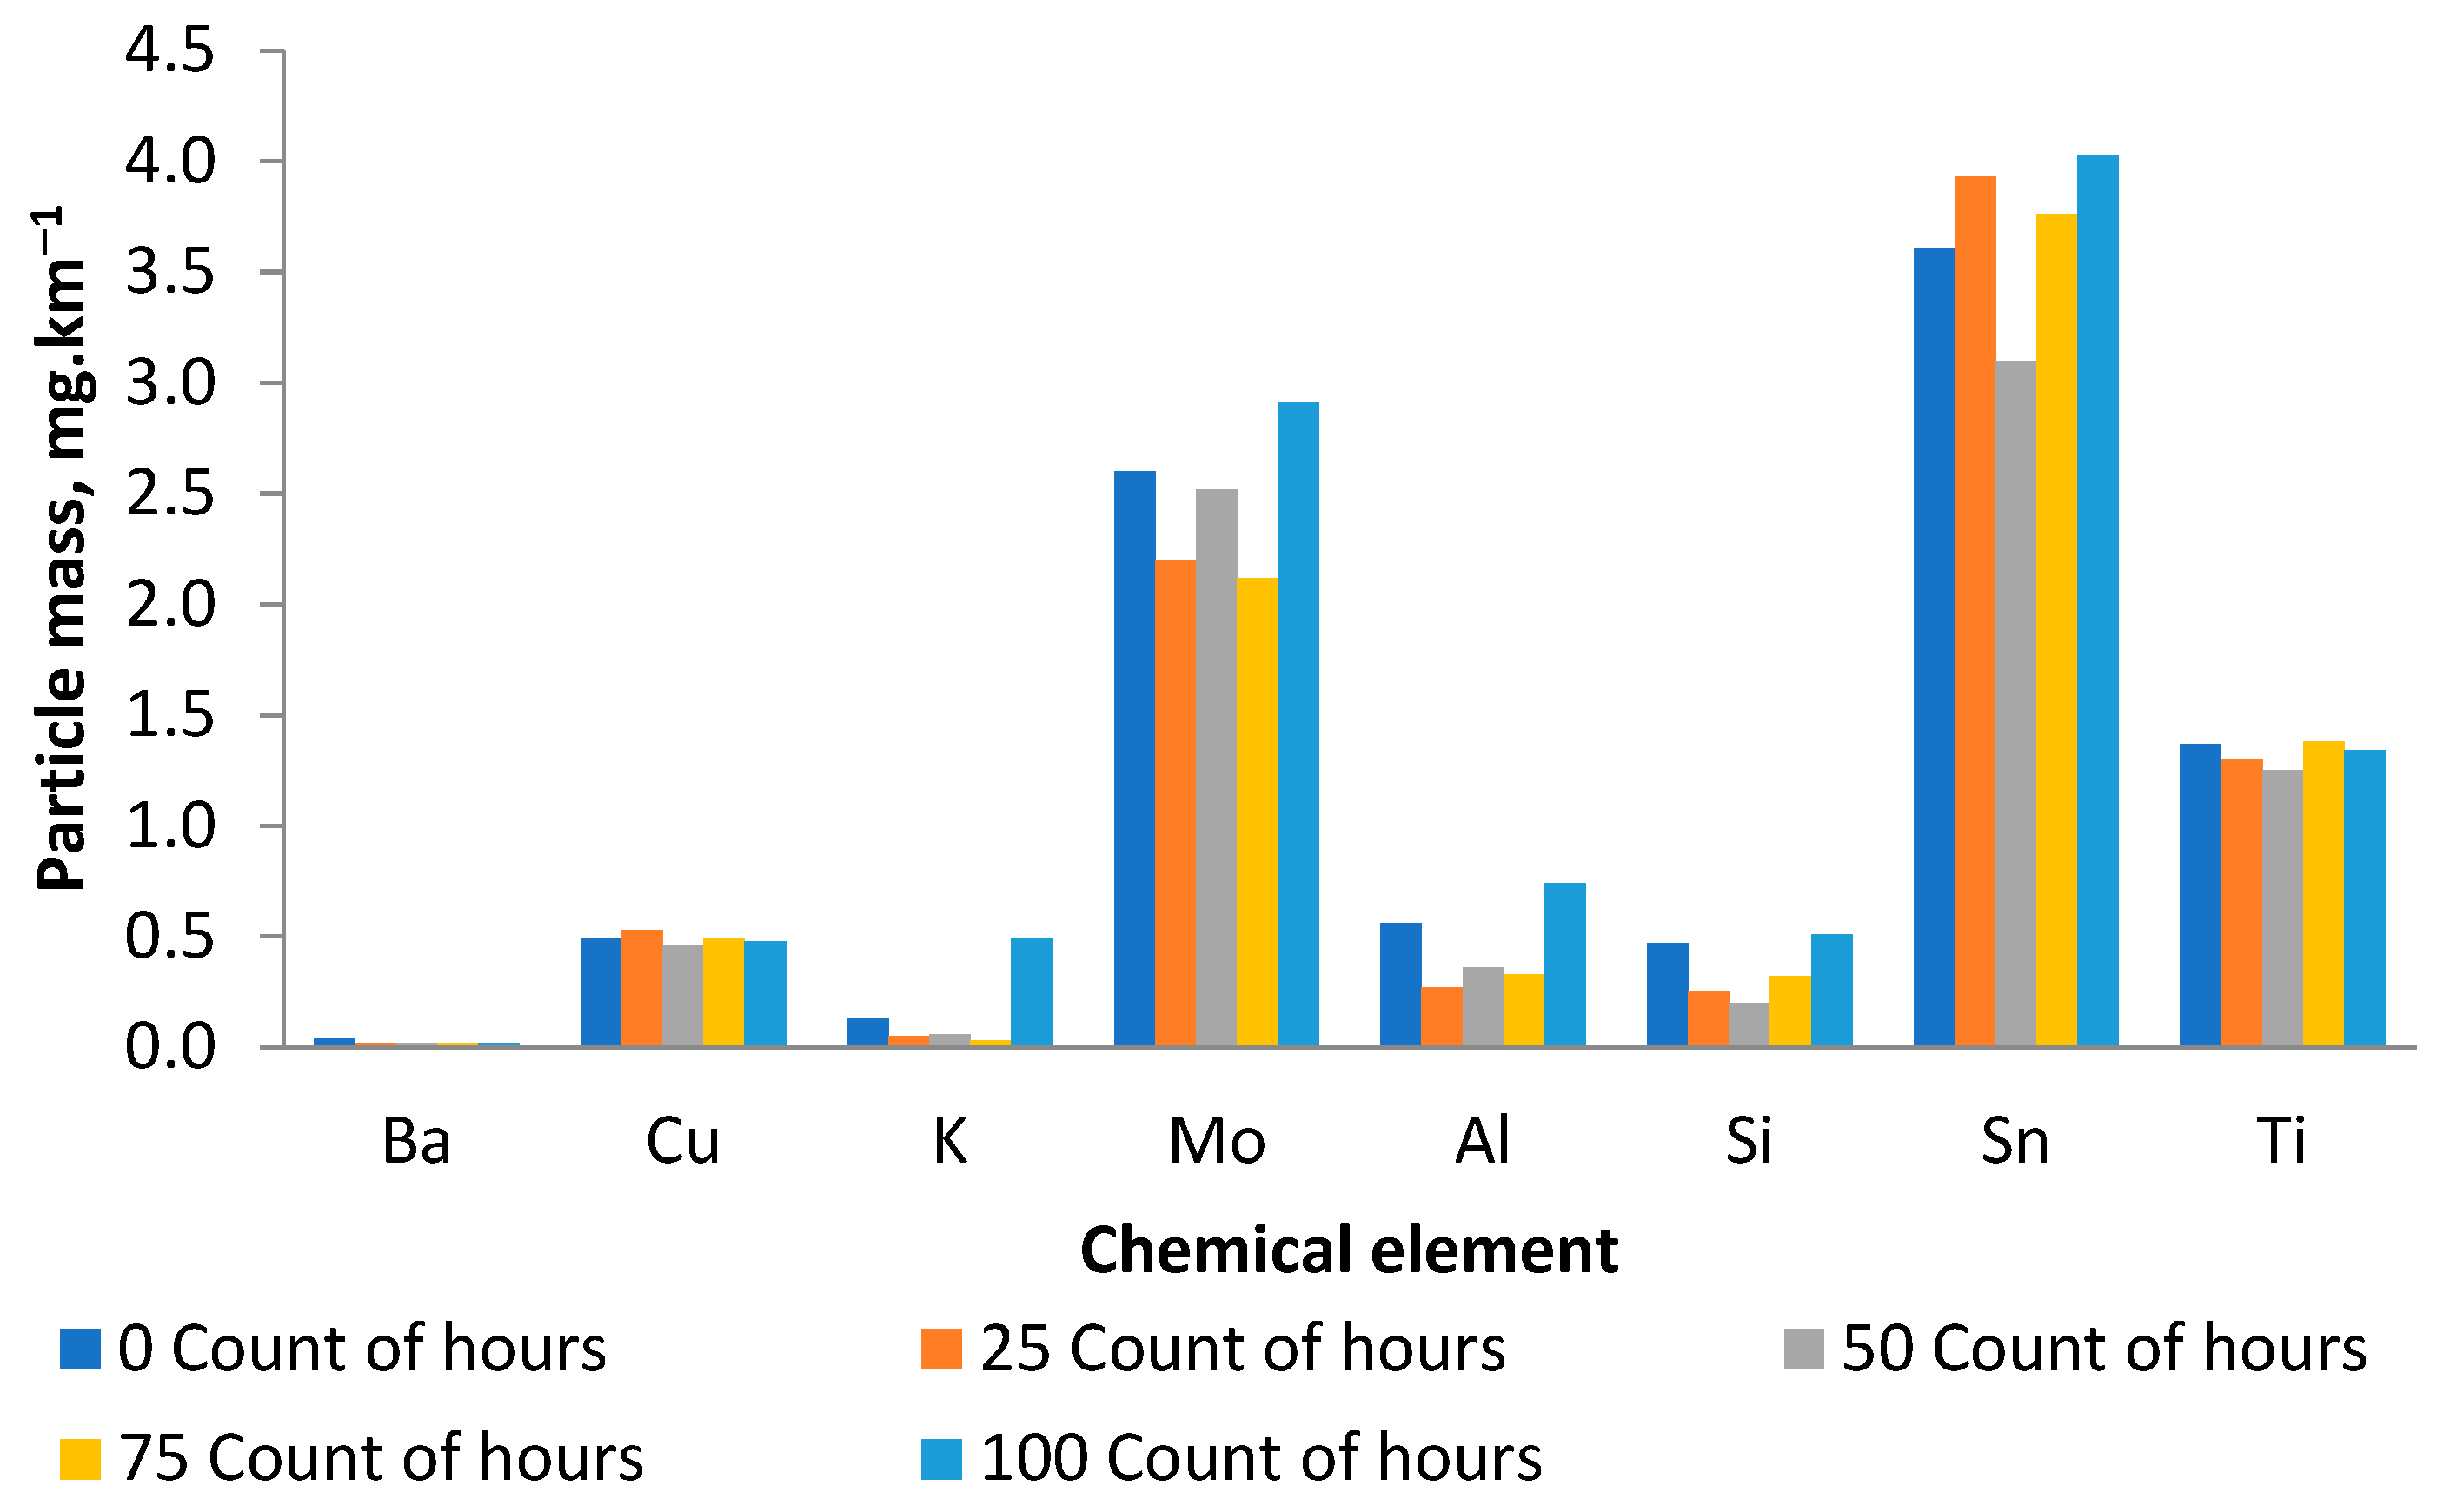
The largest increases in pollutant elements were found for potassium (K), tin (Sn) and sodium (Na). The above elements are mainly found in bearing and sleeve deposits. The increase is not significant, hence only operational wear of the gear hydraulic pump occurs.
(4).
We can confirm the presence of cutting, sliding, fatigue and non-metallic particles based on the LaserNet Fines evaluation.
(5).
The kinematic viscosity at 40 °C and at 100 °C did not exceed the limit value of 20% set by ISO 15380:2016.
(6).
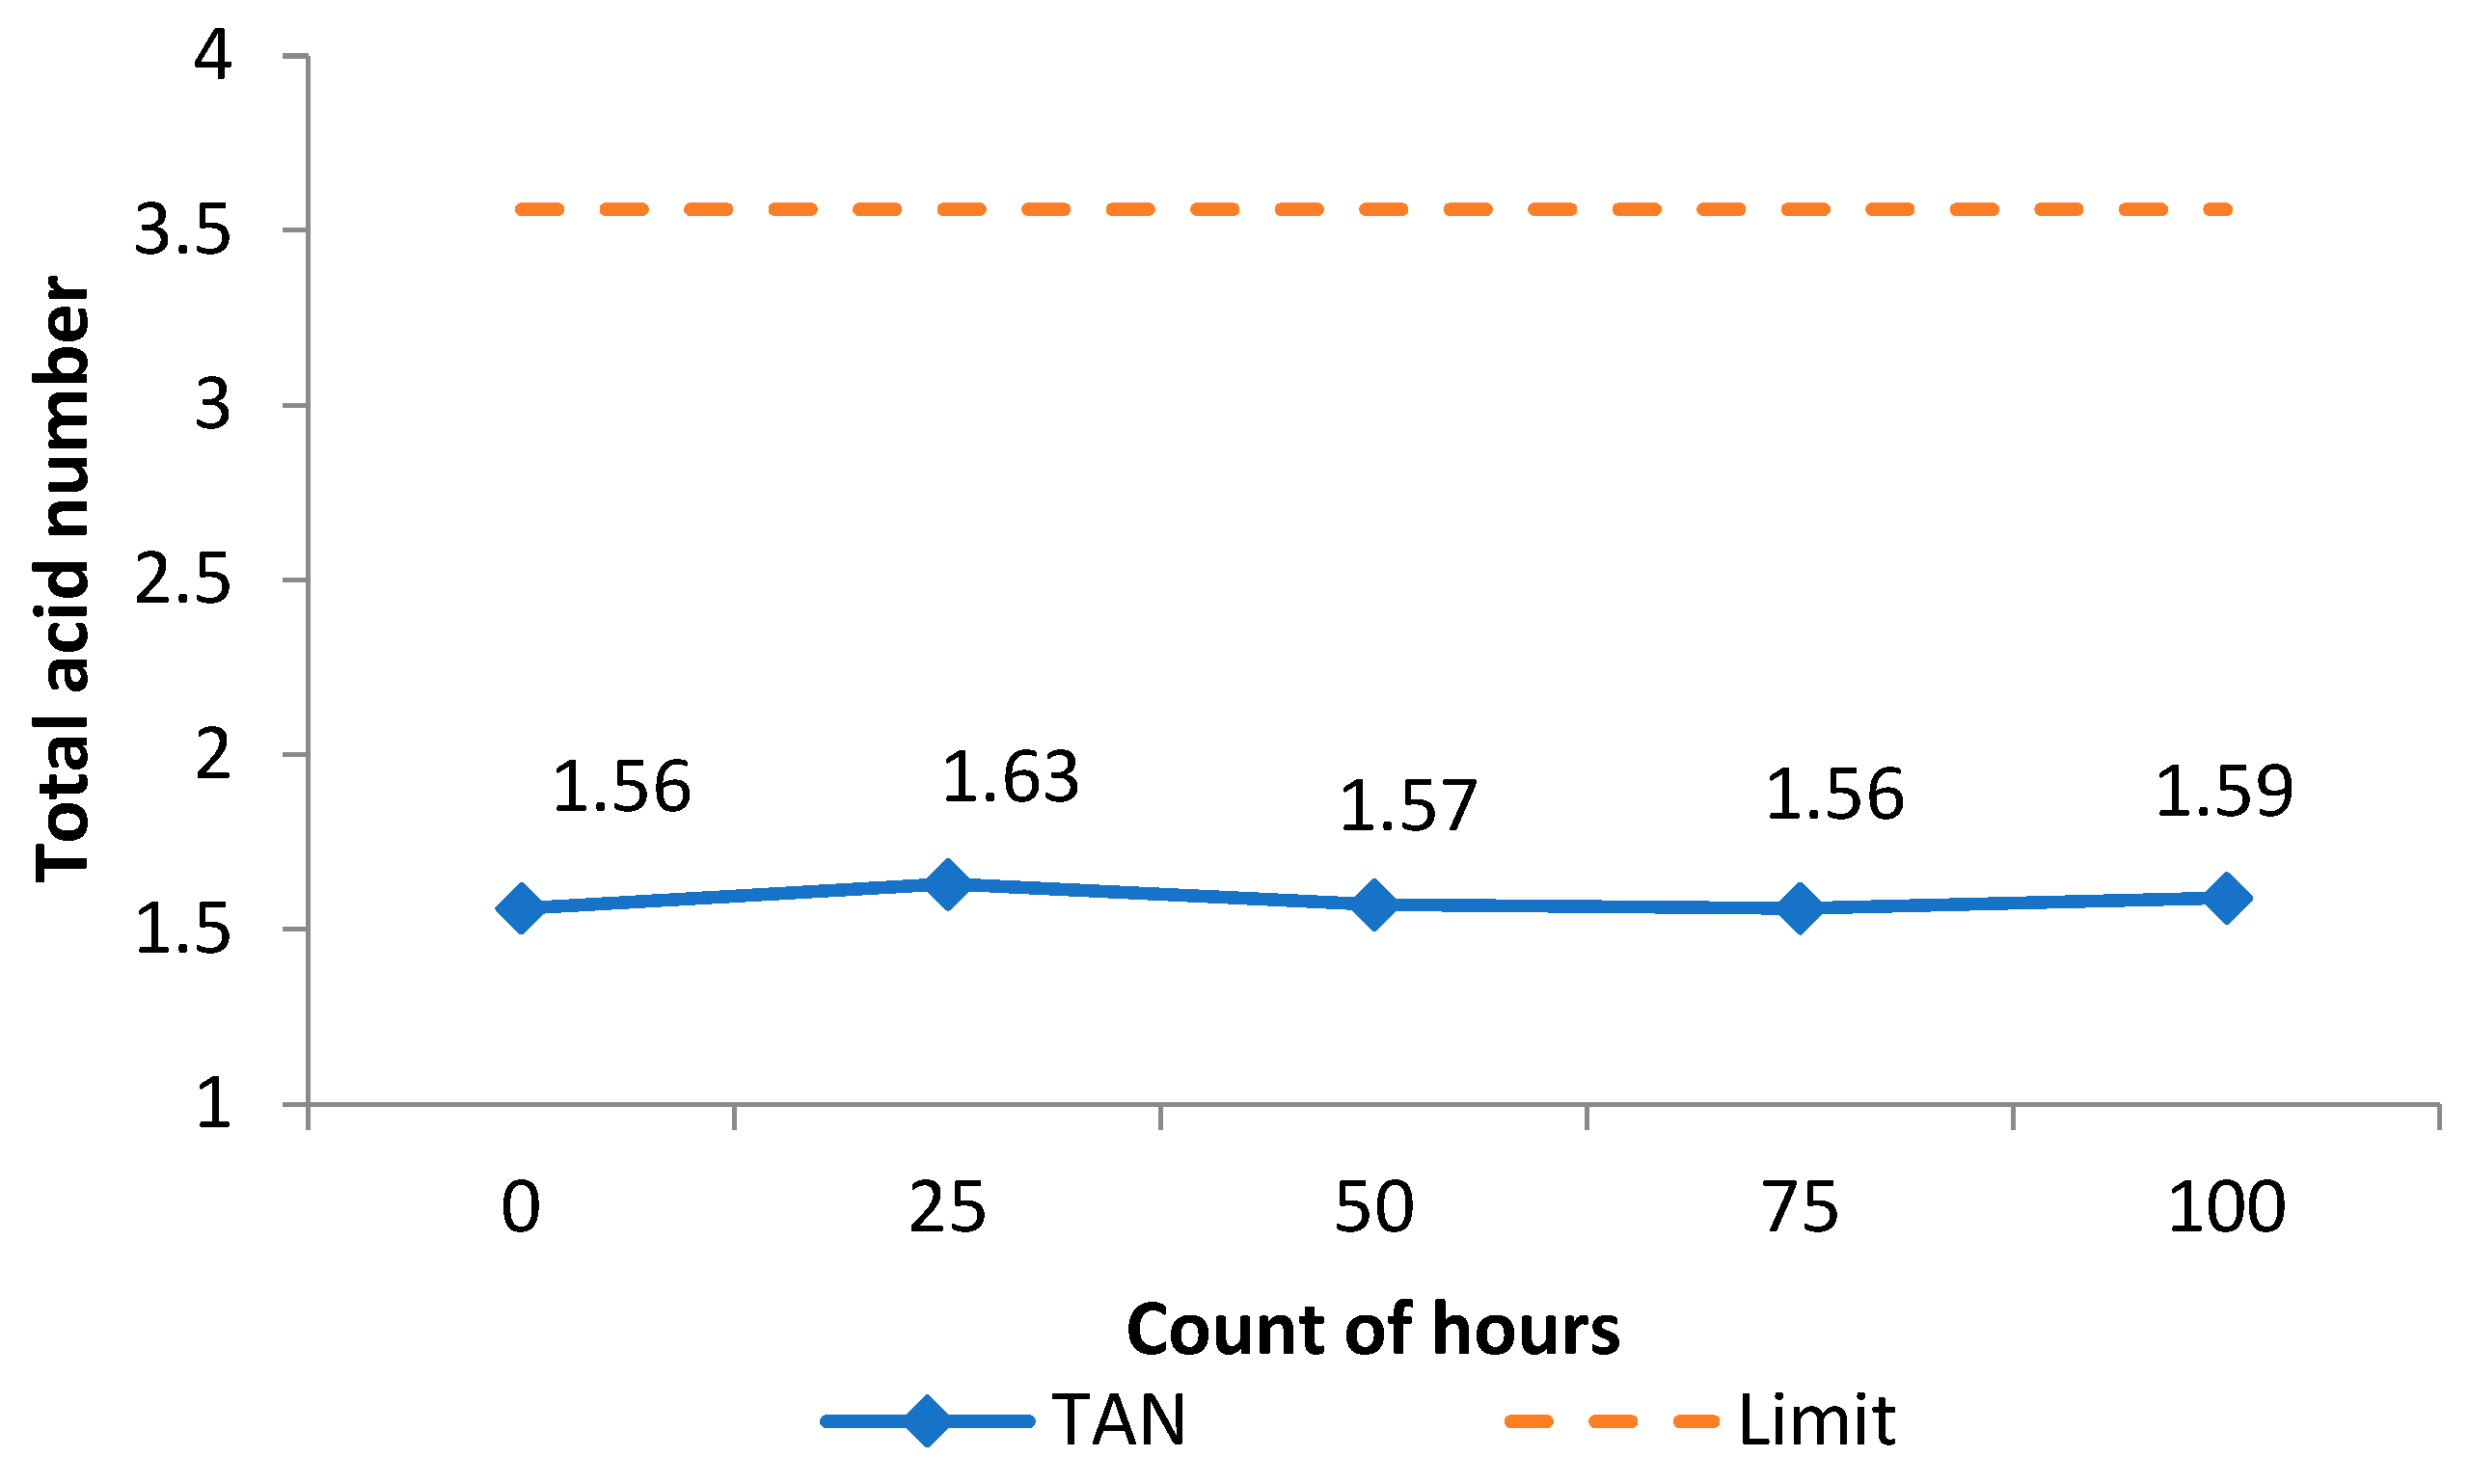
The acid number of the hydraulic fluid did not exceed the limit value given by ISO 15380:2016.
In the contribution, an analysis of the influence of the environmentally friendly liquids on the operation of the gear hydraulic pump during the laboratory test was carried out. The test was conducted at the critical temperature of the used fluid (95 °C) and at the maximum operating pressure of the gear hydraulic pump (21 MPa). The purpose of the laboratory test was to assess the feasibility of using the ecological fluid in a specific hydraulic circuit with the gear hydraulic pump. Despite not exceeding the critical degradation limits of the fluid and observing minimal changes in flow efficiency, a significant effect on the wear behavior of the gear hydraulic pump was detected. This impact manifested in the formation of cutting and fatigue wear particles in the collected samples along with a noticeable decrease in kinematic viscosity. This fact occurred due to the performance of a laboratory test above the critical value of the use of the environmentally friendly liquids. For the further continuation of laboratory or operational tests of the mentioned environmentally friendly liquids, it is necessary to modify the structure of the liquid and increase the critical temperature of its use. Subsequently, long-term laboratory and operational tests which will verify the possibility of operational application of the mentioned environmentally friendly hydraulic fluid must be carried out.

Author Contributions

Conceptualization, J.K. and J.J.; Methodology, Z.T. and J.K.; Validation, Z.T. and J.T.; Formal analysis, G.Č., J.K. and J.J.; Investigation, M.H. and J.K.; Resources, M.H.; Data curation, J.K.; Writing—original draft preparation, Z.T., J.K. and J.J.; Writing—review and editing, J.T. and J.K.; Visualization, J.K. and G.Č.; Supervision, Z.T.; Project administration, Z.T. and J.T. All authors have read and agreed to the published version of the manuscript.

Funding

This research received no external funding.

Data Availability Statement

The original contributions presented in the study are included in the article, further inquiries can be directed to the corresponding author.

Acknowledgments

We greatly thank the editor and reviewers for their valuable comments to improve the quality of this paper.

Conflicts of Interest

The authors declare no conflicts of interest.

References

  1. Zharkevich, O.; Nikonova, T.; Gierz, L.; Reshetnikova, O.; Berg, A.; Warguła, L.; Berg, A.; Wieczorek, B.; Lykowski, W.; Nurzhanova, O. Improving the Design of a Multi-Gear Pump Switchgear Using CFD Analysis. Appl. Sci. 2024, 14, 5394. [Google Scholar] [CrossRef]
  2. Bilalov, R.; Smetannikov, O. Numerical Study of the Hydrodynamics of an External Gear Pump. J. Appl. Mech. Tech. Phys. 2022, 63, 1284–1293. [Google Scholar] [CrossRef]
  3. Liu, J.; Meng, S.; Zhou, X.; Gu, L. A Hydraulic Axial Piston Pump Fault Diagnosis Based on Instantaneous Angular Velocity under Non-Stationary Conditions. Lubricants 2023, 11, 406. [Google Scholar] [CrossRef]
  4. Findeisen, D.; Helduser, S. Ölhydraulik; Springer: Berlin/Heidelberg, Germany, 2015. [Google Scholar]
  5. Nikolov, N.; Mitov, A.; Kralov, I. Advanced 2D Computational Fluid Dynamics Model of an External Gear Pump Considering Relief Grooves. Appl. Sci. 2024, 14, 4299. [Google Scholar] [CrossRef]
  6. Zardin, B.; Natali, E.; Borghi, M. Evaluation of the Hydro-Mechanical Efficiency of External Gear Pumps. Energies 2019, 12, 2468. [Google Scholar] [CrossRef]
  7. Zhao, X.; Vacca, A. Multi-domain simulation and dynamic analysis of the 3D loading and micromotion of continuous-contact helical gear pumps. Mech. Syst. Signal Process. 2022, 163, 108116. [Google Scholar] [CrossRef]
  8. Zhang, L.; Wang, D.; Yang, G.; Pan, Q.; Shi, W.; Zhao, R. Optimization of Hydraulic Efficiency and Internal Flow Characteristics of a Multi-Stage Pump Using RBF Neural Network. Water 2024, 16, 1488. [Google Scholar] [CrossRef]
  9. Stawiński, L.; Kosucki, A.; Cebulak, M.; Górniak vel Górski, A.; Grala, M. Investigation of the influence of hydraulic oil temperature on the variablespeed pump performance. Eksploat. I Niezawodn. Maint. Reliab. 2022, 24, 289–296. [Google Scholar] [CrossRef]
  10. Kosiba, J.; Tkáč, Z.; Jablonický, J.; Shcherbak, V.; Ganushchak-Yefimenko, L.; Paumer, M.; Bukoros, T.; Čurgaliová, G.; Zachar, M. Experimental testing of the influence of the operating loading on the flow characteristics of hydraulic pump. Eksploat. I Niezawodn.–Maint. Reliab. 2022, 24, 19. [Google Scholar] [CrossRef]
  11. Tian, Z.K.; Li, H.R.; Sun, J.; Li, B.C. Degradation state identification method of hydraulic pump based on improved MF-DFA and SSM-FCM. Chin. J. Sci. Instrum. 2016, 37, 1851–1860. [Google Scholar]
  12. Ranganathan, G.; Hillson Samuel Raj, T.; Mohan Ram, P.V. Wear characterisation of small PM rotors and oil pump bearings. Tribol. Int. 2004, 37, 1–9. [Google Scholar] [CrossRef]
  13. Novak, N.; Trajkovski, A.; Polajnar, M.; Kalin, M.; Majdič, F. Wear of hydraulic pump with real particles and medium test dust. Wear 2023, 523, 532–533. [Google Scholar] [CrossRef]
  14. Guo, R.; Li, Y.; Shi, Y.; Li, H.; Zhao, J.; Gao, D. Research on Identification Method of Wear Degradation of External Gear Pump Based on Flow Field Analysis. Sensors 2020, 20, 4058. [Google Scholar] [CrossRef]
  15. Peng, Z.; Kessissoglou, N.J.; Cox, M. A study of the effect of contaminant particles in lubricants using wear debris and vibration condition monitoring techniques. Wear 2005, 258, 205101. [Google Scholar] [CrossRef]
  16. Klarecki, K.; Rabsztyn, D.; Czop, P. Modeling of Filtration Phenomenon in Hydrostatic Drives. Machines 2024, 12, 417. [Google Scholar] [CrossRef]
  17. Zio, E.; Peloni, G. Particle filtering prognostic estimation of the remaining useful life of nonlinear components. Reliab. Eng. Syst. Saf. 2011, 96, 403–409. [Google Scholar] [CrossRef]
  18. Siddique, M.A.A.; Kim, Y.-J.; Baek, S.-M.; Baek, S.-Y.; Han, T.-H.; Kim, W.-S.; Kim, Y.-S.; Lim, R.-G.; Choi, Y. Development of the Reliability Assessment Process of the Hydraulic Pump for a 78 kW Tractor during Major Agricultural Operations. Agriculture 2022, 12, 1609. [Google Scholar] [CrossRef]
  19. Novaković, B.; Radovanović, L.; Zuber, N.; Radosav, D.; Đorđević, L.; Kavalić, M. Analysis of the influence of hydraulic fluid quality on external gear pump performance. Eksploat. I Niezawodn. Maint. Reliab. 2022, 24, 260–268. [Google Scholar] [CrossRef]
  20. Corvaglia, A.; Ferrari, A.; Rundo, M.; Vento, O. Three-dimensional model of an external gear pump with an experimental evaluation of the flow ripple. Proc. Inst. Mech. Eng. Part C J. Mech. Eng. Sci. 2021, 235, 1097–1105. [Google Scholar] [CrossRef]
  21. Okoro, E.E.; Iwuajoku, S.; Sanni, S.E. Performance Evaluation of Biodiesel Produced from Waste Tire Pyrolytic Oil as a Lubricant Additive in Oil Drilling Systems. Recycling 2020, 5, 29. [Google Scholar] [CrossRef]
  22. Hashim, W.M.; Al-Salihi, H.A.; Al Zubaidi, F.N. Effects of temperature on the properties of HL32 oil in conventional hydraulic actuators. Heliyon 2022, 8. [Google Scholar] [CrossRef] [PubMed]
  23. ASTM D6866; Standard Test Methods for Determining the Biobased Content of Solid, Liquid, and Gaseous Samples Using Radiocarbon Analysis. ASTM: West Conshohocken, PA, USA, 2002.
  24. DKD-K-04701; Calibration of Flow Rate Meter. DKD: Braunschweig, Germany, 2014.
  25. DIN EN ISO 9001; Quality Management Systems. ISO: Geneva, Switzerland, 2015.
  26. ASTM D6595; Standard Test Method for Determination of Wear Metals and Contaminants in Used Lubricating Oils or Used Hydraulic Fluids by Rotating Disc Electrode Atomic Emission Spectrometry. ASTM: West Conshohocken, PA, USA, 2017.
  27. Yoshida, N.; Inaguma, N. Mathematical Analysis of Efficiencies in Hydraulic Pumps for Automatic Transmissions. SAE Int. J. Passeng. Cars-Mech. Syst. Vol. 2013, 6, 54–73. [Google Scholar] [CrossRef]
  28. Inaguma, Y.; Yoshida, N. Variation in Driving Torque and Vane Friction Torque in a Balanced Vane Pump; SAE Technical Paper; SAE International: Warrendale, PA, USA, 2014. [Google Scholar] [CrossRef]
  29. ISO 15380:2016; Lubricants, Industrial Oils and Related Products (class L)—Family H (Hydraulic Systems)—Specifications for Hydraulic Fluids in Categories HETG, HEPG, HEES and HEPR. ISO: Geneva, Switzerland, 2015.
  30. Non-Newtonian Models. Available online: https://www.simscale.com/docs/simulation-setup/materials/non-newtonian-models/ (accessed on 29 July 2024).
  31. Decote, P.A.P.; Negris, L.; Vidoto, A.P.; Mendes, L.A.N.; Floresm, E.M.M.; Vicente, M.A.; Santos, M.F.P. Determination of the total acid number of Brazilian crude oil samples: Theoretical and experimental evaluation of three standard methods. Fuel 2022, 313, 122642. [Google Scholar] [CrossRef]
Figure 1. Schematic diagram of the test equipment (EM—electric motor, HP—hydraulic pump, p—pressure sensor, PV—pressure valve, Q—flow sensor, C—cooler, F—filter, T—tank).
Lubricants 12 00304 g001
Figure 2. Calibration protocol of the ETS 4148-H-006-000 flow meter.
Lubricants 12 00304 g002
Figure 3. Spectroil Q100 Elemental Spectrometer.
Lubricants 12 00304 g003
Figure 4. LNF-C particle classifier.
Lubricants 12 00304 g004
Figure 5. Increase in liquid flow in the hydraulic circuit depending on the revolutions of the hydraulic pump.
Lubricants 12 00304 g005
Figure 6. Course of volumetric efficiency depending on the revolutions of the hydraulic pump.
Lubricants 12 00304 g006
Figure 7. Comparison of volumetric efficiencies at the beginning and end of the laboratory test.
Lubricants 12 00304 g007
Figure 8. Degradation process of the chemical elements.
Lubricants 12 00304 g008
Figure 9. Kinematic viscosity at 40 °C.
Lubricants 12 00304 g009
Figure 10. Kinematic viscosity at 100 °C.
Lubricants 12 00304 g010
Figure 11. Total acid number.
Lubricants 12 00304 g011
Table 1. Technical parameters of the hydraulic pump.
ParameterUnitValue
Actual displacementcm317.24
Inlet pressuremin.MPa−0.03
max.MPa0.05
Maximum pressureMPa29
Speednominalmin−11500
minimummin−1350
maximummin−13200
Flow at nominal speedmin−123.5
Maximum input powerkW33.6
Nominal input powerkW16.1
Volumetric flow rate at maximum speeddm3.min−154.3
Volumetric flow rate at nominal speed dm3.min−123.2
Volumetric efficiency %92
Table 2. Flow characteristics of the hydraulic pump.
Speed, min−1Count of Hours
0255075100
5007.487.737.867.957.99
75011.4811.7411.9112.1212.25
100015.5315.7915.9116.1916.39
125019.6219.9620.3420.3620.52
150023.7023.8823.9924.5824.73
175027.7528.4228.6228.8529.00
200031.7732.9833.0833.2833.34
225035.6437.2937.3837.4937.53
250039.6241.4741.5141.6741.72
275043.6745.7445.8045.9446.10
Table 3. Classification of wear particles according to LaserNET Fines.
Number of Hours WorkedAbrasion Particles (20 µm–100 µm)
Cutting ParticlesSlippery ParticlesFatigue ParticlesNon-Metallic Particles
024.327.221.331.8
2525.630.123.833.1
5028.830.224.235.7
7529.135.324.636.1
10030.236.128.738.5
Disclaimer/Publisher’s Note: The statements, opinions and data contained in all publications are solely those of the individual author(s) and contributor(s) and not of MDPI and/or the editor(s). MDPI and/or the editor(s) disclaim responsibility for any injury to people or property resulting from any ideas, methods, instructions or products referred to in the content.

