Article

Premature Damage in Bearing Steel in Relation with Residual Stresses and Hydrogen Trapping

1
Fraunhofer Institute for Mechanics of Materials IWM, Wöhlerstraße 11, 79108 Freiburg, Germany
2
Department of Industrial Engineering, German Jordanian University, P.O. Box 35247, Amman 11180, Jordan
3
OSK-Kiefer GmbH, Göppertshausen 5-6, 85238 Petershausen, Germany
4
Institute for Applied Materials—Reliablity and Microstructure, Karlsruher Institute of Technology, Straße Am Forum 7, 76131 Karlsruhe, Germany
*
Authors to whom correspondence should be addressed.
Lubricants 2024, 12(9), 311; https://doi.org/10.3390/lubricants12090311
Submission received: 29 June 2024 / Revised: 27 August 2024 / Accepted: 29 August 2024 / Published: 3 September 2024
(This article belongs to the Special Issue Tribology in Germany: Latest Research and Development)

Abstract

:
In this study, premature damage in cylindrical roller bearings made of 100Cr6 (SAE 52100) was investigated. For this purpose, full bearing tests were carried out using two different lubricant formulations with similar viscosities. Published research has pointed out the occurrence of tribo-chemical reactions that cause lubricant degradation and the release of hydrogen in tribo-contact. Hydrogen content measurements were conducted on tested samples, and these measurements showed dependence on the lubricant formulations. Hydrogen diffusion and trapping were identified as significant factors influencing premature damage. The measurement of trapping energies was conducted by thermal desorption spectroscopy, whereas residual stresses, which influence hydrogen diffusion and accumulation, were measured using X-ray diffraction. The measured trapping energies indicated that rolling contact caused the creation and release of hydrogen traps. Over-rolling resulted in changes in residual stress profiles in the materials, demonstrated by changes in stress gradients. These can be directly linked to subsurface hydrogen accumulation. Hence, it was possible to determine that the location of the microstructural damage (WEC) was correlated with the residual stress profiles and the subsurface von Mises stress peaks.

1. Introduction

Rolling bearings are used in a wide range of applications ranging from their use in miniature bearings to wind turbines. Premature failures manifested by white etching cracks (WEC) have been identified in bearings of various sizes, applications, and service lives [1,2,3]. Premature failure is usually unpredictable, as it does not follow classical rolling-contact fatigue (RCF) calculation methods, leading to costly and time-consuming downtimes for maintenance.
WEC are characterized by wide networks of cracks associated with white crack flanks, known as white etching areas (WEA), in the subsurface region of the raceways [4,5,6]. Previous studies have argued that WEA are a form of nanocrystalline BCC iron microstructure [7,8,9]. Under cyclic load, WEC usually propagate and progress to brittle flaking of the surface of the components and a loss of functionality.
Various factors have been argued to be the root causes of this type of damage [10], one of which is the choice of bearing material. The conventional and affordable rolling bearing steel 100Cr6/SAE 52100 has shown poor resistance to WEC [11,12]. Literature findings indicate that hydrogen diffusion into bearing steel affects early failures [13], which is the focus of the present work. Hydrogen-assisted rolling-contact fatigue (HARCF) is associated with the occurrence of white etching cracks in bearing components. Besides hydrogen, the combination of stresses and microstructural aspects [14,15] are found in the literature to be correlated with the formation of WEC. Moreover, the research has also suggested that a negative slide–roll ratio significantly influences the formation of WEC [16]. It was demonstrated that a combination of mechanical stresses and accumulated hydrogen in the microstructure is decisive in triggering HARCF [17,18]. Possible sources of hydrogen in a bearing system may be water contamination of the lubricant [6,12], as well as tribochemical reactions resulting in lubricant degradation and the eventual release and increased accumulation of hydrogen [19], especially in the presence of certain lubricant additives such as zinc dithiophosphate (ZDDP) and overbased calcium sulfonate (OBCaSul) [20,21]. The passage of current through the bearing was also shown to trigger the formation of WEC [22]. It should be noted that the damage cannot only be attributed to hydrogen but also to the combination of load, overrolling, and plastic deformation [14]. The formation of pores and newly formed grain boundaries in tested samples were associated with the usage of specific lubricants [3,23].
The influencing factors affecting hydrogen accumulation in bearing steel are hence important to investigate. These mainly include concentration gradients, stress gradients, and residual stresses in the material [24,25,26]. Hydrogen trapping in steel may also considerably affect the accumulation of hydrogen. In this study, RCF tests were carried out using two lubricant mixtures. Consequently, residual stresses were measured using X-ray diffraction analysis (XRD), and the hydrogen content and trapping energies were measured using thermal desorption analysis (TDA) of the tested samples. The trapping energy was measured to investigate the correlation between microstructural alterations and the absorbed hydrogen. Trapping energies can give insight into the type of hydrogen traps being filled in the process of overrolling using two different lubricant formulations. A distinction can also be made as to whether reversible (<35 kJ/mol) or irreversible traps (>35 kJ/mol) are being occupied in the process. Free diffusing hydrogen only has around 10 kJ/mol. Grain boundaries, martensite lath boundaries, and dislocations are considered reversible traps, with trapping energies of up to 35 kJ/mol. Irreversible traps, such as vacancies, titanium carbides, and MnS interfaces, act as traps, with higher trapping energies of more than 50 kJ/mol [27,28,29]. Furthermore, the findings of this study will help in identifying the influence of residual stresses and hydrogen trapping affecting HARCF.

2. Materials and Methods

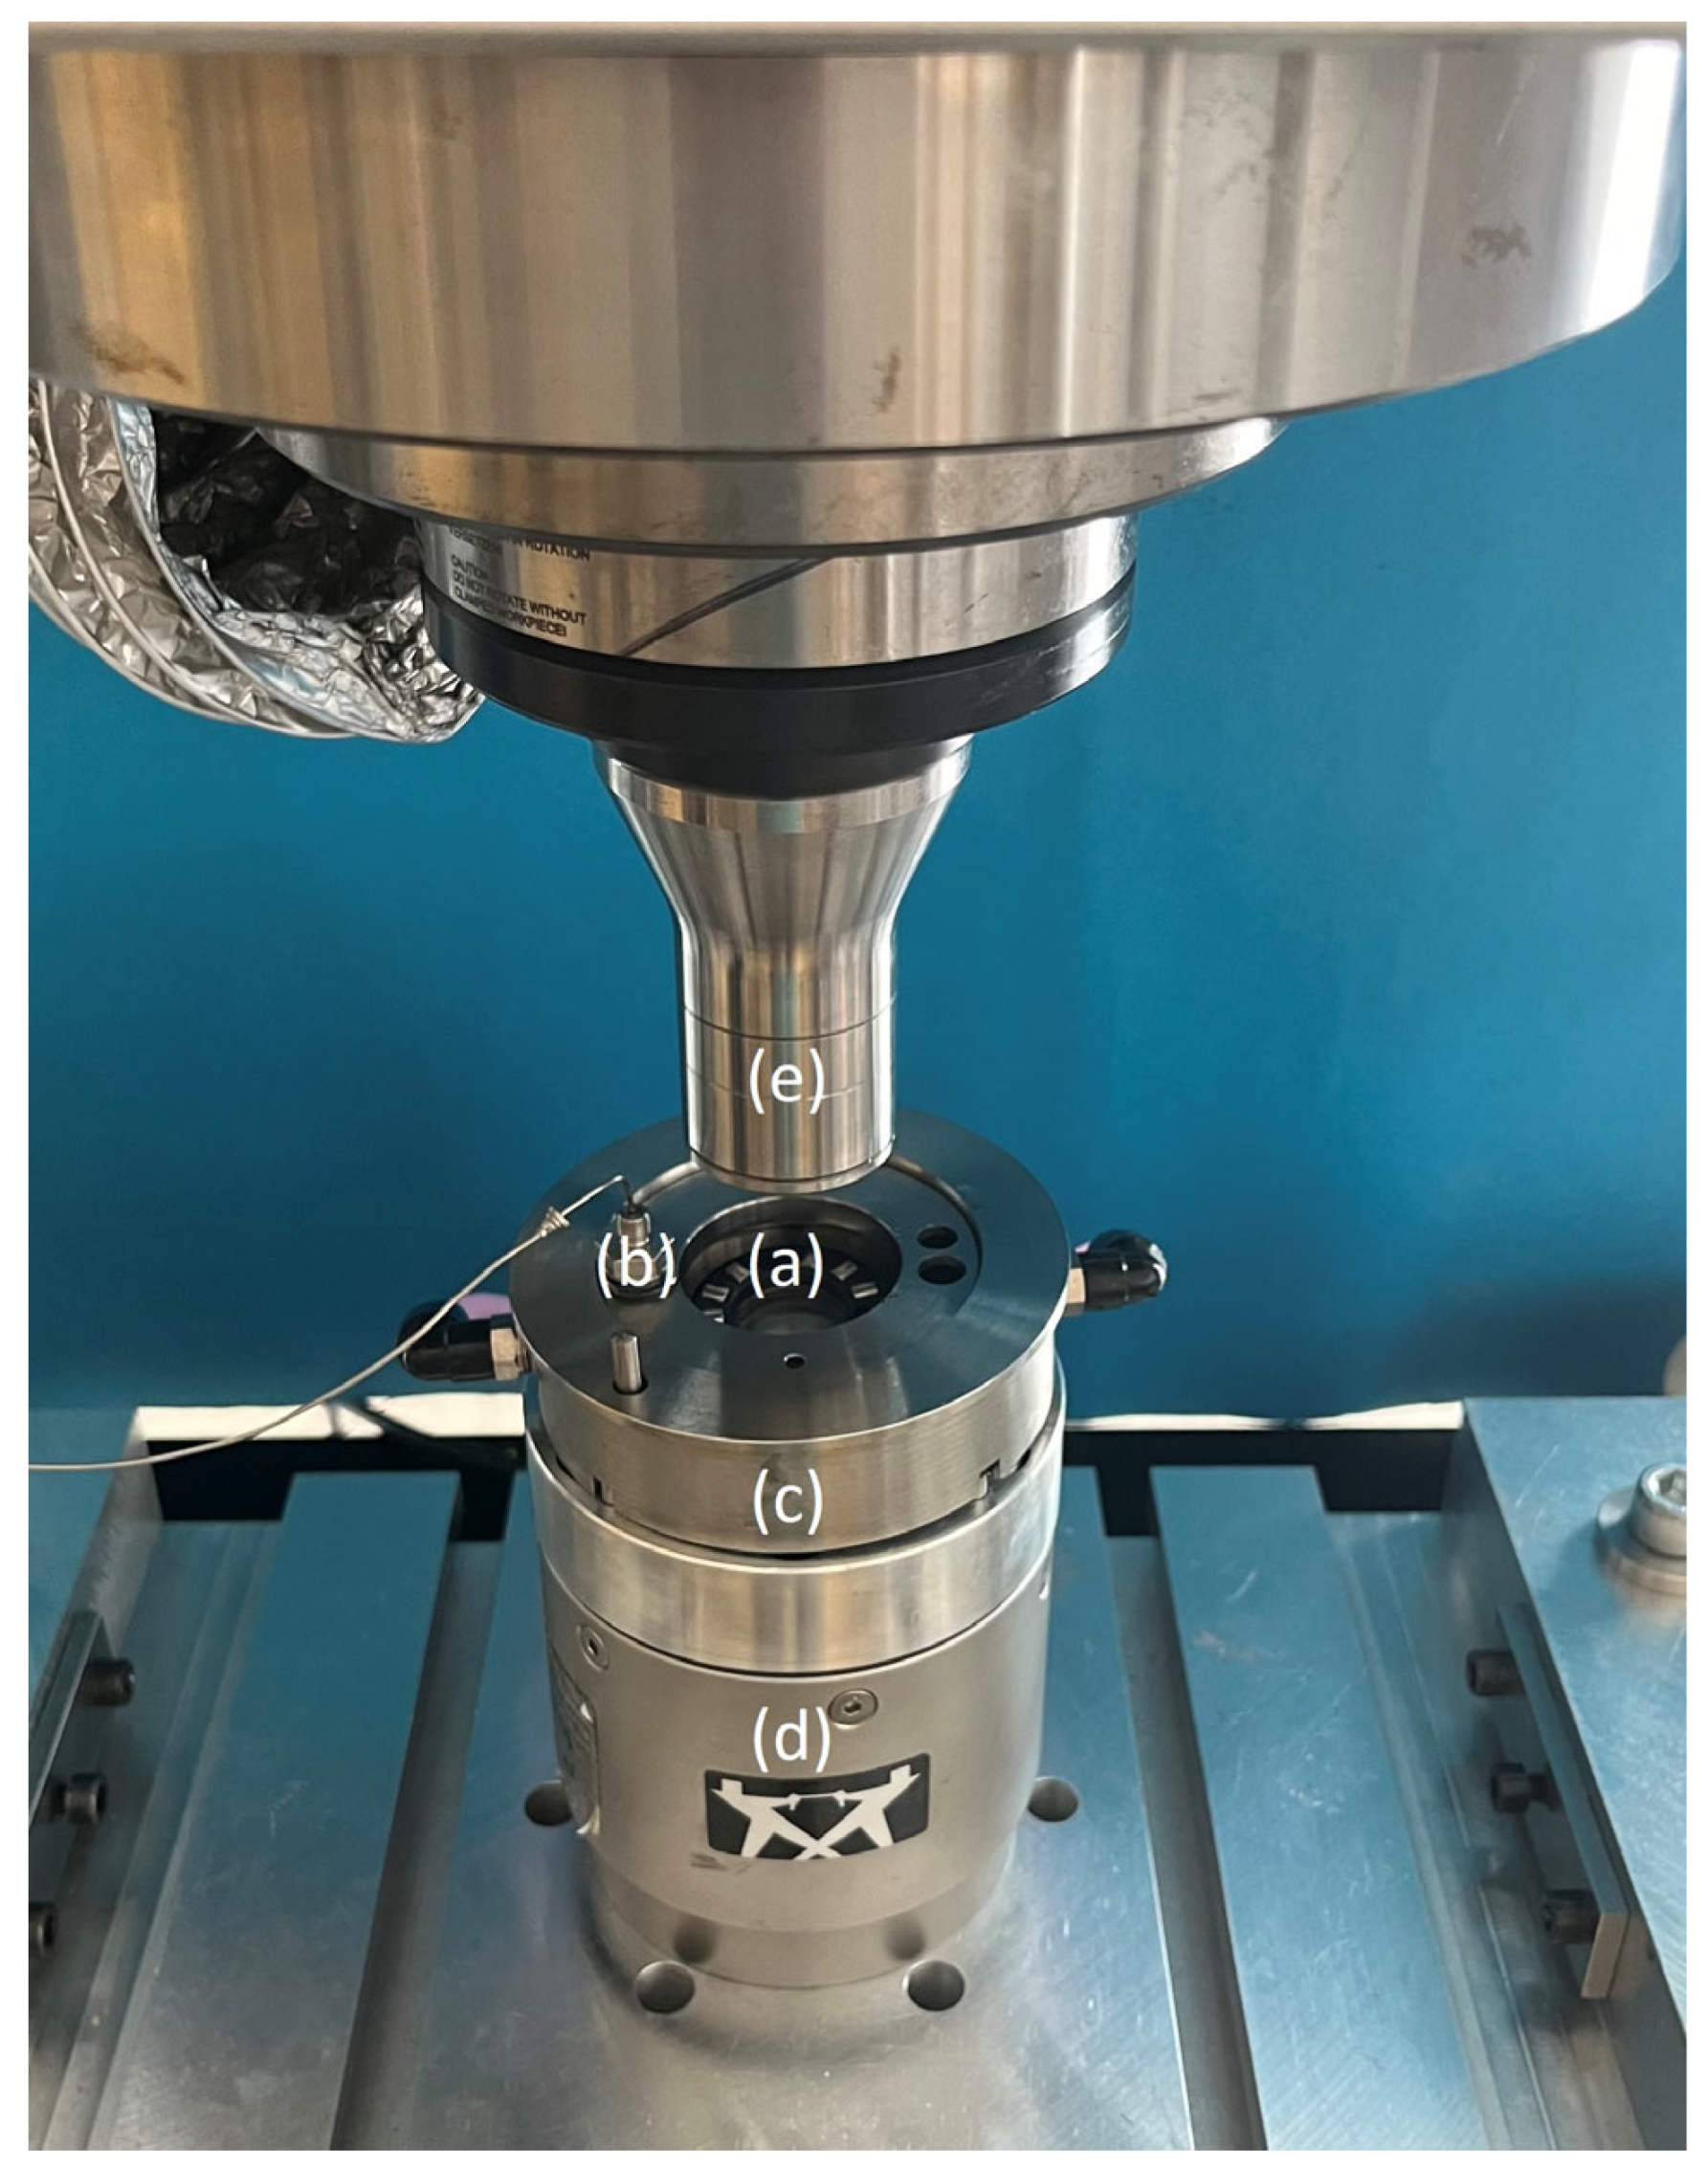
2.1. Full Bearing Tests

In this study, axial cylindrical roller thrust bearings (CRTBs) were tested under flooded oil lubrication [26]. For the bearing experiments, the test setup in Figure 1 was mounted on a biaxial universal test rig. The measurement of normal force and torque is performed with a Instron Dynacell load cell (±25 kN/100 Nm) and an Instron FastTrack 8800 controller, monitored by LabView 6, with a storage frequency of 1 Hz. The tests were carried out at 700 rpm and 90 °C. In this study, two different lubrication mixtures were tested: a low reference oil (low-ref), which is known to be associated with WEC damage, and a high reference (high-ref) oil; both oils possess similar viscosity. The lubricants are comparable to those in the Research Association for Drive Technology (FVA) reference oil catalogue in terms of the FVA reference oil classifications. The low ref oil contains the additives ZDDP and OBCaSul, and the high ref contains an FVA test additive, which prevents premature failure.
The test rig is designed for testing type 81104-TV CRTBs made of 100Cr6/SAE 52100 steel, undergoing a hardened martensitic heat treatment. The surface hardness was found to be 754 ± 9 (HV10) on the roller and 760 ± 9 (HV10) on the raceway. The roughness Ra was measured using a stylus profilometer and was determined to be 0.04 ± 0.01 µm on the roller and 0.09 ± 0.01 on the washer. The bearings have an inner diameter of 20 mm and an outer diameter of 35 mm. Each bearing contains 13 rollers, 4.5 mm in length and diameter. Due to the geometry of the bearing, a negative slip of ~0.16 occurs at the outer edge of the roller and positive slip of ~0.16 at the inner edge. Three rollers were removed from the bearing cage before testing, leaving ten rollers in each tested bearing. Consequently, the normal force is distributed over ten rollers only; the maximum Hertzian contact pressure is 1.7 GPa; and the C/P ratio, which is the ratio of dynamic load rating to dynamic equivalent load, used to estimate the service life, is approximately 1.8. The viscosity ratio κ is 0.4. These conditions lead to a predicted nominal lifetime of approximately 500 h [30]; hence, premature damage (associated with WEC formation) is expected to occur under reasonable test durations.
Test runs with increasing run times were carried out to study the difference in hydrogen accumulation and trapping using the two lubricant formulations. The tests were carried out for 25 h (6.2 × 10⁶ cycles on the rollers) and 50 h (12.4 × 10⁶ cycles). Tests that did not show signs of bearing damage or failure were extended up to 300 h (74.4 × 10⁶ cycles).

2.2. Metallographic Investigations

The microstructural analysis was carried out on the cylinder rollers of the tested bearings. For this purpose, three rollers per test duration were studied via sectioning analysis, in which a cross-sectional analysis in increments of 0.3 to 0.5 mm, starting from the outer edge with negative slip, were performed. The process is demonstrated in Figure 2. The mirror-smooth surface was then etched with a solution of picric acid to reveal the grain boundaries. Thus, not only the depth under the surface can be seen, but also the degree of damage in different locations in the axial direction can be achieved. For this investigation, three rollers per test duration were investigated, and both negative and positive slip zones were identified and examined.

2.3. X-ray Diffraction Analysis (XRD)

The residual stress profile is relevant for the accumulation of hydrogen because the diffusion of hydrogen is driven by both concentration gradients and stress gradients (i.e., stress-assisted diffusion) [25,26].
The measurements were conducted using Xstress 3000, Type G2, from Stresstech (Jyväskylä, Finland), using two linear detectors. The physical principle, on which the X-ray residual stress measurement is based, is the diffraction of monochromatic X-rays on crystal lattices. If X-rays of a certain wavelength λ hit a crystal lattice with a specific lattice plane spacing D at a certain angle θ, constructive interference results, according to Bragg’s equation [31].
n · λ = 2 D · sin θ
In the case of ferrite, this diffraction peak occurs at an angle of 156.4° for the (211) lattice planes in a stress-free state with Cr-Kα1-radiation (λ = 2.2897 Å). A total of 14 measurements, at 13 different tilt-angles between +45° and −45° in the rolling direction (0°) and against the rolling direction (90°), were measured. Since the measured materials are usually not available as single crystals, this relatively simple measuring principle becomes considerably more complex when considering different crystal orientations measured simultaneously. The measured X-ray peaks were then evaluated using the sin 2 ψ method [32]. A Young’s modulus of 211,000 MPa was taken as the reference.
The measurement was performed on the raceway. The residual stresses were determined to a depth of 200 µm under the contact surface and in finer increments directly under the surface. The material removal was achieved via electrochemical etching using a slightly modified KRISTALL 650 from QATM (Mammelzen, Germany), which ensures minimal influence on residual stresses.

2.4. Thermal Desorption Analysis (TDA)

For measuring the accumulated hydrogen content in the bearing elements, thermal desorption analysis was conducted using a Bruker G40 and a connected mass-spectrometer by InProcess Instruments (Bremen, Germany). After the test, the bearing rollers were instantly immersed in liquid nitrogen to decelerate hydrogen effusion. To make sure that there was no residual layer oil or its additives on the surface, the surface of the sample was slightly ground using 320 grit sanding paper directly after clearing it in ethanol and cleaned with acetone afterwards. Then, the prepared sample was placed in the quartz tube, and the measurement began. The sample was heated as fast as possible to a temperature of 800 °C, and the effused hydrogen was measured with the mass spectrometer. The amount of hydrogen was measured against a reference sample, and the calculated value was divided by the sample weight to give the hydrogen content in the sample.
TDA was chosen as the analysis method because it also provides the opportunity to obtain trapping energies [28,33]. To determine trapping energies, multiple measurements with various heating rates must be acquired. Different heating rates result in a peak shift of the hydrogen signal, which can be used to determine a binding energy by calculating the slope of the regression line of these data points, implemented in an Arrhenius plot. Equation (1) was used to determine the trapping energy, as follows:
d ln φ / T p 2 d 1 / T p = E A R
where φ represents the heating rate in K/s, T p is the temperature at which the peak forms, R is the ideal gas constant, and E A is the activation or binding energy of the corresponding trapping site. Thus, multiplying the slope of the regression line with the ideal gas constant yields the binding energy of the particular site. In this study, the heating rates of 20, 40, and 80 K/min were used. Exemplary TDA measurement of one roller at a heating rate of 20 K/min is showed in Figure 3. When plotting the intensity over the temperature, it becomes clear that there is more than one peak to analyze. Through deconvolution of the curve, three different peaks are identified [28,34]. The smoothed curve is approximated with non-linear curve fitting according to Gaussian peaks, used because they achieved the best fit to the curve. As seen in Figure 3, Peak 1 appears at about 400 °C, Peak 2 forms at about 550 °C, and Peak 3 is the peak at the highest temperature of about 650 °C. Obviously, the peak depends on the applied heating rate. The intensity can be calculated to a desorption rate through multiplication with the calibration factor, which was consistent at the different measurements.

3. Results

3.1. Experimental Results

The friction torque is shown in Figure 4. The friction torque was very consistent for the ten tests using each lubricant; however, there is a difference noted for the running-in behavior of the oils. The high-ref oil shows little to no running-in behavior, while a strong running-in behavior was observed with the low-ref oil. This shows, by way of example, that the mean value of the coefficient of friction converges to a very similar level. The difference between the lubricants lies in the fact that there is a strong running-in behavior with the low ref oil, which does not exist with the high ref oil.
Table 1 lists the test durations using both low ref and high ref oil. It should be noted that the maximum achievable duration with the low ref oil was about 70 h. The longer tests with high ref oil were initially stopped after 150 h; the tested samples did not reveal any signs of visible microstructural alternations and hence, the test duration was adjusted to 300 h.

3.2. Microsection of Rollers

In Figure 5, microsections of selected bearing rollers are shown after different testing durations. The distance to the outer edge of the roller is shown (in mm) in the images below. Independent of the runtime, at a distance of 0.5 mm from the outer edge, no damage can be identified. With the low-ref oil, a slight subsurface damage can be found after just 25 h of runtime. At a 1 mm axial distance, the first signs of damage appeared 10 to 50 µm below the surface after a test duration of 25 h. In contrast to these results, severe subsurface damages occurred after a 50 h runtime. After 50 h, severe propagation of the material cracks were observed in the subsurface region up to 200 µm under the surface. Also, WEC was found in these samples, although there was no damage visible on the contact surface. After approximately 70 h, the bearing rollers failed and showed severe flaking damage on the surface. There were large areas exhibiting WEAs, which were surrounded by long networks of cracks. At 1.5 mm to the outer edge of the roller, there were also some subsurface cracks after only a 25 h runtime, with severe damage occurring in this region after a longer runtime. After 70 h, the rollers showed flaking damage on the surface. Due to the chipped off surface and subsurface region, the number of observed WECs and WEAs was lower than that noted in the test at 50 h. However, subsurface damage was still found in the damaged samples.
In contrast, there was no damage observed using the high ref. oil, as shown in Figure 6. After 300 h, dark etching regions (DER) were observed in the cross-sectional cuts of the rollers at a distance of 1.5 mm from the outer side of the rollers in the subsurface region, which indicates classical rolling-contact fatigue.

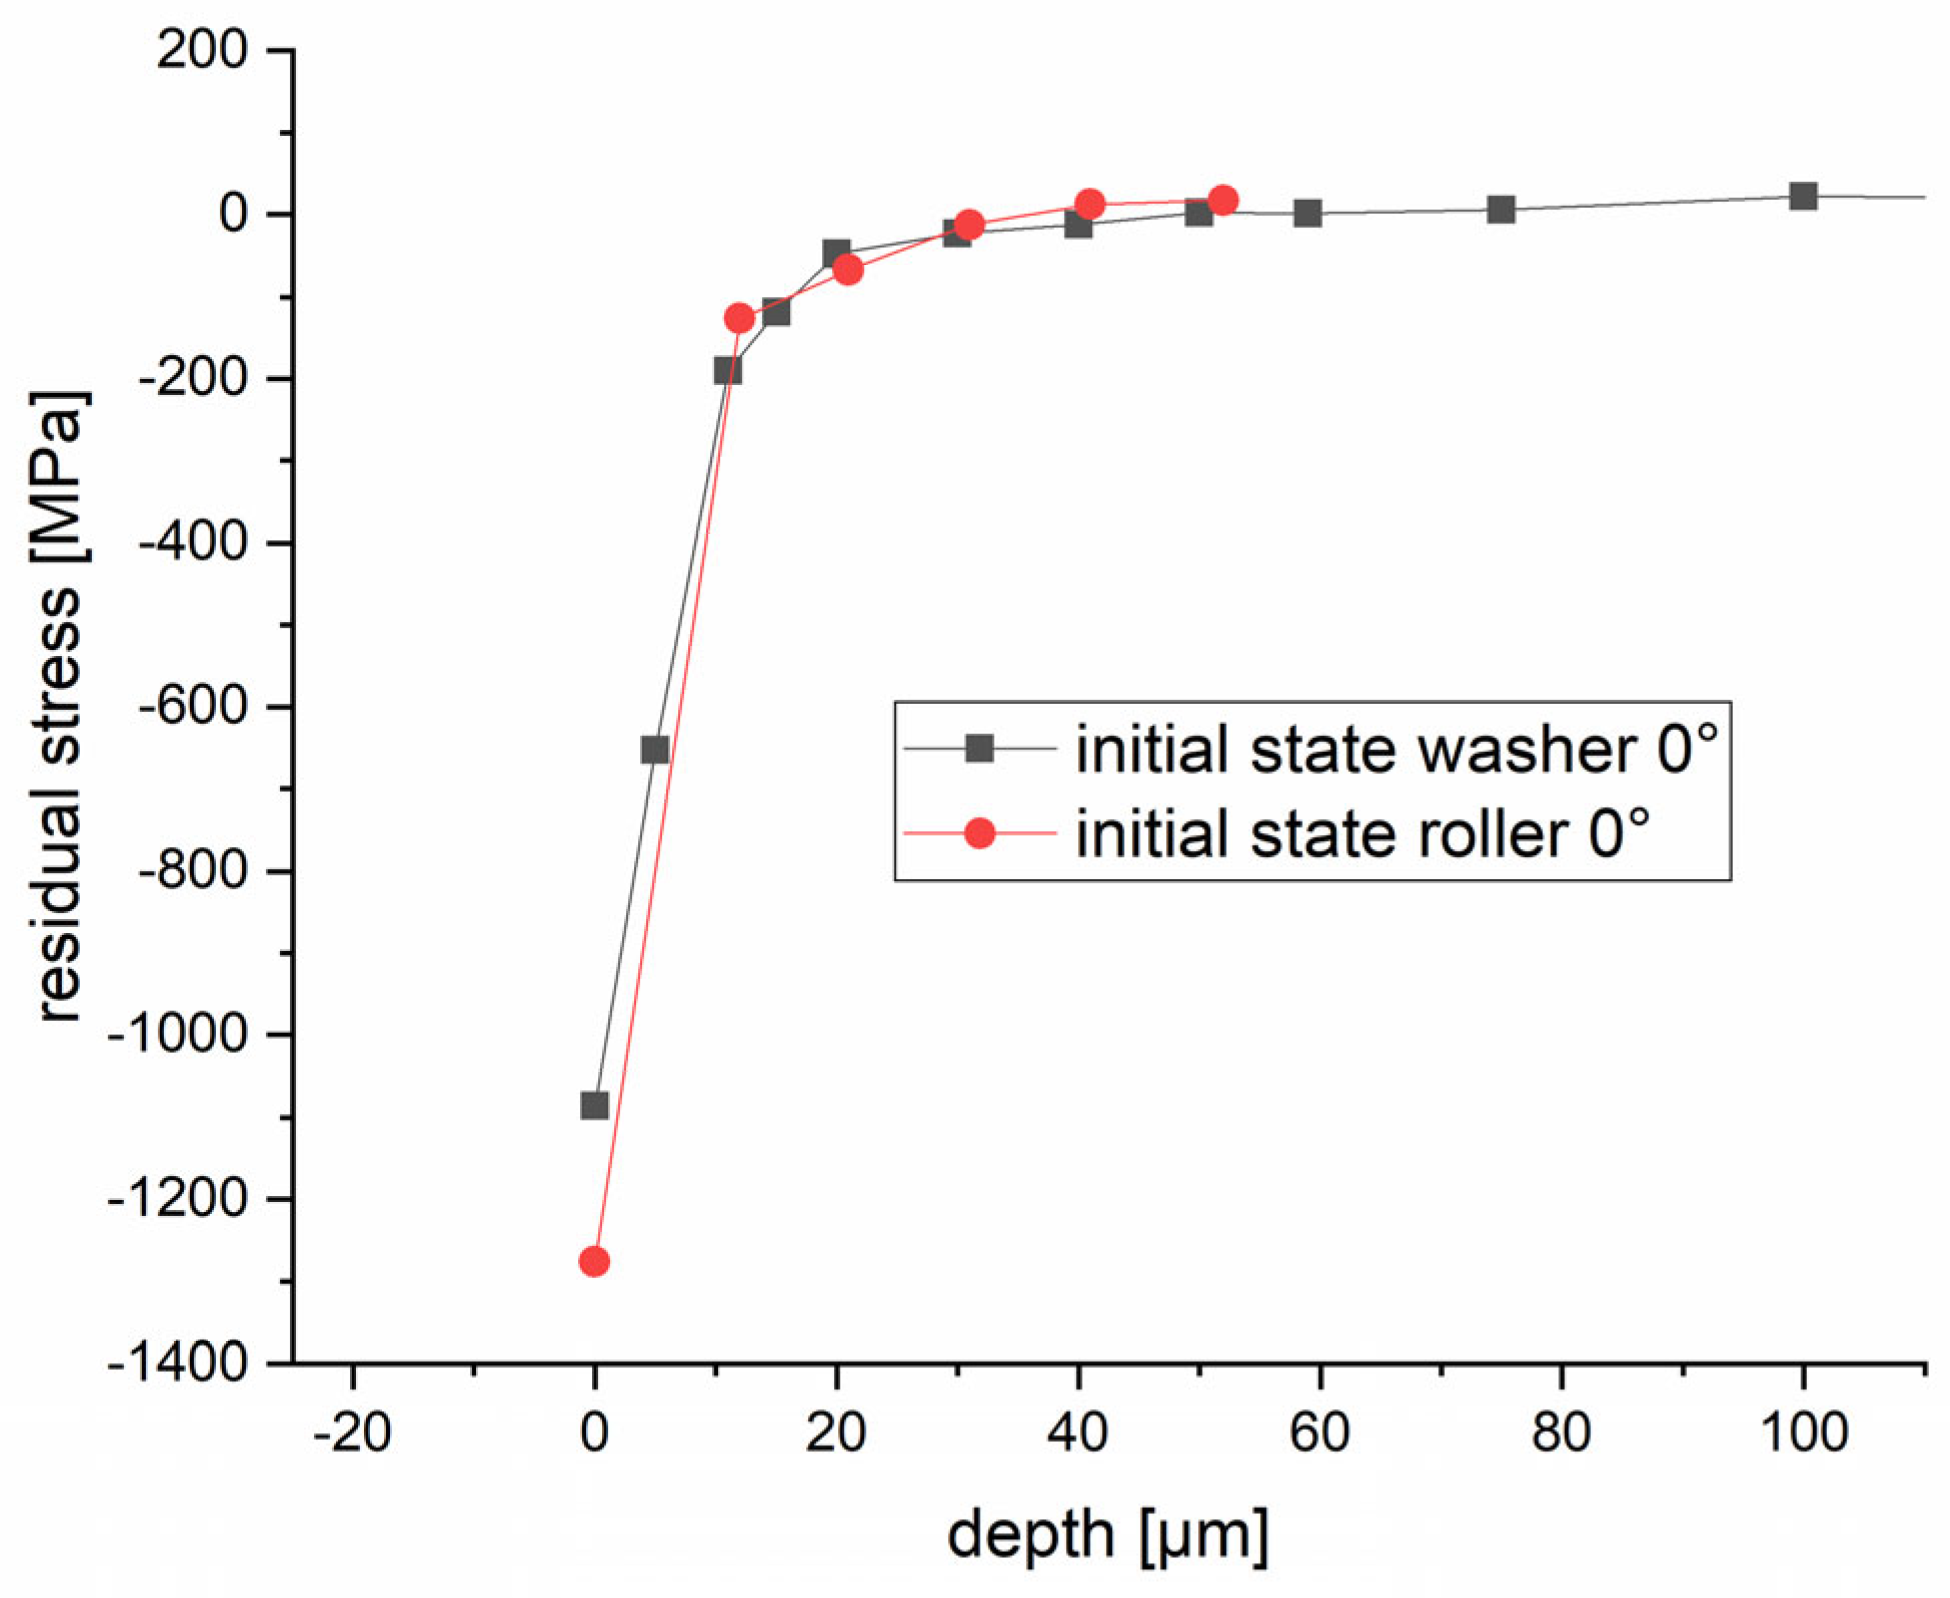
3.3. Residual Stress Measurements

The residual stresses were measured on the washers. The flat surface of the washer ensures better repeatability of the measurements, which would be otherwise affected by the crown of the roller (cylindrical rollers are actually manufactured with a slight camber that is subject to manufacturing tolerances). Nevertheless, to ensure transferability of residual stress results between the roller and washer, comparison measurements were carried out on virgin samples, as shown in Figure 7. The stress profiles obtained from the washer and the roller indicate very close results.
The residual stresses in the subsurface region were measured using gradually larger depth increments. The residual stress profiles were similar in samples tested with both oil formulations. Here, it is important to note that stress gradients (rather than stress magnitudes) are decisive for hydrogen diffusion [26].
In Figure 8, the residual stress profile of the washer was measured in the virgin state, as well as after 25 h and 50 h runtime, using the low-ref oil. In virgin samples, only compressive stresses were measured. With increasing depth, the compressive residual stresses decrease sharply; below 50 µm, the stress gradient decreases; however, stresses remain compressive throughout the whole measurement range. The test samples showed compressive stresses of approx. 600–700 MPa on the surface, compared to approx. 1100 MPa in the virgin samples. The compressive stresses decrease as the depth increases, changing to light compressive or even tensile stresses, with a peak at approx. 20 µm, below which the stress decreases and reaches a plateau at approximately 50 µm.
Figure 9 shows the residual stresses using the high ref oil. All samples tested for 25 h and 50 h showed similar stress profiles, with compressive stresses on the surface. The stress decreases sharply in the first micrometers of depth with a positive gradient, below which the stress reaches a peak, and the slope becomes negative. For the sample tested for 25 h using the high-ref oil, the peak in the residual stress profile is obvious.
After a test duration of 300 h, the formation of a classical fatigue zone, with compressive residual stresses in the subsurface region, was observed. This is in line with the findings in the microstructural analysis, where a dark etching region (DER) is formed after 300 h of testing.

3.4. Thermal Desorption Analysis

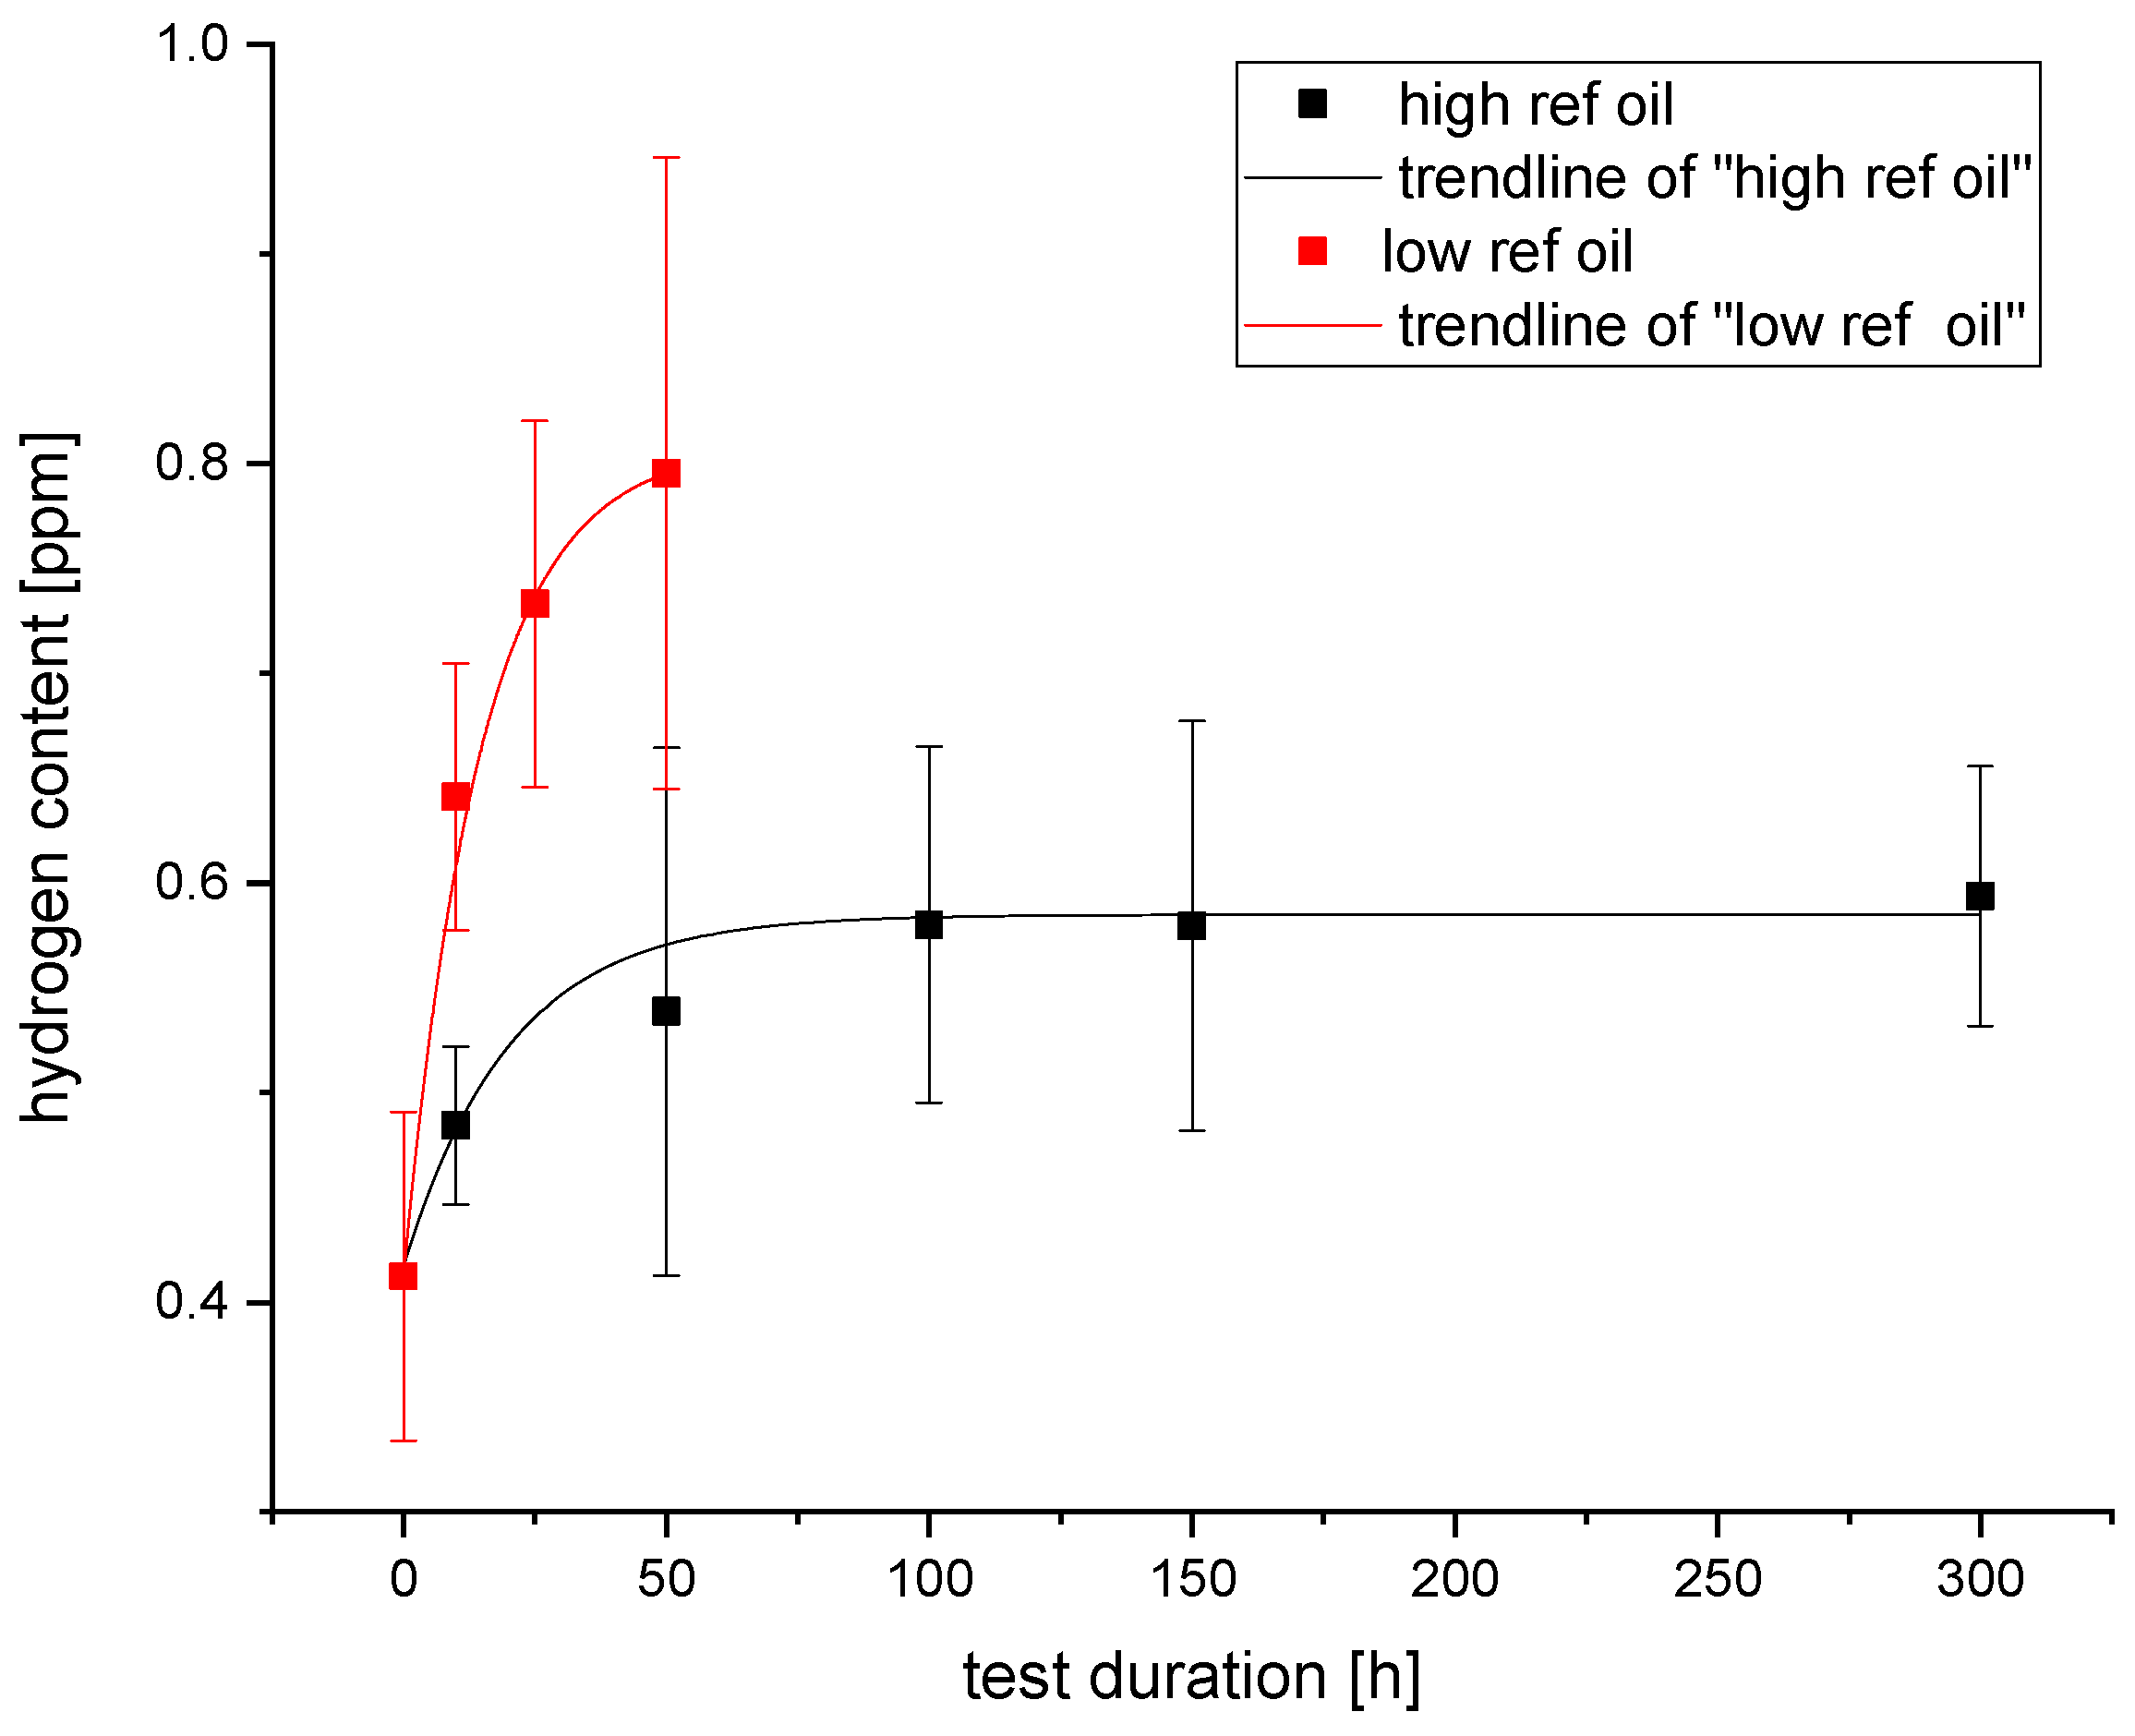
3.4.1. Hydrogen Content Measurement

The measurement of hydrogen content using the TDA (Figure 10) shows the difference in the hydrogen accumulation in the bearing rollers using the different lubricants and test durations. The test runs using low ref oil showed a higher hydrogen content in the samples. The samples tested using high ref oil showed the maximum hydrogen content of 0.6 ppm, reached after approximately 100 h. Longer test durations did not result in higher hydrogen content in the samples. These runtimes were not even achieved with the low-ref oil due to the occurrence of damage. After a 25 h runtime, a hydrogen content over 0.6 ppm was measured, and after 50 h, an average of 0.8 ppm was measured in the roller samples. A measurement showing very high hydrogen content was obtained from a sample tested for 70 h with the low-ref oil; nevertheless, it was not shown on this graph. The cross-sectional analysis of the 70 h test run showed a network of cracks that propagated to the surface of the rollers. Thus, even after grinding the superficial area of the rollers, some lubricant might have been trapped in deeper cracks, which would have affect the measured hydrogen content.

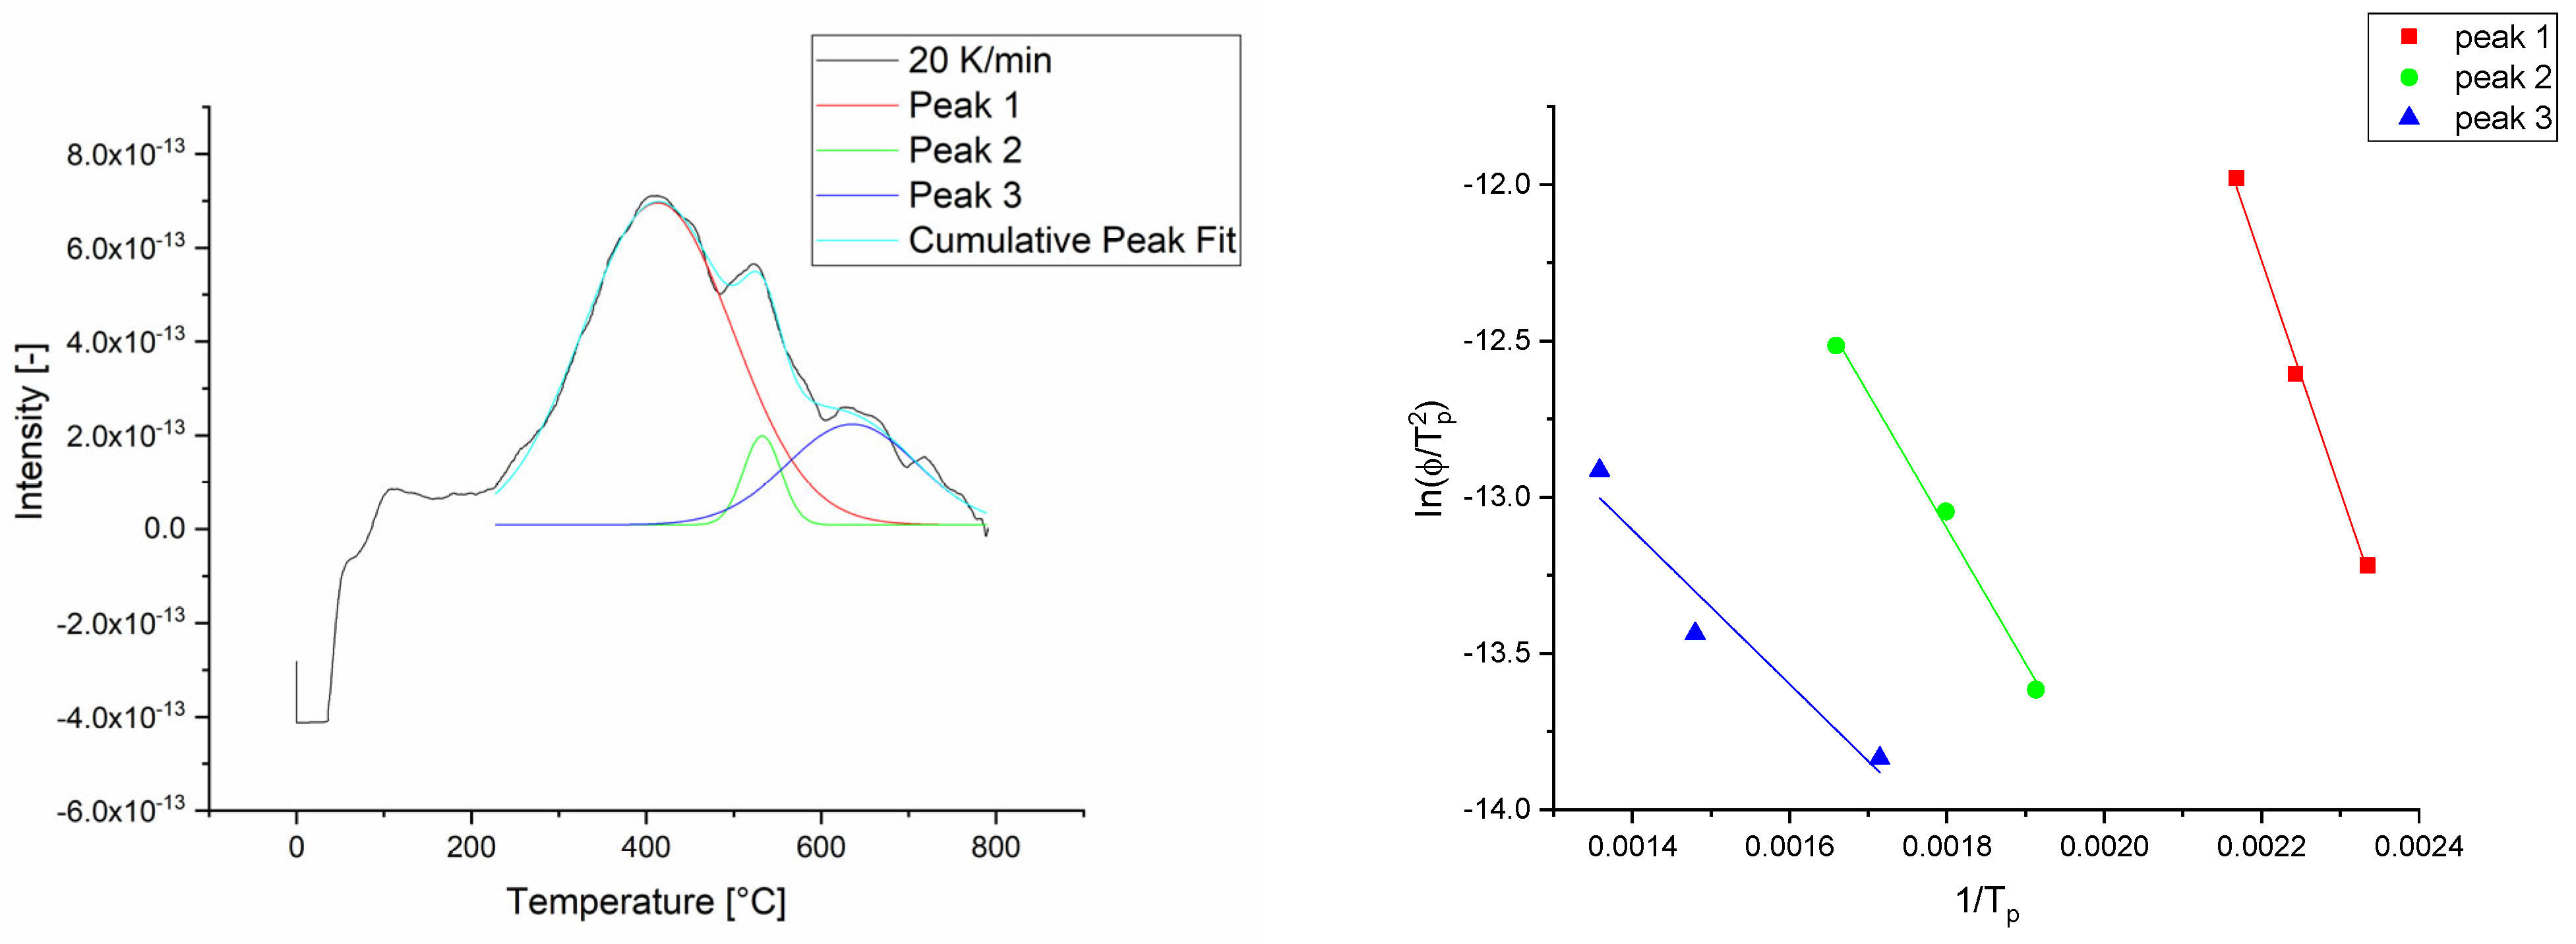
3.4.2. Measurement of Trapping Energies

TDS measurements of trapping energies were carried out for three different rollers of one bearing. The measured trapping energies are listed in Table 2 and Table 3.
In Table 2, it can be seen that after a 150 h runtime, the trapping energies of all three peaks are quite consistent, at around 10 kJ/mol. After 290 h, the trapping energies of the peaks are also consistent, at about 40 kJ/mol.
The trapping energies using the low ref oil vary widely, as shown in Table 3, and not just in regards to the runtime; it is also clear that the number of the peaks does not yield a consistent trend. Moreover, the smaller R2 with a longer runtime shows the wider variation in the filled trapping sites. After a 50 h runtime, there was one particularly outstanding trapping site showing a high trapping energy, in which almost 80 kJ/mol were measured.

4. Discussion

In this work, rolling-contact fatigue behavior was studied for CRTBs lubricated using two different formulated lubricant mixtures (low ref and high ref). The metallographic examinations indicated the formation of WEC in samples tested with the low ref oil after 25 h (Figure 5); crack propagation resulted in substantial subsurface damaged after 50 h. Typical surface spalling was observed after around 70 h. In contrast, the samples tested with the high ref oil did not show any signs of premature damage, even after 300 h (Figure 6); signs of classical rolling contact fatigue, such as DER, were recorded.
Figure 7 shows almost identical residual stress profiles in the rollers and washers. To ensure better repeatability, the residual stresses in the tested samples were measured on the washers (refer to the explanation in Section 3.3). Moreover, the contact stresses, as well as material composition and properties, are almost identical in both contact counterparts, which ensures the transferability of the residual stress profiles between both components.
The measured residual stress profiles (refer to Figure 8 and Figure 9) are in line with previous measurements obtained by Voskamp et al. [35,36]. It is worth noting that cyclic rolling contact changes the residual stress profile so that, just below the surface, a crest point is formed, indicating a positive-to-negative change in the stress gradient. This zone would act as an accumulation zone for hydrogen, as argued in Khader et al. [26,37], within which hydrogen concentrations 150% to 175% higher than those in the bulk material were computed [37]. WEC were observed at depths of 25 to 50 µm under the contact surface, which coincide with this region of accumulated hydrogen [37]. Hence, it is believed that the elevated hydrogen concentrations within the accumulation zone can be correlated with the formation of WEC [38]. Although the residual stresses were measured in the washers, the same profiles are expected to develop in the rollers. In 25 h and 50 h tests, the stress profile shows a peak just below the surface, resulting in a change in the stress gradient from positive to negative. The stress profile of the 300 h test also showed similar behavior, with higher compressive stresses below the surface. The difference in residual stresses using different oil formulations is attributed to the running-in behavior (Figure 4), which is mainly influenced by the oil additives.
Figure 11 shows the measured residual stress profile of the high ref oil after 25 h, measured in rolling direction, with a crest point in the tensile stress region. The graph also shows the von Mises stresses developed due to contact. The von Mises stress was extracted from a finite element model developed elsewhere [37]. The region marked by the ellipse in the figure indicates the zone of WEC formation in the first 25 h of the test time (with low ref oil). The subsurface hydrogen accumulation is believed to detrimentally affect the integrity of steel by means of hydrogen enhanced decohesion (HEDE) [39]. This processes [39,40] and the overlapped mechanical stresses (as indicated by the peak von Mises equivalent stress) is therefore believed to lead to the initiation of cracks in the subsurface region.
It is also worth mentioning that the damage predominantly occurred on the outer edge of the roller. It is assumed that slip in the rolling contact leads to the removal of the tribo-chemical layer, thus rendering the surface more susceptible to hydrogen diffusion. The nascent metal surface is more susceptible to the adsorption of hydrogen, which then gets absorbed by the bulk material [41,42]. It is known that higher slip can be associated with the occurrence of WEC damage [16].
The measured trapping energies (Table 2 and Table 3) indicate the saturation of some sites and the creation of new ones. There are clear differences in the trapping energies, and the energies are more consistent in the tests using the high ref oil. With the high ref oil, it seems that hydrogen initially becomes more diffusible in the lattice due to over-rolling, as seen in Table 2. In the 150 h test, all three peaks were very close to each other at around 10 kJ/mol. After 290 h, the trapping energy is also consistent at approx. 40 kJ/mol, which may indicate saturation, revealing the formation of DER, which is associated with very high dislocation density [43]. The measured trapping energies did not show a clear trend for samples tested with the low ref oil (Table 3). This may be attributed to the unevenly distributed subsurface damage in steel, which is a reflection of a different localized load at the microscopic level. The literature findings for similar types of steels indicate that the lower energy traps (around 10 kJ/mol) are associated with interstitial sites or carbides, e.g., (Fe, Cr, Mo)2C. Trapping sites of around 28–40 kJ/mol indicate dislocations, grain boundaries, or martensitic laths [29,44]. Higher energy traps would be considered irreversible traps [34,44]. Very high binding energy sites (similar to those in the test using low ref oil for 50 h) are assumed to be strained Fe3C interfaces or an interface between α-phase and an MnS inclusion [29]. It is thus believed that more data are needed to be able to achieve a trend of trapping energies.

5. Conclusions

The following points summarize the work:
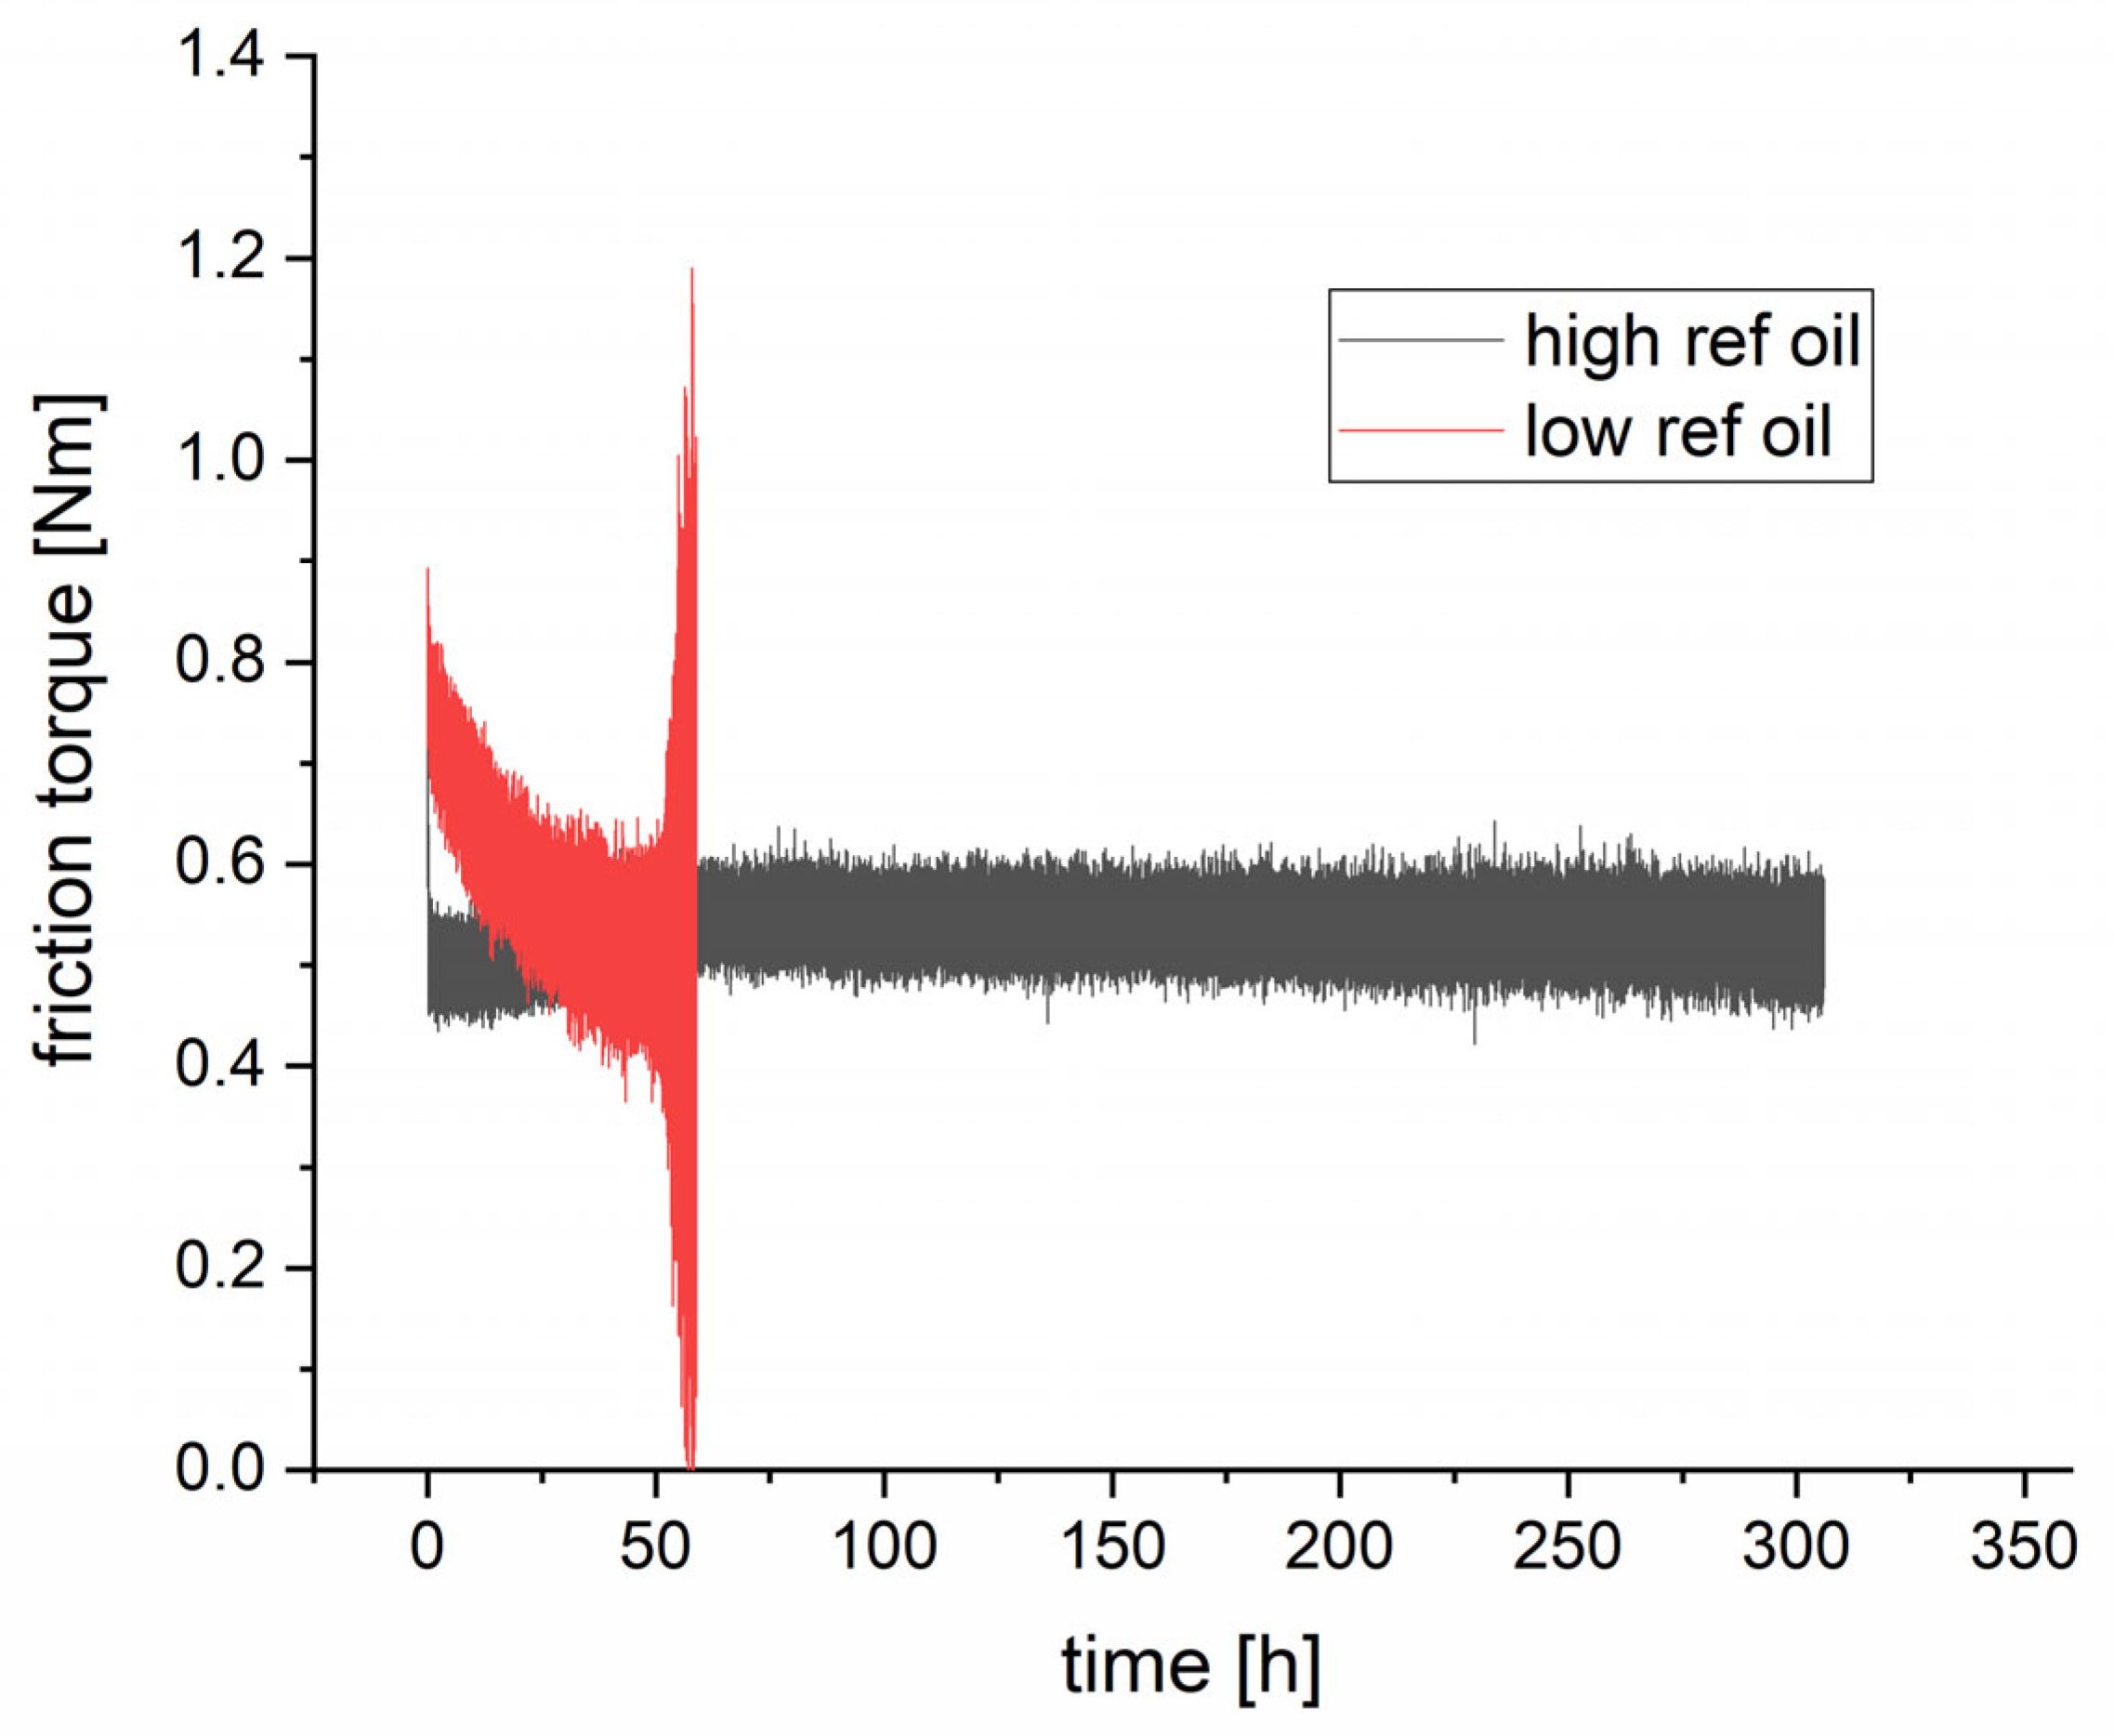
  • The tests showed that a running-in behavior occurs using the low ref oil, and practically no running-in occurs using the high ref oil due to different additive mixtures.
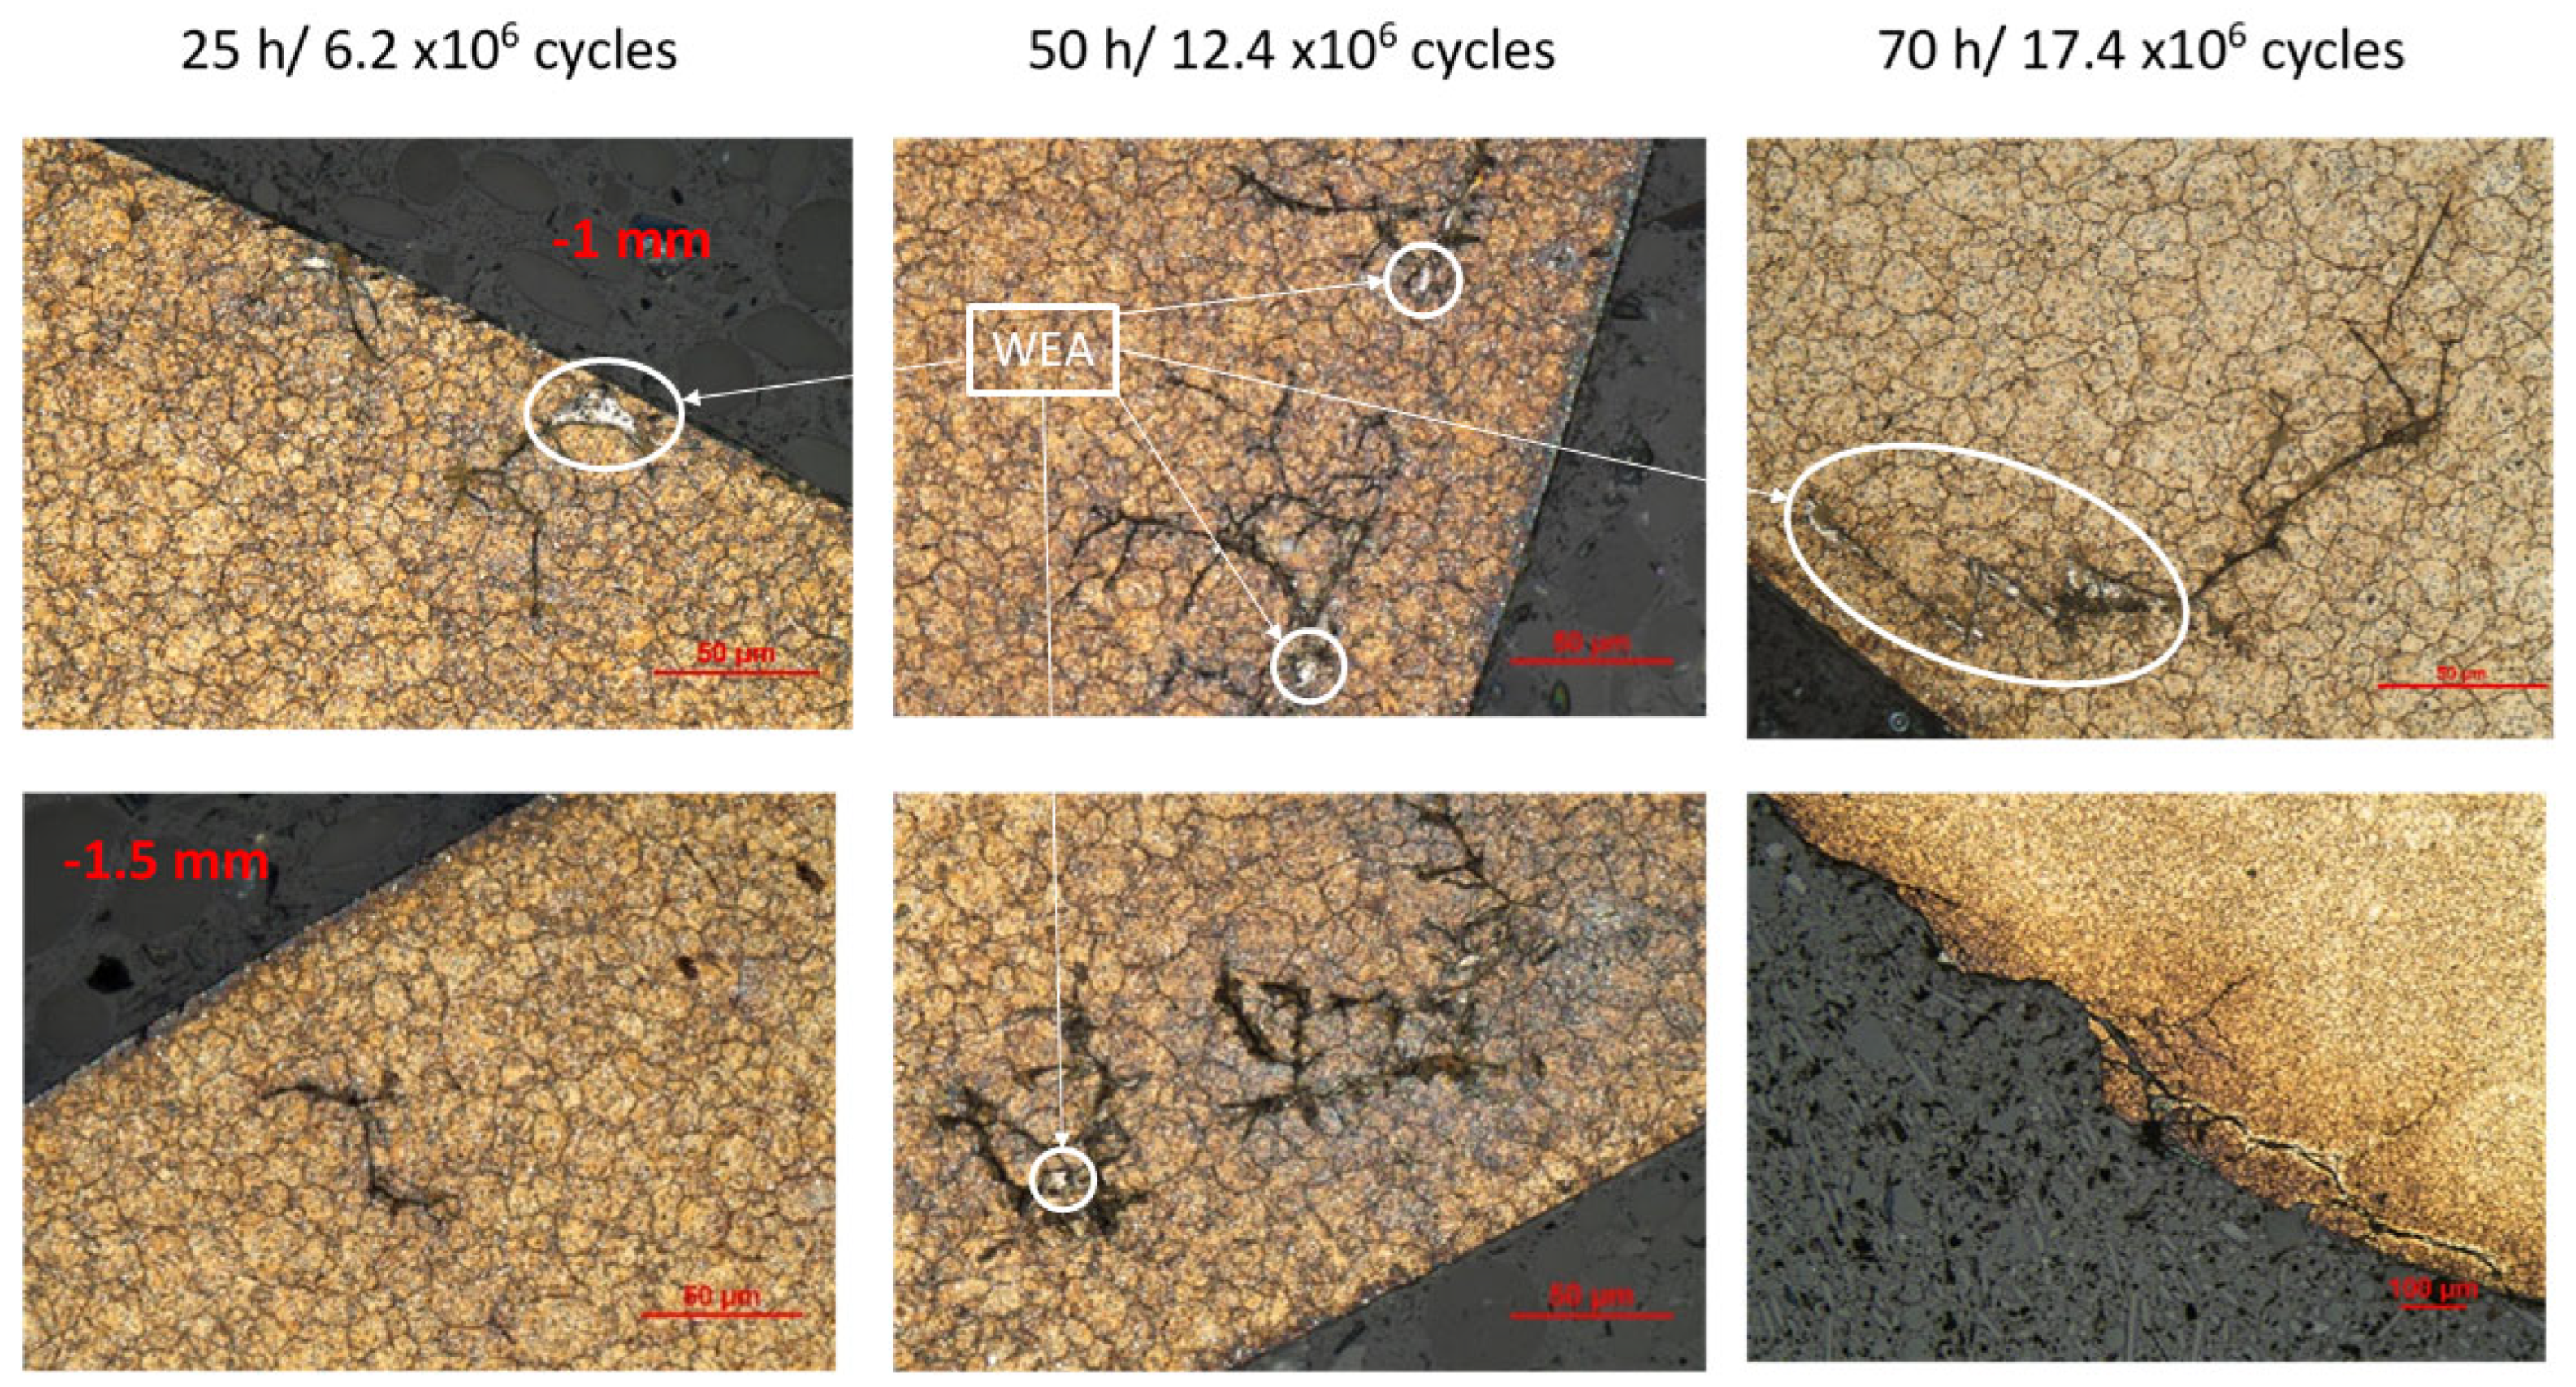
  • In the metallographic cuts, it was observed that the initiation of the damage begins at a depth of approximately 25 to 50 µm; cyclic rolling contacts result in damage accumulation and crack propagation.
  • The hydrogen content measured in the rollers was higher for the low ref oil when compared to the high ref oil, which indicates that a higher hydrogen content and WEC damage are correlated.
  • The trapping energies showed that the trapping sites with higher trapping energy become occupied after a longer runtime; it is assumed that at first the lower energy traps corresponding to dislocations, and subsequently, after 50 h, the high energy traps are occupied by hydrogen atoms.
  • The residual stresses ranged from compressive stresses on the surface of the washers, to slight tensile stresses at depths of 20 to 50 µm, to lower tensile stresses at greater depths.
The correlation of the elevated hydrogen content, the measured residual stress, the observed failure due to subsurface cracks, and the subsequent spalling of the surface of the roller indicate that the emerging profile of residual stresses, in combination with the high von Mises stresses, play a significant role in the damage evolution of the WEC. Slip also has some effect, leading to damage occurring mainly on the outer edge of the rollers.

Author Contributions

Conceptualization, M.B., D.K. and I.K.; methodology, M.B. and D.K.; software, M.B.; validation, D.K. and I.K.; investigation, M.B. and T.S.; data curation, M.B. and T.S.; writing—original draft preparation, M.B., M.D., D.K., I.K. and A.K.; writing—review and editing, M.B., D.K, M.D. and I.K.; supervision, M.D., A.K. and I.K.; project administration, D.K. and A.K. All authors have read and agreed to the published version of the manuscript.

Funding

This work received funding from the German Research Foundation (DFG) (project: 450828000).

Data Availability Statement

The data presented in this study are available on request from the corresponding author due to privacy reasons.

Acknowledgments

The authors would like to thank Klüber Lubrication GmbH & Co. KG, Schaeffler AG, and Robert Bosch GmbH for their cooperation and for the provision of materials.

Conflicts of Interest

Author Thomas Schieß was employed by the company OSK-Kiefer GmbH and authors Maximilian Baur, Iyas Khader, Dominik Kürten and Andreas Kailer were employed by Fraunhofer Institute for Mechanics of Materials IWM. The remaining author declares that the research was conducted in the absence of any commercial or financial relationships that could be construed as a potential conflict of interest.

References

  1. Greco, A.; Sheng, S.; Keller, J.; Erdemir, A. Material wear and fatigue in wind turbine Systems. Wear 2013, 302, 1583–1591. [Google Scholar] [CrossRef]
  2. Gould, B.; Greco, A.; Stadler, K.; Xiao, X. An analysis of premature cracking associated with microstructural alterations in an AISI 52100 failed wind turbine bearing using X-ray tomography. Mater. Des. 2017, 117, 417–429. [Google Scholar] [CrossRef]
  3. Spille, J.; Wranik, J.; Barteldes, S.; Mayer, J.; Schwedt, A.; Zürcher, M.; Lutz, T.; Wang, L.; Holweger, W. A study on the initiation processes of white etching cracks (WECs) in AISI 52100 bearing steel. Wear 2021, 477, 203864. [Google Scholar] [CrossRef]
  4. Stadler, K.; Lai, J.; Vegter, R.H. A Review: The Dilemma with Premature White Etching Crack (WEC) Bearing Failures. In Bearing Steel Technologies: 10th Volume, Advances in Steel Technologies for Rolling Bearings; Beswick, J.M., Ed.; ASTM International: West Conshohocken, PA, USA, 2014; pp. 1–22. [Google Scholar]
  5. Kürten, D.; Khader, I.; Raga, R.; Casajús, P.; Winzer, N.; Kailer, A.; Spallek, R.; Scherge, M. Hydrogen assisted rolling contact fatigue due to lubricant degradation and formation of white etching areas. Eng. Fail. Anal. 2019, 99, 330–342. [Google Scholar] [CrossRef]
  6. Evans, M.-H.; Wang, L.; Wood, R. Formation mechanisms of white etching cracks and white etching area under rolling contact fatigue. Proc. Inst. Mech. Eng. Part J J. Eng. Tribol. 2014, 228, 1047–1062. [Google Scholar] [CrossRef]
  7. Diederichs, A.M.; Barteldes, S.; Schwedt, A.; Mayer, J.; Holweger, W. Study of subsurface initiation mechanism for white etching crack formation. Mater. Sci. Technol. 2016, 32, 1170–1178. [Google Scholar] [CrossRef]
  8. Holweger, W.; Schwedt, A.; Rumpf, V.; Mayer, J.; Bohnert, C.; Wranik, J.; Spille, J.; Wang, L. A Study on Early Stages of White Etching Crack Formation under Full Lubrication Conditions. Lubricants 2022, 10, 24. [Google Scholar] [CrossRef]
  9. Šmeļova, V.; Schwedt, A.; Wang, L.; Holweger, W.; Mayer, J. Microstructural changes in White Etching Cracks (WECs) and their relationship with those in Dark Etching Region (DER) and White Etching Bands (WEBs) due to Rolling Contact Fatigue (RCF). Int. J. Fatigue 2017, 100, 148–158. [Google Scholar] [CrossRef]
  10. Gesellschaft für Tribologie e.V., White Etching Cracks: Positionspapier. Available online: https://www.gft-ev.de/wp-content/uploads/Position-paper-en-Web.pdf (accessed on 10 June 2024).
  11. Bhadeshia, H. Steels for bearings. Prog. Mater. Sci. 2012, 57, 268–435. [Google Scholar] [CrossRef]
  12. Gould, B.; Paladugu, M.; Demas, N.G.; Greco, A.C.; Hyde, R.S. Figure the impact of steel microstructure and heat treatment on the formation of white etching cracks. Tribol. Int. 2019, 134, 232–239. [Google Scholar] [CrossRef]
  13. Evans, M.-H.; Richardson, A.; Wang, L.; Wood, R. Effect of hydrogen on butterfly and white etching crack (WEC) formation under rolling contact fatigue (RCF). Wear 2013, 306, 226–241. [Google Scholar] [CrossRef]
  14. Gould, B.; Demas, N.; Erck, R.; Lorenzo-Martin, M.C.; Ajayi, O.; Greco, A. The effect of electrical current on premature failures and microstructural degradation in bearing steel. Int. J. Fatigue 2020, 145, 106078. [Google Scholar] [CrossRef]
  15. López-Uruñuela, F.J.; Macareno, L.M.; Pinedo, B.; Aguirrebeitia, J. Confirming dark groove microstructural alterations as WEC initiation first stage in cylindrical roller thrust bearings lubricated with WEC critical oil. Wear 2024, 550, 205396. [Google Scholar] [CrossRef]
  16. Gould, B.; Greco, A. The Influence of Sliding and Contact Severity on the Generation of White Etching Cracks. Tribol. Lett. 2015, 60, 29. [Google Scholar] [CrossRef]
  17. Ruellan, A.; Ville, F.; Kleber, X.; Arnaudon, A.; Girodin, D. Understanding white etching cracks in rolling element bearings: The effect of hydrogen charging on the formation mechanisms. Proc. Inst. Mech. Eng. Part J J. Eng. Tribol. 2014, 228, 1252–1265. [Google Scholar] [CrossRef]
  18. Szost, B.; Rivera-Díaz-Del-Castillo, P. Unveiling the nature of hydrogen embrittlement in bearing steels employing a new technique. Scr. Mater. 2012, 68, 467–470. [Google Scholar] [CrossRef]
  19. Kohara, M.; Kawamura, T.; Egami, M. Study on Mechanism of Hydrogen Generation from Lubricants. Tribol. Trans. 2006, 49, 53–60. [Google Scholar] [CrossRef]
  20. Steinweg, F.; Mikitisin, A.; Janitzky, T.L.; Richter, S.; Weirich, T.E.; Mayer, J.; Broeckmann, C. Influence of additive-derived reaction layers on white etching crack failure of SAE 52100 bearing steel under rolling contact loading. Tribol. Int. 2023, 180, 108239. [Google Scholar] [CrossRef]
  21. Gould, B.; Demas, N.G.; Pollard, G.; Rydel, J.J.; Ingram, M.; Greco, A.C. The Effect of Lubricant Composition on White Etching Crack Failures. Tribol. Lett. 2018, 67, 7. [Google Scholar] [CrossRef]
  22. Mikami, H.; Kawamura, T. Influence of Electrical Current on Bearing Flaking Life. In Influence of Electrical Current on Bearing Flaking Life; SAE Technical Paper; SAE: Warrendale, PA, USA, 2007. [Google Scholar]
  23. Dogahe, K.J.; Guski, V.; Mlikota, M.; Schmauder, S.; Holweger, W.; Spille, J.; Mayer, J.; Schwedt, A.; Görlach, B.; Wranik, J. Simulation of the Fatigue Crack Initiation in SAE 52100 Martensitic Hardened Bearing Steel during Rolling Contact. Lubricants 2022, 10, 62. [Google Scholar] [CrossRef]
  24. Frappart, S.; Feaugas, X.; Creus, J.; Thebault, F.; Delattre, L.; Marchebois, H. Study of the hydrogen diffusion and segregation into Fe–C–Mo martensitic HSLA steel using electrochemical permeation test. J. Phys. Chem. Solids 2010, 71, 1467–1479. [Google Scholar] [CrossRef]
  25. Winzer, N.; Rott, O.; Thiessen, R.; Thomas, I.; Mraczek, K.; Höche, T.; Wright, L.; Mrovec, M. Hydrogen diffusion and trapping in Ti-modified advanced high strength steels. Mater. Des. 2016, 92, 450–461. [Google Scholar] [CrossRef]
  26. Khader, I.; Kürten, D.; Raga, R.; Winzer, N.; Kailer, A. Modeling hydrogen diffusion in a tribological scenario: A failure analysis of a thrust bearing. Wear 2019, 438-439, 203054. [Google Scholar] [CrossRef]
  27. Siegl, W. Hydrogen Trapping in Iron and Iron-Based Alloys. Ph.D. Thesis, Montanuniversitaet Leoben, Leoben, Austria, 2020. [Google Scholar]
  28. Zafra, A.; Peral, L.; Belzunce, J. Hydrogen diffusion and trapping in A 42CrMo4 quenched and tempered steel: Influence of tempering temperature. Int. J. Hydrog. Energy 2020, 45, 31225–31242. [Google Scholar] [CrossRef]
  29. Peral, L.; Amghouz, Z.; Colombo, C.; Fernández-Pariente, I. Evaluation of hydrogen trapping and diffusion in two cold worked CrMo(V) steel grades by means of the electrochemical hydrogen permeation technique. Theor. Appl. Fract. Mech. 2020, 110, 102771. [Google Scholar] [CrossRef]
  30. Medias Bearing Calculation. Available online: https://medias.schaeffler.de/de/produkt/rotary/waelz--und-gleitlager/rollenlager/axial-zylinderrollenlager/81104-tv/p/395849#Calculation (accessed on 10 June 2024).
  31. Bragg, W.H. The Reflection of X-rays by Crystals. Nature 1913, 91, 477. [Google Scholar] [CrossRef]
  32. Spieß, L. Moderne Röntgenbeugung: Röntgendiffraktometrie für Materialwissenschaftler, Physiker und Chemiker, 2nd ed.; Vieweg + Teubner: Wiesbaden, Germany, 2009. [Google Scholar]
  33. Simoni, L.; Falcade, T.; Ferreira, D.C.; Kwietniewski, C.E. An integrated experimental and modeling approach to determine hydrogen diffusion and trapping in a high-strength steel. Int. J. Hydrogen Energy 2021, 46, 25738–25751. [Google Scholar] [CrossRef]
  34. Yamabe, J.; Yoshikawa, M.; Matsunaga, H.; Matsuoka, S. Hydrogen trapping and fatigue crack growth property of low-carbon steel in hydrogen-gas environment. Int. J. Fatigue 2017, 102, 202–213. [Google Scholar] [CrossRef]
  35. Voskamp, A.P.; Österlund, R.; Becker, P.C.; Vingsbo, O. Gradual changes in residual stress and microstructure during contact fatigue in ball bearings. Met. Technol. 1980, 7, 14–21. [Google Scholar] [CrossRef]
  36. Voskamp, A.P.; Mittemeijer, E.J. State of residual stress induced by cyclic rolling contact loading. Mater. Sci. Technol. 1997, 13, 430–438. [Google Scholar] [CrossRef]
  37. Khader, I.; Kürten, D.; Kailer, A. The Influence of Mechanical Stresses on the Diffusion and Accumulation of Hydrogen in a CRTB; Bearing World: Frankfurt, Germany, 2020. [Google Scholar]
  38. Richardson, A.D.; Evans, M.-H.; Wang, L.; Wood, R.J.K.; Ingram, M. Thermal Desorption Analysis of Hydrogen in Non-Hydrogen-Charged Rolling Contact Fatigue-Tested 100Cr6 Steel. Tribol. Lett. 2017, 66, 4. [Google Scholar] [CrossRef]
  39. Bae, D.-S.; Sung, C.-E.; Bang, H.-J.; Lee, S.-P.; Lee, J.-K.; Son, I.-S.; Cho, Y.-R.; Baek, U.-B.; Nahm, S.-H. Effect of highly pressurized hydrogen gas charging on the hydrogen embrittlement of API X70 steel. Met. Mater. Int. 2014, 20, 653–658. [Google Scholar] [CrossRef]
  40. Nguyen, T.T.; Park, J.; Nahm, S.H.; Tak, N.; Baek, U.B. Ductility and fatigue properties of low nickel content type 316L austenitic stainless steel after gaseous thermal pre-charging with hydrogen. Int. J. Hydrogen Energy 2019, 44, 28031–28043. [Google Scholar] [CrossRef]
  41. López-Uruñuela, F.J.; Fernández-Díaz, B.; Pagano, F.; López-Ortega, A.; Pinedo, B.; Bayón, R.; Aguirrebeitia, J. Broad review of “White Etching Crack” failure in wind turbine gearbox bearings: Main factors and experimental investigations. Int. J. Fatigue 2020, 145, 106091. [Google Scholar] [CrossRef]
  42. Guzmán, F.G.; Oezel, M.O.; Jacobs, G.; Burghardt, G.; Broeckmann, C.; Janitzky, T. Influence of Slip and Lubrication Regime on the Formation of White Etching Cracks on a Two-Disc Test Rig. Lubricants 2018, 6, 8. [Google Scholar] [CrossRef]
  43. El Laithy, M.; Wang, L.; Harvey, T.J.; Schwedt, A.; Vierneusel, B.; Mayer, J. Mechanistic study of dark etching regions in bearing steels due to rolling contact fatigue. Acta Mater. 2023, 246. [Google Scholar] [CrossRef]
  44. Chen, W.; Zhao, W.; Gao, P.; Li, F.; Kuang, S.; Zou, Y.; Zhao, Z. Interaction between dislocations, precipitates and hydrogen atoms in a 2000 MPa grade hot-stamped steel. J. Mater. Res. Technol. 2022, 18, 4353–4366. [Google Scholar] [CrossRef]
Figure 1. Temperature-controlled test setup for full bearing tests in oil bath: (a) rolling bearing, (b) cup, filled with 20 mL of the oil, and the thermocouple inserted for temperature measurement, (c) double-walled container for controlling the temperature of the oil at 90 °C, (d) load cell to measure the normal force as well as the friction torque, (e) shaft to apply the rotation and normal load.
Lubricants 12 00311 g001
Figure 2. Illustration of the metallographic investigations on the cylindrical rolling elements, starting from the outer edge of the component.
Lubricants 12 00311 g002
Figure 3. Deconvolution of the hydrogen intensity curve measured on the mass spectrometer (left) and the slope corresponding to the trapping energy of the different peaks (right).
Lubricants 12 00311 g003
Figure 4. Exemplary COF vs time curve for the two different tests, showing the difference in running-in behavior between the lubricants.
Lubricants 12 00311 g004
Figure 5. Cross-sectional cuts and metallographic examination of the rollers run with the low ref oil.
Lubricants 12 00311 g005
Figure 6. Cross-sectional cuts and metallographic examination of the rollers run with the high ref oil.
Lubricants 12 00311 g006
Figure 7. Comparison of the residual stresses of virgin bearing components.
Lubricants 12 00311 g007
Figure 8. Residual stress profile of tests using low ref oil after 25 h and 50 h, measured in the rolling direction (left) and perpendicular to the rolling direction (right).
Lubricants 12 00311 g008
Figure 9. Residual stress profile of tests using high ref oil after 25 h, 50 h, and 300 h, measured in the rolling direction (left) and perpendicular to the rolling direction (right).
Lubricants 12 00311 g009
Figure 10. Hydrogen accumulation with different lubricants over the runtime.
Lubricants 12 00311 g010
Figure 11. Overlap of gradient in residual stresses, with high von Mises stress relative to the observed WEC damage.
Lubricants 12 00311 g011
Table 1. Tests completed, with the respective test duration and mean friction torque.
Number of TestsDuration Low Ref Oil (h)Friction Torque (Nm)Duration High Ref Oil (h)Friction Torque (Nm)
310 h0.73 ± 0.0625 h0.57 ± 0.02
325 h0.63 ± 0.0350 h0.59 ± 0.03
350 h0.56 ± 0.05150 h0.60 ± 0.03
3~70 h0.58 ± 0.10300 h0.54 ± 0.03
Table 2. Measured trapping energies using high ref oil, with coefficient of determination.
Peak 1Peak 2Peak 3
EB (kJ/mol)R2EB (kJ/mol)R2EB (kJ/mol)R2
Initial state10.280.9328.820.8950.570.98
High ref oil 150 h7.080.9210.030.8913.050.82
High ref oil 290 h38.830.9038.230.9841.670.92
Table 3. Measured trapping energies using low ref oil, with coefficient of determination.
Peak 1Peak 2Peak 3
EB (kJ/mol)R2EB (kJ/mol)R2EB (kJ/mol)R2
Initial state10.280.9328.820.8950.570.98
Low ref oil 10 h12.87 0.9514.920.9810.360.94
Low ref oil 10 h17.59 0.9747.650.9843.990.95
Low ref oil 25 h13.25 0.936.290.9428.750.77
Low ref oil 25 h6.280.9225.540.9934.580.98
Low ref oil 50 h39.190.9078.880.9635.350.81
Low ref oil 50 h14.390.7813.810.7724.090.85
Disclaimer/Publisher’s Note: The statements, opinions and data contained in all publications are solely those of the individual author(s) and contributor(s) and not of MDPI and/or the editor(s). MDPI and/or the editor(s) disclaim responsibility for any injury to people or property resulting from any ideas, methods, instructions or products referred to in the content.

