Abstract
The effects of microstructure and mechanical properties on the wear resistance of B4C-TiB2 ceramic composite were studied. The composite was hot pressed from a B4C-TiO2 precursor at a temperature range of 1800 and 1850 °C. Both the relative density and amount of TiB2 secondary phase of the B4C-TiB2 composite increased with the amount of TiO2 sintering additive in B4C-TiO2 precursor. The hardness of the composite increased with a secondary phase portion up to 29.8 vol.% TiB2. However, the positive effect of TiB2 secondary phase on the fracture toughness of B4C-TiB2 composite was measured in the complete experimental range, with the highest average attained value of 7.51 MPa·m1/2. The wear resistance of B4C-TiB2 composite increased with both the hardness and fracture toughness. The best wear resistance was achieved with the composite with a higher hardness value of 29.74 GPa. This sample consisted of 29.8 vol.% TiB2 secondary phase and reached a fracture toughness value of 6.91 MPa·m1/2. The fracture-induced mechanical wear of B4C-TiB2 composite was the main wear mechanism during the pin-on-disc wear test. Transgranular fracture with pullout of the surface and micro-crack formation in the direction perpendicular to the wear direction was observed on the worn surfaces.
1. Introduction
Boron carbide (B4C) based ceramic materials have an excellent combination of physical and mechanical properties. B4C has a low density (2.52 g·cm−3), high melting point (2450 °C), high Young’s modulus (450 ÷ 470 GPa), and exceptional hardness (35 ÷ 48 GPa) [1,2]. These properties predestine B4C ceramics for use in both structural and functional applications, including ultra-low density, super-high hardness, high wear resistance, and high neutron absorption [3,4,5]. Industrial applications of B4C ceramics are still limited because of its difficult sintering and low fracture toughness values. Sintering of B4C requires high temperature (above 2000 °C) due to a low self-diffusion coefficient of B4C. Low fracture toughness (2.2 ÷ 3.7 MPa·m1/2) is a major limiting factor for application of structural parts from B4C ceramic because of its sensitivity to brittle fracture [6,7].
Sintering additives can be used to enhance the properties of B4C ceramics, mainly decreasing the densification temperature and increasing the fracture toughness. Sintering additives may also enable the preparation of ceramic composites by the formation of suitable second phases that improve sintering behaviour and modify the mechanical properties. Carbon, aluminium, silicium, some oxides, and borides are effective sintering additives for B4C ceramics [8,9,10]. Reactive in situ sintering of B4C with titanium dioxide (TiO2) additive results in the creation of ceramic composite material consisting of a B4C matrix and titanium diboride (TiB2) secondary phase at reduced sintering temperature. The initial TiO2 concentration in B4C-TiO2 precursor has an essential effect on the densification of B4C-TiB2 composite and the final portion of TiB2 secondary phase. The TiB2 secondary phase in the B4C matrix supports mechanical properties and wear resistance of this ceramic composite material because of its high hardness (25 ÷ 29 GPa), convenient density (4.52 g·cm−3), high Young’s modulus (480 ÷ 560 GPa), and increased fracture toughness (5 ÷ 8 MPa·m1/2) [8,10]. Based on its excellent mechanical properties, B4C-TiB2 ceramic composite is a promising wear-resistant material for tribological applications such as bearings, blast nozzles, cutting tools, pumps, cylinders, and dies. Due to the low density, B4C-TiB2 ceramic composite is a suitable material for rotatory or movable tribo-components [5,11].
Tribological properties of B4C-TiB2 ceramic composite are affected mainly by the mechanical properties, which are controlled by the microstructure of B4C-TiB2 ceramics. The ceramics microstructure basically defines the crack initiation, which determines the resistance to wear in service environments. The fracture toughness of ceramics is a crucial property for the increase of crack initiation in ceramic and therefore its wear resistance. The TiB2 secondary phase serves as the strengthening and toughening phase in the B4C-TiB2 composite because of its high fracture toughness compared to the B4C phase. During the propagation of cracks in B4C-TiB2 composite into its TiB2 secondary phase, deflection and branching of the crack take place, which relates to the absorption of energy, increase of fracture toughness, and support of wear resistance [12,13,14]. The research in the area of B4C-TiB2 ceramic composites has focused mainly on the effect of mechanical properties on the wear resistance. Several authors pointed out a strong correlation between the wear resistance of B4C ceramics and hardness. The wear resistance of B4C-TiB2 ceramics prepared by various sintering methods, such as plasma spark sintering, hot pressing, or pressureless sintering, increases with hardness. High hardness values from 25.9 to 39.3 GPa were measured in the B4C-TiB2 composite with TiB2 secondary phase portion from 25 to 43 vol.% TiB2 [1,6,11,15,16,17,18]. Other papers emphasize the relation between the wear resistance and fracture toughness of B4C ceramics. As the wear of B4C-based ceramics is caused predominantly by fracture mechanisms, high fracture toughness contributes to the wear resistance of this ceramic material. Enhanced fracture toughness values from 3 to 8.7 MPa·m1/2 were reported in the B4C-TiB2 composite with TiB2 secondary phase portion from 30 to 75 vol.% TiB2 [6,15,16,17,18].
Many studies devoted to problems of ceramic wear confirmed that abrasive wear is the most common mechanism of ceramic material removal [11,12,17]. Two basic mechanisms of surface damage, micro-cutting and micro-fracturing, are applied during the abrasive wear of ceramics, but both mechanisms are simultaneously included during this wear. Micro-cutting should be the dominant mechanism at high hardness and high fracture toughness of ceramics. As the ceramic materials are often characterised by relatively low fracture toughness, micro-fracturing could be the main mechanism during the abrasive wear of B4C-TiB2 ceramic composite materials [11,12]. Although the mechanical properties of B4C-based ceramics have been widely reported in previous investigations, their tribological properties have been relatively less studied. Moreover, there has been little investigation of wear resistance of B4C-TiB2 ceramic composites, and more information is needed about the effect of mechanical properties on wear of these composites. Therefore, the present research focused on the wear resistance of B4C-TiB2 ceramic composite could contribute to this topic.
2. Materials and Methods
B4C (Acros Organics) and TiO2 (Merc) powders with the purity of 99% and a particle size from 2 to 3 µm were chosen to sinter the B4C-TiB2 ceramic composite materials. The B4C-TiO2 precursors with concentrations of TiO2 sintering additives from 10 to 50 wt.% were wet mixed using a horizontal mill in a Teflon container with B4C mill balls and consequently dried. The green bodies were prepared by die pressing in a cylindrical tool with a diameter of 8 mm. The final consolidation was done by a hot-pressing process in a graphite die with a floating matrix of a cylindrical shape with a diameter of 8 mm in a vacuumed atmosphere. Two sintering temperatures of 1800 and 1850 °C, used with the same sintering time of 60 min and a pressure of 35 MPa, were applied during the hot-pressing of compacts with the final length of 10 mm.
The densities of prepared ceramic composites were measured using the Archimedes’ method. The theoretical densities of composites were calculated according to the rule of mixture using the density values of pure phases B4C (2.52 g/cm3) and TiB2 (4.52 g/cm3), and the volume portion of these phases were measured by image analysis. The relative densities of composites were calculated by dividing the measured and theoretical density values. The microstructures of B4C-TiB2 ceramic composites were studied along their cross sections using a JEOL JSM-IT300 scanning electron microscope (JEOL Ltd., Tokyo, Japan) with an energy-dispersive spectrometer (EDS) Oxford Instruments X-Max 20 (Oxford Instruments NanoAnalysis & Asylum Research, High Wycombe, UK). The phase analysis was performed using an XRD method with a Philips PW 1710 diffractometer (Koninklijke Philips Electronics N.V., Amsterdam, The Netherlands) with a source of characteristic X-ray of CoKα. The volume portion of composite phases were measured using image analysis utilizing AxioVison Release 4.8.2 software. Both hardness and fracture toughness were measured by Vickers indentation using a load of 5 kP and time of 10 s. The fracture toughness (KIC) was calculated using the following Equation (1) proposed in work [19]:
where H is the hardness, F is the applied force, and a is the average radial crack length measured on the impression.
KIC = 0.0889(HF/4a)1/2
The wear resistance of experimental composites was investigated under dry sliding conditions using a pin-on-disc method. Archimedean spiral with a length of 120 m was used as a sliding path during the wear tests. The surface of pin samples with a size of ϕ8 mm × 10 mm was polished with diamond paste with a grain size of 1 μm. A waterproof abrasive corundum cloth with a grain size of 120 μm was used as the disc of the testing machine. It was turned at a speed of 20 r·min−1, and the pin moved at a radial shift of 3 mm per revolution from the disc centre to the edge with a diameter of 480 mm under a pressure 1.5 MPa. The intensity of volume wear (W) was calculated by the ratio of the volume loss and the length of the pin path according to Equation (2):
where Δm is the mass loss during the pin on disc test, ρ is the density of pin sample, and l is the length of pin path.
W = Δm/(ρl)
3. Results and Discussion
3.1. Densification and Microstructure of B4C-TiO2 Ceramic Composite
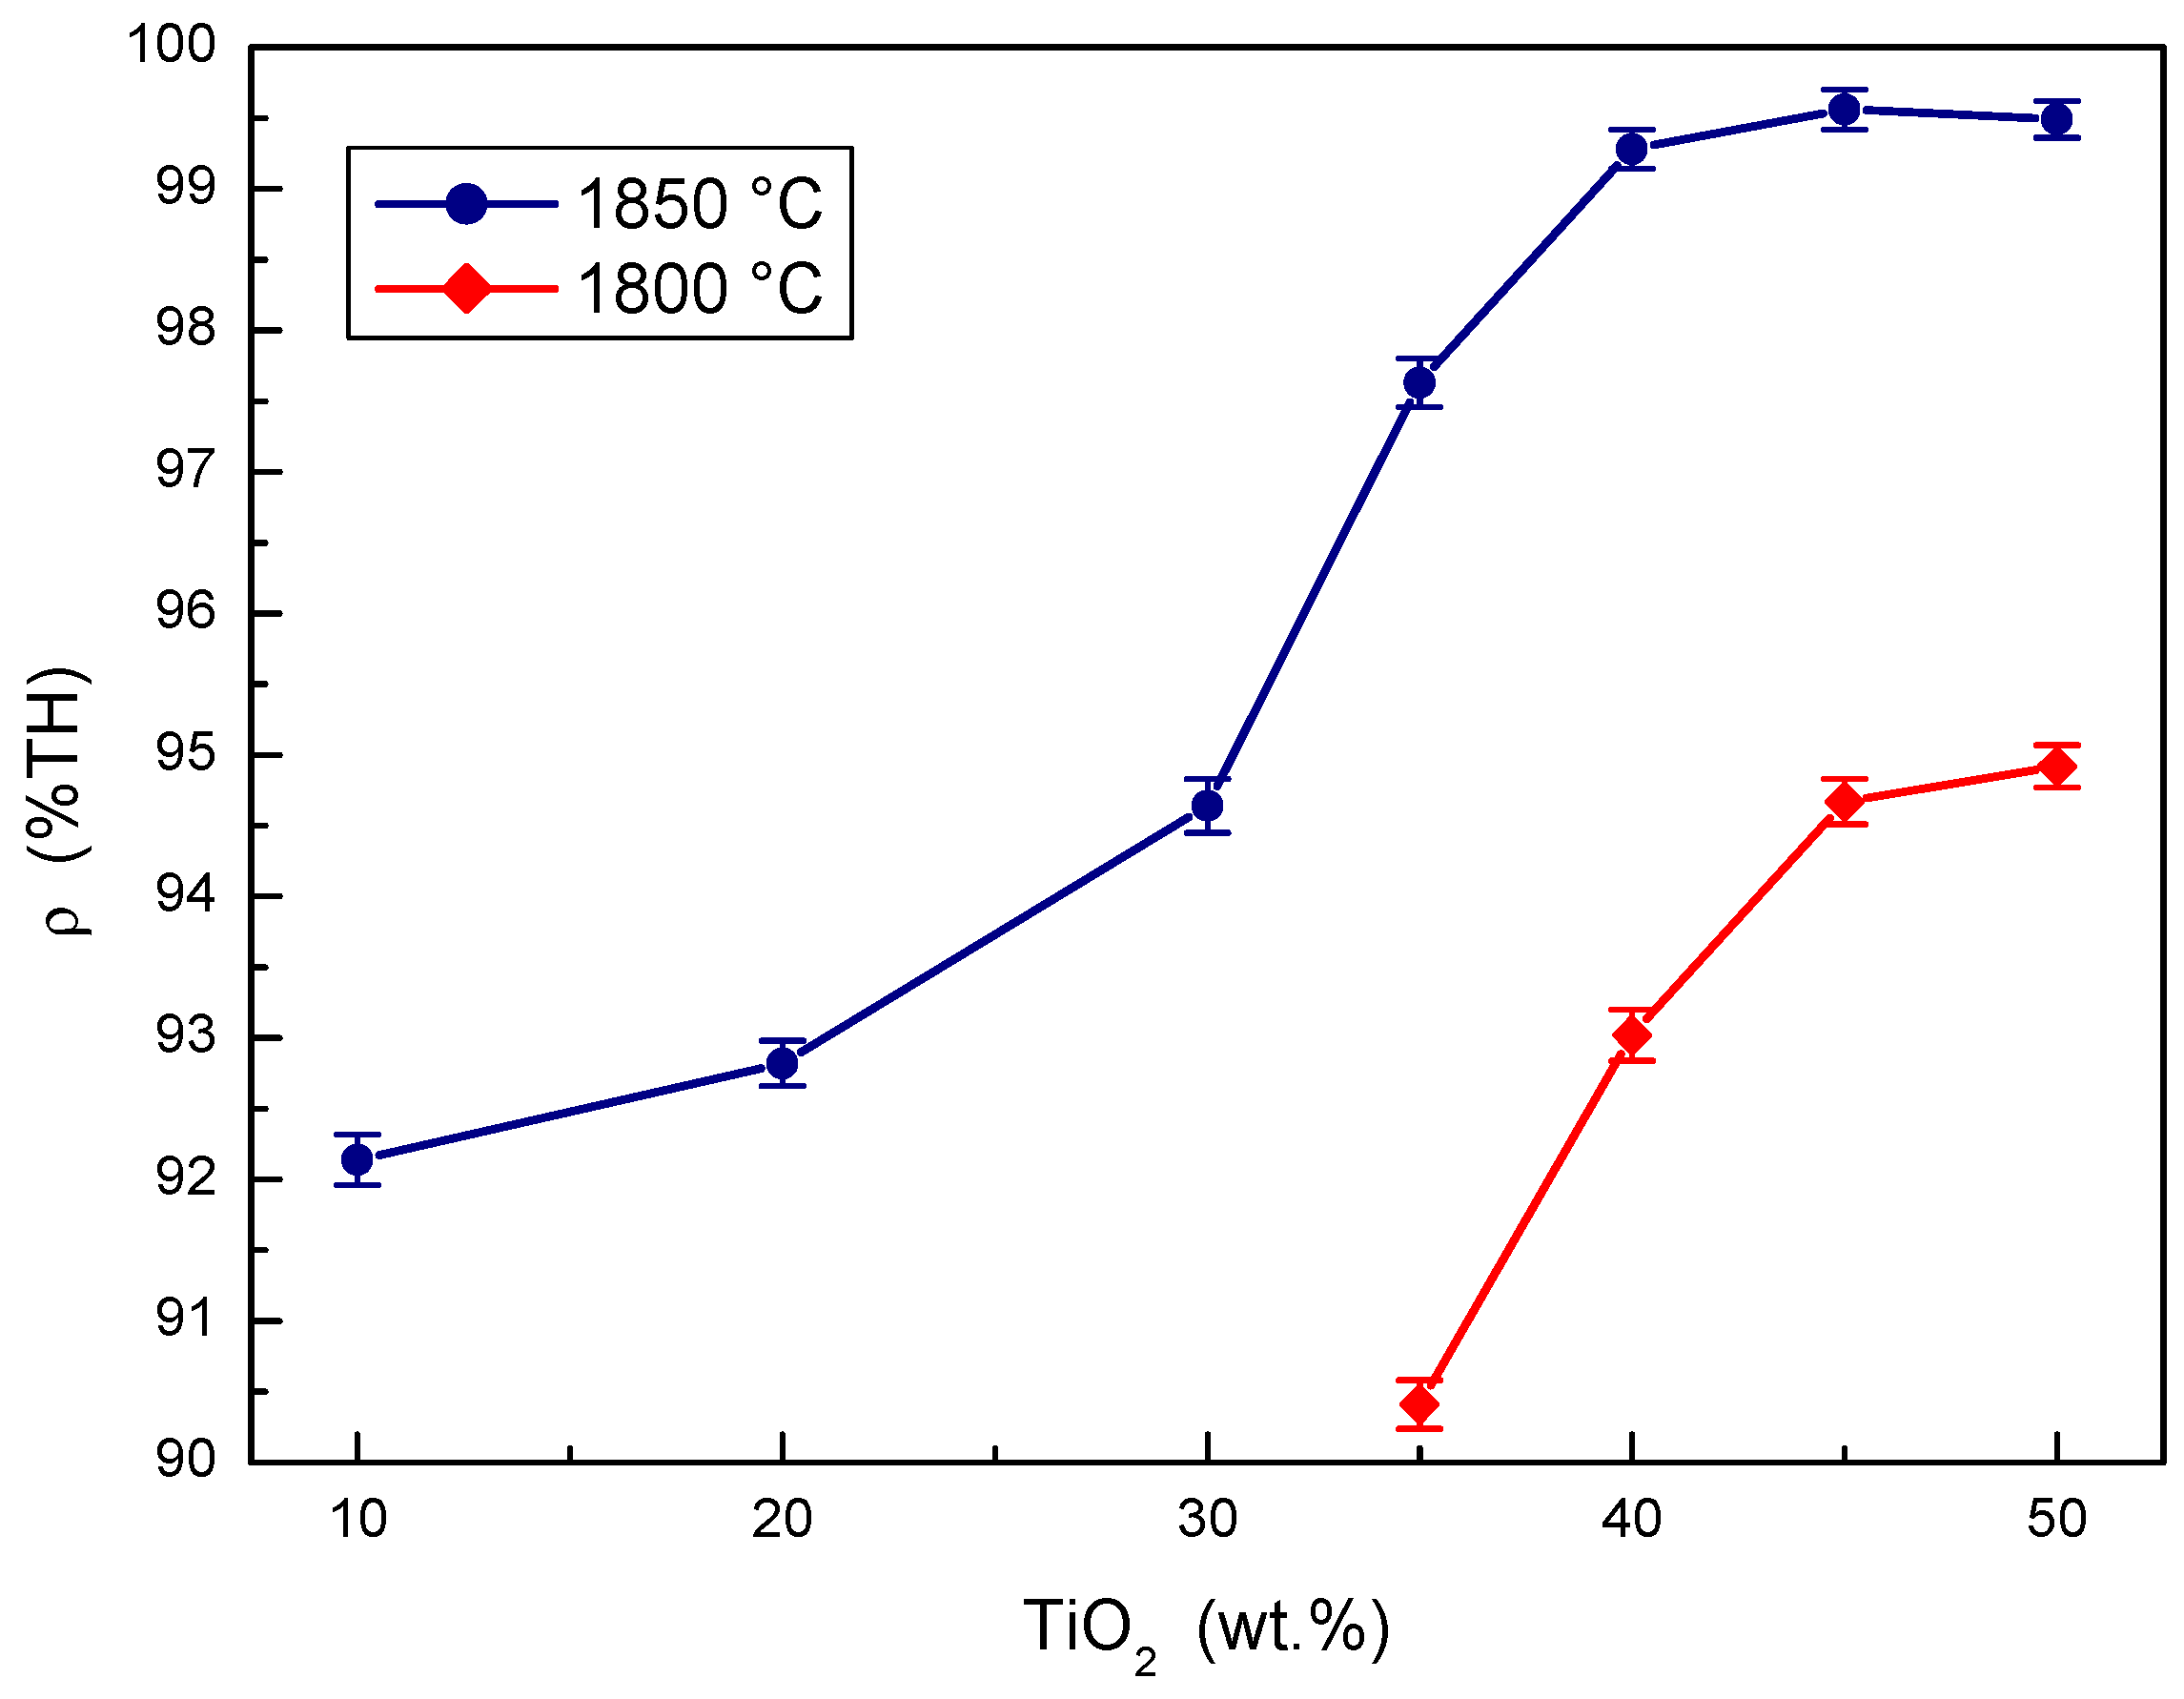
The effects of the concentration of TiO2 additive in the B4C-TiO2 precursor on the relative densities of B4C-TiB2 ceramic composites at two sintering temperatures are compared in Figure 1. At sintering a temperature of 1800 °C, the relative density of the B4C-TiB2 composite increases with the concentration of the TiO2 additive, but the maximum achieved density only reached a value of 94.92%. This insufficient densification predicates low mechanical properties and poor wear resistance. At sintering a temperature of 1850 °C, higher relative densities were measured at all initial concentrations of the TiO2 sintering additive compared to a temperature of 1800 °C. The relative density increases significantly from 92.14% at 10 wt.% TiO2 to 99.28% at 40 wt.% TiO2 when sintering at a temperature of 1850 °C. In concentration intervals from 40 to 50 wt.% TiO2 additive, the samples overlapped partially, but the highest average density of 99.56% was achieved with the composite using a 45 wt.% TiO2 additive. Measured density values show that reactive in situ sintering is beneficial for densification of B4C-TiB2 ceramics. The relative density of B4C-TiB2 composite increases with both the concentration of TiO2 sintering additive and sintering temperature because of a positive effect of these process parameters on the in situ reaction kinetics.
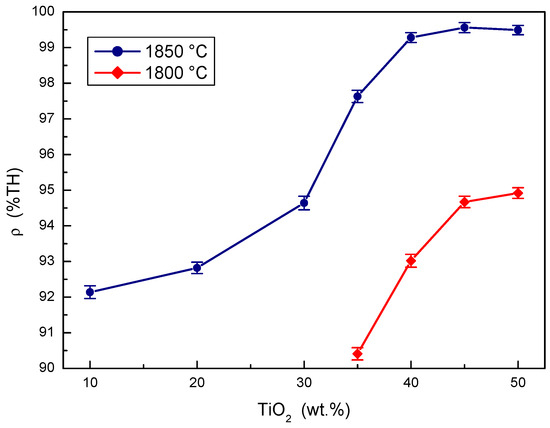
Figure 1.
The effect of TiO2 sintering additive concentration on the density of B4C-TiB2 composite.
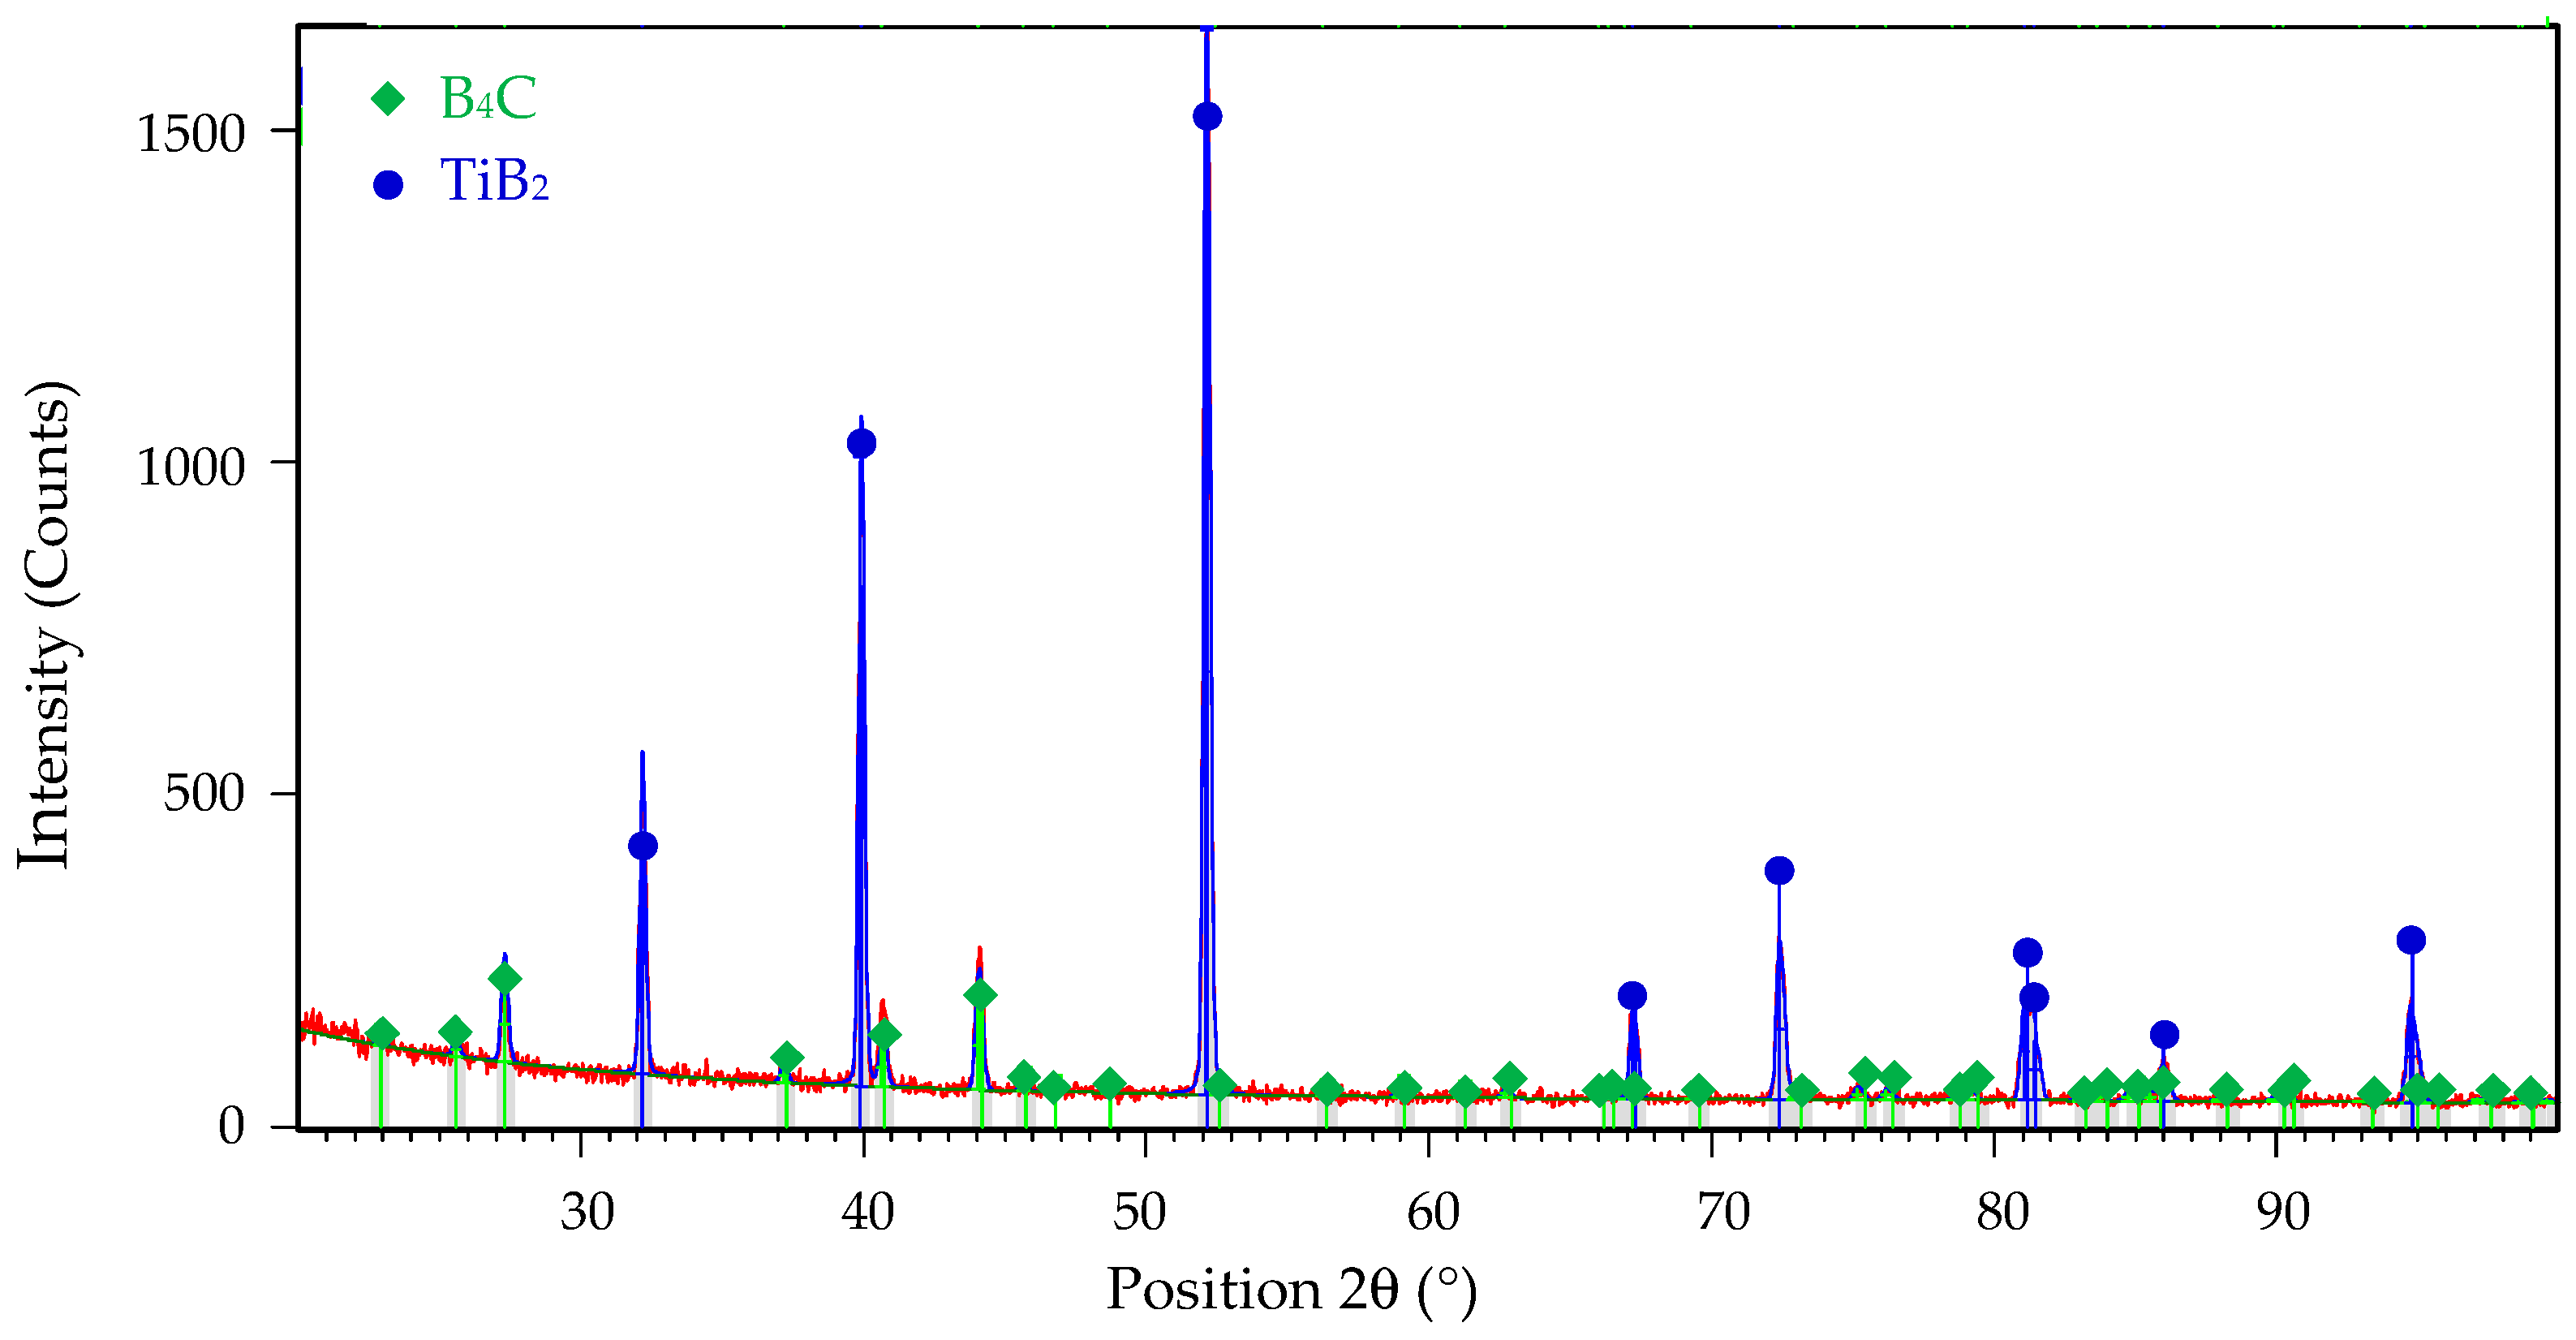
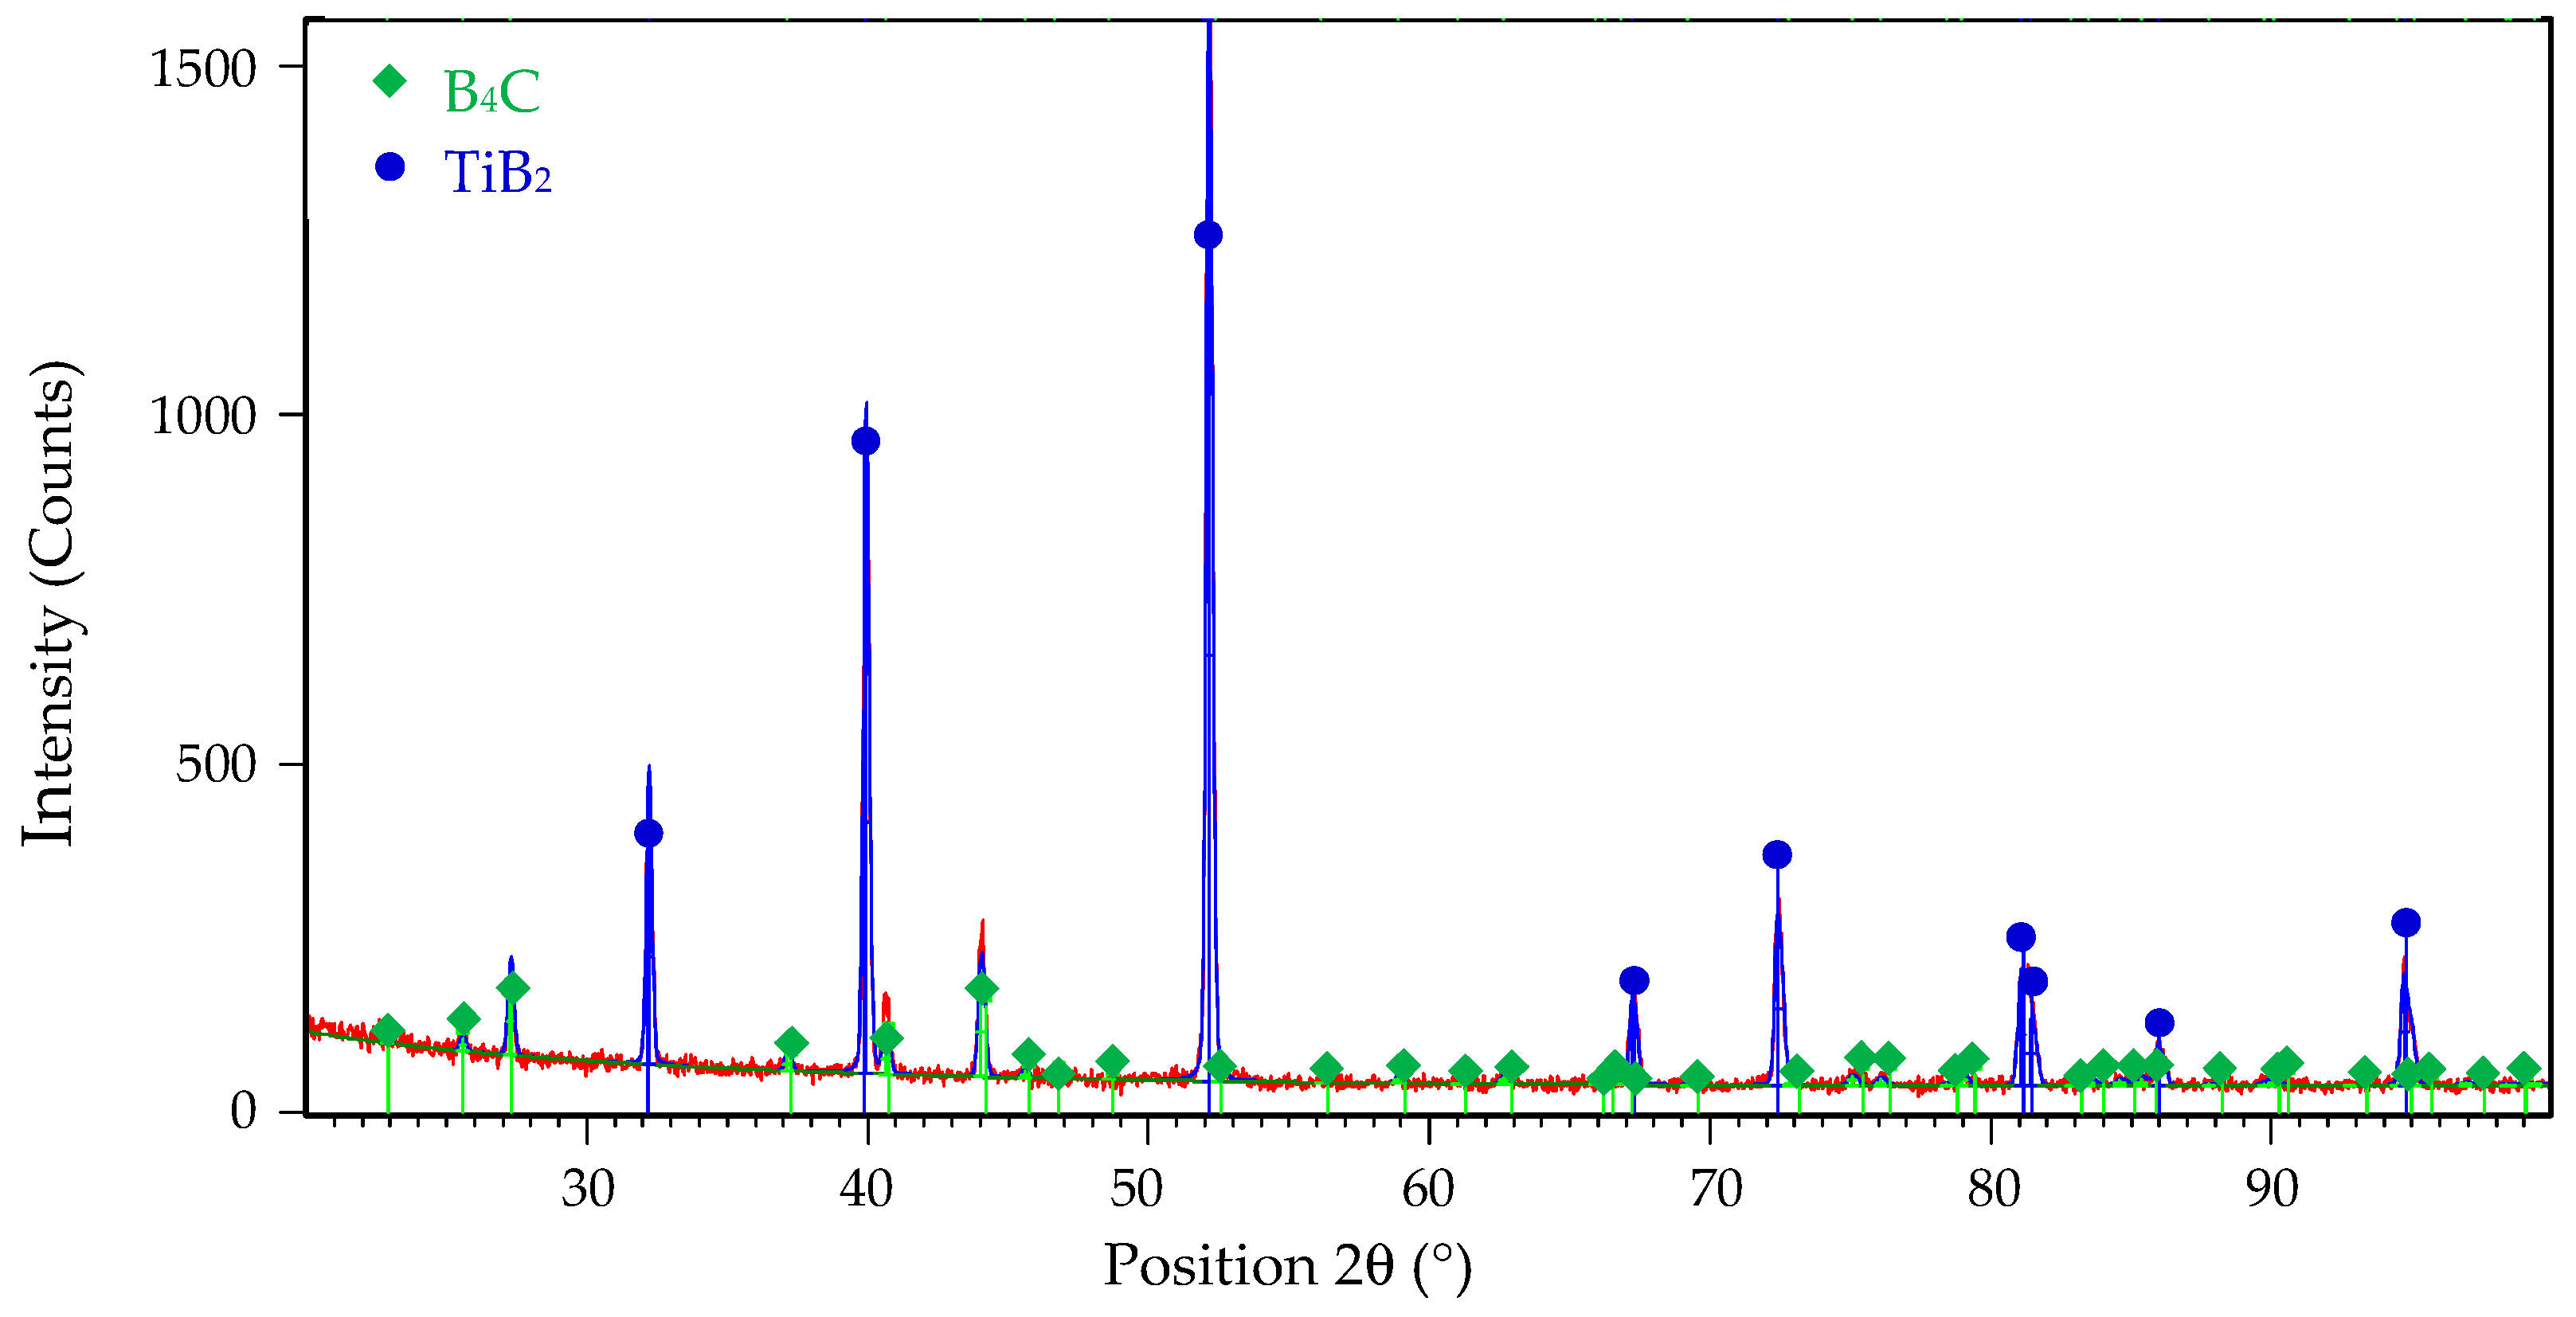
The microstructure of all samples consisted only of two phases: B4C matrix and TiB2 secondary phase. The identification of both phases was confirmed by X-ray diffraction analysis in the article [20] and can be seen from the XRD pattern of the composite reactive sintered from B4C-TiO2 precursors with 40 wt.% TiO2 in Figure 2.
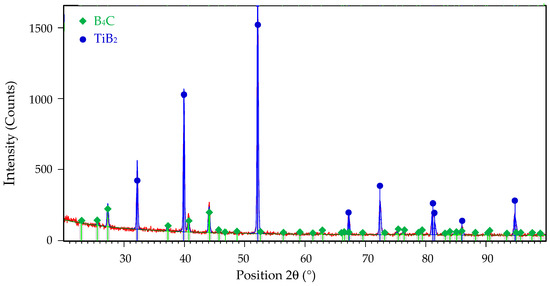
Figure 2.
The XRD pattern of B4C-TiB2 ceramic composite sintered from B4C-TiO2 precursors with 40 wt.% TiO2.
The TiB2 phase in B4C-TiB2 composite is created due to the reduction of TiO2 additive by carbon. The carbon can either be added to the powder precursor or it can originate from the B4C phase. In our research TiO2 was reduced in the absence of free carbon, by carbon originating from the B4C phase. As the thermodynamic considerations of in situ reaction with carbon originating from B4C are quite complex and affected by the lack of thermodynamic data [10], the TiO2 reduction by external carbon is useful to study and it can be described by the reactions numbered (3) to (6).
B4C(s) + 2TiO2(s) + 2C(graphite) = 2TiB2(s) + 2CO2(g) ΔG1850 °C = −167.498 kJ·mol−1
B4C(s) + 2TiO2(s) + 3C(graphite) = 2TiB2(s) + 4CO(g) ΔG1850 °C = −560.206 kJ·mol−1
B4C(s) + 3TiO2(s) + 3C(graphite) = 3TiC(s) + 2B2O3(l) ΔG1850 °C = −282.204 kJ·mol−1
B4C(s) + 2TiC(s) = 2TiB2(s) + 3C(graphite) ΔG1850 °C = −191.066 kJ·mol−1
The thermodynamic data for elementary reactions [21] show that the absolute value of the standard Gibbs energy change at 1850 °C for reaction (4) is much higher than for reactions (3) and (5). These values indicate preferable formation of TiB2 and CO. According to the reaction (5) the TiC phase could be formed, but its stability is low because of reaction (6), which leads back to the formation of TiB2 phase. The reduction of TiO2 by carbon originating from B4C phase is described by in situ reaction (7).
mB4C(s) + nTiO2(s) = oB4C1−x(s) + pTiB2(s) + qCO(g) (or CO2(g))
Thermodynamic considerations of reaction (7) are described in detail in the article [10]. According to these considerations, the reaction (7) is thermodynamically probable in the temperature range from 1300 to 1900 K. The TiB2 phase is created because of TiO2 reduction by carbon originating from the B4C phase, which transforms into sub-stoichiometric boron carbide (B4C1−x). In later stages of the sintering process, the sub-stoichiometric boron carbide reverses to the stoichiometric composition by inward diffusion of carbon from external sources and by loss of excess boron through evaporation, resulting in the creation of the B4C-TiB2 composite material [9,10]. This phase composition without sub-stoichiometry of B4C is confirmed in the XRD pattern in Figure 2. Similar formations of in situ ceramic phases were described in relevant articles [22,23]. The microstructures of B4C-TiB2 ceramic composites with different portions of TiB2 secondary phase and densification above 99% are documented in Figure 3 and Figure 4. The gray areas represent the B4C matrix, and the lighter areas represent the TiB2 secondary phase, which was created by an in situ reaction during the sintering process. In samples with lower densities, rest porosity was observed. As these samples predict low mechanical properties, their microstructure was not documented.
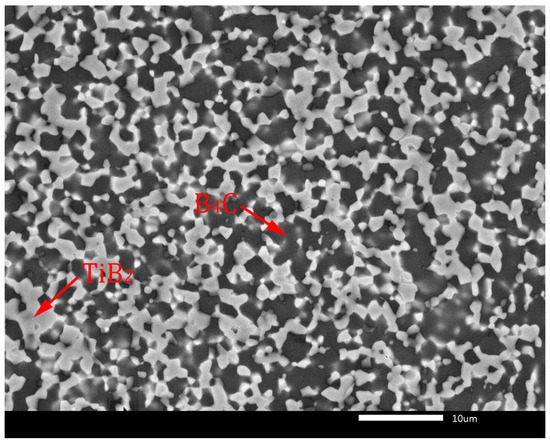
Figure 3.
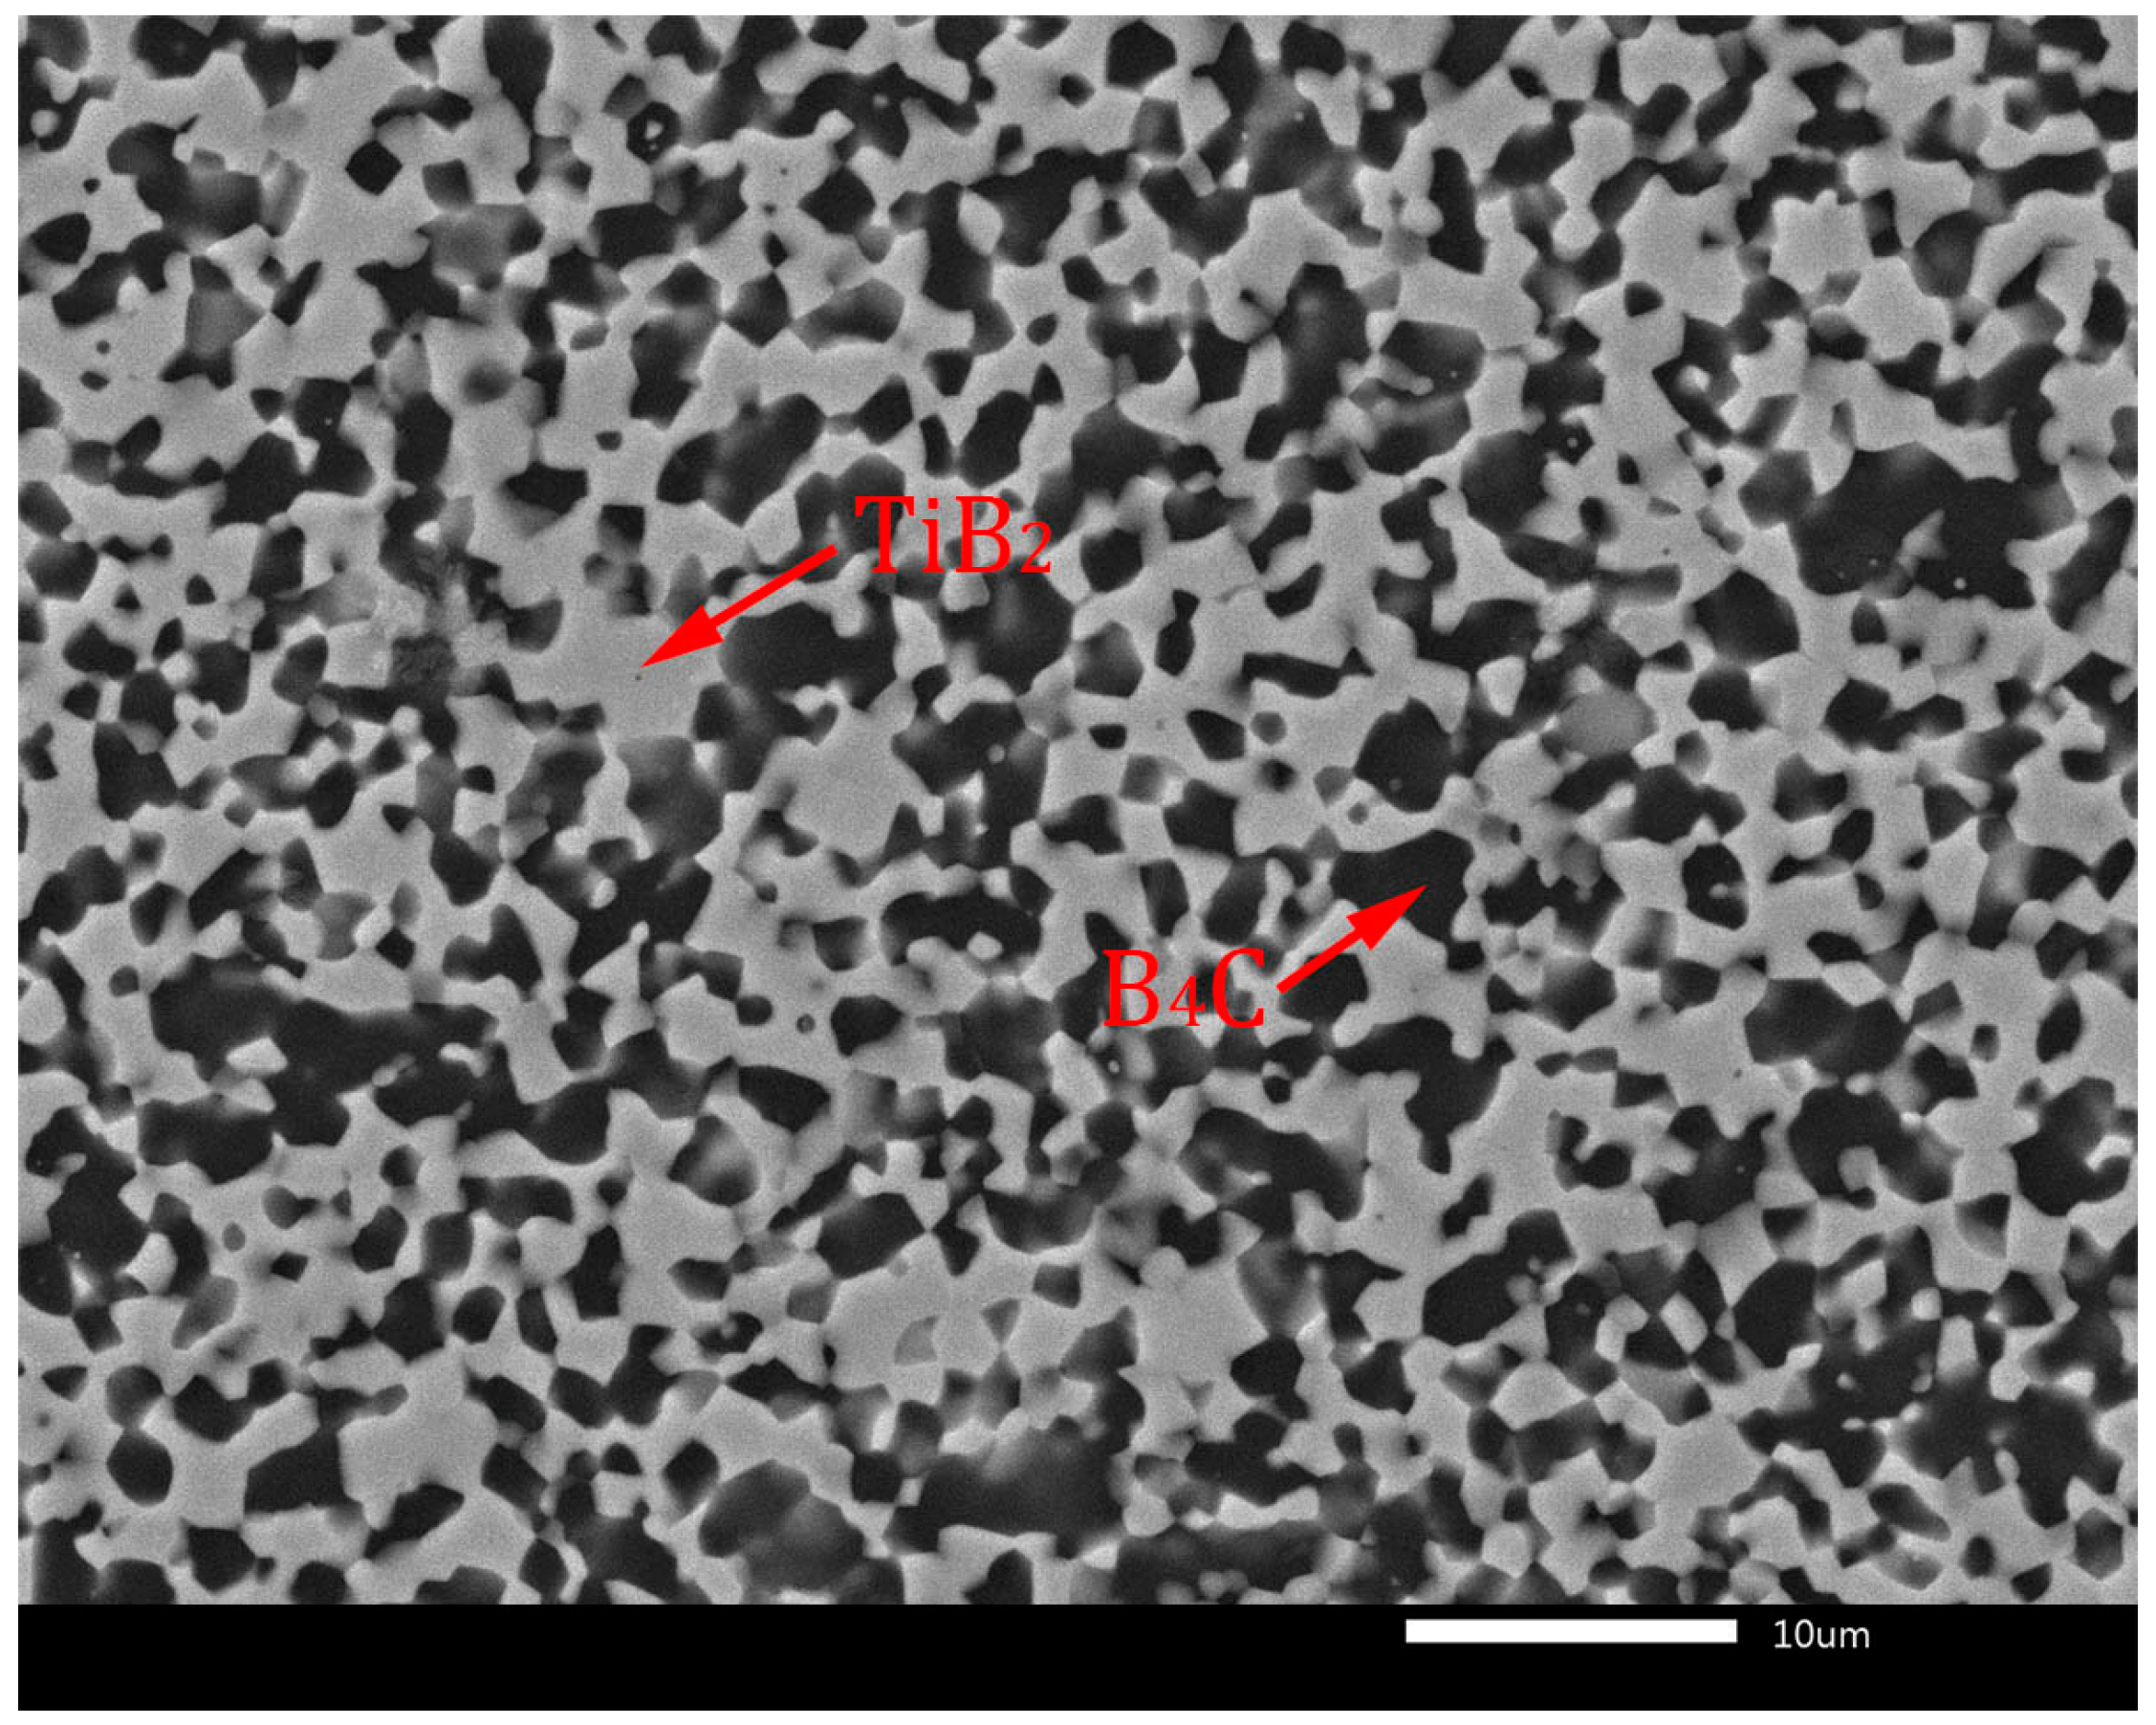
Microstructure of B4C-TiB2 ceramic composite with 29.8 vol.% TiB2.
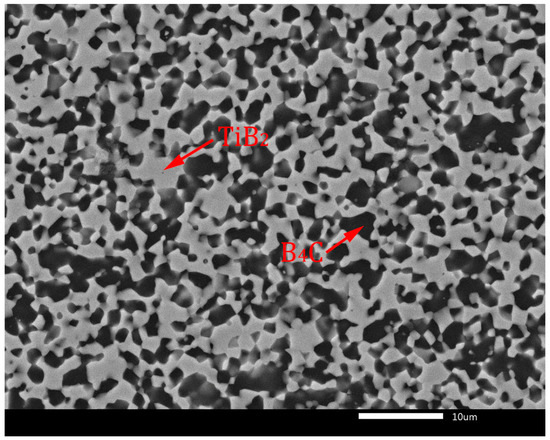
Figure 4.
Microstructure of B4C-TiB2 ceramic composite with 40.2 vol.% TiB2.
Figure 3 shows the full dense microstructure of a B4C-TiB2 ceramic composite with 29.8 vol.% TiB2 secondary phase, which was in situ sintered at 1850 °C from precursors with a 40 wt.% TiO2 additive. The microstructure of the B4C-TiB2 composite with a 40.2 vol.% TiB2 secondary phase is documented in Figure 4. The composite was prepared from a B4C-TiO2 precursor with the highest concentration of 50 wt.% TiO2, which is related to the largest extent of the in situ reaction at a sintering temperature of 1850 °C.
The identification of microstructure of the B4C-TiB2 composite was supported by EDS mapping, which is documented at higher magnification for the composite with 29.8 vol.% TiB2 in Figure 5. Distinct segregation of B (Figure 5b) and Ti (Figure 5c) elements enables the identification of the B4C matrix as well as the TiB2 secondary phase in Figure 5a. However, the distribution of C in Figure 5d is influenced by the signal artefacts originated from polymer window of EDS detector.
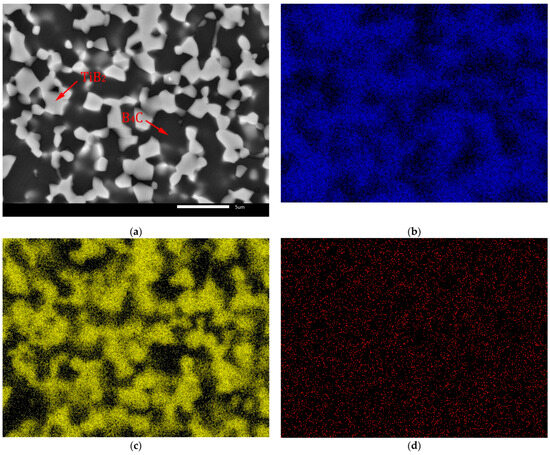
Figure 5.
EDS mapping of B4C-TiB2 ceramic composite with 29.8 vol.% TiB2: (a) SEM image; (b) Distribution of B (K α1-2); (c) Distribution of Ti (K α1); (d) Distribution of C (K α1-2).
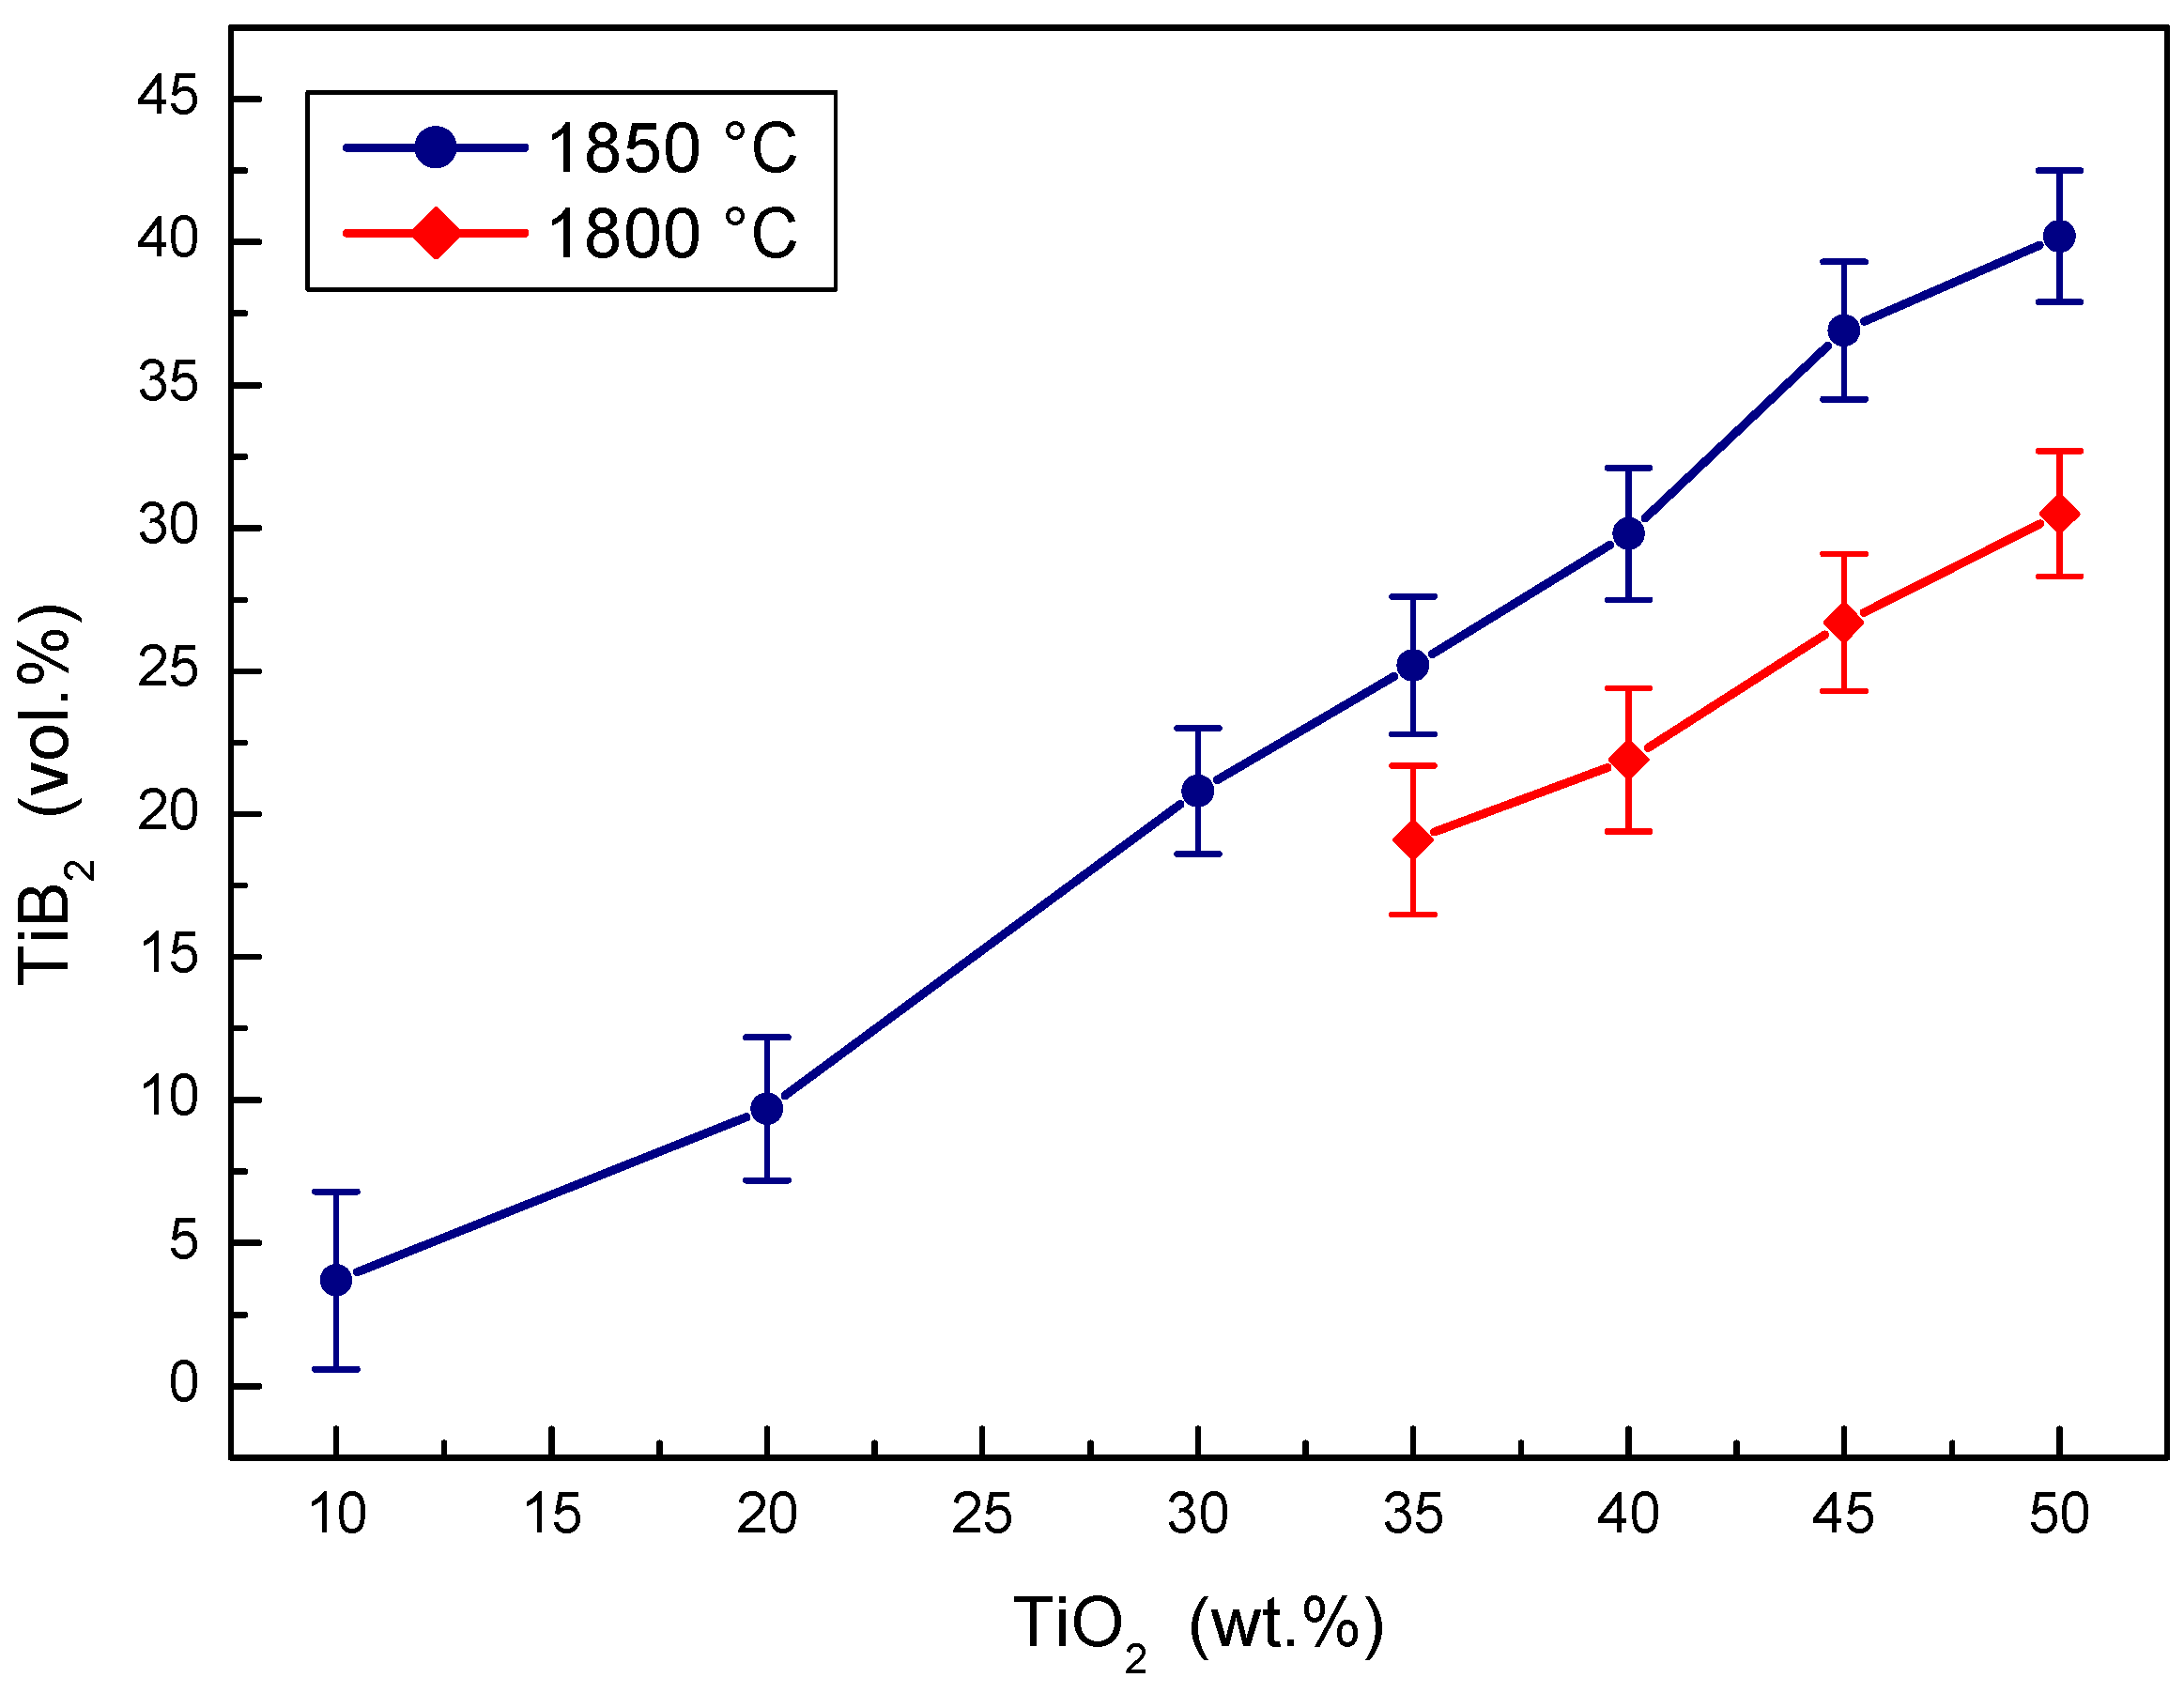
The concentration effect of the TiO2 additive on the volume portion of the TiB2 secondary phase created during the in situ reactive sintering in B4C-TiB2 ceramic composite is documented in Figure 6. The portion of B4C and TiB2 phase was measured using image analysis. The portion of TiB2 phase in the B4C-TiB2 composite increases with the increase of TiO2 additive in B4C-TiO2 powder precursor at both sintering temperatures. Higher portions of TiB2 secondary phase were measured at higher temperatures, because of the positive effect of temperature on the extent of in situ reaction during the hot-pressing process. The average portion of TiB2 secondary phase increases from 3.7 vol.% TiB2 when adding 10 wt.% TiO2 to 40.2 vol.% TiB2 and when adding a 50 wt.% TiO2 additive into the precursors and sintering at 1850 °C. At a sintering temperature of 1800 °C, the portion of the TiB2 secondary phase increases from 19.1 vol.% TiB2 when adding 35 wt.% TiO2 to 30.5 vol.% TiB2 when adding 50 wt.% TiO2.
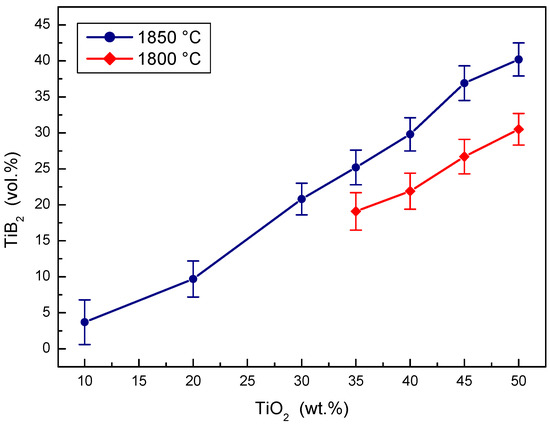
Figure 6.
The effect of TiO2 sintering additive concentration on the TiB2 secondary phase portion created in B4C-TiB2 composite.
3.2. Mechanical Properties of B4C-TiB2 Ceramic Composite
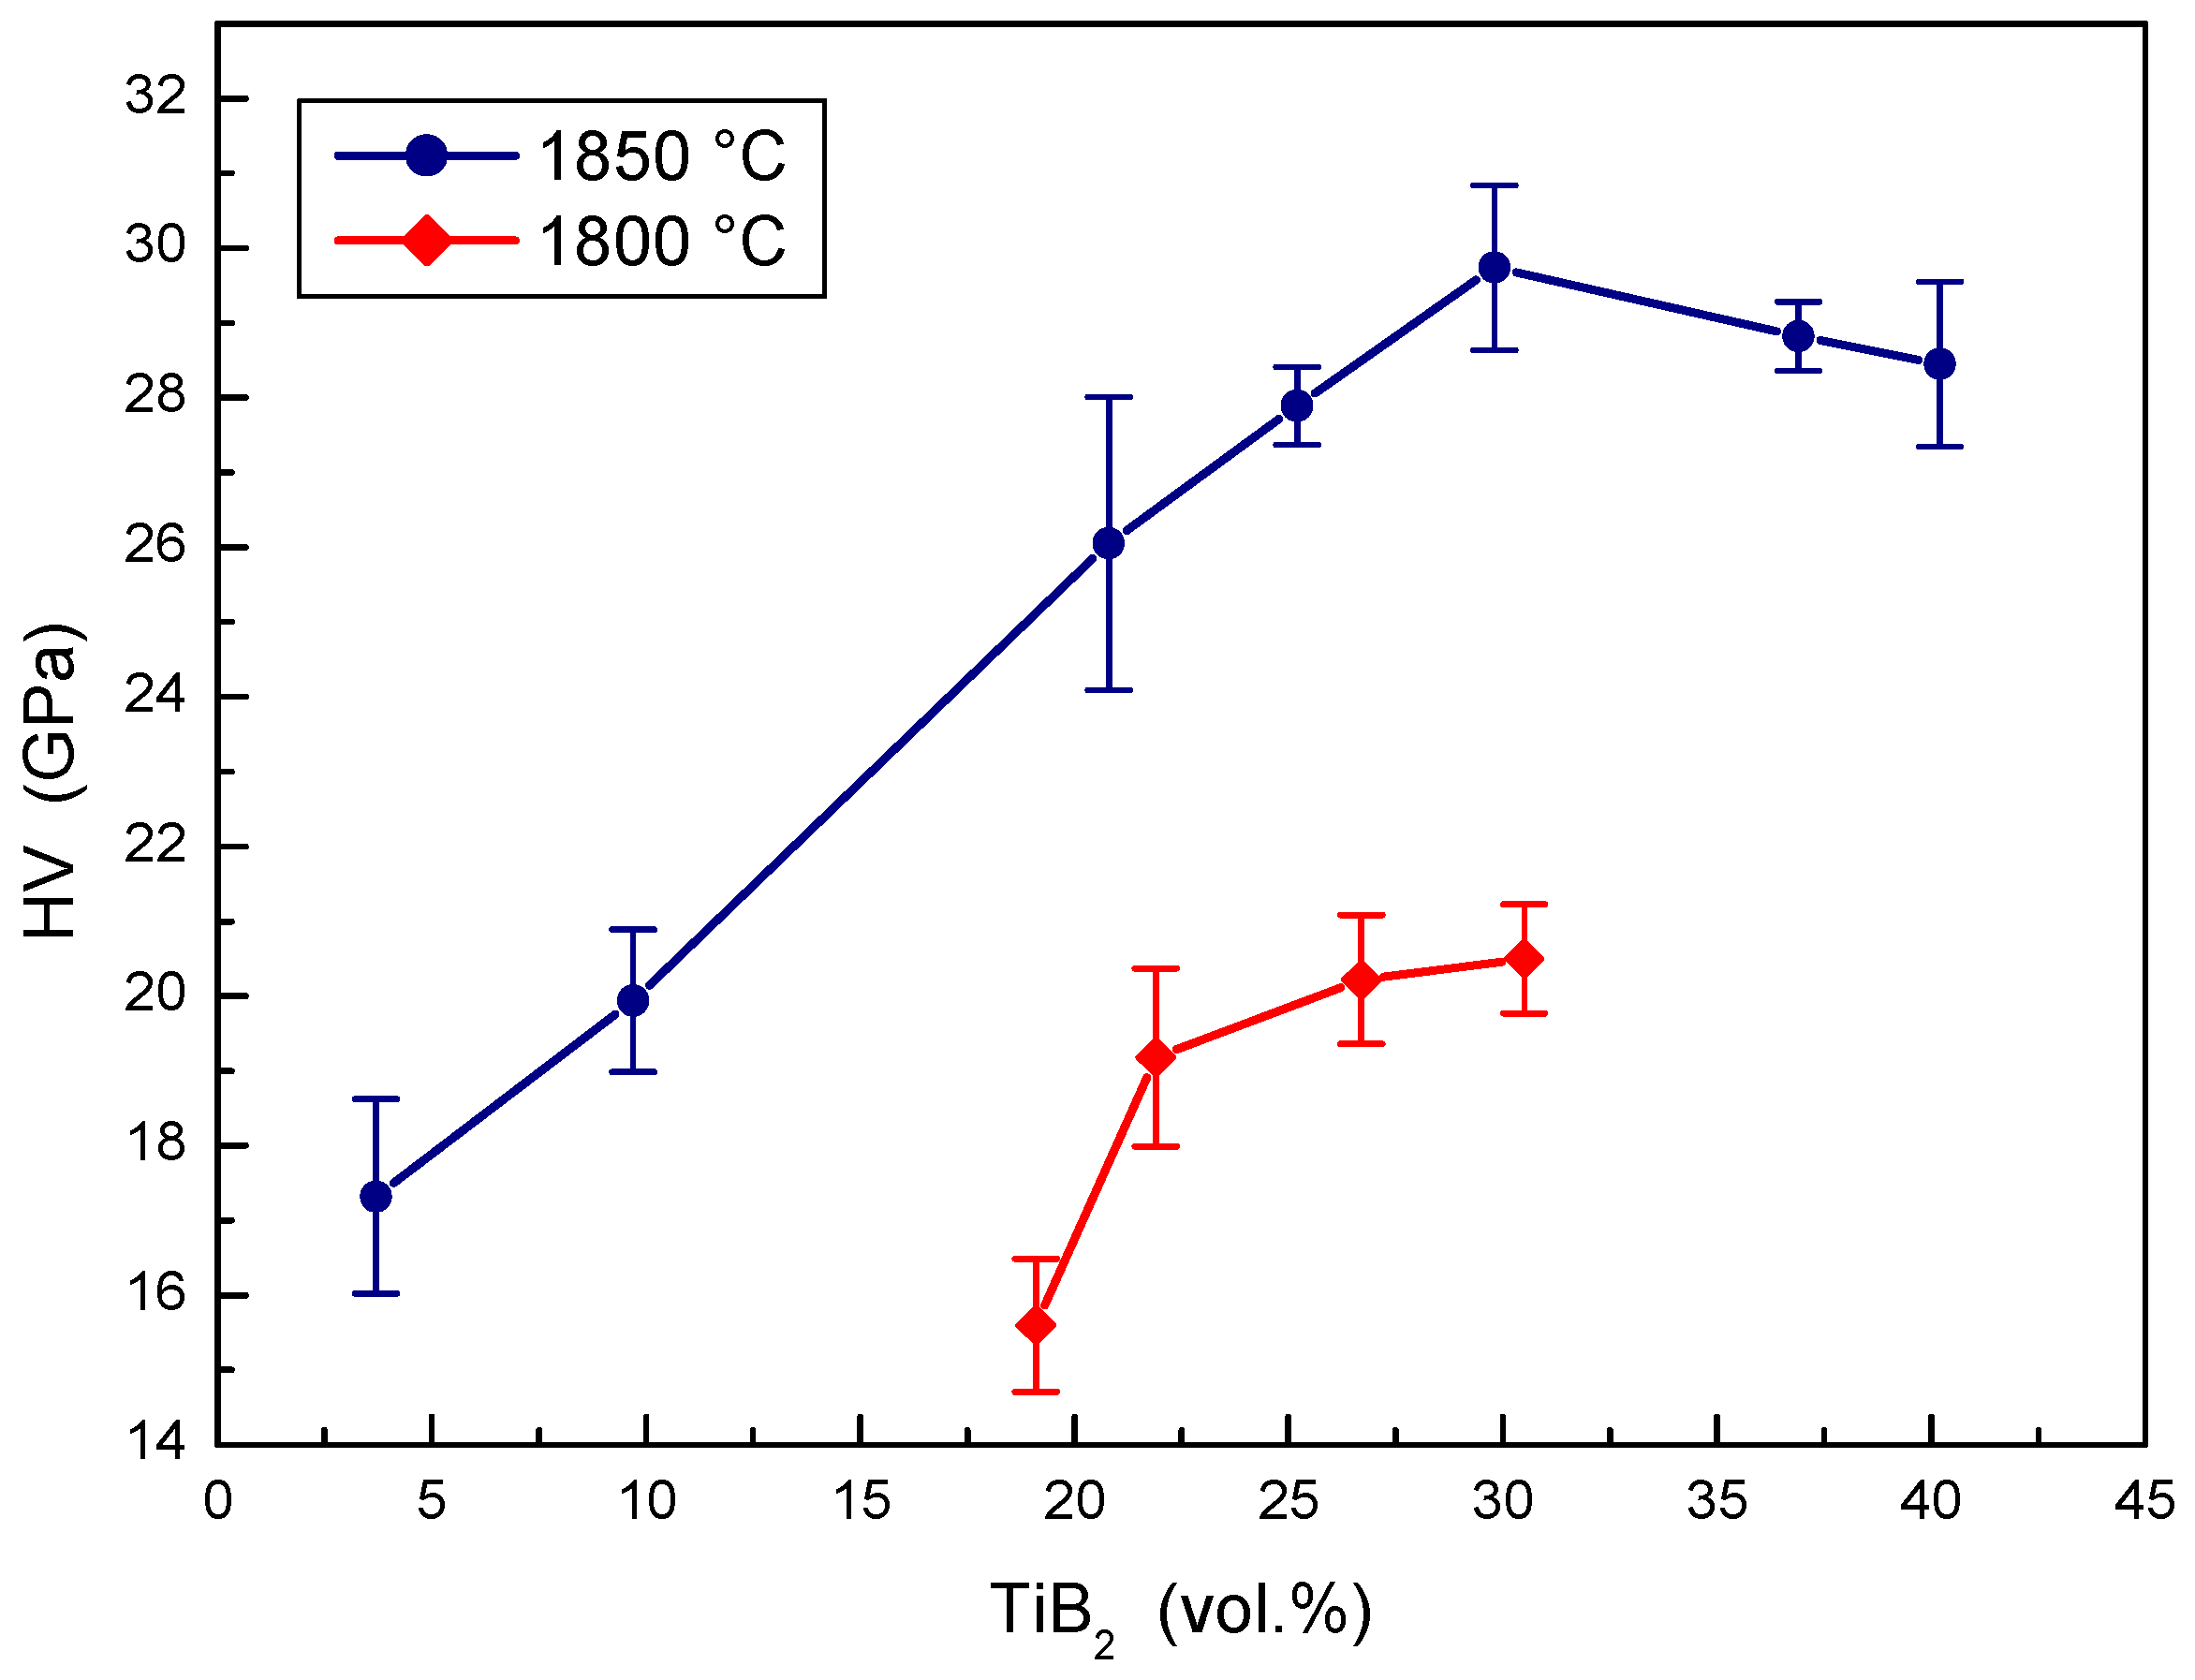
The effect of TiB2 portions on the hardness of B4C-TiB2 composites prepared at two sintering temperatures is illustrated in Figure 7. The hardness of B4C-TiB2 composites in situ sintered at a temperature of 1800 °C increases in the entire concentration interval of TiB2 secondary phase. It increases from 15.6 GPa in composites with 19.1 vol.% TiB2 to 20.5 GPa in composites with 30.5 vol.% TiB2. Relatively low hardness values of all samples are the consequence of non-sufficient densification of composites sintered at a temperature of 1800 °C. Higher hardness values were measured in B4C-TiB2 composites sintered at a temperature of 1850 °C. These values increase from 17.32 to 29.74 GPa when the concentration interval of TiB2 secondary phase from 3.7 to 29.8 vol.% is increased. The maximal hardness value corresponds to the increase of density above 99% in sintered composites. This increase of the hardness was caused by significant densification of B4C-TiB2 composites, which was enhanced by the concentration of TiO2 additive in the B4C-TiO2 precursors. After achieving the proper densification, the average hardness slightly decreases from 29.74 to 28.45 GPa with the increase of the TiB2 secondary phase from 29.8 to 40.2 vol.%, because of the lower hardness of TiB2 compared to B4C. The hardness values achieved for B4C-TiB2 ceramic composites are in good accordance with the results of several works, such as 32.2 GPa [15], 39.3 GPa [18], and 25.9 GPa [16] in B4C-TiB2 ceramic composites with 25, 30, and 43 vol.% TiB2, respectively.
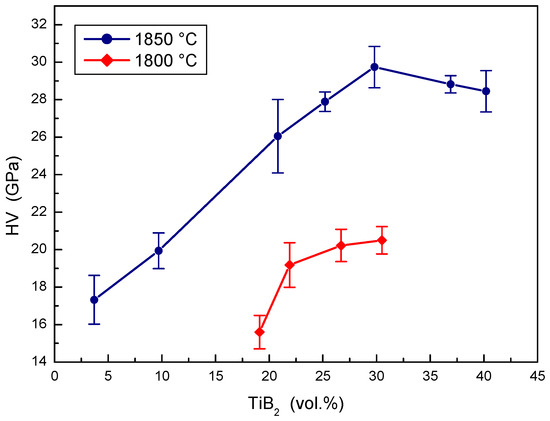
Figure 7.
The effect of TiB2 secondary phase portion on the hardness of B4C-TiB2 composite.
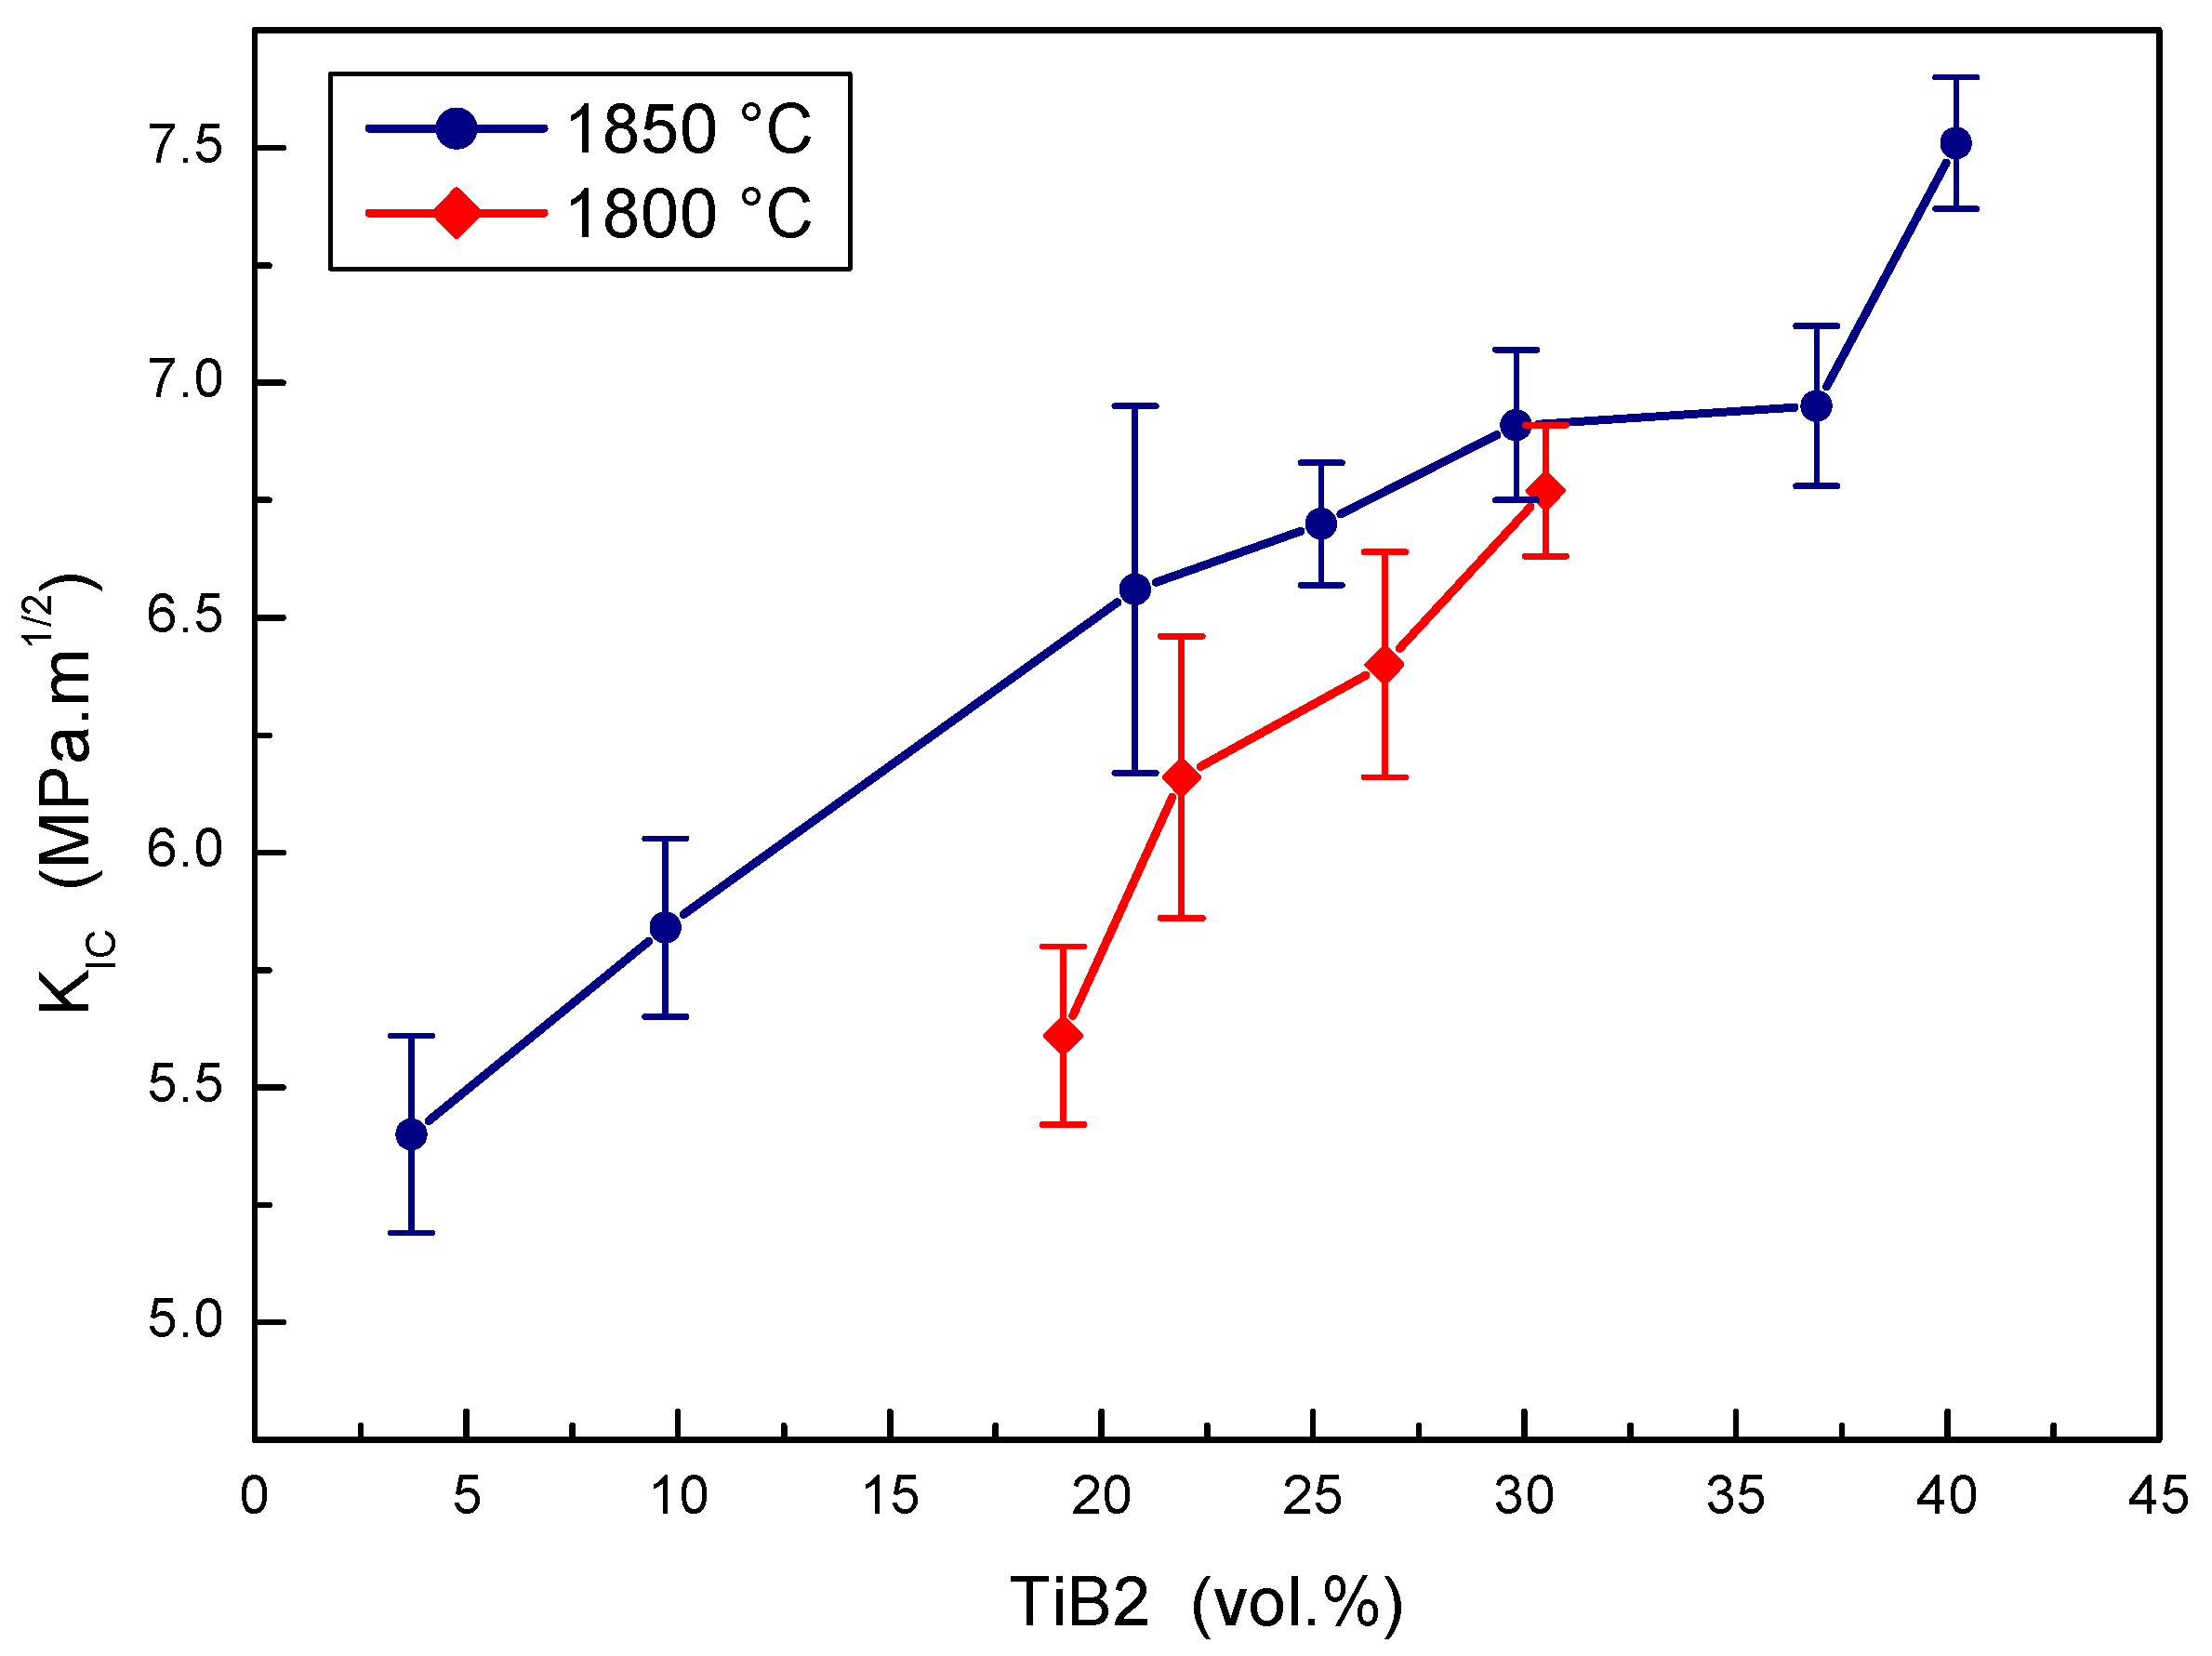
The effect of TiB2 portions on the fracture toughness of B4C-TiB2 composites sintered at two experimental temperatures is depicted in Figure 8. The portion of TiB2 secondary phase has a clear positive effect on the fracture toughness of the B4C-TiB2 composite sintered at both temperatures, but lower values were measured at the lower sintering temperature. The fracture toughness increases from 5.61 to 6.77 MPa·m1/2 with the increased portion of TiB2 from 19.1 to 30.5 vol.% at a sintering temperature of 1800 °C. However, the fracture toughness increases from 5.40 to 7.51 MPa·m1/2 with the increased portion of TiB2 from 3.7 to 40.2 vol.% at a sintering temperature of 1850 °C. Both proper densification and the high portion of TiB2 phase support the increase of fracture toughness in the B4C-TiB2 composite, and they are the consequence of higher extent of in situ reaction at higher concentrations of TiO2 additive. Measured values of fracture toughness are comparable with the values of 3.0 [18], 8.2 [6], and 8.7 MPa·m1/2 [16], which were reported in B4C-TiB2 composites with 30, 40, and 43 vol.% of TiB2 secondary phase, respectively.
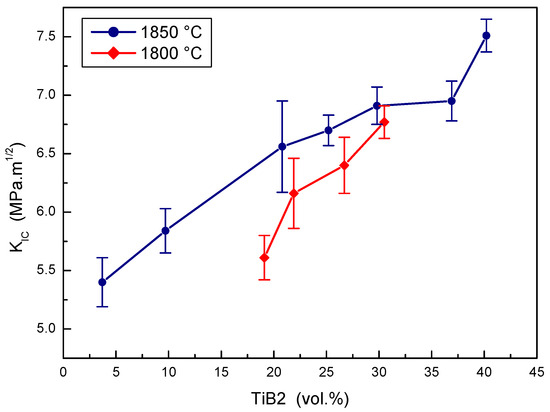
Figure 8.
The effect of TiB2 secondary phase portion on the fracture toughness of B4C-TiB2 composite.
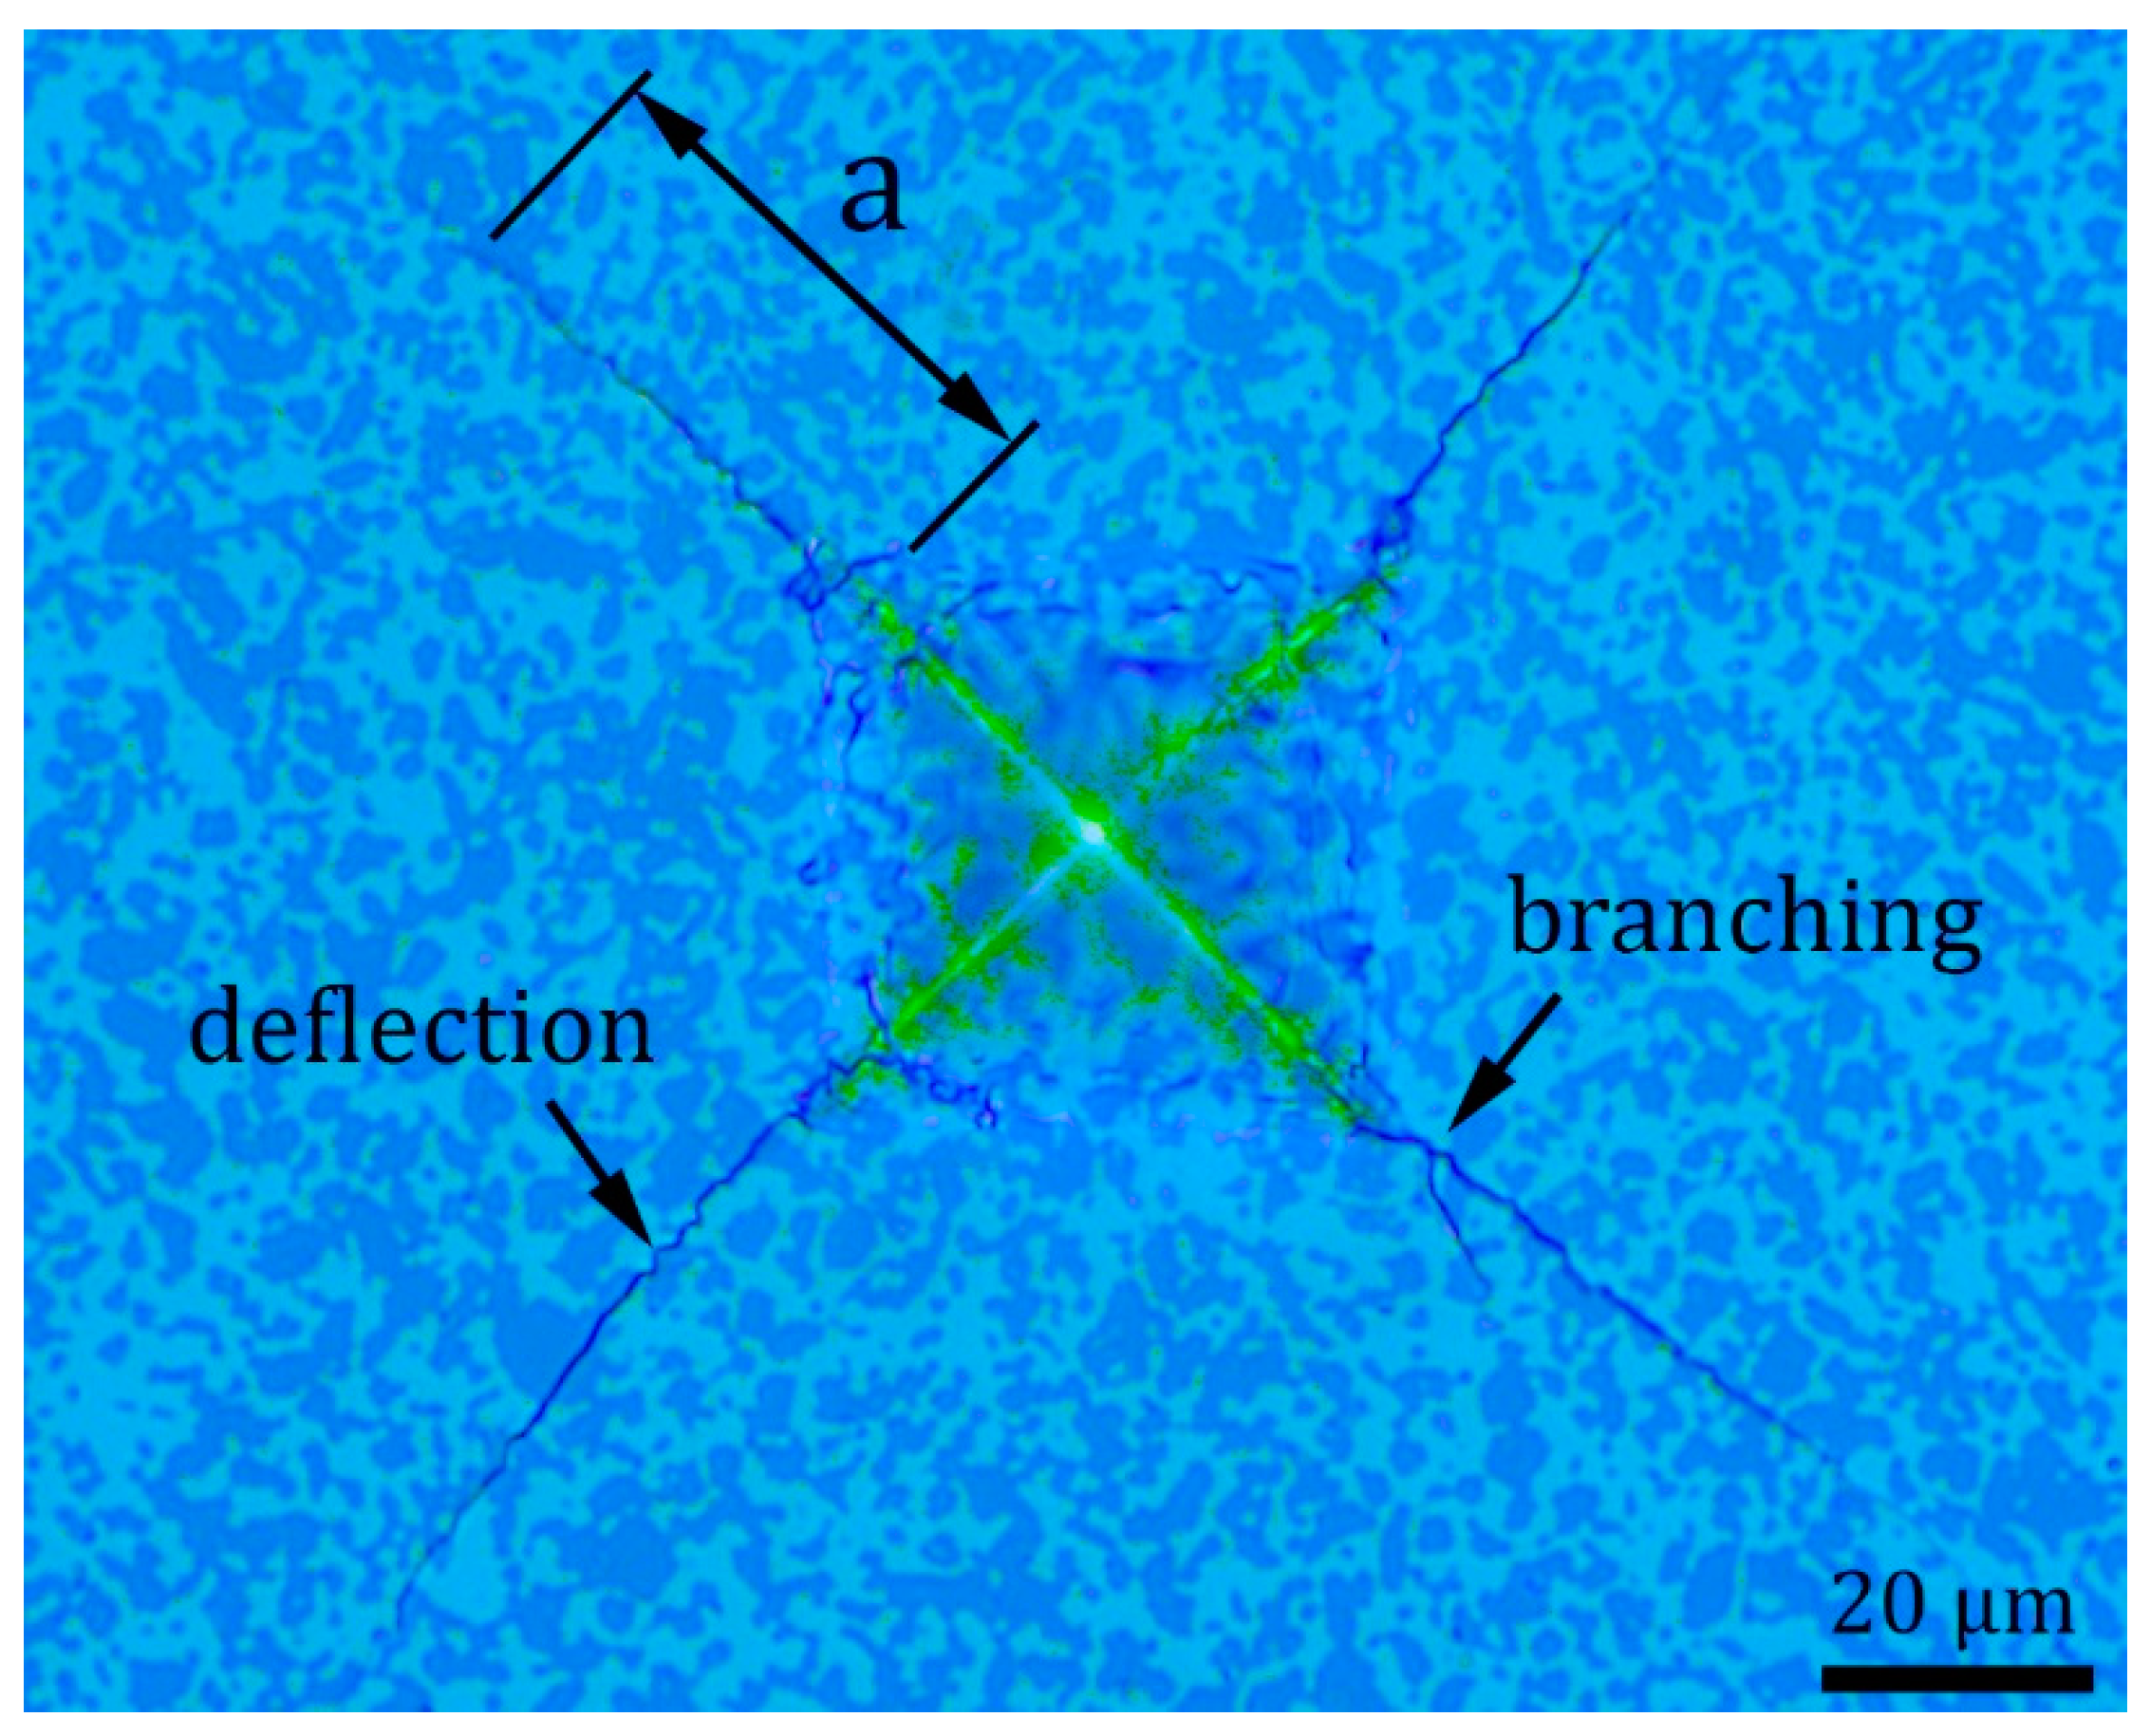
Figure 9 documents Vickers indentation morphology of B4C-TiB2 composite (40.2 vol.% TiB2) with radial cracks initiating from the corners of impression. The length (a) of one crack is marked in Figure 9, and it was used for fracture toughness calculation according to Equation (2). Two toughening mechanisms, crack deflection and crack branching, are labelled in Figure 9. These intrinsic toughening mechanisms are caused by residual stresses between B4C and TiB2 phase interfaces during the propagation of cracks. Crack deflection increases the fracture toughness of ceramic composite by extending the crack propagation path. Crack branching increases the fracture toughness of ceramic composite by increasing of crack propagation energy due to the creation of new cracks [24].
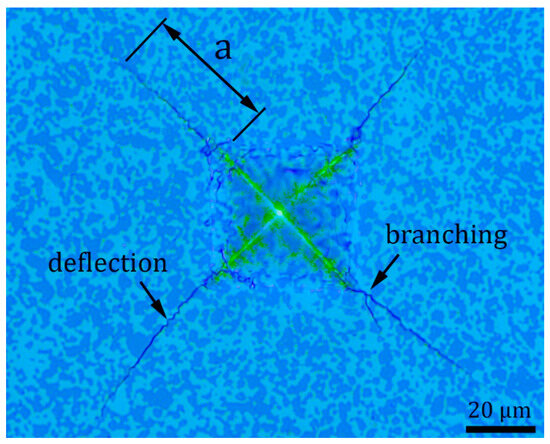
Figure 9.
Vickers indentation morphology of B4C-TiB2 composite with 40.2 vol.% TiB2, the length (a) of one radial crack.
3.3. Wear Resistance of B4C-TiB2 Ceramic Composite
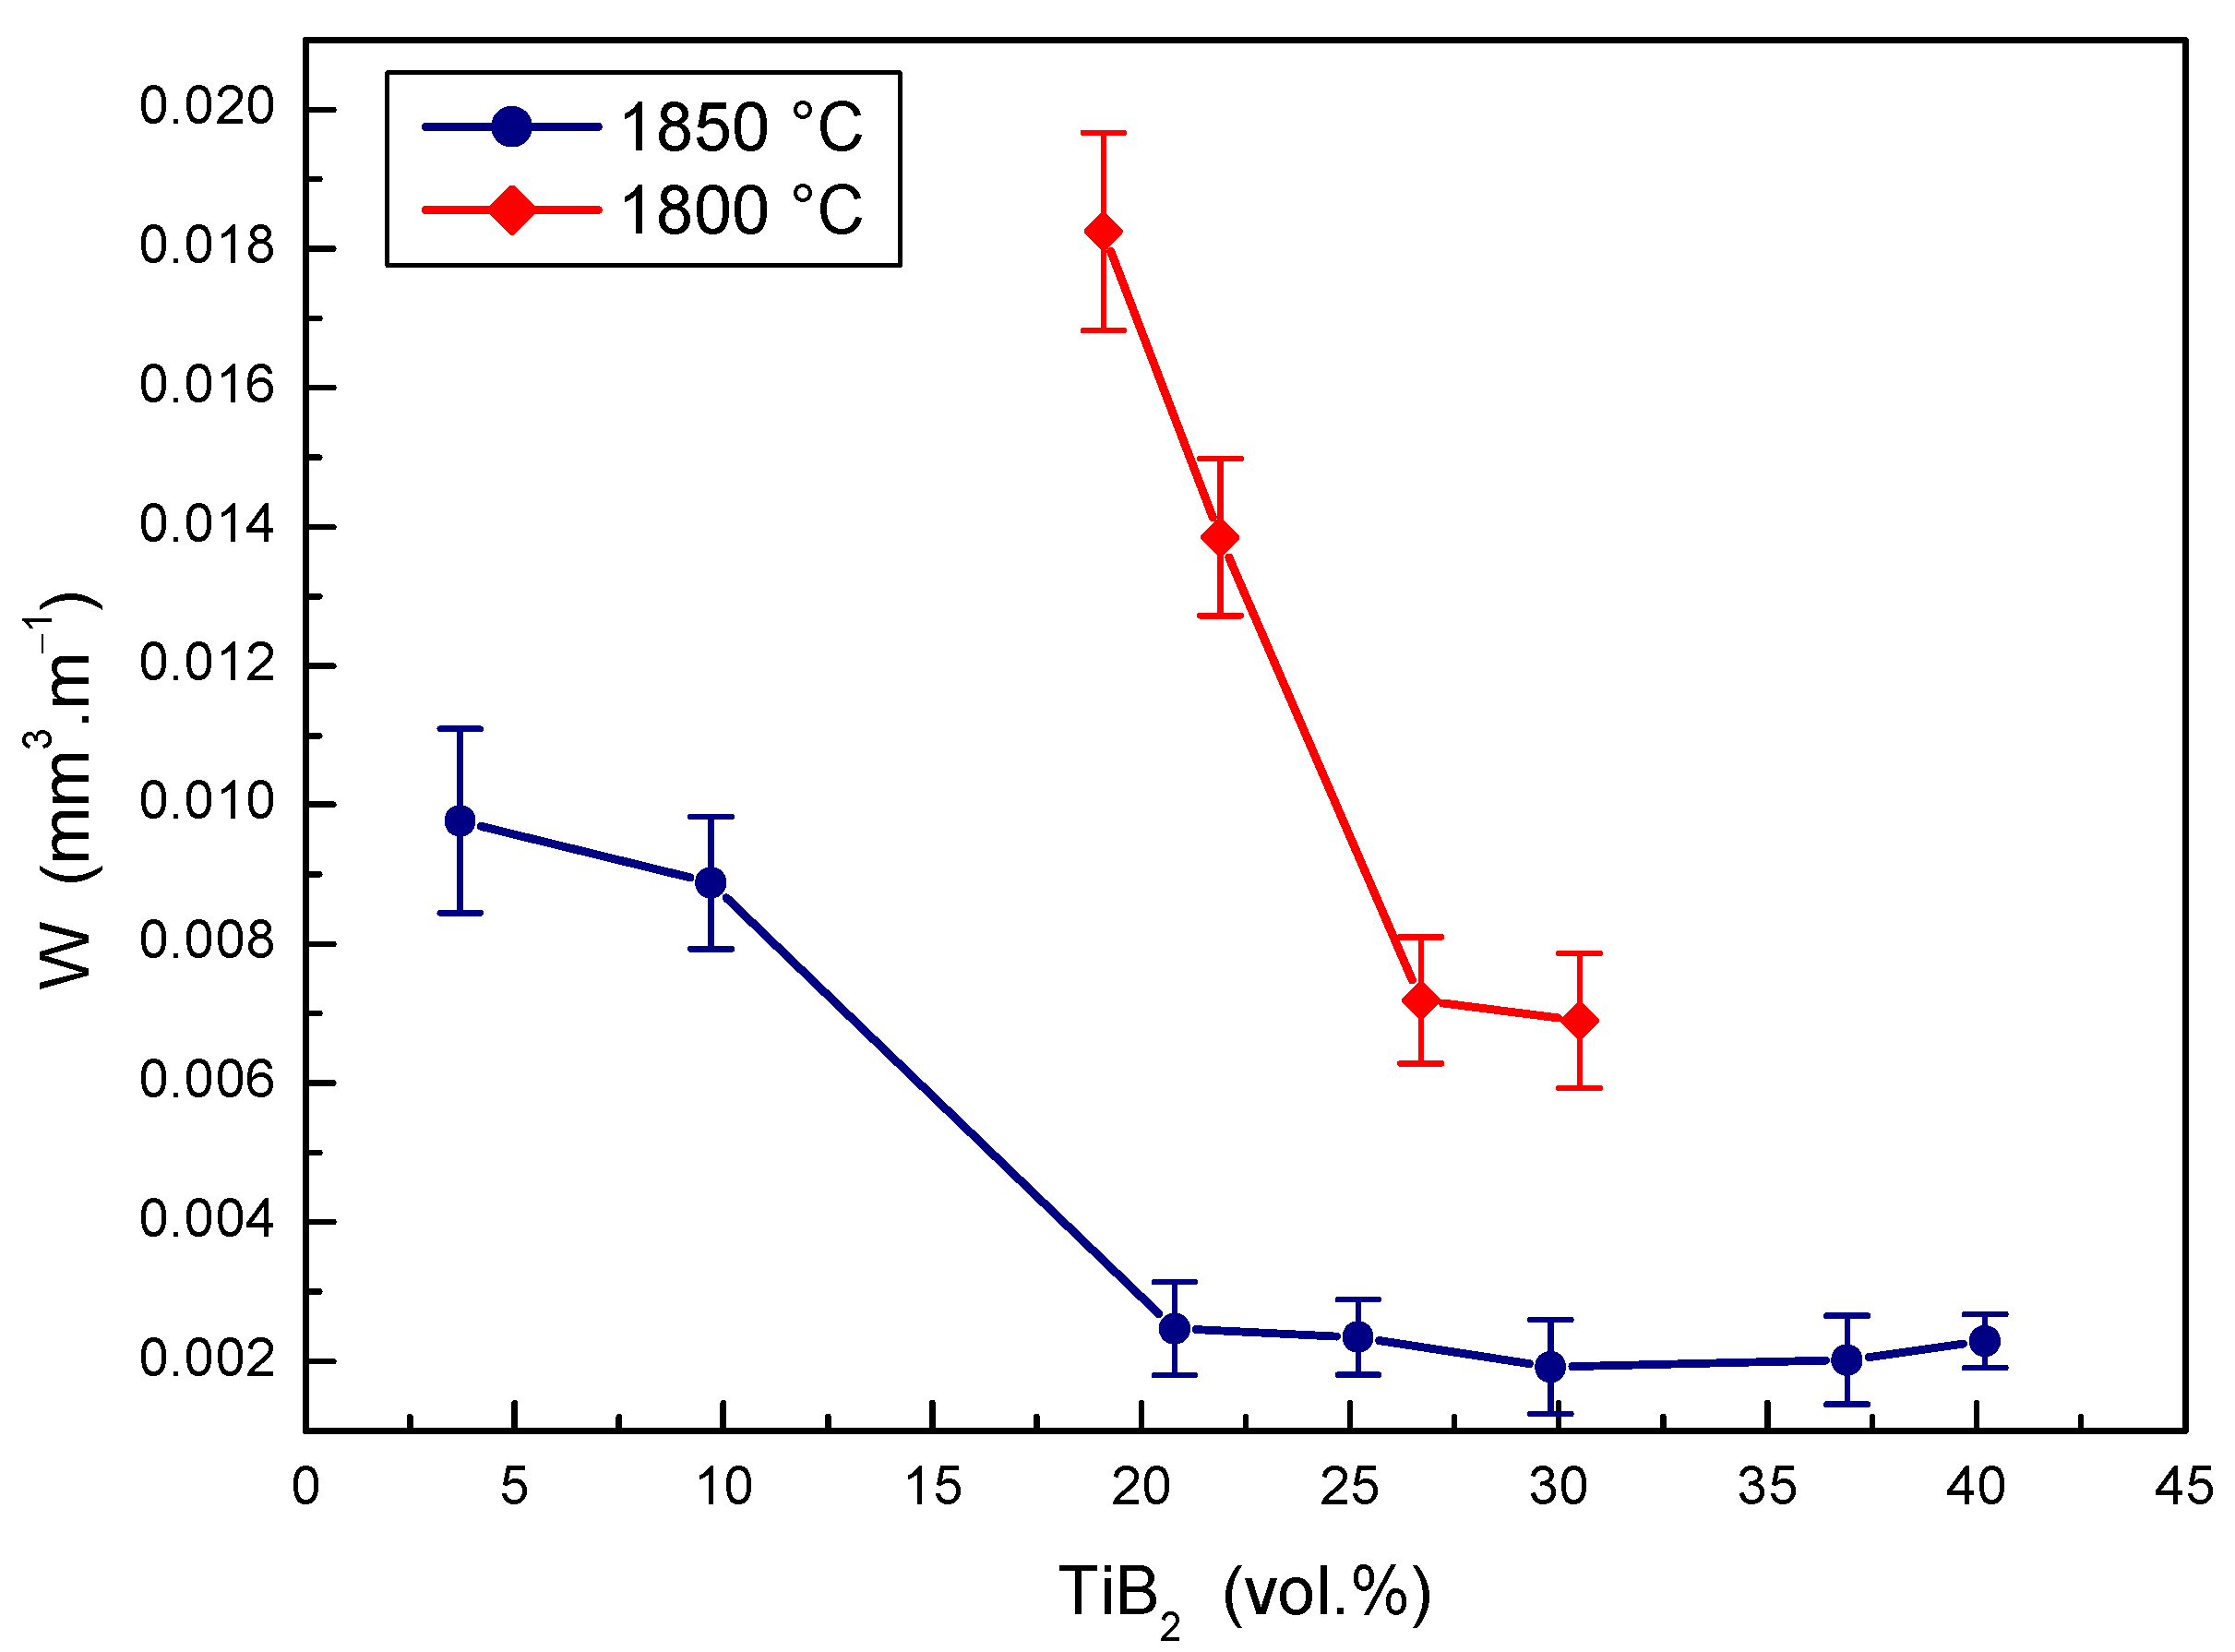
The effects of TiB2 secondary phase portions at two sintering temperatures on the wear rate of the B4C-TiB2 composite were measured during the pin-on-disc test and are shown in Figure 10. The wear rate decreases, so wear resistance increases with the portion of TiB2 phase in B4C-TiB2 ceramic composites sintered at a temperature of 1800 °C. The significant enhancing of the wear resistance (by 60.6%) was achieved in intervals from 19.1 to 26.7 vol.% TiB2. However, comparable and partially overlapping wear rates of the B4C-TiB2 composite were measured when increasing the TiB2 portion from 26.7 to 30.5 vol.%. At a sintering temperature of 1850 °C, a significant improvement of the wear resistance (by 74.7%) was achieved for the B4C-TiB2 composite with a secondary phase portion from 3.7 to 20.8 vol.% TiB2. In intervals from 20.8 to 40.2 vol.% TiB2, very similar overlapping wear results were measured. These results correspond to the increase of fracture toughness as well as the decrease of hardness of the B4C-TiB2 composite when the TiB2 secondary phase exceeded portions of 29.8 vol.% TiB2. When comparing the B4C-TiB2 composites with an identical portion of TiB2 secondary phase but prepared at different sintering temperatures, the wear rate of samples sintered at 1850 °C was reduced by about 70% compared to those sintered at 1800 °C. This high difference in wear resistance could be attributed to significantly better densification of samples sintered at higher temperatures with relative densities above 99%.
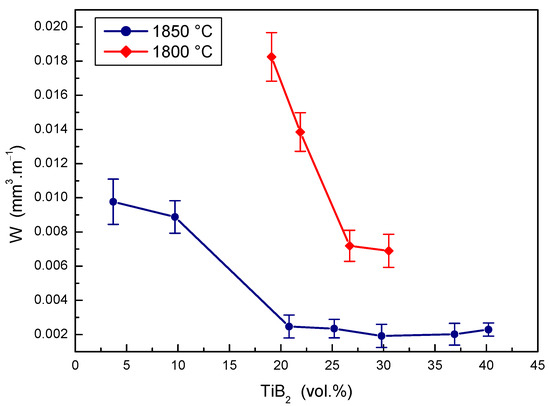
Figure 10.
The effect of TiB2 secondary phase portion on the wear rate of B4C-TiB2 composite.
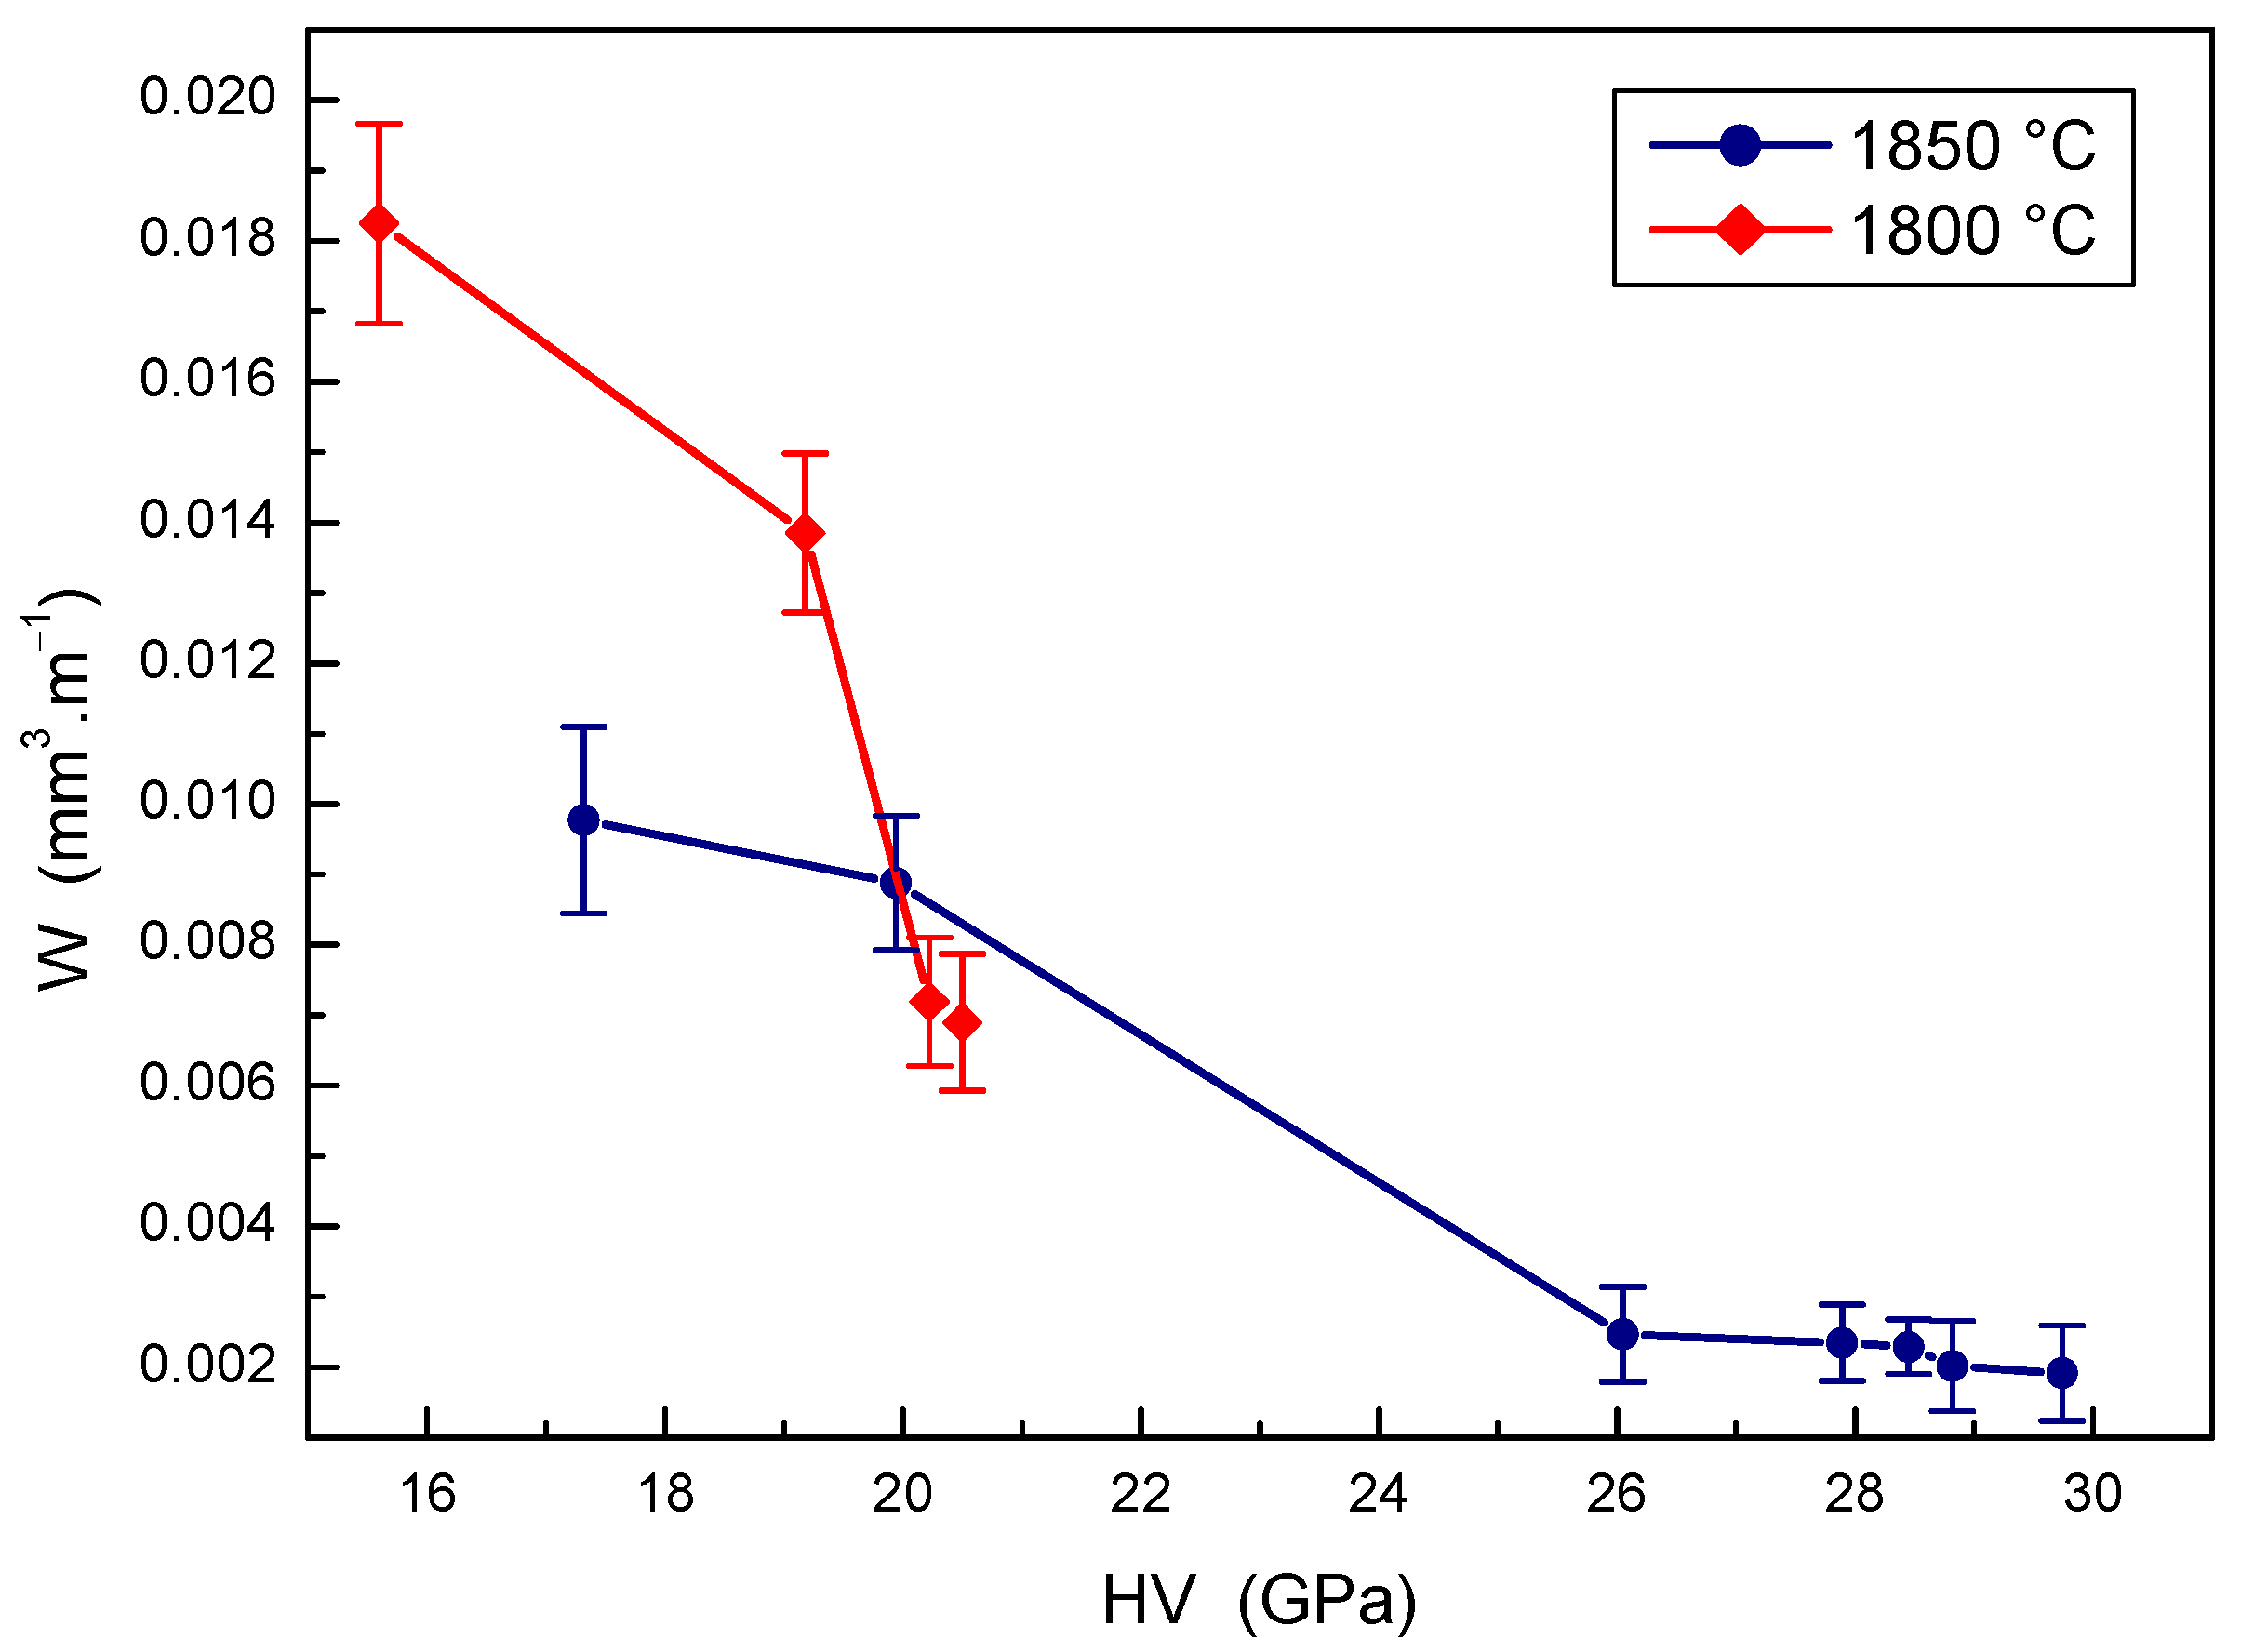
The relationship between the mechanical properties and the wear rate of B4C-TiB2 composites is depicted in Figure 11 and Figure 12. Obvious improvement of the wear resistance with the hardness of B4C-TiB2 composites can be seen in Figure 11, which present the effect of hardness on the wear rate of B4C-TiB2 composites prepared at two sintering temperatures. Although the overall decrease in the wear rate of composites sintered at 1800 °C is relatively effective, its wear resistance is still insufficient. This is mainly the consequence of relatively low hardness values not exceeding 21 GPa, which are caused by poor density of the composites. When sintering at 1850 °C, the wear rate of B4C-TiB2 composites is reduced by 80.3% with increasing hardness values. Excellent wear resistance was measured at hardness values above 26 GPa, and the highest wear resistance of B4C-TiB2 composites correlates with the highest measured hardness of 29.74 GPa. The development in Figure 11 confirms the dominant effect of hardness on the wear resistance of ceramic materials.
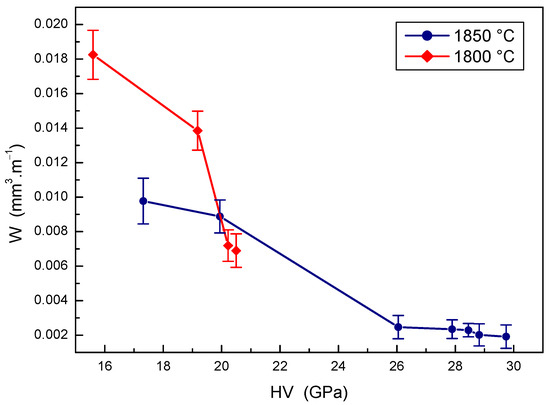
Figure 11.
The effect of hardness on the wear rate of B4C-TiB2 composite.
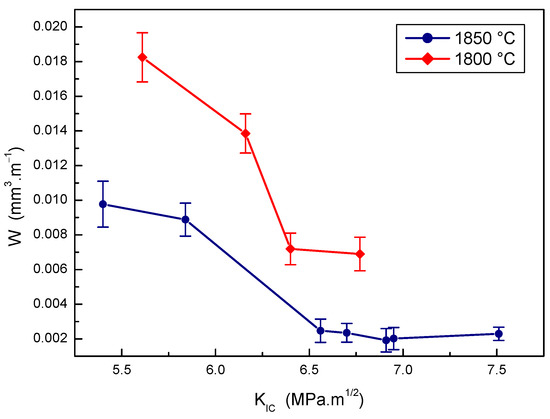
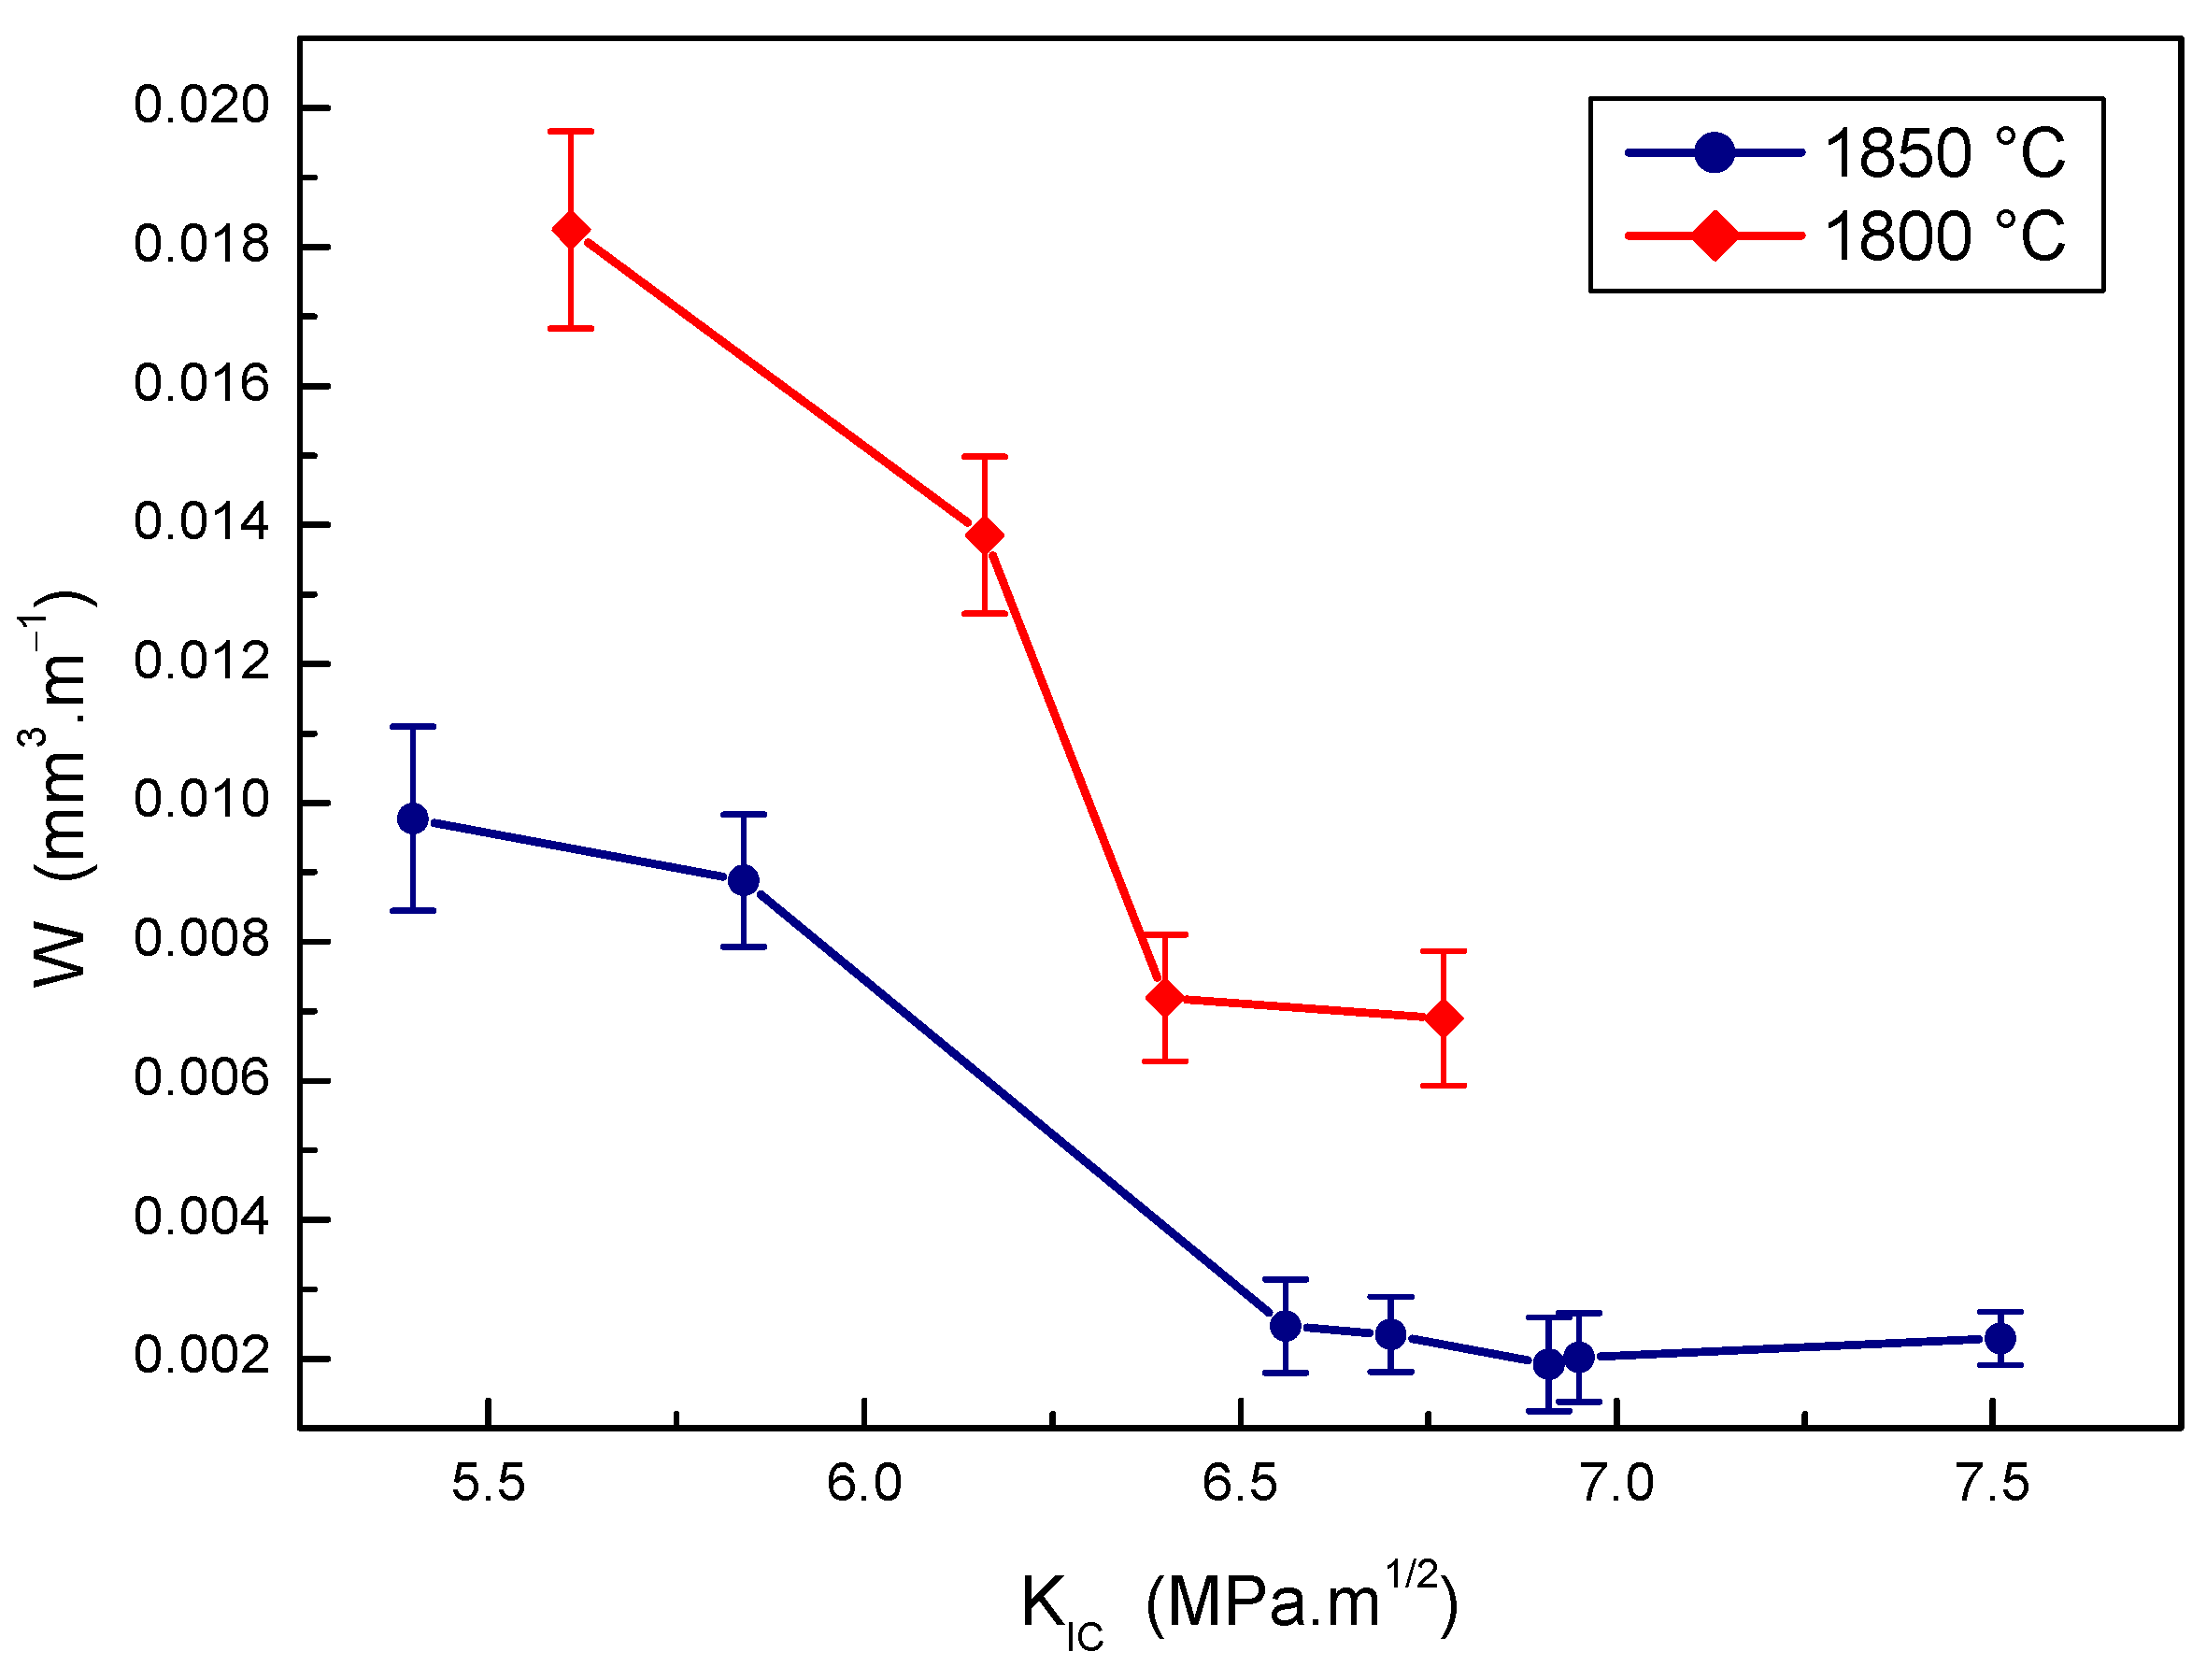
Figure 12.
The effect of fracture toughness on wear rate of B4C-TiB2 composite.
The effect of fracture toughness on the wear rate of B4C-TiB2 composites prepared at two sintering temperatures is presented in Figure 12. Very good wear resistance was measured when sintering at a temperature of 1850 °C and a fracture toughness value of the B4C-TiB2 composite exceeded a value of 6.5 MPa·m1/2. Lower wear resistance of B4C-TiB2 composites prepared at a temperature of 1800 °C is the consequence of both poor densification and low hardness. The highest wear resistance of B4C-TiB2 composites sintered at 1850 °C was achieved for the composite with a fracture toughness value of 6.91 MPa·m1/2. However, the composite with a fracture toughness above 6.91 MPa·m1/2 proved to a slight decrease in wear resistance due to the hardness decrease at higher portions of the TiB2 secondary phase in the microstructure of B4C-TiB2 composites. With the wear resistance of samples with fracture toughness from 6.56 to 7.51 MPa·m1/2 overlapped, the effect of hardness on wear resistance of these samples was more intensive compared to the effect of fracture toughness.
To investigate the wear mechanism, the worn surfaces of the B4C-TiB2 composite were observed by SEM. The wear rate of B4C-TiB2 composite is controlled by the competition of the beneficial effect of improved relative density and higher fracture toughness with increased portions of the TiB2 secondary phase and the adverse effect of hardness decreases due to the formation of the TiB2 secondary phase. Consequently, worn surfaces of two B4C-TiB2 composites with 29.8 and 40.2 vol.% TiB2 were studied and are documented in Figure 13 and Figure 14, respectively. The B4C-TiB2 composite with 29.8 vol.% TiB2 achieved the lowest wear rate during the pin-on-disc test method due to its highest hardness, which is the basic requirement for wear-resistant tribological applications. However, the average wear resistance of the B4C-TiB2 composite with 40.2 vol.% TiB2 was slightly lower, and wear rate error bars of both composites (29.8 and 40.2 vol.% TiB2) overlapped. The B4C-TiB2 composite with 40.2 vol.% TiB2 had the highest fracture toughness value; therefore, it is interesting for tribological applications. The XRD pattern of worn surface of the B4C-TiB2 composite with 29.8 vol.% TiB2 is documented in Figure 15. The XRD pattern of the composite after the wear test in Figure 15 can be compared with the XRD record of the same composite before the test in Figure 2. Identical XRD patterns in Figure 2 and Figure 15 confirm the creation of B4C and TiB2 phases and exclude the formation of any tribofilms or tribochemical reactions between tested composites and abrasive corundum grains under dry sliding conditions during the pin-on-disc wear tests.
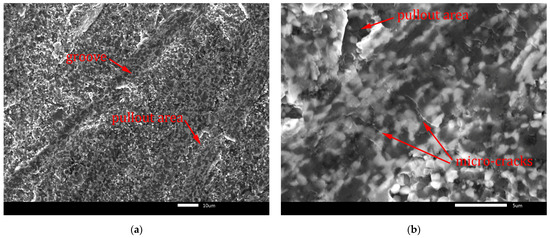
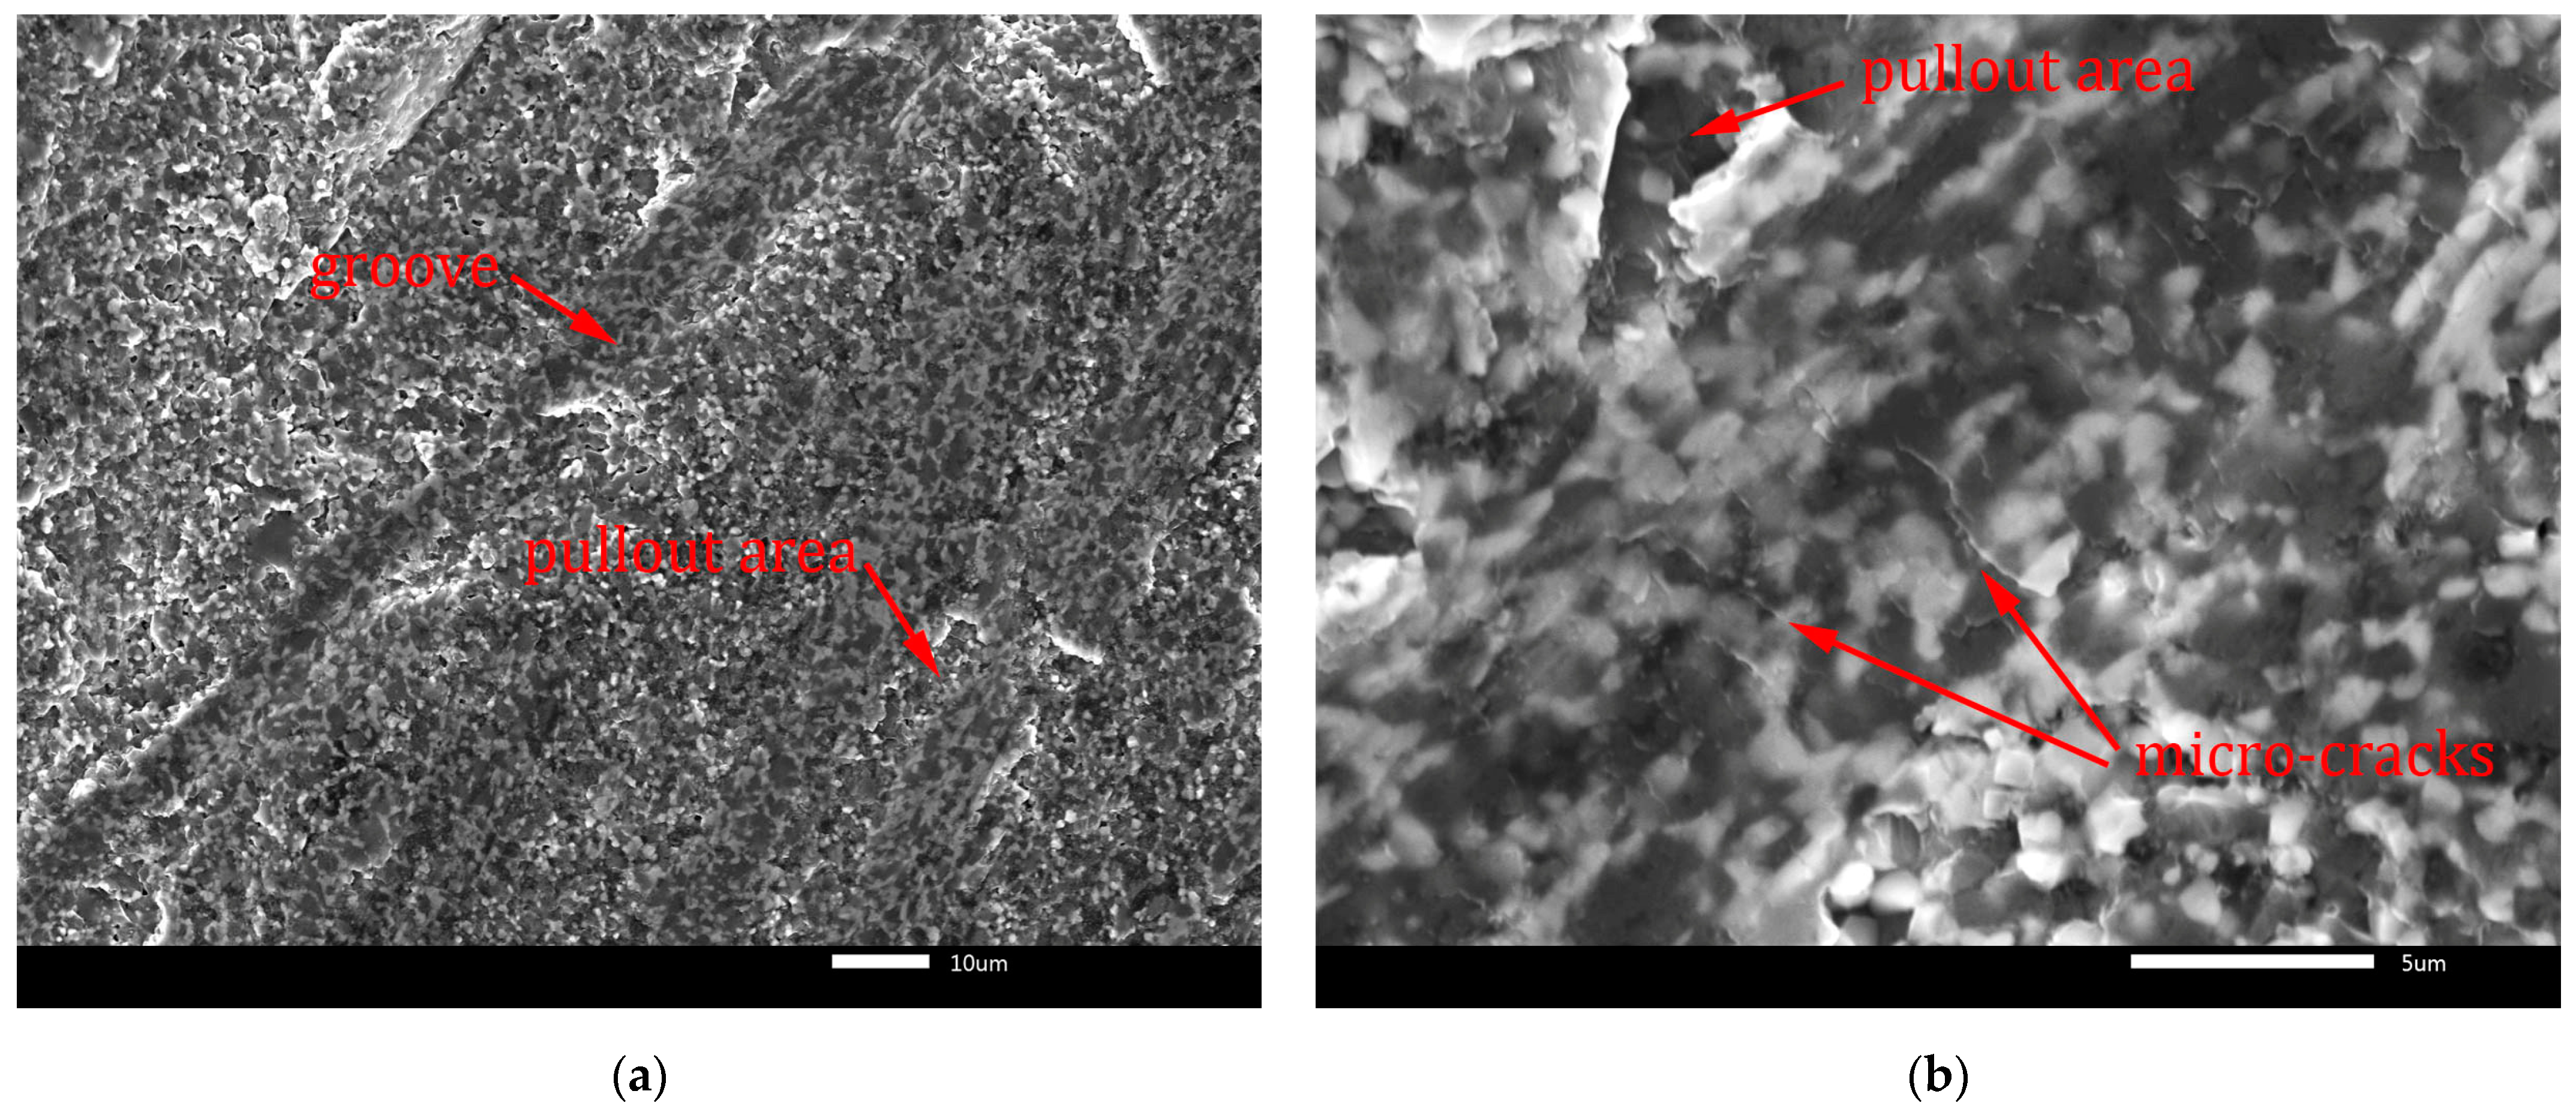
Figure 13.
Worn surface of B4C-TiB2 composite with 29.8 vol.% TiB2: (a) grooves; (b) micro-cracks.
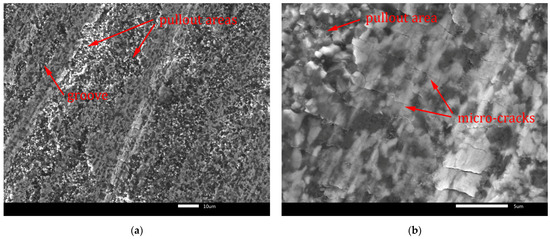
Figure 14.
Worn surface of B4C-TiB2 composite with 40.2 vol.% TiB2: (a) grooves; (b) micro-cracks.
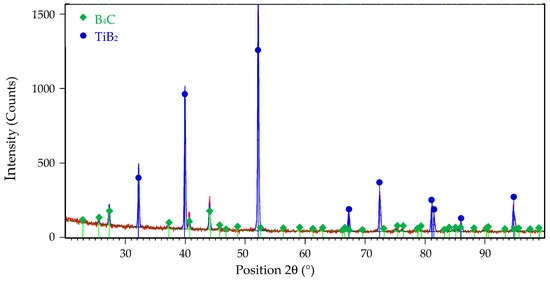
Figure 15.
The XRD pattern of B4C-TiB2 ceramic composite with 29.8 vol.% TiB2 after pin-on-disc wear test.
Fracture-induced mechanical wear is the main wear mechanism observed on worn surfaces in Figure 13 and Figure 14. The worn surfaces are characterised by pullout of the surface and severe fracture. The cracks induced by the abrasive-surface friction cause brittle fracture with surface pullout. These features of wear are characteristic for transgranular fracture. They are visible in Figure 13a and Figure 14a at lower magnification. Moreover, micro-crack formation is evident mainly in the direction perpendicular to the wear direction in Figure 13b and Figure 14b at higher magnification. In Figure 13a and Figure 14a, the grooves formed by abrasive wear can be seen. These deep and uneven grooves represent the micro-cutting mechanism of surface damage. However, micro-fracturing mechanism was dominant, because it caused intensive pullout of the worn surfaces, which is visible in Figure 13b and Figure 14b.
4. Conclusions
The wear resistance of B4C-TiB2 ceramic composites prepared by hot-pressing from a B4C-TiO2 precursor at temperatures of 1800 and 1850 °C have been evaluated, with the following conclusions:
The proper relative density above 99% was achieved for the B4C-TiB2 composite in situ sintered at a temperature of 1850 °C from a B4C-TiO2 precursor with a TiO2 additive ranging from 40 to 50 wt.%. The portion of TiB2 secondary phase in B4C-TiB2 ceramic composite increased from 3.7 to 40.2 vol.% TiB2 with the increase of both the amount of TiO2 additive in the B4C-TiO2 precursor and sintering temperature.
The highest hardness of 29.74 GPa was measured in the B4C-TiB2 composite with 29.8 vol.% TiB2 secondary phase sintered at 1850 °C. A slight decrease of average hardness from 29.74 to 28.45 GPa was observed at increased portions of the TiB2 secondary phase from 29.8 to 40.2 vol.% because of its lower hardness compared to the B4C matrix. However, positive effects of the TiB2 phase on the fracture toughness of B4C-TiB2 composites were measured at both sintering temperatures with maximal values of 7.51 MPa·m1/2 for composites with 40.2 vol.% TiB2 phase sintered at 1850 °C.
The improvement of the wear resistance of B4C-TiB2 composites with both hardness and fracture toughness was observed. However, the positive effect of hardness on the wear resistance of the composite was more intensive, due to the higher wear resistance achieved with B4C-TiB2 composites with a higher hardness of 29.74 GPa. These samples reached a fracture toughness value of 6.91 MPa·m1/2, which contained the proper portion of 29.8 vol.% TiB2 secondary phase in the B4C matrix.
Fracture-induced mechanical wear was the main wear mechanism of the B4C-TiB2 composite during the pin-on-disc test. It was characterised by pullout of the surface and severe fracture. The worn surfaces showed the presence of transgranular fracture characterised by cracks induced by the abrasive-surface and the micro-crack formation, mainly in the direction perpendicular to the wear direction.
Funding
This research was supported by Scientific Grant Agency of the Ministry of Education, Science, Research and Sport of the Slovak Republic within the project VEGA 1/0302/23.
Data Availability Statement
The original contributions presented in this study are included in the article. Further inquiries can be directed to the corresponding author.
Conflicts of Interest
The author declares no conflicts of interest. The funders had no role in the design of the study; in the collection, analyses, or interpretation of data; in the writing of the manuscript; or in the decision to publish the results.
References
- Kvatchadze, V.; Bairamashvili, I.; Mikeladze, A.; Gventsadze, D.; Mestvirishvili, Z.; Chkhartishvili, L. Boron carbide based ceramics for dry friction units. Solid State Sci. 2023, 142, 107244. [Google Scholar] [CrossRef]
- Ye, K.; Prikhna, T.; Hu, C.; Wang, Z. Morphology characteristics and mechanical properties of hot-pressed micron/sub-micron boron carbide ceramics. Mater. Today Commun. 2021, 29, 102751. [Google Scholar] [CrossRef]
- Moshtaghioun, B.M.; Laguna-Bercero, M.A.; Gomez-García, D.; Pena, J.I. Does grain size have an influence on intrinsic mechanical properties and conduction mechanism of near fully-dense boron carbide ceramics. J. Alloys Compd. 2019, 795, 408–415. [Google Scholar] [CrossRef]
- Sheikhi, S.; Stroberg, W.; Hogan, J.D. Effects of chain configuration and stoichiometry on the behavior of boron carbide from first-principle calculations. Mater. Today Commun. 2024, 40, 110205. [Google Scholar] [CrossRef]
- Neuman, E.W.; Brown-Shaklee, H.J.; Hilmas, G.E.; Fahrenholtz, W.G. Titanium diboride–silicon carbide–boron carbide ceramics with super-high hardness and strength. J. Am. Ceram. Soc. 2018, 101, 497. [Google Scholar] [CrossRef]
- Wang, Y.; Peng, H.; Ye, F.; Zhou, Y. Effect of TiB2 content on microstructure and mechanical properties of in-situ fabricated TiB2/B4C composites. Trans. Nonferrous Met. Soc. China 2011, 21, s369–s373. [Google Scholar] [CrossRef]
- Zhang, X.; Zhang, Z.; Nie, B.; Chen, H.; Wang, Y.; Zheng, L.; Bai, Y.; Wang, W. Microstructure and mechanical properties of fine-grained boron carbide ceramics fabricated by high-pressure hot pressing combined with high-energy ball milling. Ceram. Int. 2018, 44, 10766–10772. [Google Scholar] [CrossRef]
- Fu, Z.; Koc, R. Microstructure and mechanical properties of hot pressed submicron TiB2 powders. Ceram. Int. 2018, 44, 9995–9999. [Google Scholar] [CrossRef]
- Levin, L.; Frage, N.; Dariel, M.P. A novel approach for the preparation of B4C-based cermet. Int. J. Refract. Met. Hard Mater. 2000, 18, 131–135. [Google Scholar] [CrossRef]
- Levin, L.; Frage, N.; Dariel, M.P. The effect of Ti and TiO2 additions on the pressureless sintering of B4C. Metall. Mater. Trans. A 1999, 30A, 3201–3210. [Google Scholar] [CrossRef]
- Zhang, W. A novel ceramic with low friction and wear toward tribological applications: Boron carbide-silicon carbide. Adv. Colloid Interface Sci. 2022, 301, 102604. [Google Scholar] [CrossRef]
- Zhang, W. A review of tribological properties for boron carbide ceramics. Prog. Mater. Sci. 2021, 116, 100718. [Google Scholar] [CrossRef]
- Liu, Z.; Wang, D.; Li, J.; Huang, Q.; Ran, S. Densification of high strength B4C–TiB2 composites fabricated by pulsed electric current sintering of TiC–B mixture. Scr. Mater. 2017, 135, 15–18. [Google Scholar] [CrossRef]
- Matović, B.; Urbanovich, V.; Girman, V.; Lisnichuk, M.; Nikolić, D.; Erčić, J.; Cvijović-Alagić, I. Densification of boron carbide under high pressure. Mater. Lett. 2022, 314, 131877. [Google Scholar] [CrossRef]
- Failla, S.; Melandri, C.; Zoli, L.; Zucca, G.; Sciti, D. Hard and easy sinterable B4C-TiB2-based composites doped with WC. J. Eur. Ceram. Soc. 2018, 38, 3089–3095. [Google Scholar] [CrossRef]
- Yue, X.Y.; Zhao, S.M.; Yu, L.; Ru, H.Q. Microstructures and Mechanical Properties of B4C-TiB2 Composite Prepared by Hot Pressure Sintering. Key Eng. Mater. 2010, 434–435, 50–53. [Google Scholar] [CrossRef]
- Delgado, Y.P.; Staia, M.H.; Malek, O.; Vleugels, J.; De Baets, P. Friction and wear response of pulsed electric current sintered TiB2–B4C ceramic composite. Wear 2014, 317, 104–110. [Google Scholar] [CrossRef]
- Huang, S.G.; Vanmeensel, K.; Van der Biest, O.; Vleugels, J. In situ synthesis and densification of submicrometer-grained B4C–TiB2 composites by pulsed electric current sintering. J. Eur. Ceram. Soc. 2011, 31, 637–644. [Google Scholar] [CrossRef]
- Shetty, D.K.; Wright, I.G.; Mincer, P.N.; Clauer, A.H. Indentation fracture of WC–Co cermets. J. Mater. Sci. 1985, 20, 1873–1882. [Google Scholar] [CrossRef]
- Švec, P.; Čaplovič, L. Microstructure and mechanical properties of B4C-TiB2 composites reactive sintered from B4C + TiO2 precursors. Process. Appl. Ceram. 2022, 16, 358–366. [Google Scholar] [CrossRef]
- Barin, I. Thermochemical Data of Pure Substances, 2nd ed.; VCH Verlagsgesellschaftt mbH: Weinheim, Germany, 1993. [Google Scholar]
- Pei, X.; Du, Y.; Wang, H.; Hu, M.; Li, Y.; Zhou, W.; Wang, H. Attaining exceptional wear resistance in an in-situ ceramic phase reinforced NbMoWTa refractory high entropy alloy composite by Spark plasma sintering. Wear 2024, 558–559, 205572. [Google Scholar] [CrossRef]
- Du, Y.; Li, T.; Zhou, Q.; Pei, X.; Wang, H.; Feng, T.; Wu, H.; Wang, H.; Zhou, W.; Liu, W. Achieving excellent mechanical and robust lubrication behavior in CoCrNi medium-entropy alloy via in-situ graphite. Carbon 2024, 229, 119503. [Google Scholar] [CrossRef]
- He, Q.; Guo, W.; Shi, Y.; Wang, A.; Wang, W.; Fu, Z. B4C ceramics toughened by TiB2–graphite agglomerated inclusions. Mater. Sci. Eng. A 2025, 922, 147680. [Google Scholar] [CrossRef]


Disclaimer/Publisher’s Note: The statements, opinions and data contained in all publications are solely those of the individual author(s) and contributor(s) and not of MDPI and/or the editor(s). MDPI and/or the editor(s) disclaim responsibility for any injury to people or property resulting from any ideas, methods, instructions or products referred to in the content. |
© 2025 by the author. Licensee MDPI, Basel, Switzerland. This article is an open access article distributed under the terms and conditions of the Creative Commons Attribution (CC BY) license (https://creativecommons.org/licenses/by/4.0/).