Article

Parametric Structure Optimization Design of High-Pressure Abrasive Water Jet Nozzle Based on Computational Fluid Dynamics-Discrete Element Method (CFD-DEM)

1
Key Laboratory of Metallurgical Equipment and Control Technology, Wuhan University of Science and Technology, Ministry of Education, Wuhan 430081, China
2
Hubei Key Laboratory of Mechanical Transmission and Manufacturing Engineering, Wuhan University of Science and Technology, Wuhan 430081, China
*
Authors to whom correspondence should be addressed.
Lubricants 2025, 13(2), 91; https://doi.org/10.3390/lubricants13020091
Submission received: 27 January 2025 / Revised: 11 February 2025 / Accepted: 17 February 2025 / Published: 18 February 2025

Abstract

:
High-pressure abrasive water jet (HP-AWJ) cutting is a prominent technology for processing a wide variety of materials. The structural parameters of the nozzle are important for the cutting performance of the HP-AWJ. This paper combines an abrasive particle kinetic energy model and a wall wear model of the nozzle to determine the multi-phase flow of a HP-AWJ nozzle. The flow field structure of the nozzle was optimized using a parametric multi-objective structure optimization design method. A Multi-Objective Heat Transfer Search (MOHTS) was utilized to generate the corresponding mathematical regression model for multiple response results, and the optimal solution sets of Pareto values were further obtained. The optimal HP-AWJ structural parameters could be selected according to the weight influence of multiple response indicators.

1. Introduction

A high-pressure abrasive water jet (HP-AWJ) utilizes a high-pressure or ultra-high-pressure pump to pressurize the water medium. The water, mixed with abrasives, flows through a nozzle to form a high-speed, high-energy, high-penetration jet beam. With the rapid development of pressurized equipment and the in-depth study of water jets, water jet technology has been successfully applied in machinery manufacturing, aerospace, petroleum, medical and other industries, including material cutting, industrial cleaning and surface treatment. The influencing factors of HP-AWJs include the nozzle system parameters, material parameters, energy parameters and geometric parameters [1,2,3]. It is crucial to understand the vital factors affecting the machining energy of HP-AWJs and to propose a better machining performance design with the same energy input.
In the HP-AWJ machining process, the nozzle is a vital component with the shortest lifetime, which affects the accuracy, performance and economy of the HP-AWJ machining process directly [4,5]. In addition, nozzle wear will lead to the degradation of the cutting surface quality and undesirable changes in the workpiece geometry. At the same time, erosive wear is caused by the abrasive mixing process in the mixing chamber and in the focusing tube, and it affects the energy loss, increases the jet diameter and increases the machining time. Nozzle wear is the result of material removal generated by the sliding contact of the nozzle wall and abrasive particles [6]. Zou X [7] employed a CFD-DEM coupling numerical approach to investigate the wear inside a HP-AWJ nozzle. It was concluded that particle kinetic energy, acceleration and stress concentration variations affected the particle erosion rate on the nozzle wall. WANG X [8] investigated the effect of conical convergent nozzles with different wear degrees on the rock-breaking ability of an abrasive water jet (AWJ). The results showed that after 60 min, wear in the straight and outlet sections resulted in smaller increases in the nozzle diameter and a 27.6% decrease in the erosion depth. Shao C [9] simulated the particle flow inside an AWJ nozzle. It was shown that the erosion rate of the nozzle was the most sensitive to the pump pressure.
Optimizing the structural geometry of the nozzle not only improves the life cycle of the nozzle, but also improves the cutting capacity [10]. Many methods have been employed in the structural optimization of the nozzle. The orthogonal experiment method, genetic algorithms, neural networks and the particle swarm optimization (PSO) algorithm could be used to optimize the structure parameters. Liu Y [11] used the competitive mechanism multi-objective particle swarm optimizer (CMOPSO) algorithm to optimize the nozzle to improve the cleaning effect of an ice abrasive water jet nozzle. Schwartzentruber [12] pointed out that the performance of water jets greatly depended on the nozzle geometry and operating conditions. A study was conducted to further optimize the nozzle system and operating conditions of an AWJ by employing genetic algorithms (GAs). Under the same conditions of the inlet, the optimized system could reduce the energy consumption 16 percent faster. Qiang [13] et al. optimized an abrasive water jet cutting head model by using the Multi-Objective Cuckoo’s Algorithm (MOCS), which ensured that the output energy was maximized and the erosion rate of the nozzle was minimized. The result showed that the MOCS algorithm was capable of predicting the outlet kinetic energy and the abrasion rate.
Parametric design methods were frequently applied to AWJ process optimization in previous studies. Researchers studied optimization methods for AWJ machining process parameters. Mathematical and statistical methods [14], metaheuristic methods [15,16] and methods supporting decision-making processes [17,18] and artificial neural networks [19] were used. These methods included the response surface methodology (RSM), Whale Optimization Algorithm, Desirability Function Analysis (DFA), artificial neural networks (ANNs), the Taguchi method, Moth Flame Optimization (MFO) and so on. The best response results were provided by modeling studies. Rao [20] optimized the performance metrics, including the cutting depth, the taper angle, the kerf geometry and the surface roughness. Then, the Jaya algorithm was utilized to achieve single- and multi-objective optimization for AWJ machining. Shukla [21] used different optimization algorithms and the Taguchi experimental analysis method to optimize the AWJ process parameters, including the lateral velocity and mass flow rate. The results showed that the biogeographic optimization algorithm was superior to the other algorithms in terms of the convergence time and solution distribution. Santhanakumar [22] et al. investigated the effects of the abrasive particle size, the gap between the nozzle and the workpiece and the lateral velocity of the jet on the surface roughness and ceramic-cutting taper angle. The RSM based on gray theory was used to determine the optimal cutting conditions with improved quality characteristics. Chakraborty [23] implemented the Gray Wolf Optimizer for the aparameter optimization of AWJ machining processes. The main advantage was that the algorithm did not aggregate to any local optimum solution. The presence of a social hierarchy in the algorithm helped in obtaining the best solution for solving single- and multi-objective optimization problems. Pawar P J [24] used the multi-objective Artificial Bee Colony Algorithm for AWJ machining, taking into account three objectives: the minimization of the width of the cut slit, the minimization of the taper angle of the cut slit and the maximization of the depth of the streak-free surface. A set of Pareto optimal solutions that could select the most appropriate parameter settings for the system were obtained.
In previous studies in the literature, the kinetic energy modeling and wear modeling of HP-AWJ nozzles were usually studied separately, which means that the existing models are incomplete. The high-efficiency kinetic energy and energy conversion of abrasive particles in the HP-AWJ nozzle are positively correlated with the wear and damage degree of particles in the nozzle. There exists a problem that the gas–liquid–solid multi-phase flow in the HP-AWJ nozzle leads to particle acceleration and the irregular wear of particles. To solve the problem, the nozzle structure model can be optimized by parameterizing the flow field geometry in the nozzle and controlling the specific design parameter size. Finally, the optimization algorithm can be used to obtain the optimal structure of the HP-AWJ nozzle within the parameter range.

2. Models and Methods

The structure of the HP-AWJ nozzle is shown in Figure 1. High-speed water and abrasive particles are replenished via the entrance for the water and the abrasive inlets, respectively. High-pressure water mixed with abrasive particles forms a fluid–solid jet in the converging tube. The cutting force of the abrasive particles in the jet beam is much larger than that of the water for the material. Meanwhile, a HP-AWJ has the characteristics of low thermal influence, a high cutting speed and high cutting quality. The simulation methods and results for the multi-phase flow in the CFD technology in this work are referenced from our previous research [7].

2.1. The Parametric Design Method of the HP-AWJ Nozzle

An effective parametric design analysis was conducted for three parameters, including the converging tube angle (α), abrasive incidence angle (θ) and abrasive feed height (LDa). We describe how the structural effects caused by variation in the above parameters were studied and analyzed sequentially in the following subsections.
(1)
Converging tube angle α
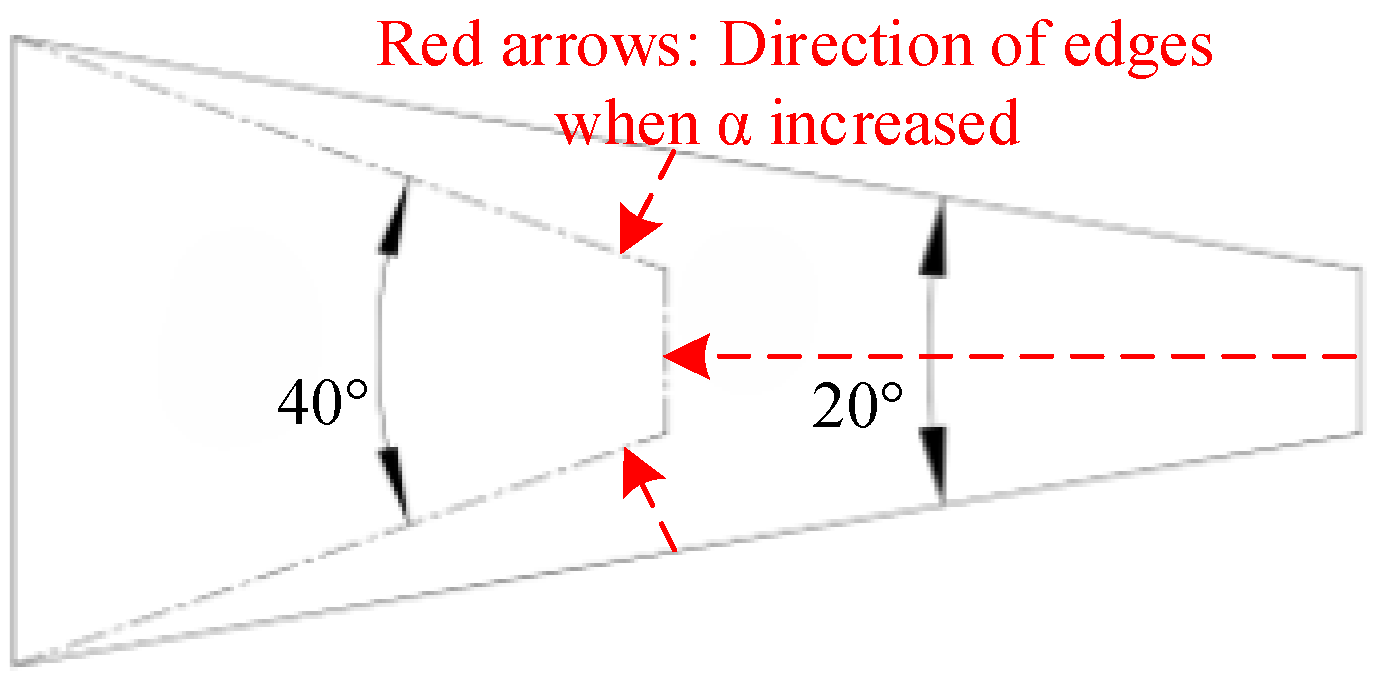
The position of the converging tube was in the front section of the focusing tube, as shown in Figure 1. Under the premise that the other design parameters remained unchanged, α was set to the values of 20°, 30° and 40°, as shown in Figure 2. The red arrow represents the direction in which the edges of the converging tube would be positioned when α increased. The volume of the converging tube in the model was reduced accordingly. This may have further affected the efficiency of abrasive mixing and the nozzle wear rate.
According to the literature [13,25], when the abrasive particles enter the focusing tube through the mixing chamber, a smaller converging tube angle makes the abrasive particles obtain more axial acceleration. The diffusion of particles to the perimeter is slowed down. Abrasive particles enter the acceleration period faster. At the same time, more of the kinetic energy of the jet will be applied to particle acceleration. The unnecessary contact time between the particle and the nozzle wall is reduced. Therefore, the rational design of the converging tube angle is of great significance to the effective acceleration of abrasive particles and the minimization of the unnecessary wear of the nozzle.
(2)
Abrasive incidence angle θ
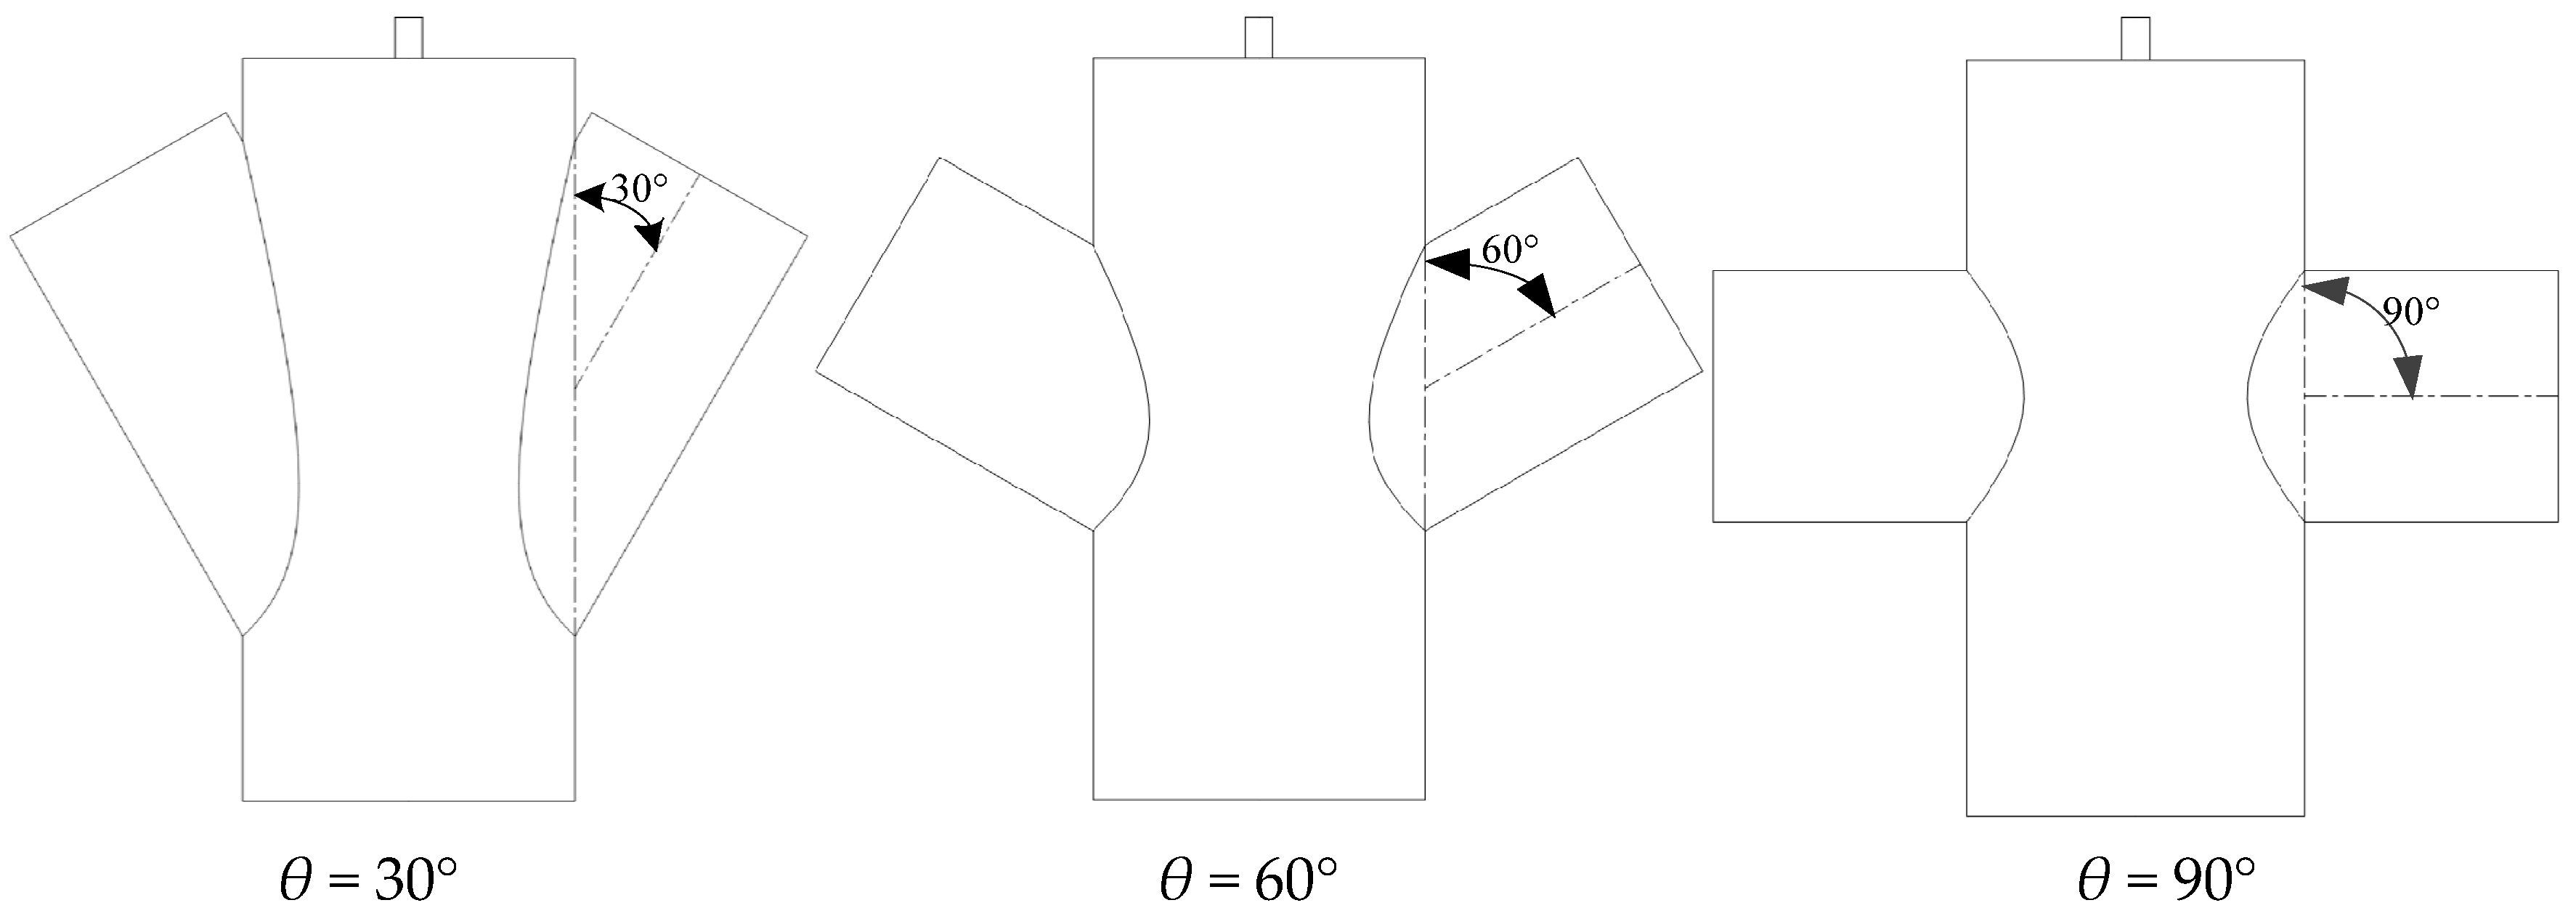
A nozzle was adopted with a symmetrical structure of double sand inlets. The location of the abrasive incidence was at the two ends of the HP-AWJ nozzle, as shown in Figure 3. When θ took the value of 30°, 60° and 90°, the contact volume between the abrasive inlet and the mixing chamber of the nozzle gradually decreased. As the particles moved in a straight downward direction, the Venturi effect was more obvious when particles entered the mixing chamber.
According to the literature [13,25], the abrasive particles can achieve high velocity in the mixing chamber under the condition of the minimum abrasive incidence angle. When the abrasive particles reach the end of their acceleration in the focusing tube, the particles will be subjected to greater axial force. The acceleration direction is consistently downward and parallel to the inner wall of the nozzle. Therefore, the reasonable design of the abrasive incidence angle can make the HP-AWJ achieve a stable and efficient jet.
(3)
Abrasive feed height LDa
The abrasive feed height is the height of the abrasive inlet, as shown in Figure 4. When the value of LDa was 3 mm, 4 mm and 5 mm, the position of the abrasive feed tube gradually descended into the latter half of the mixing chamber. When the abrasive particles were effectively mixed, they could quickly enter the focusing tube to increase the kinetic energy of the abrasive particles and improve the processing capability of the abrasive particles.
According to the literature [13,25], when the abrasive feed position is close to the lower section of the nozzle, the abrasive particles cannot obtain a higher initial abrasive velocity. The high position of the abrasive inlet will make the Venturi effect of the abrasive particles more obvious. Random collisions with the nozzle wall are reduced under the influence of the vortex in the mixing chamber. Therefore, the reasonable design of the abrasive feed height is helpful to the acceleration of abrasive particles and the jet cutting ability.

2.2. Multi-Parameter Optimization Method Based on Response Surface Methodology (RSM)

The RSM uses quantitative data from related experiments to determine and solve multivariable equations simultaneously. “Y” is the response value. (X1, X2, …, Xn) are the independent variables. Then, an accurately approximated model of “Y” and (X1, X2, …, Xn) is established [26], as shown in Equation (1).
Y = f ( X 1 , X 2 , , X n ) + ε
where ε indicates additional sources of variation which are not covered by Y. The variables (X1, X2, …, Xn) are often referred to as natural variables. In RSM, the natural variables are converted into coded variables (x1, x2, …, xn) with a zero mean and an equal standard deviation. The relationship between y and the set of independent variables is shown in function (2) below [27].
y = b 0 + i = 1 n b i x i + i = 1 n b i i x i 2 + i i b i j x i x j + ε
where the coefficients b (i = 1, 2, …, k) can be determined by a mathematical model expression of a polynomial fitted by the least square method.
The structural parametric response surface design of the HP-AWJ nozzle is shown in Table 1. The parametric model was systematically analyzed using the Design of Experiments (DOE) technique. Experiments are arranged using the DOE approach in order to collect the maximum experimental information using fewer experiments. The most popular method within the DOE framework is the Box–Behnken Design (BBD) based on the RSM [28,29]. In this study, three HP-AWJ nozzle design parameters, namely the converging tube angle (α), abrasive incidence angle (θ) and abrasive feed height (LDa), were designed based on the BBD method. Design-Expert 13 statistical analysis software was used. Table 1 lists the parameters of 15 working conditions designed using the BBD method. Three factors at three levels were taken into account. The response results of the exit velocity of the continuous phase V M a x A & W , the particle acceleration efficiency Pv and the wear rate of the nozzle E were obtained. In Table 1, the exit velocity of the continuous phase V M a x A & W refers to the maximum exit velocity of the coupled two-phase flow at the nozzle exit per unit time. The particle acceleration efficiency Pv refers to the ratio of the average velocity of abrasive particles at the nozzle exit and the exit velocity of the flow field per unit time. The wear rate E refers to the sum of the wall wear rates in the focusing tube under the influence of the abrasive particles per unit time. The setting requirements of the energy parameters in the HP-AWJ nozzle in the simulation are shown in Table 2.
The exit velocity of the continuous phase V M a x A & W and the particle acceleration efficiency Pv belonged to the “higher is better” category, while the wear rate E belonged to the “lower the better” category. Several structural parameter variables of the HP-AWJ nozzle were optimized using the MOHTS algorithm to determine the optimal parameter settings. According to the output response parameters, including the exit velocity of the continuous phase V M a x A & W , the particle acceleration efficiency Pv and the wear rate E, a mathematical regression model was generated by using the response surface method to predict the output response. Further statistical analysis using an Analysis of Variance (ANOVA) was performed to show the effect of the variable parameters of the HP-AWJ nozzle model on the output parameters. All statistical analyses were performed using Design-Expert 13 software. The applicability of the variables was tested for generation at a confidence region level of 95%. The value of p of each input parameter needed to be less than 0.05 in order to consider the corresponding parameter term as significant [30,31]. The effect of the process variables on the response was then investigated using the main effect plot of each response variable. Then, for a given response, the best combination of factor levels could be highlighted. Subsequently, the HTS algorithm was used for the design of the nozzle parameters. Then, the method confirmation validation was carried out.

3. Results and Discussion

3.1. Analysis on the Exit Velocity of the Flow Field

The relative influence of the exit velocity of the flow field on the response could be effectively determined using the ANOVA method. The influence of the input parameter variables on V M a x A & W was determined by the value of p at the 95% confidence level [32]. A nonlinear regression equation was developed using the backward elimination method. The value of p was selected to be less than 0.05, and the significance level was 95%. As the non-significant terms had no significant effect on the response value, they were then eliminated from the regression equation. Formula (3) shows the mathematical regression equation of V M a x A & W developed by the reverse elimination program using Design-Expert 13 software.
V M a x A & W = 908.6439 0.453635 × α 0.382169 × θ 4.25247 × L D a   + 0.002031 × ( α × θ ) + 0.072717 × ( α × L D a ) + 0.043488 × ( θ × L D a )
Table 3 shows the ANOVA results of the mathematical regression model of the maximum exit velocity V M a x A & W . The value of p was much less than 0.001, which indicated that the model had a highly significant effect. All three input design parameters of the linear one-time model term and two-factor interaction term had a significant influence on the mathematical regression model of V M a x A & W . The missing fitting term was considered to be insignificant, indicating that the proposed model was sufficient to predict the value of the output variable V M a x A & W in the mathematical regression model. The insignificance of the missing fitting term also revealed the adaptability of the proposed model. According to R2, it was shown that 97.79% of the variation in the V mathematical regression model was contributed by the control factors; 2.21% could not be described by the proposed model. The adjusted R2 value was 94.43%. The model could be considered the best fit because the variation between the R2 and the adjusted R2 was within an acceptable range. The close relationship between the values of R2 indicated that the model was suitable for predicting the results of the mathematical regression model of V M a x A & W . The standard deviation of the mathematical regression model was 0.521487, indicating that the existing model was very suitable for predicting future results and the error was small.
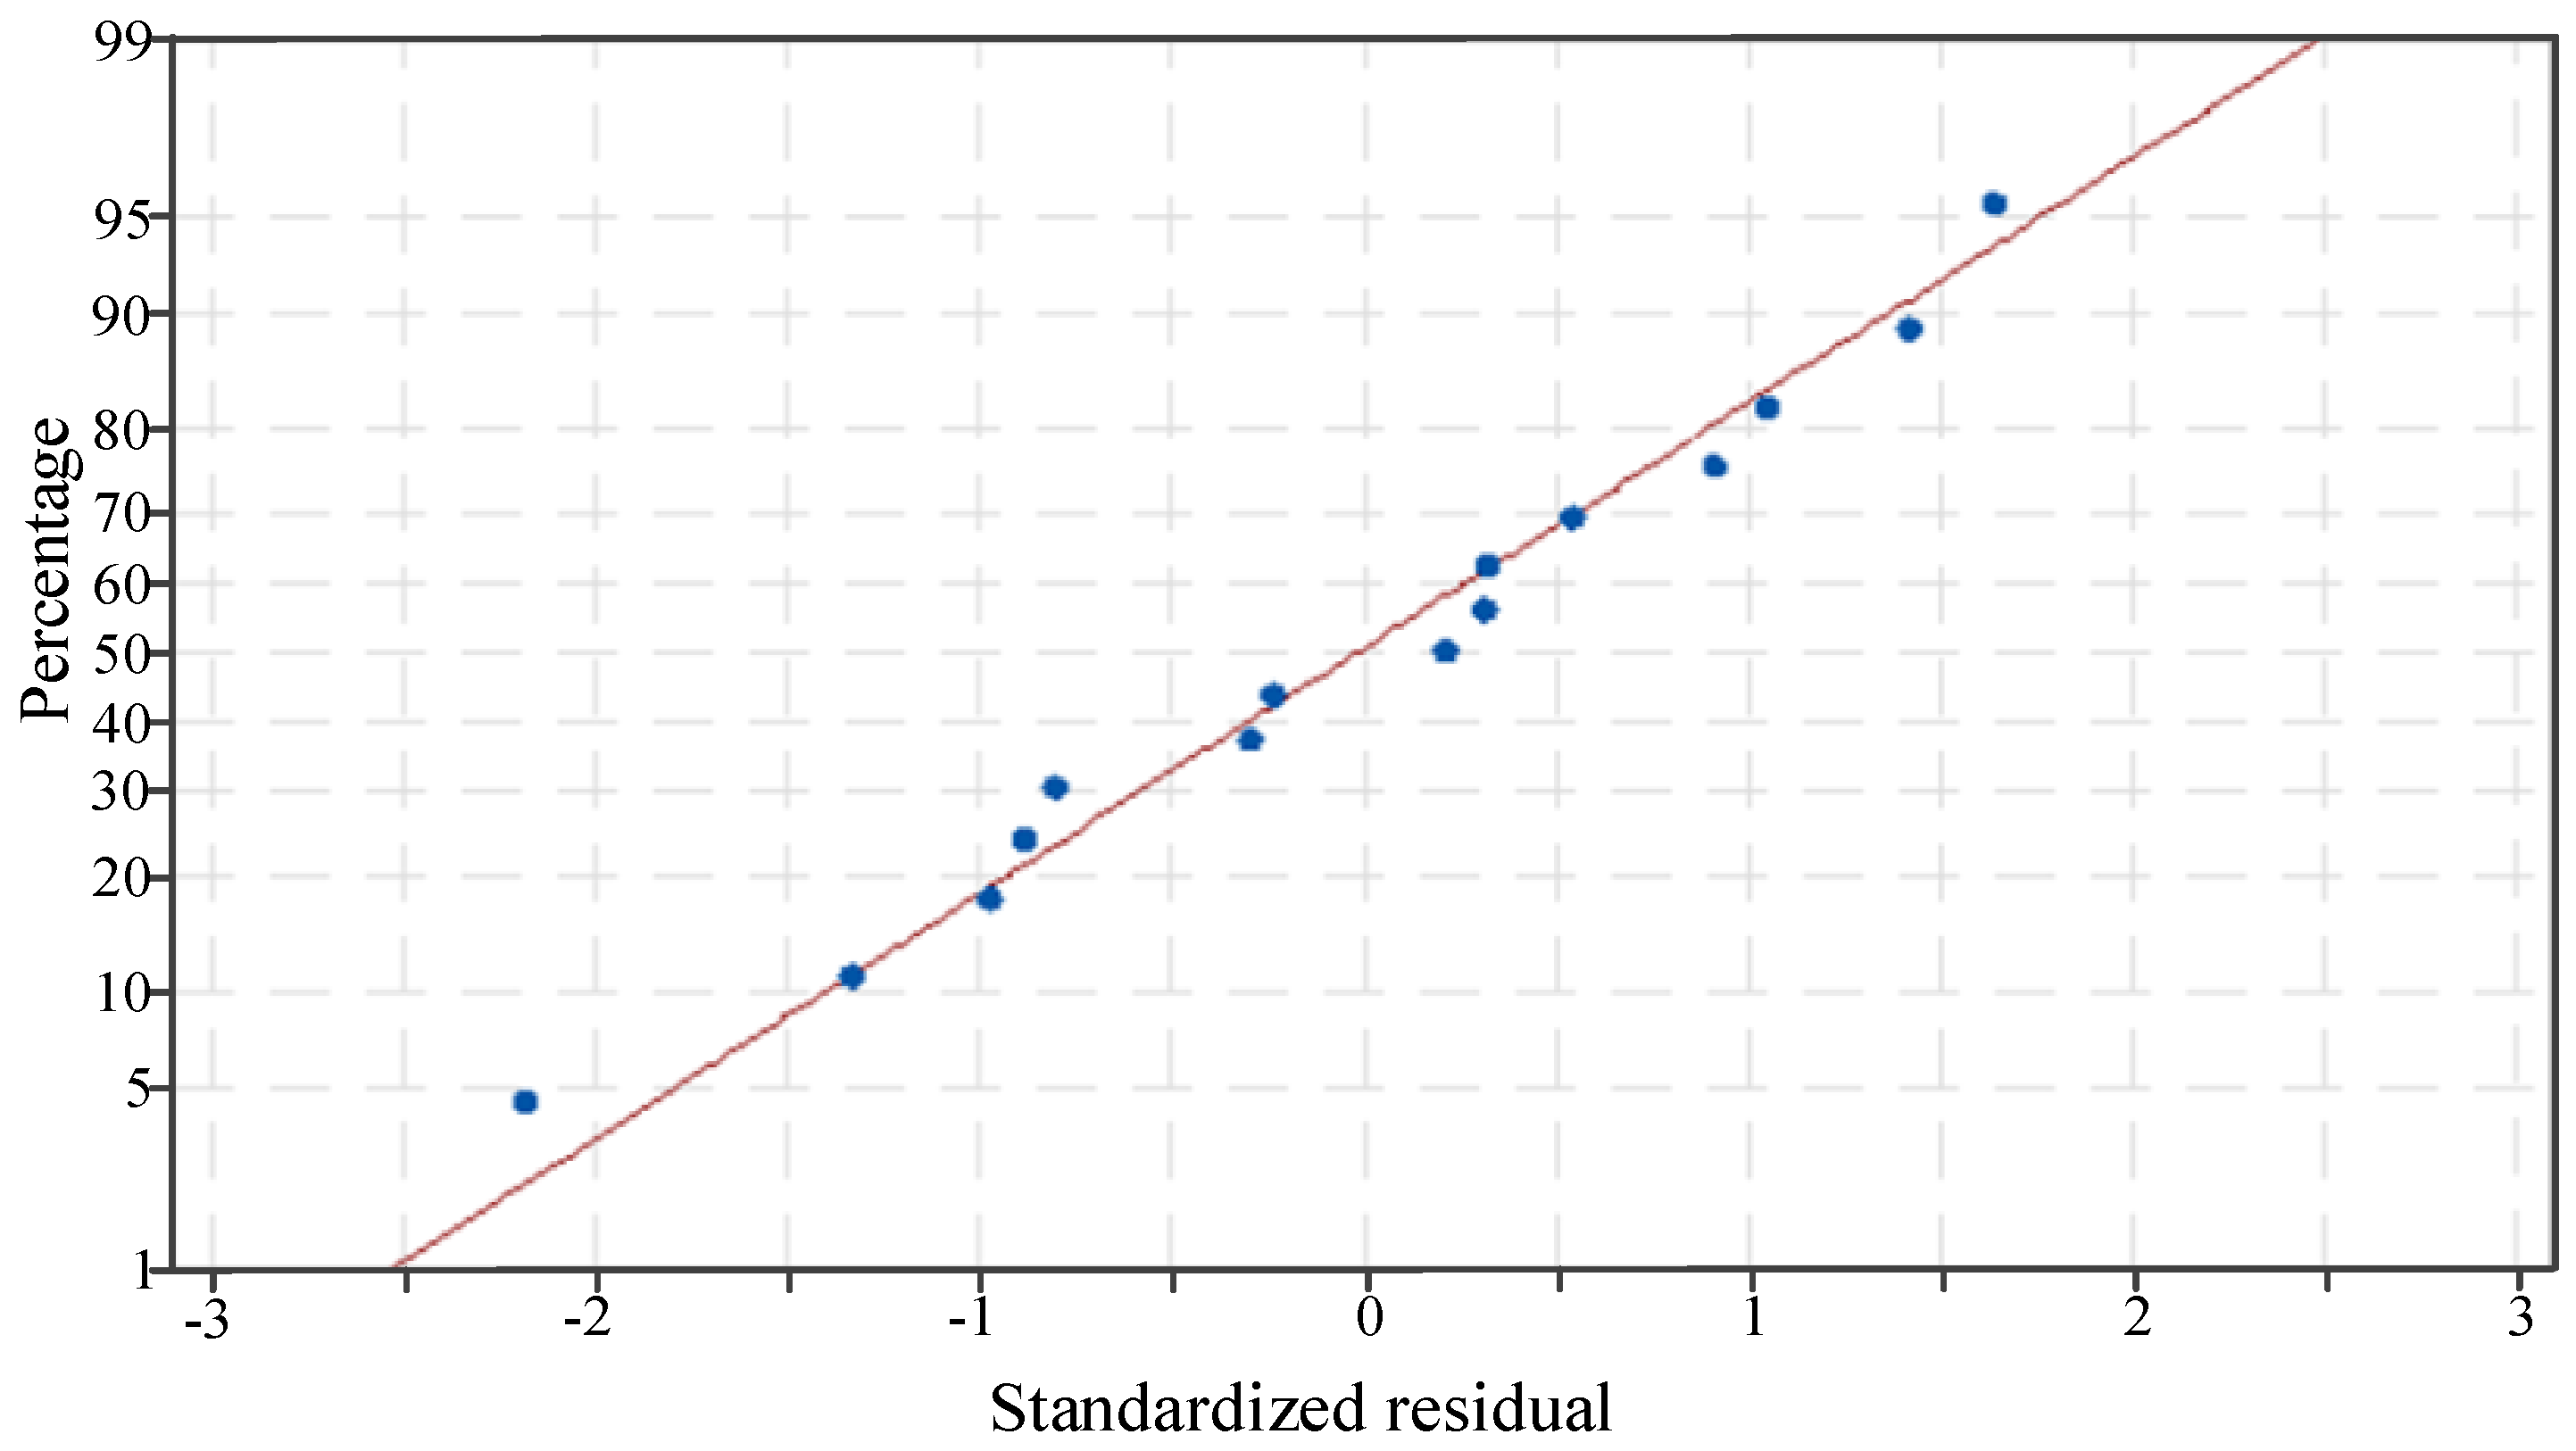
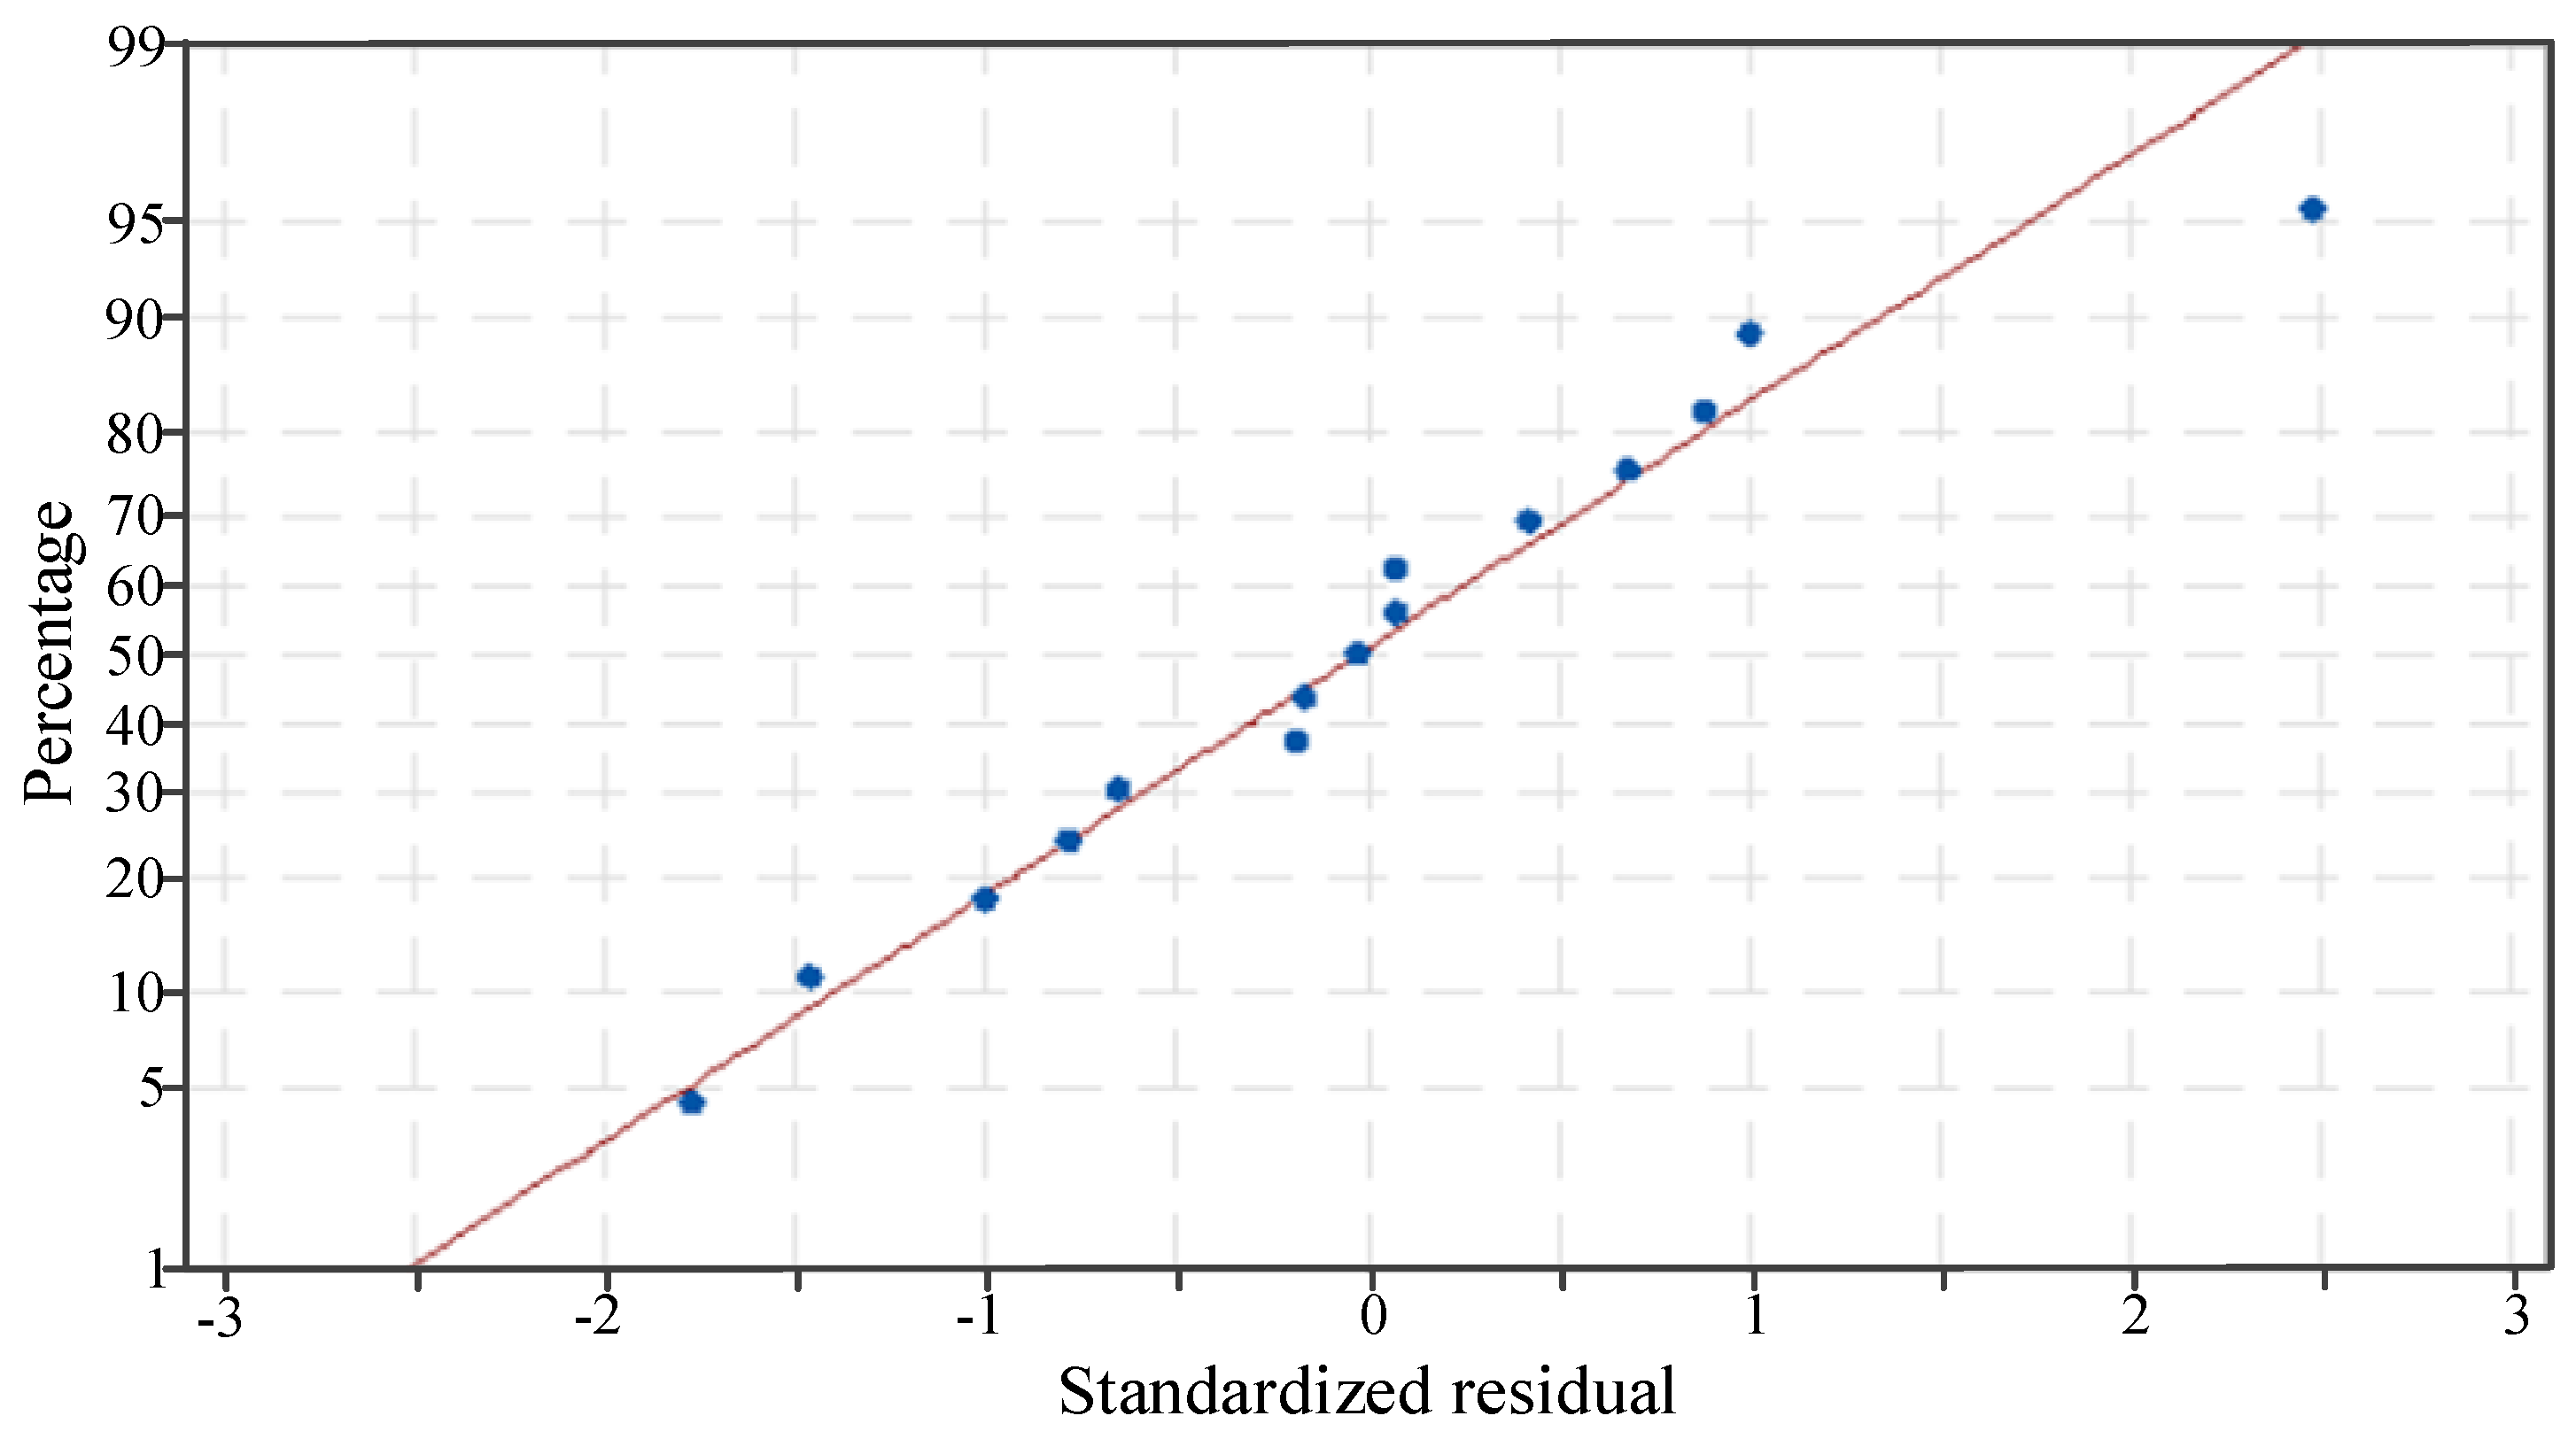
Figure 5 shows the normal probability plot of the mathematical regression model of V M a x A & W . It was shown that all the residuals lay in a straight line. This indicated that the proposed model was suitable for predicting results. There was a good fit between the regression model and the observed values.
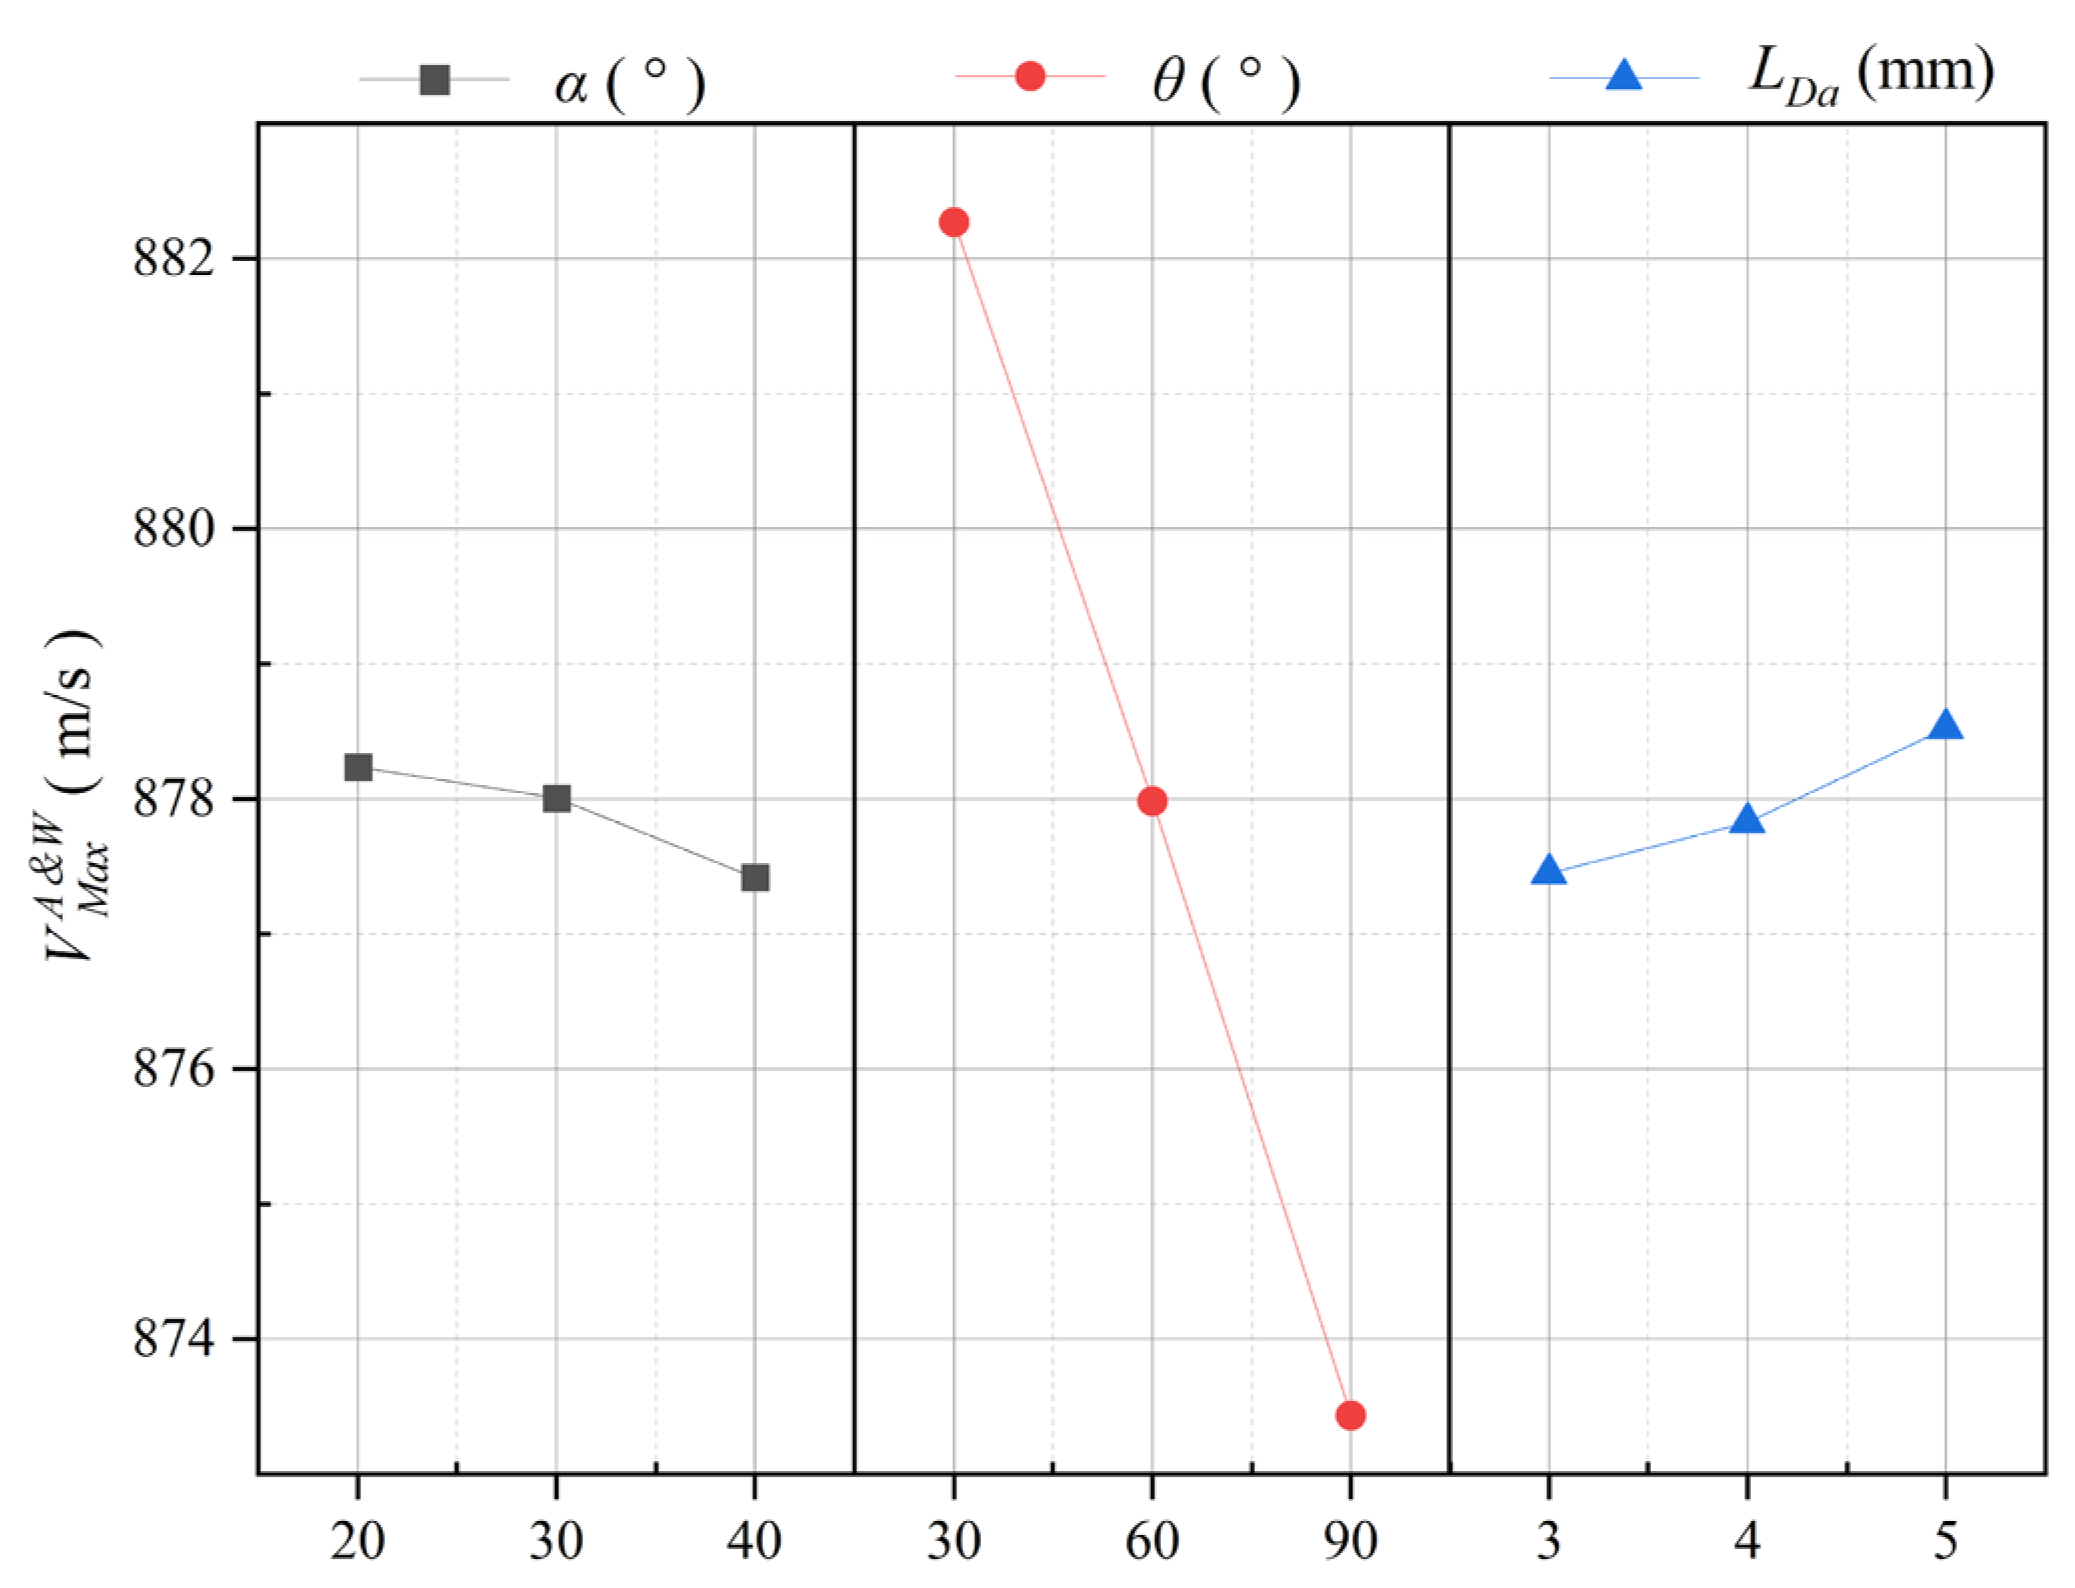
Figure 6 shows the influence of various parameter changes on the exit velocity V M a x A & W . It could be observed that when the converging tube angle α increased, the velocity at the exit of the corresponding continuous-phase flow field gradually decreased. When the abrasive incidence angle θ increased from 30° to 90°, the exit velocity V M a x A & W decreased significantly. Both phenomena were caused by the Venturi effect of the nozzle. When the inner volume of the nozzle increased, the increase in the air volume further led to a decrease in the exit velocity of the continuous gas–liquid flow. When the abrasive feed height LDa increased, the corresponding exit velocity gradually increased, which was related to the stability of the jet and air intervention in the nozzle.

3.2. Analysis of Particle Acceleration Efficiency

Table 3 shows a statistical analysis of the effect of the input structural parameters on the particle acceleration efficiency Pv using an ANOVA. The mathematical regression equation of Pv is shown in Equation (4):
P V = 47.22423 + 0.233869 × α + 0.51795 × θ + 17.78515 × L D a   0.108239 × ( θ × L D a ) 0.01747 × ( α × α ) 1.80821 × ( L D a × L D a )
Table 4 shows the ANOVA results of the proposed model at the 95% confidence level. The value of p was much less than 0.001, indicating that the mathematical regression model of the particle acceleration efficiency Pv was highly significant. The linear first-order model, square model and two-factor interaction term all had a significant influence on the mathematical regression model of Pv. At the same time, the loss of fit was obtained as an insignificant term, which indicated that the proposed model was sufficient to predict the output variables. The R2 values showed that 97.62% of the variation in the mathematical regression model of Pv was contributed by the control factors; 2.38% could not be described. The adjusted R2 value was 94.14%. The model was considered the best fit because the difference between the R2 and the adjusted R2 was within the acceptable range. So, the model was suitable for predicting the results of the mathematical regression model of Pv. The standard deviation of the mathematical regression model of Pv was 1.1197.
Figure 7 is the normal probability plot of the mathematical regression model for Pv. It could be seen that all the residuals were in a straight line. The normal distribution without residual clustering and the error showed that the model was well suited to predicting response effects.
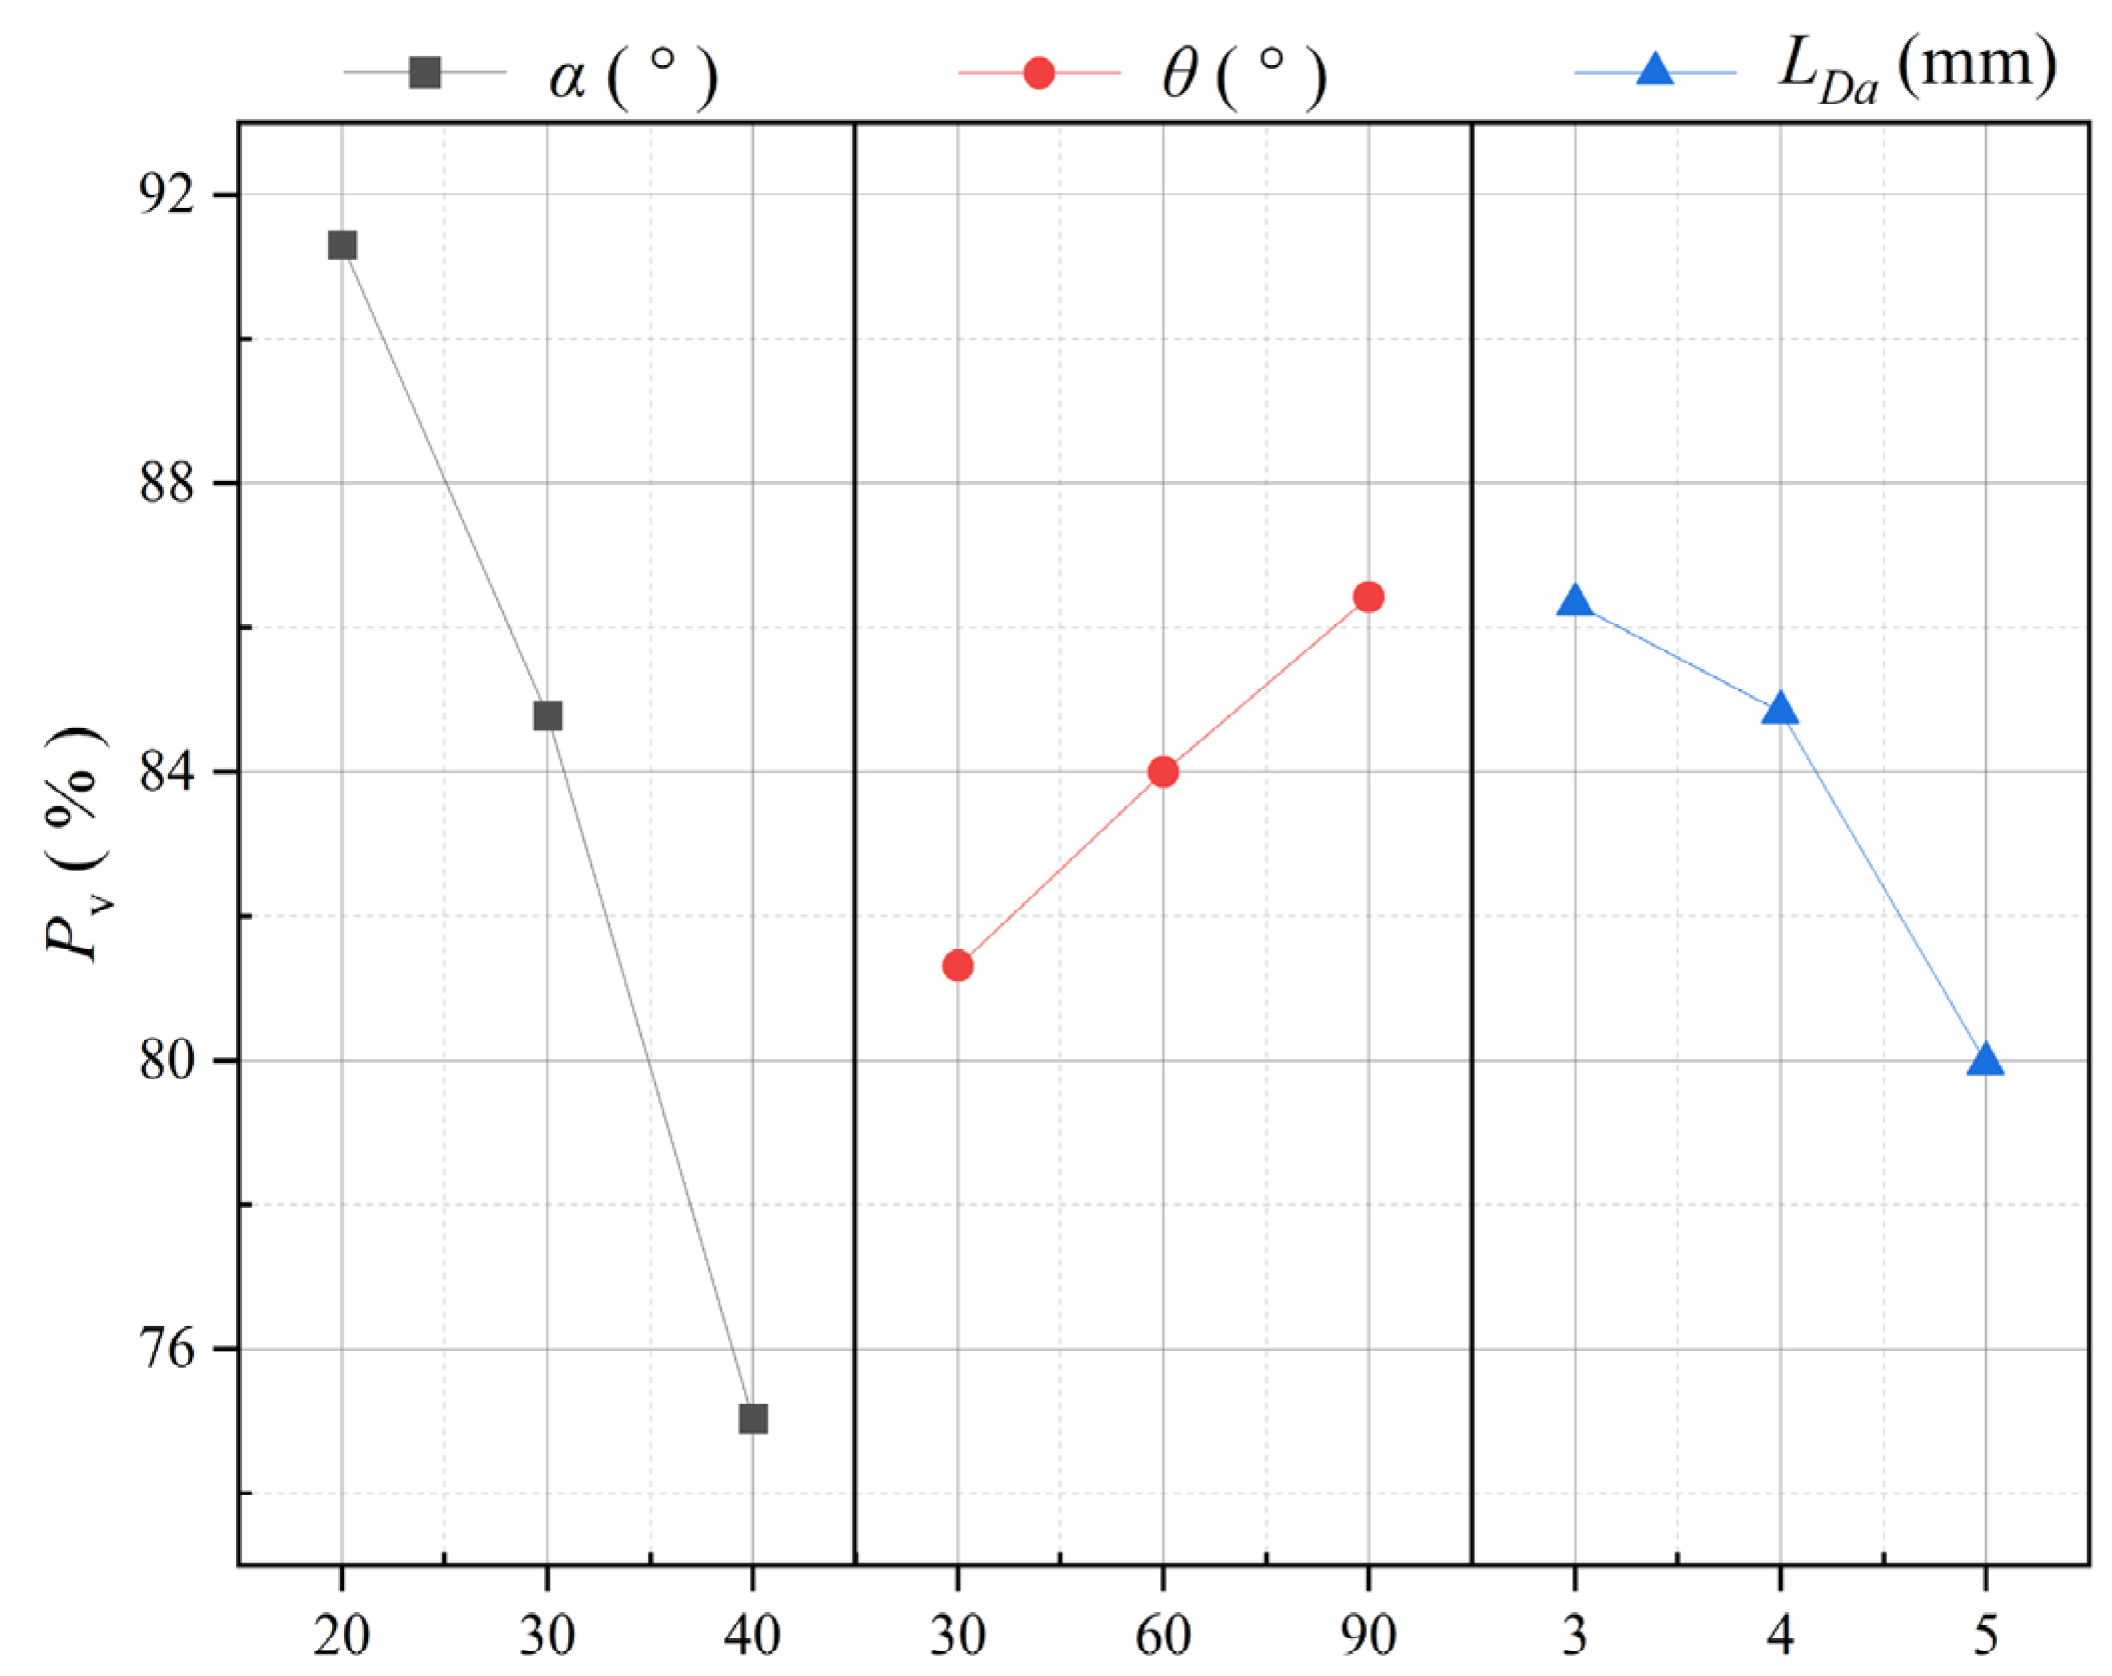
Figure 8 shows the influence of various parameter changes on the particle acceleration efficiency Pv. It could be observed that when the converging tube angle α and the abrasive feed height LDa increased, the corresponding particle acceleration efficiency decreased significantly. When the converging tube angle α increased from 20° to 40°, the corresponding volume of the aggregator decreased. The acceleration time of the abrasive particles was reduced. Most abrasives were not fully accelerated. When the abrasive feed height LDa increased, the abrasive particles moved away from the core area of the two-phase flow jet, and the divergent jet in the non-core area decreased the particle acceleration efficiency. When the abrasive incidence angle θ increased from 30° to 90°, the particle acceleration efficiency increased significantly. The reason was that the increase in the abrasive incidence angle reduced the contact between the particles and the air and further improved the particle acceleration efficiency.

3.3. Analysis of Wear Rate of Nozzle Wall E

The wear rate of the nozzle wall caused by changes in the nozzle structure variables was studied. Table 5 shows the ANOVA results of the wear rate of the nozzle wall E. A mathematical regression equation of the total wear rate E was further developed by using the reverse elimination method, as shown in Equation (5).
E = 5.3 × 10 5 2.15345 × 10 7 × α 1.1647 × 10 7 × θ 4.3559 × 10 6 × L D a   8.9657 × 10 10 × ( α × θ ) + 2.14504 × 10 8 × ( θ × L D a )   + 7.81186 × 10 9 × ( α × α ) + 3.73726 × 10 10 × ( θ × θ )   + 4.69664 × 10 7 × ( L D a × L D a )
Table 5 shows the statistical results of the models for E obtained using the ANOVA method. The value of F was 145.22, and the value of p was much less than 0.001, indicating that the developed model was significant. The linear primary model, quadratic model and two-factor interaction model had significant effects on the mathematical regression model of the wear rate of the nozzle wall E. The ANOVA results of the mathematical regression model of the wear rate of the nozzle wall E showed that the mathematical regression model of the wear rate of the nozzle wall E was mainly affected by the change in the converging tube angle α, followed by the abrasive feed height LDa. The value of the missing fit term was 7.5, and the corresponding value of p was 0.121, indicating that the influence was not significant. The effect of the missing fitting term was not significant, which indicated the adequacy and adaptability of the proposed mathematical regression model. The R2 and adjusted R2 were 98.8% and 94.35%, respectively. This small difference indicated the adaptability of the existing model. The mathematical regression standard deviation of the wear rate of the nozzle wall E was 1.896 × 10⁻⁷, indicating that the model was very suitable for predicting results and the error was small.
Figure 9 shows the normal probability plot of the mathematical regression model for the wear rate of the nozzle wall E. It was observed that all the residuals lay in a straight line. The residual error was normally distributed, which showed that the model was very suitable for predicting the future response and could obtain satisfactory results.
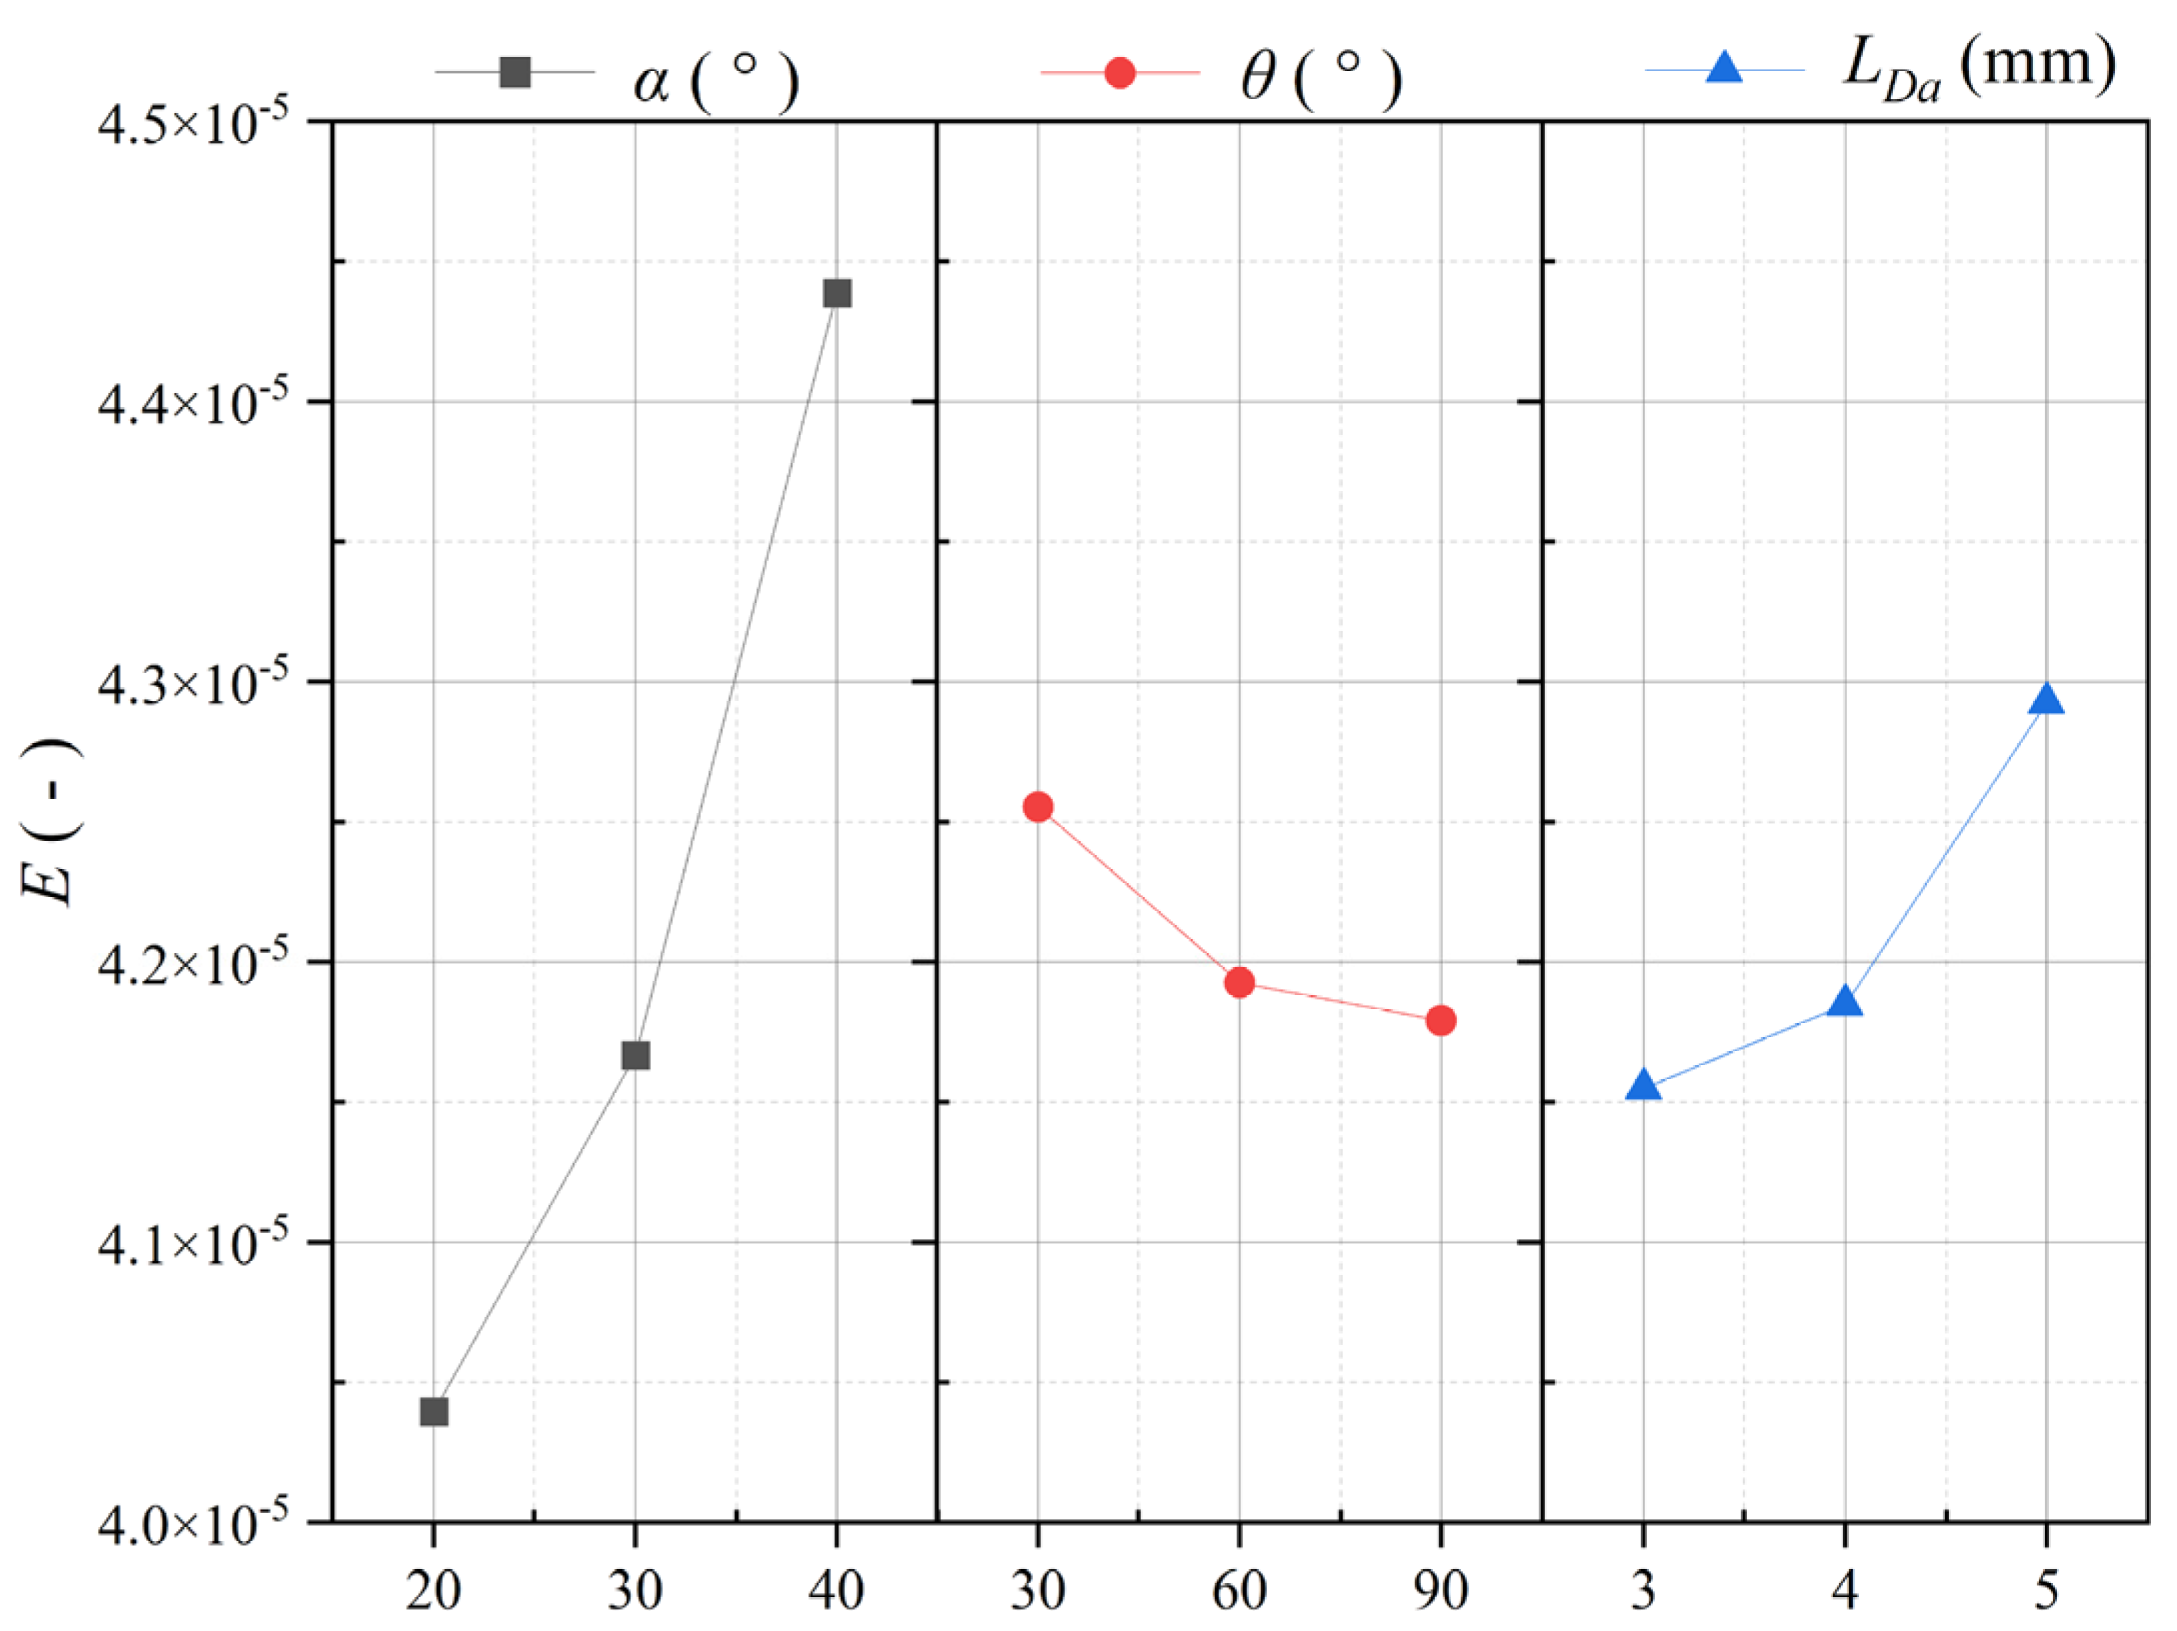
Figure 10 shows the influence of various parameter changes on the wear rate of the nozzle wall E. It could be observed that when the converging tube angle α and the abrasive feed height LDa increased, the total wear rate of the corresponding nozzle wall increased significantly. When the converging tube angle α increased from 20° to 40°, the corresponding volume of the convergence tube decreased, resulting in a decrease in the acceleration efficiency of abrasive particles. The irregular movement of the incompletely accelerated particles in the nozzle increased the contact with the nozzle wall. The wear rate of the nozzle wall gradually increased. When the abrasive feed height LDa increased, the abrasives became far away from the core area of the two-phase flow jet, and the particle acceleration efficiency decreased. This was one of the reasons for the increase in the wear rate of the nozzle wall. When θ increased from 30° to 90°, E decreased slightly. It could be seen that the increase in the abrasive incidence angle reduced the contact between the particles and the air. The wear effect on the abrasive particles was small.
The ANOVA analysis results of the above three responses, including the exit velocity V M a x A & W , particle acceleration efficiency Pv and wear rate E, showed that the developed mathematical models were significant in predicting the responses. The experimental error was very small, and the output data could be utilized to implement multi-objective optimization.

3.4. Nozzle Structure Optimization Based on HTS Algorithm

Heat Transfer Search (HTS) is a population-based Multi-Objective Heat Transfer Search algorithm [33]. The update mechanism of the algorithm at each stage is described in detail below.

3.4.1. Heat Conduction Stage

According to the thermal conductivity mechanism of the HTS algorithm, Equations (6) and (7) were adopted to iteratively update the optimal solution. The space could be better searched during the execution of the algorithm, and the optimal solution could be found [34].
X j , i = X k , i + ( R 2 X k , i ) if   f ( X j ) > f ( X k ) X j , i + ( R 2 X j , i ) if   f ( X j ) < f ( X k )   if   g g max C D F
X j , i = X k , i + ( r i X k , i ) if   f ( X j ) > f ( X k ) X j , i + ( r i X j , i ) if   f ( X j ) < f ( X k )   if   g > g max C D F
where xj,i is the initial solution of the algorithm and xj,i is the updated solution of the HTS algorithm. j is the index of the current solution. k is a randomly selected solution, and k j . i is a randomly selected design variable; gmax is the specified maximum number of iterations. CDF is the conduction factor. R is a probability variable, R ϵ (0,0.3333). ri is an evenly distributed random number, ri ϵ (0,1).

3.4.2. Convection Stage

In the convective stage of the HTS algorithm, the updating of the iterative solution is mainly carried out through the following functions, (8) and (9) [34].
X j , i = X j , i + R × ( X s X m s × T C F )
T C F = a b s ( R r i )   if   g g max C O F r o u n d ( 1 + r i )   if   g > g max C O F
here, X j , i is the updated solution of the HTS algorithm. j and i are the indexes of the current solution. COF is the convection factor. R is a probability variable, R ϵ (0,0.6666). ri is a uniformly distributed random number, ri ϵ (0,1). Xs indicates the ambient temperature, and Xms indicates the average temperature of the system. TCF is a temperature change factor.

3.4.3. Radiation Stage

In the radiation stage of the HTS algorithm, the updating of iterative solutions is mainly carried out through the following functions, (10) and (11) [34].
X j , i = X j , i + R × ( X k , i X j , i ) if   f ( X j ) > f ( X k ) X j , i + R × ( X j , i X k , i ) if   f ( X j ) < f ( X k )   if   g g max R D F
X j , i = X j , i + r i × ( X k , i X j , i ) if   f ( X j ) > f ( X k ) X j , i + r i × ( X j , i X k , i ) if   f ( X j ) < f ( X k )   if   g g max R D F
where X j , i is the updated solution of HTS algorithm and where j and i are the indexes of the current solution. k is a randomly selected solution, and kj. i is a randomly selected design variable. RDF is a radiation factor. R is a probability variable, R ϵ (0.3333,0.6666). ri is an evenly distributed random number, ri ϵ (0,1).
In the execution process, all the response results for the exit velocity of the continuous phase V M a x A & W , the particle acceleration efficiency Pv and the wear rate of the nozzle wall E were kept after four decimal places. The converging tube angle α ranged from 20° to 40°, and its value was a positive integer with an accuracy of 1°. The abrasive incidence angle θ ranged from 30° to 90°, and its value was a positive integer with an accuracy of 1°. The abrasive feed height LDa ranged from 3 to 5 mm with an accuracy of 0.1 mm.
Table 6 shows the results of single-objective optimization using the HTS algorithm. If any goal reached the desired value, the other goals would be far from the desired level. When the output of the continuous phase exit velocity V M a x A & W needed to be maximized, the corresponding values of the particle acceleration efficiency Pv and the wear rate of the nozzle wall E did not reach the required corresponding levels. A similar situation could be observed for other objective functions. So, when the maximum of the particle acceleration efficiency Pv and the minimum of the wear rate of the nozzle wall E were obtained, the level of the third corresponding variable was the one that needed to be maximized. It was highlighted that the combination of input variables was different for each objective function. In order to maximize V M a x A & W , the input process parameters were as follows: the converging tube angle α was 20°, the abrasive incident angle θ was 30°, and the corresponding abrasive feed height LDa was 5 mm. In order to maximize Pv and minimize E, the input process parameters were as follows: the converging tube angle α was 20°, the abrasive incident angle θ was 90°, and the corresponding abrasive feed height LDa was 3 mm. The optimal method, a single-objective Pareto method using the HTS algorithm, was used to provide the final process parameter settings for the machine.
An optimization method based on the response surface was adopted to further assign a weight of 0.33 to all responses and to further optimize the results of the exit velocity V M a x A & W , the particle acceleration efficiency Pv and the wear rate of the nozzle wall E. The optimized objective function is shown in function (12).
O b j = w 1 × ( V M a x A & W ) + w 2 × ( P v ) + w 3 × ( E )
The optimization results showed that there were two groups of response values of the exit velocity V M a x A & W , the particle acceleration efficiency Pv and the wear rate of the nozzle wall E, as shown in Table 7. These two sets of parameters, optimized simultaneously, were all useful if all the response variables were equally important to the working conditions.
However, two sets of response results would lead to confusion in the design and use of the parameters for the finally determined model of the nozzle. One of the solutions to this complex problem was to further optimize the Pareto front through the combinatorial optimization of multi-objective and multi-response methods, which could provide tradeoffs between the output responses.

3.5. Multi-Objective and Multi-Response Optimization of Nozzle Structure Based on MOHTS Algorithm

The Multi-Objective Heat Transfer Search (MOHTS) is an extended version of the HTS algorithm which can find the best optimal solution for problems involving multi-response variable conflict [35,36,37,38]. In this paper, the MOHTS algorithm was applied to find the optimal Pareto frontier of the non-dominated solution. At the end of 10,000 evolvements of the objective functions, the optimal advantages of the Pareto values were obtained. For the 35 generated Pareto points, a unique optimal solution was provided for each Pareto point. Table 8 shows the results of the 35 Pareto points and the corresponding structural design parameters of the HP-AWJ.
By using the MOHTS algorithm, the optimal solution for the Pareto frontier was obtained. A spatial scatter diagram was drawn in 3D space, as shown in Figure 11. In the 3D diagram, the X, Y and Z axes represent the abrasive acceleration efficiency, the wear rate in the focusing tube and the maximum exit velocity of the continuous phase, respectively. Each Pareto point corresponded to its predicted response data, and each prediction was a combined function of the input in response to the set parameters. The choice of a particular Pareto point depended on the specific requirements of the response. The advantage of using the MOHTS algorithm was that the Pareto points were non-dominated and all solutions could be obtained in one step. All Pareto points were obtained under the condition that the converging tube angle α was the same. This showed that an α value of 20° provided the best solution. Table 9 shows the Pareto points selected four times randomly. The model was further verified by simulation. The final response values of the particle exit velocity, the particle acceleration efficiency and the wear rate of the nozzle wall obtained using the MOHTS algorithm were compared with the data from the simulation. The developed model and the MOHTS algorithm were considered suitable as the variance between the predicted and measured values was less than 5%, which was negligible.
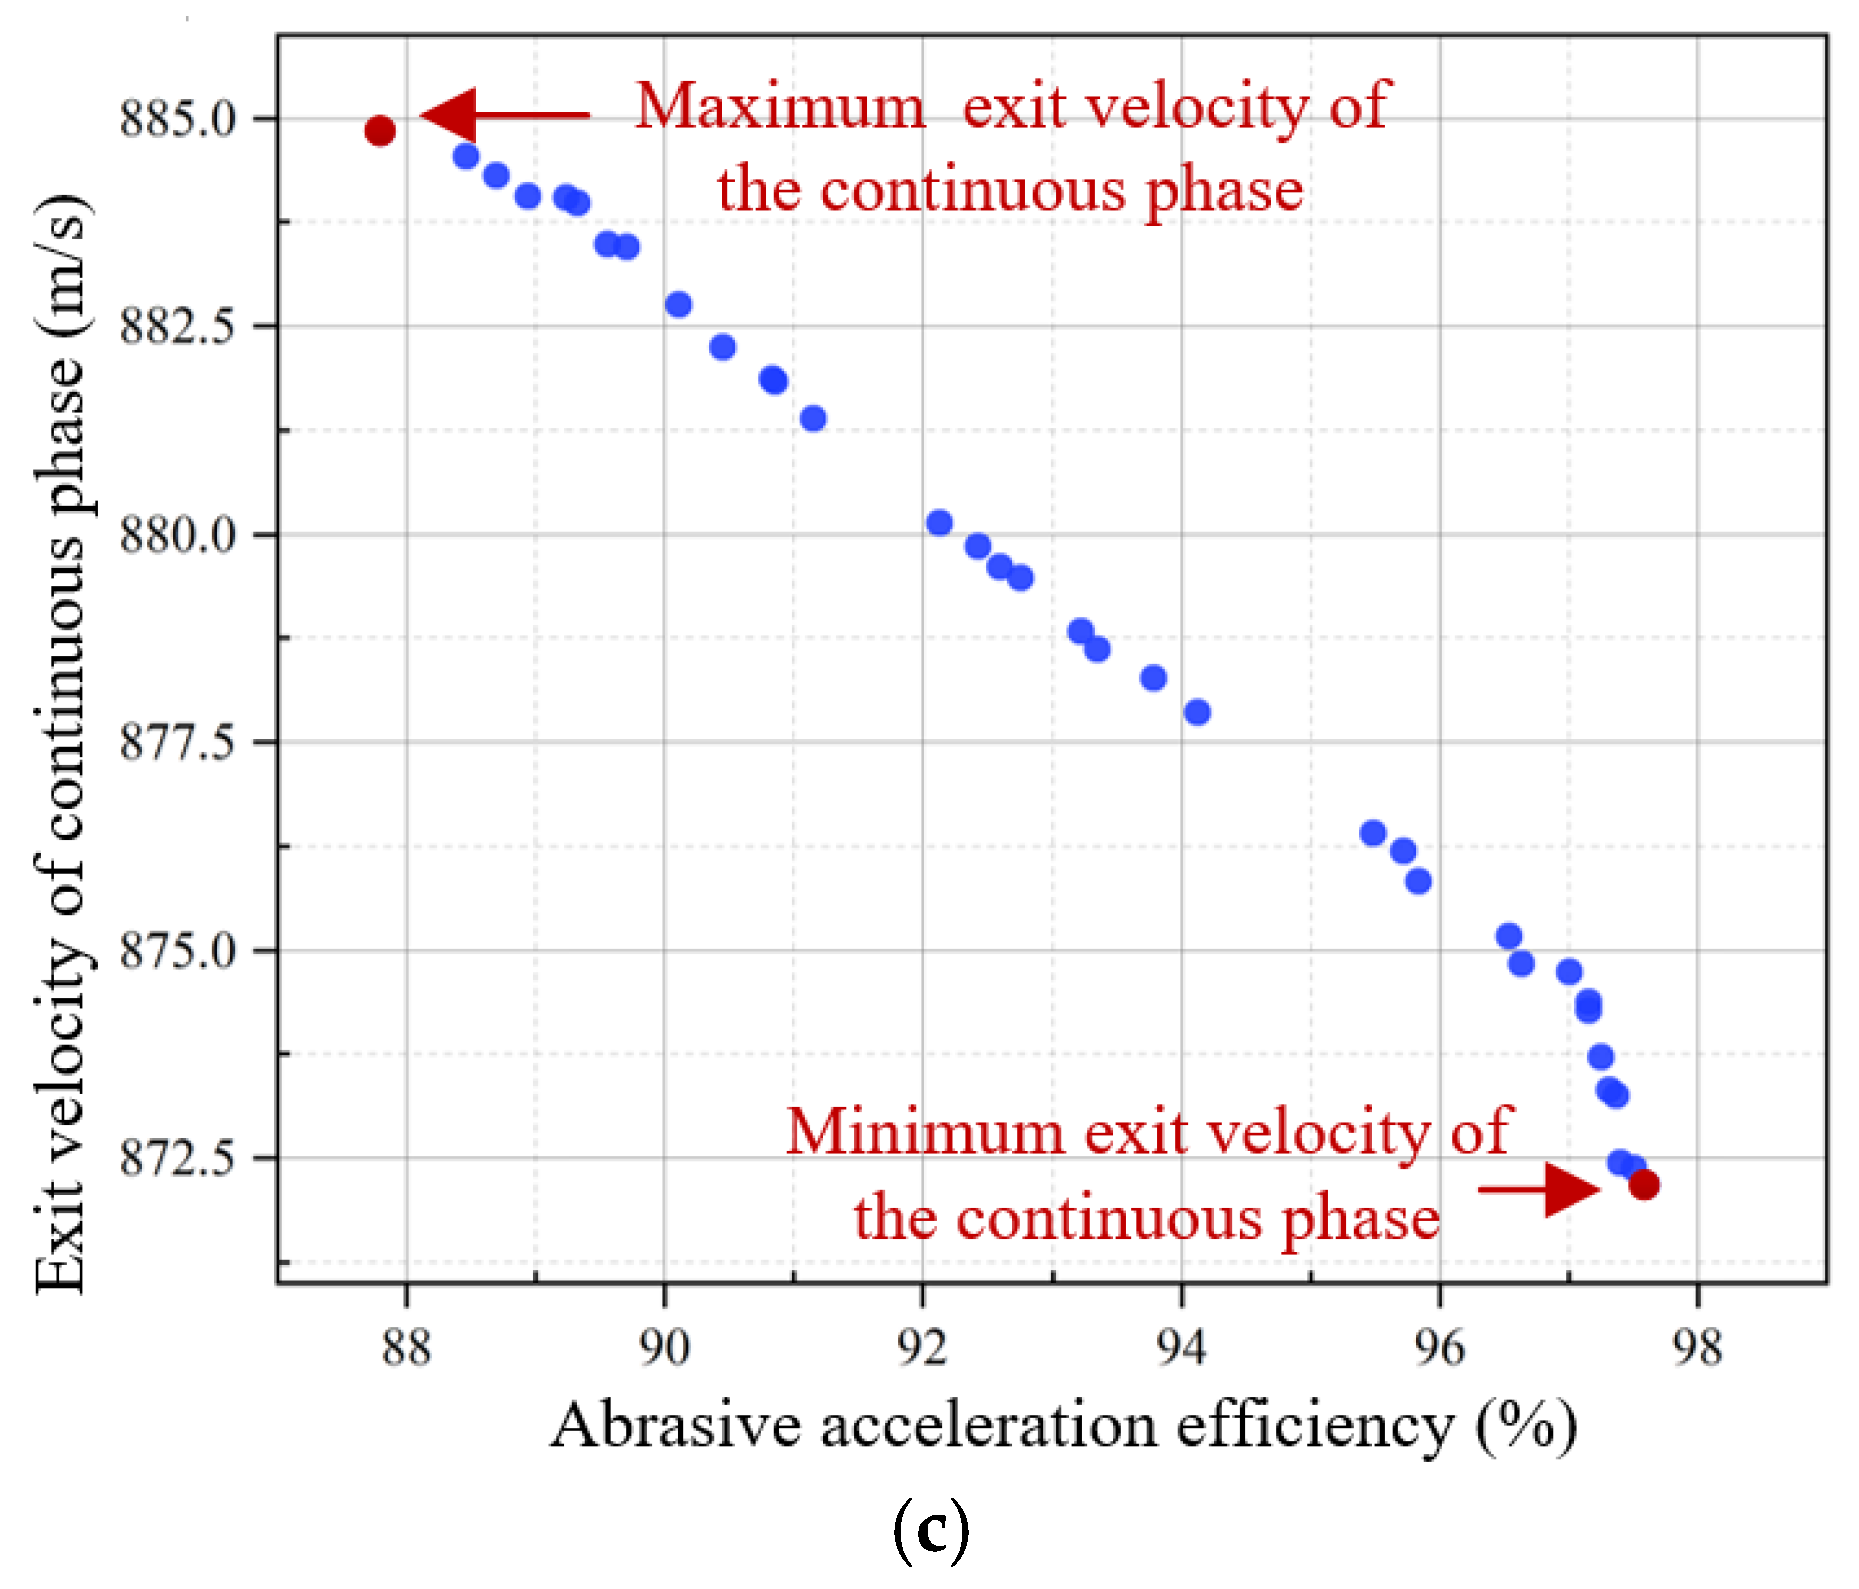
A 2D view of the Pareto points using XY, ZY and XZ projections provided a better way to understand the 3D Pareto spatial scatter plots. So, the relationship between Pv and E, the relationship between V M a x A & W and E and the relationship between Pv and V M a x A & W were presented, respectively, in the 2D views, as shown in Figure 12a–c. It is necessary to note that these 2D views also had an effect on the third variable. As shown in the Pareto diagram of Pv versus E in Figure 12a, the entire space was occupied by a discrete distribution of the obtained Pareto points. The maximum and minimum expected values of Pv and E highlighted in red in Figure 12a were 97.597% and 3.97 × 10⁻⁵, respectively. Therefore, to obtain higher acceleration efficiency and a lower wear rate, the optimal solution was acquired at the desired level when the parameters were set to α = 20°, θ = 90° and LDa = 3 mm.
A similar situation could be seen in the 2D Pareto diagram of V M a x A & W versus E in Figure 12b. The two Pareto points highlighted in red in Figure 12b are the minimum value of E and the maximum value of V M a x A & W . The observed maximum exit velocity of the continuous phase V M a x A & W and the minimum wear rate E were 884.84 m/s and 3.97 × 10⁻⁵, respectively. According to the optimal response results, the structural design parameters of the nozzle were α = 20°, θ = 30° and LDa = 3 mm and α = 20°, θ = 90° and LDa = 3 mm. When dealing with the optimal response of the exit velocity of the continuous phase and the wear rate, a conflict phenomenon appeared. When the exit velocity of the continuous phase increased, the wear rate increased, and vice versa. Therefore, in the design of the nozzle structure, a Pareto point needed to be selected which was a trade-off between these two values.
Figure 12c shows a 2D Pareto diagram of the abrasive acceleration efficiency versus the exit velocity of the continuous phase. Since both responses are in the higher-is-better category, the two Pareto points highlighted in red in Figure 12c are useful for industrial use. When the abrasive acceleration efficiency was at its maximum, the exit speed of the continuous phase was low, and vice versa. The maximum exit velocity of the continuous phase and the maximum abrasive acceleration efficiency were 884.84 m/s and 97.597%, respectively. According to the optimal response results, the structural design parameters of the nozzle were α = 20°, θ = 30° and LDa = 3 mm and α = 20°, θ = 90° and LDa = 3 mm. Therefore, for the two goals, the appropriate Pareto points were chosen depending on the requirement of the response values being used.

4. Conclusions

In this study, combining the abrasive particle kinetic energy model and the nozzle wall wear model in the multi-phase flow model of a HP-AWJ nozzle, its structure was optimized using the parametric multi-objective structure optimization design method. The influences of the converging tube angle, the abrasive incident angle and the abrasive feed height on the exit velocity of the flow field, the particle acceleration efficiency and the wear rate of the focusing tube were discussed. Based on this study, the following conclusions were drawn:
(1)
A mathematical regression model was generated using the RSM technique, and the results of the ANOVA method showed the applicability of the developed model.
(2)
The probability of normality, the importance of the model terms and the missing fitting insignificance of all responses highlighted the good prediction ability of the developed model in predicting the exit velocity of the flow field, the particle acceleration efficiency and the wear rate of the focusing tube.
(3)
The optimization results of the HTS algorithm based on a single objective showed that the maximum exit velocity of the flow field was 876.98 m/s under the conditions α = 20°, θ = 90° and LDa = 5 mm. The maximum particle acceleration efficiency was 95.132% and the minimum wear rate of the focusing tube was 4.1026 × 10⁻⁵ under the conditions α = 20°, θ = 90° and LDa = 3 mm.
(4)
Considering the optimal results of the response values, a weight ratio of 0.33 was assigned to all response surfaces to obtain two optimal results of the exit velocity of the flow field V M a x A & W , the particle acceleration efficiency Pv and the wear rate of the focusing tube E. The optimal results were as follows: V M a x A & W = 883.1263 m/s, Pv = 89.6432% and E = 4.0461 × 10⁻⁵ (when α = 20°, θ = 30° and LDa = 4.2 mm) and V M a x A & W = 883.5880 m/s, Pv = 89.6239% and E = 4.0435 × 10⁻⁵ (when α = 20°, θ = 31° and LDa = 3.7 mm).
(5)
The 3D Pareto diagram and its 2D projection diagrams in the XY, ZY and XZ planes were drawn according to the best advantages of the Pareto values. Non-dominated feasible solutions are highlighted in the figures. Each Pareto point provided a unique solution with corresponding design parameter values for the HP-AWJ nozzle. The appropriate result point could be selected by observing the results of the desired exit velocity of the flow field, the particle acceleration efficiency and the wear rate of the focusing tube.
In this paper, only the above three significant structural parameters were studied and optimized, and the full effects on the HP-AWJ were not considered. In the future, research can focus on the influence of other parameters on the nozzle wear, and experiments can be conducted to verify the structural optimization results.

Author Contributions

Conceptualization, L.W. and X.Z.; methodology, X.Z.; software, X.Z.; validation, L.W. and X.Z.; formal analysis, L.W.; investigation, L.W.; resources, X.Z.; data curation, X.Z.; writing—original draft preparation, L.W.; writing—review and editing, Y.G.; visualization, Y.G.; supervision, L.F.; project administration, L.F.; funding acquisition, L.W. All authors have read and agreed to the published version of the manuscript.

Funding

This research was funded by the National Natural Science Foundation of China, grant number 51475338, and the Hubei Provincial Natural Science Foundation of China, grant number 2021CFB141.

Data Availability Statement

No new data were created or analyzed in this study. Data sharing is not applicable to this article.

Conflicts of Interest

The authors declare no conflict of interest.

References

  1. Oh, T.-M.; Cho, G.-C. Rock cutting depth model based on kinetic energy of abrasive waterjet. Rock Mech. Rock Eng. 2016, 49, 1059–1072. [Google Scholar] [CrossRef]
  2. Fowler, G.; Pashby, I.R.; Shipway, P.H. The effect of particle hardness and shape when abrasive water jet milling titanium alloy Ti6Al4V. Wear 2009, 266, 613–620. [Google Scholar] [CrossRef]
  3. Yuvaraj, N.; Kumar, M.P. Cutting of aluminium alloy with abrasive water jet and cryogenic assisted abrasive water jet: A comparative study of the surface integrity approach. Wear 2016, 362, 18–32. [Google Scholar] [CrossRef]
  4. Nanduri, M.; Taggart, D.G.; Kim, T.J. A study of nozzle wear in abrasive entrained water jetting environment. J. Trib. 2000, 122, 465–471. [Google Scholar] [CrossRef]
  5. Paola, B.A.; Barreto, C.T. A microscopic study on kerfs in rocks subjected to abrasive waterjet cutting. Wear 2020, 448, 203210. [Google Scholar]
  6. Gupta, A. Performance optimization of abrasive fluid jet for completion and stimulation of oil and gas wells. J. Energy Resour. Technol. 2012, 134, 021001. [Google Scholar] [CrossRef]
  7. Zou, X.; Fu, L.; Wu, L.; Zuo, W. Research on Multiphase Flow and Nozzle Wear in a High-Pressure Abrasive Water Jet Cutting Head. Machines 2023, 11, 614. [Google Scholar] [CrossRef]
  8. Wang, X.; Ge, Z.; Deng, Q.; Yao, Z.; Cui, Y.; Ge, B. Effects of nozzle inner surface wear ontherock-breakingability of premixed abrasive water jets. OceanEngineering 2025, 322, 120548. [Google Scholar]
  9. Shao, C.; Ge, Z.; Zhou, Z.; Liu, W.; Li, Z.; Tian, C.; Chang, W. Experimental and numerical investigation of abrasive water jet nozzle erosion. Powder Technol. 2023, 430, 119031. [Google Scholar] [CrossRef]
  10. Li, Z.; Yao, S.; Yun, F.; Wang, X.; Wang, L.; Wu, Y. Simulation and Optimization of the Nozzle Section Geometry for a Suspension Abrasive Water Jet. Machines 2021, 10, 3. [Google Scholar] [CrossRef]
  11. Liu, Y.; Chen, X.; Zhang, J.; Feng, L.; Liu, H.; Hao, C. Structural optimization design of ice abrasive water jet nozzle based on multi-objective algorithm. Flow Meas. Instrum. 2024, 97, 102586. [Google Scholar] [CrossRef]
  12. Schwartzentruber, J.; Narayanan, C.; Papini, M.; Liu, H. Optimized abrasive waterjet nozzle design using genetic algorithms. In Proceedings of the 23rd International Conference on Water Jetting, Seattle, WA, USA, 16–18 November 2016. [Google Scholar]
  13. Qiang, Z.; Miao, X.; Wu, M.; Sawhney, R. Optimization of abrasive waterjet machining using multi-objective cuckoo search algorithm. Int. J. Adv. Manuf. Technol. 2018, 99, 1257–1266. [Google Scholar] [CrossRef]
  14. Perec, A.; Radomaka-Zalas, A.; Fajdek-Bieda, A.; Pude, F. Process Optimization by Applying the Response Surface Methodology (RSM) to the Abrasive Suspension Water Jet Cutting of Phenolic Composites. FU Mech Eng. 2023, 21, 575. [Google Scholar] [CrossRef]
  15. Kawecka, E. The Whale Optimization Algorithm in Abrasive Water Jet Machining of Tool Steel. Procedia Comput. Sci. 2023, 225, 1037–1044. [Google Scholar] [CrossRef]
  16. Kawecka, E. The use of metaheuristic optimization algorithm in abrasive water jet machining of white marble. AIP Conf. Proc. 2024, 3130, 020015. [Google Scholar]
  17. Perec, A. Desirability Function Analysis (DFA) in Multiple Responses Optimization of Abrasive Water Jet Cutting Process. Rep. Mech. Eng. 2022, 3, 11–19. [Google Scholar] [CrossRef]
  18. Perec, A.; Kawecka, E.; Radomaka-Zalas, A.; Pude, F. Optimization of Abrasive Waterjet Cutting by Using the CODAS Method with Regard to Interdependent Processing Parameters. Stroj. Vestn. J. Mech. Eng. 2023, 69, 367–375. [Google Scholar] [CrossRef]
  19. Perec, A.; Kawecka, E. Modeling of the Abrasive Water Jet machining by ANN in uncertainty conditions. Procedia Comput. Sci. 2024, 246, 2176–2184. [Google Scholar] [CrossRef]
  20. Rao, R.V.; Rai, D.P.; Balic, J. Multi-objective optimization of abrasive waterjet machining process using Jaya algorithm and PROMETHEE Method. J. Intell. Manuf. 2019, 30, 2101–2127. [Google Scholar] [CrossRef]
  21. Shukla, R.; Singh, D. Experimentation investigation of abrasive water jet machining parameters using Taguchi and Evolutionary optimization techniques. Swarm Evol. Comput. 2017, 32, 167–183. [Google Scholar] [CrossRef]
  22. Santhanakumar, M.; Adalarasan, R.; Rajmohan, M. Experimental modelling and analysis in abrasive waterjet cutting of ceramic tiles using grey-based response surface methodology. Arab. J. Sci. Eng. 2015, 40, 3299–3311. [Google Scholar] [CrossRef]
  23. Chakraborty, S.; Mitra, A. Parametric optimization of abrasive water-jet machining processes using grey wolf optimizer. Mater. Manuf. Process. 2018, 33, 1471–1482. [Google Scholar] [CrossRef]
  24. Pawar, P.J.; Vidhate, U.S.; Khalkar, M.Y. Improving the quality characteristics of abrasive water jet machining of marble material using multi-objective artificial bee colony, algorithm. J. Comput. Des. Eng. 2018, 5, 319–328. [Google Scholar] [CrossRef]
  25. Qiang, Z.; Wu, M.; Miao, X.; Sawhney, R. CFD research on particle movement and nozzle wear in the abrasive water jet cutting head. Int. J. Adv. Manuf. Technol. 2018, 95, 4091–4100. [Google Scholar] [CrossRef]
  26. Tamilarasan, A.; Renugambal, A.; Manikanta, D.; Reddy, G.S.; Sravankumar, K.; Sreekar, B.; Prasadreddy, G.V. Application of crow search algorithm for the optimization of abrasive water jet cutting process parameters. In Proceedings of the IOP Conference Series: Materials Science and Engineering, Tamilnadu, India, 8–9 March 2018. [Google Scholar]
  27. Arumugam, S.; Chengareddy, P.; Tamilarasan, A.; Santhanam, V. RSM and crow search algorithm-based optimization of ultrasonicated transesterification process parameters on synthesis of polyol ester-based biolubricant. Arab. J. Sci. Eng. 2019, 44, 5535–5548. [Google Scholar] [CrossRef]
  28. Chaudhari, R.; Vora, J.J.; Mani Prabu, S.S.; Palani, I.A.; Patel, V.K.; Parikh, D.M.; de Lacalle, L.N.L. Multi-response optimization of WEDM process parameters for machining of superelastic nitinol shape-memory alloy using a heat-transfer search algorithm. Materials 2019, 12, 1277. [Google Scholar] [CrossRef] [PubMed]
  29. Chaudhari, R.; Vora, J.J.; Prabu, S.M.; Palani, I.A.; Patel, V.K.; Parikh, D.M. Pareto optimization of WEDM process parameters for machining a NiTi shape memory alloy using a combined approach of RSM and heat transfer search algorithm. Adv. Manuf. 2021, 9, 64–80. [Google Scholar] [CrossRef]
  30. Wankhede, V.; Jagetiya, D.; Joshi, A.; Chaudhari, R. Experimental investigation of FDM process parameters using Taguchi analysis. Mater. Today Proc. 2020, 27, 2117–2120. [Google Scholar] [CrossRef]
  31. Chaurasia, A.; Wankhede, V.; Chaudhari, R. Experimental investigation of high-speed turning of INCONEL 718 using PVD-coated carbide tool under wet condition. In Proceedings of the Innovations in Infrastructure: Proceedings of ICIIF, Singapore, 29 September 2018. [Google Scholar]
  32. Sheth, M.; Gajjar, K.; Jain, A.; Shah, V.; Patel, H.; Chaudhari, R.; Vora, J. Multi-objective optimization of inconel 718 using Combined approach of taguchi—Grey relational analysis. In Proceedings of the Advances in Mechanical Engineering: Select Proceedings of ICAME 2020, Singapore, 30 June 2020. [Google Scholar]
  33. Chaudhari, R.; Vora, J.; López de Lacalle, L.N.; Khanna, S.; Patel, V.K.; Ayesta, I. Parametric optimization and effect of nano-graphene mixed dielectric fluid on performance of wire electrical discharge machining process of Ni55. 8Ti shape memory alloy. Materials 2021, 14, 2533. [Google Scholar] [CrossRef]
  34. Kumar, S.; Tejani, G.G.; Pholdee, N.; Bureerat, S. Multi-objective modified heat transfer search for truss optimization. Eng. Comput. 2021, 37, 3439–3454. [Google Scholar] [CrossRef]
  35. Chaudhari, R.; Vora, J.J.; Patel, V.; Lacalle, L.L.D.; Parikh, D.M. Effect of WEDM process parameters on surface morphology of nitinol shape memory alloy. Materials 2020, 13, 4943. [Google Scholar] [CrossRef] [PubMed]
  36. Tejani, G.G.; Kumar, S.; Gandomi, A.H. Multi-objective heat transfer search algorithm for truss optimization. Eng. Comput. 2021, 37, 641–662. [Google Scholar] [CrossRef]
  37. Kumar, S.; Tejani, G.G.; Pholdee, N.; Bureerat, S. Multi-objective passing vehicle search algorithm for structure optimization. Expert Syst. Appl. 2021, 169, 114511. [Google Scholar] [CrossRef]
  38. Chaudhari, R.; Vora, J.J.; Patel, V.; López de Lacalle, L.N.; Parikh, D.M. Surface analysis of wire-electrical-discharge-machining-processed shape-memory alloys. Materials 2020, 13, 530. [Google Scholar] [CrossRef]
Figure 1. Schematic diagram of HP-AWJ nozzle.
Lubricants 13 00091 g001
Figure 2. Schematic diagram of the variation in the converging tube angle.
Lubricants 13 00091 g002
Figure 3. Schematic diagram of the variation in the abrasive incidence angle.
Lubricants 13 00091 g003
Figure 4. Schematic diagram of the abrasive feed angle.
Lubricants 13 00091 g004
Figure 5. Normal distribution probability diagram of the mathematical regression model of V M a x A & W .
Lubricants 13 00091 g005
Figure 6. Influence of parameter changes on V M a x A & W .
Lubricants 13 00091 g006
Figure 7. Normal distribution probability diagram of the mathematical regression model of Pv.
Lubricants 13 00091 g007
Figure 8. Influence of parameter changes on Pv.
Lubricants 13 00091 g008
Figure 9. Normal probability graph of the mathematical regression model of E.
Lubricants 13 00091 g009
Figure 10. Influences of each parameter on E.
Lubricants 13 00091 g010
Figure 11. Three-dimensional Pareto graphs of V M a x A & W , Pv and E.
Lubricants 13 00091 g011
Figure 12. Each projection in XY, ZY and XZ planes of 3D Pareto diagram. (a) 2D Pareto diagram of abrasive acceleration efficiency and wear rate. (b) 2D Pareto diagram of exit velocity of continuous phase and wear rate. (c) 2D Pareto diagram of abrasive acceleration efficiency and exit velocity of continuous phase.
Lubricants 13 00091 g012aLubricants 13 00091 g012b
Table 1. Mode conditions based on RSM-BBD and response values of simulation results.
Conditionα (°)θ (°)LDa (mm) V M a x A & W (m/s)Pv (%)E (-)
140605.0878.688673.02984.4978 × 10−5
220304.0882.602289.53654.0365 × 10−5
330604.0877.505886.49684.1115 × 10−5
440304.0881.211273.45144.4875 × 10−5
520603.0878.698793.43293.9843 × 10−5
620904.0872.961395.60934.0318 × 10−5
730903.0871.726093.54064.0087 × 10−5
830604.0878.071785.90144.1257 × 10−5
930305.0881.678080.63064.2658 × 10−5
1020605.0878.698786.69624.1068 × 10−5
1140904.0874.007277.00164.3752 × 10−5
1230604.0878.445985.80254.1257 × 10−5
1340603.0875.780076.64794.3954 × 10−5
1430905.0875.034179.52434.3003 × 10−5
1530303.0883.588481.65824.2316 × 10−5
Table 2. Model energy parameters in simulation.
ParametersValues
Water pressure (MPa)400
Inlet pressure of abrasive particles and air (Pa)101,325
Outlet pressure of the nozzle (Pa)101,325
Size of abrasive particles (mm)0.125
Table 3. Response surface variance analysis of mathematical regression model of V M a x A & W .
Source of VarianceDegrees of FreedomSum of SquaresMean Square ErrorValue of FValue of pSignificance
Model6170.27928.380104.36<0.001Significant
Linear primary3159.87153.290195.96<0.001Significant
α11.3401.3404.930.057Significant
θ1156.213156.213574.42<0.001Significant
LDa12.3182.3188.520.019Significant
Two-factor interaction310.4083.46912.760.002Significant
α × θ11.4851.4855.460.048Significant
α × LDa12.1152.1157.780.024Significant
θ × LDa16.8086.80825.040.001Significant
Error82.1760.272
Lack of fit61.7280.2881.290.499Insignificant
Pure error20.4480.224
Total14172.454
S = 0.521487, R2 = 97.79%, R2 (Adj.) = 94.43%.
Table 4. Response surface variance analysis of Pv.
Source of VarianceDegrees of FreedomSum of SquaresMean Square ErrorValue of FValue of pSignificance
Model6727.214121.20296.67<0.001Significant
Linear primary3663.123221.041176.31<0.001Significant
α1530.471530.471423.12<0.001Significant
θ152.01552.01541.49<0.001Significant
LDa180.63780.63764.32<0.001Significant
Two-factor interaction142.17642.17633.64<0.001Significant
θ × LDa142.17642.17633.64<0.001Significant
Linear square221.91510.9588.740.010Significant
α × α111.33511.3359.040.017Significant
LDa × LDa112.14412.1449.690.014Significant
Error810.0301.254
Lack of fit69.7481.62511.520.082Insignificant
Pure error20.2820.141
Total14
S = 1.1197, R2 = 97.62%, R2 (Adj.) = 94.14%.
Table 5. Analysis of response surface of E.
Source of VarianceDegrees of FreedomSum of SquaresMean Square ErrorValue of FValue of pSignificance
Model84.187 × 10−115.234 × 10−12145.52<0.001Significant
Linear primary33.681 × 10−111.227 × 10−11341.25<0.001Significant
α13.186 × 10−113.186 × 10−11885.94<0.001Significant
θ11.165 × 10−121.165 × 10−1232.380.001Significant
LDa13.792 × 10−123.792 × 10−12105.42<0.001Significant
Two-factor interaction21.946 × 10−129.730 × 10−1327.050.001Significant
α × θ12.894 × 10−132.894 × 10−138.050.030Significant
θ × LDa11.656 × 10−121.656 × 10−1246.060.001Significant
Linear square33.105 × 10−121.035 × 10−1228.770.001Significant
α × α12.253 × 10−122.253 × 10−1262.65<0.001Significant
θ × θ14.177 × 10−134.177 × 10−1311.610.014Significant
LDa × LDa18.145 × 10−138.145 × 10−1322.650.003Significant
Error62.158 × 10−133.597 × 10⁻¹⁴
Lack of fit42.023 × 10−135.058 × 10−147.500.121Insignificant
Pure error21.349 × 10−146.745 × 10⁻¹⁵
Total144.209 × 10−11
S = 1.896 × 10⁻⁷, R2 = 98.80%, R2 (Adj.) = 94.35%.
Table 6. Single-objective optimization results of each response based on HTS algorithm.
Optimized Resultα (°)θ (°)LDa (mm) V M a x A & W (m/s)Pv (%)E (-)
Maximum V M a x A & W 20305876.9892.334.3856 × 10−5
Maximum Pv20903870.4495.134.1026 × 10−5
Minimum E20903870.4495.134.1026 × 10−5
Table 7. Optimization results of response surface method.
Conditionα
(°)
θ
(°)
LDa
(mm)
V M a x A & W
(m/s)
Pv
(%)
E
(-)
120304.2883.126389.64324.0461 × 10−5
220313.7883.588089.62394.0435 × 10−5
Table 8. Pareto points based on HTS algorithm.
Numberα
(°)
θ
(°)
LDa
(mm)
V M a x A & W
(m/s)
Pv
(%)
E
(-)
120303884.8487.7924.1212 × 10−5
220903872.1897.5973.9700 × 10−5
320893.1872.4697.3973.9731 × 10−5
420803.2874.3997.1493.9803 × 10−5
520303.5884.0689.2364.0871 × 10−5
620323.3884.0788.9354.0934 × 10−5
720893872.3997.4973.9703 × 10−5
820343.4883.4989.5484.0786 × 10−5
920513.4880.1592.1224.0272 × 10−5
1020803874.2997.1543.9765 × 10−5
1120313.2884.3188.6934.0994 × 10−5
1220593.4878.6393.3424.0110 × 10−5
1320853873.2697.3673.9730 × 10−5
1420613.2878.2793.7774.0068 × 10−5
1520383.3882.7690.0994.0661 × 10−5
1620423.5881.8790.8264.0501 × 10−5
1720633.2877.8794.1194.0029 × 10−5
1820713876.1995.7153.9888 × 10−5
1920783.2874.8596.6253.9843 × 10−5
2020443.6881.3991.1484.0433 × 10−5
2120423.5881.8490.8444.0496 × 10−5
2220733.2875.8495.8363.9879 × 10−5
2320313.8883.4689.6984.0766 × 10−5
2420533.3879.8692.4254.0242 × 10−5
2520763.1875.1896.5363.9826 × 10−5
2620833.1873.7397.2473.9761 × 10−5
2720703.1876.4195.4853.9904 × 10−5
2820583.3878.8493.2174.0126 × 10−5
2920303.6883.9889.3224.0852 × 10−5
3020383.8882.2590.4394.0577 × 10−5
3120783874.7497.0053.9793 × 10−5
3220543.4879.6192.5864.0208 × 10−5
3320553.2879.4992.7474.0202 × 10−5
3420303.2884.5588.4584.1052 × 10−5
3520853.1873.3297.3063.9756 × 10−5
Table 9. Verification of the result.
α
(°)
θ
(°)
LDa
(mm)
Predicted Value of MOHTS AlgorithmSimulation Verification DataError
(%)
V M a x A & W
(m/s)
Pv
(%)
E
(-)
V M a x A & W
(m/s)
Pv
(%)
E
(-)
20303884.8487.7924.1212 × 10−5880.9590.484.2683 × 10−50.443.063.57
20383.8882.2590.4394.0577 × 10−5878.4693.664.2022 × 10−50.433.563.37
20583.3878.8493.2174.0126 × 10−5871.9996.144.1683 × 10−50.783.143.88
20903872.1897.5973.9700 × 10−5870.4495.134.1026 × 10−50.202.533.34
Disclaimer/Publisher’s Note: The statements, opinions and data contained in all publications are solely those of the individual author(s) and contributor(s) and not of MDPI and/or the editor(s). MDPI and/or the editor(s) disclaim responsibility for any injury to people or property resulting from any ideas, methods, instructions or products referred to in the content.