Analysis and Experimental Study of Contact Stress in Bolted Connections of Pitch Bearings

Abstract
1. Introduction
2. Simulation of Contact Stress of Pitch Bearing Bolted Connection
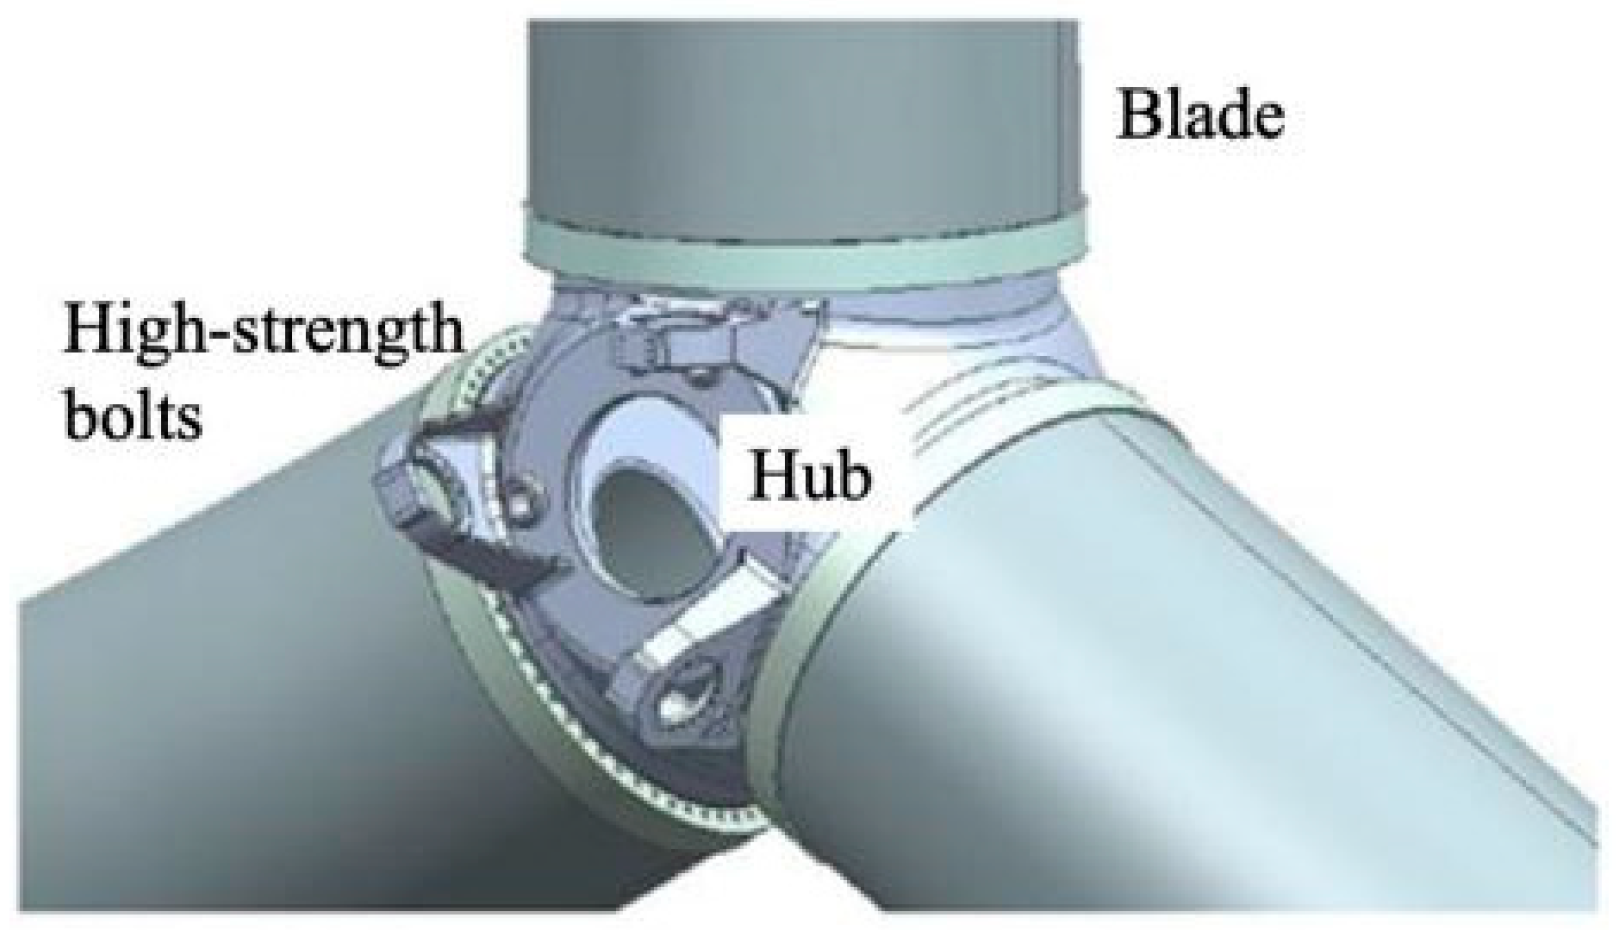
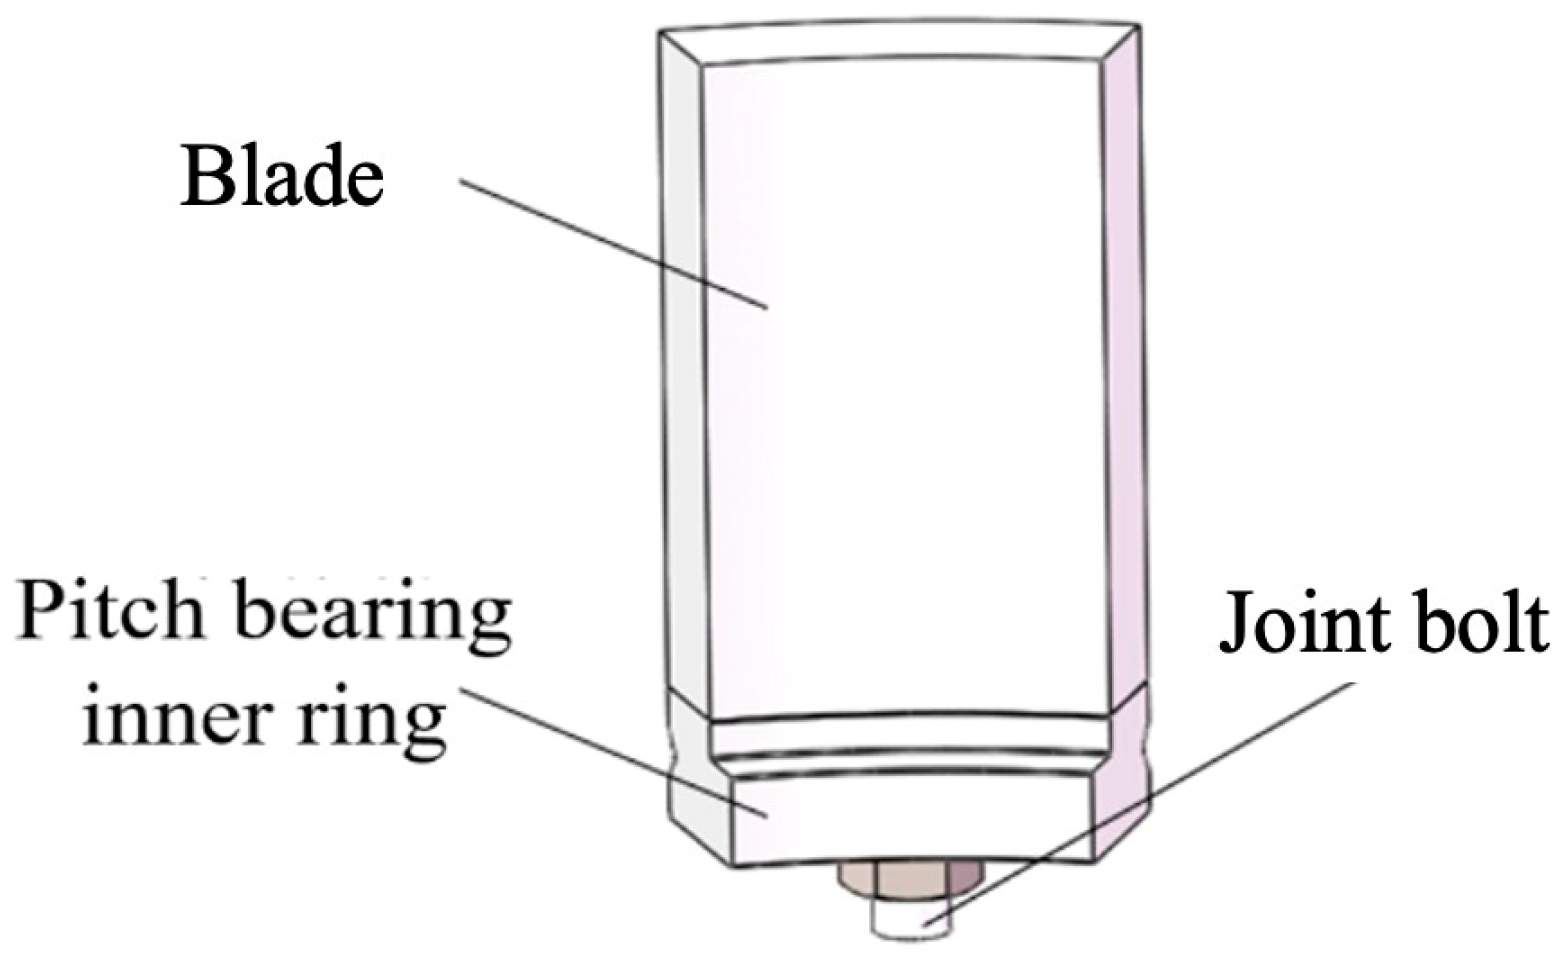
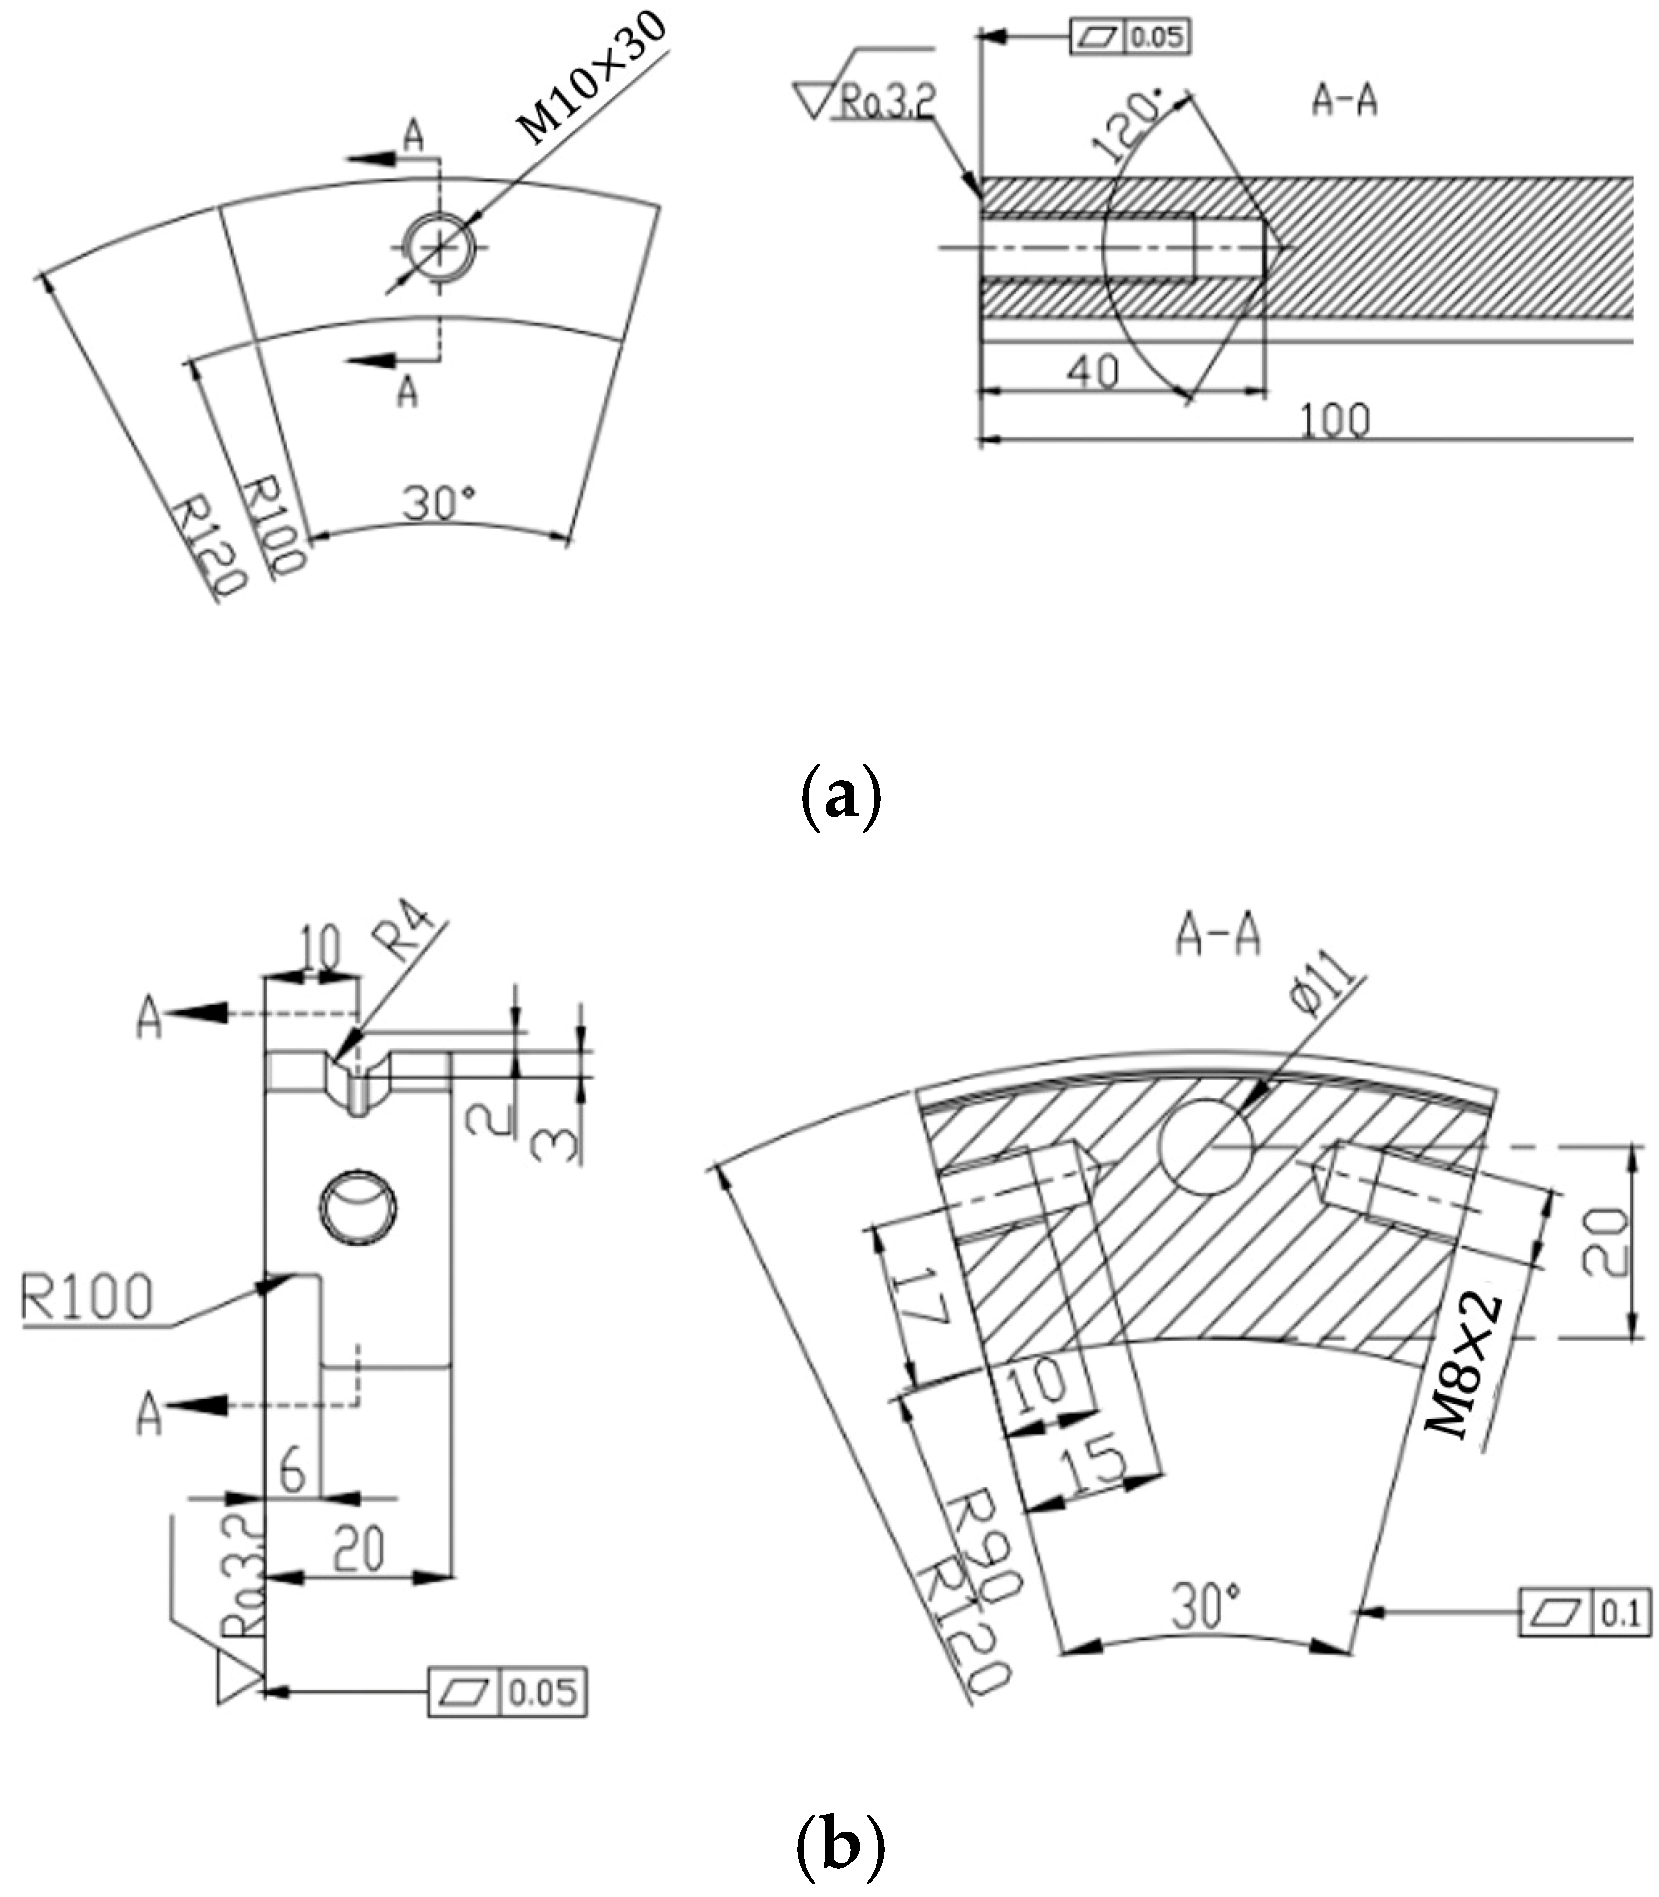
2.1. Finite Element Modeling
2.2. Mesh Element Size Analysis
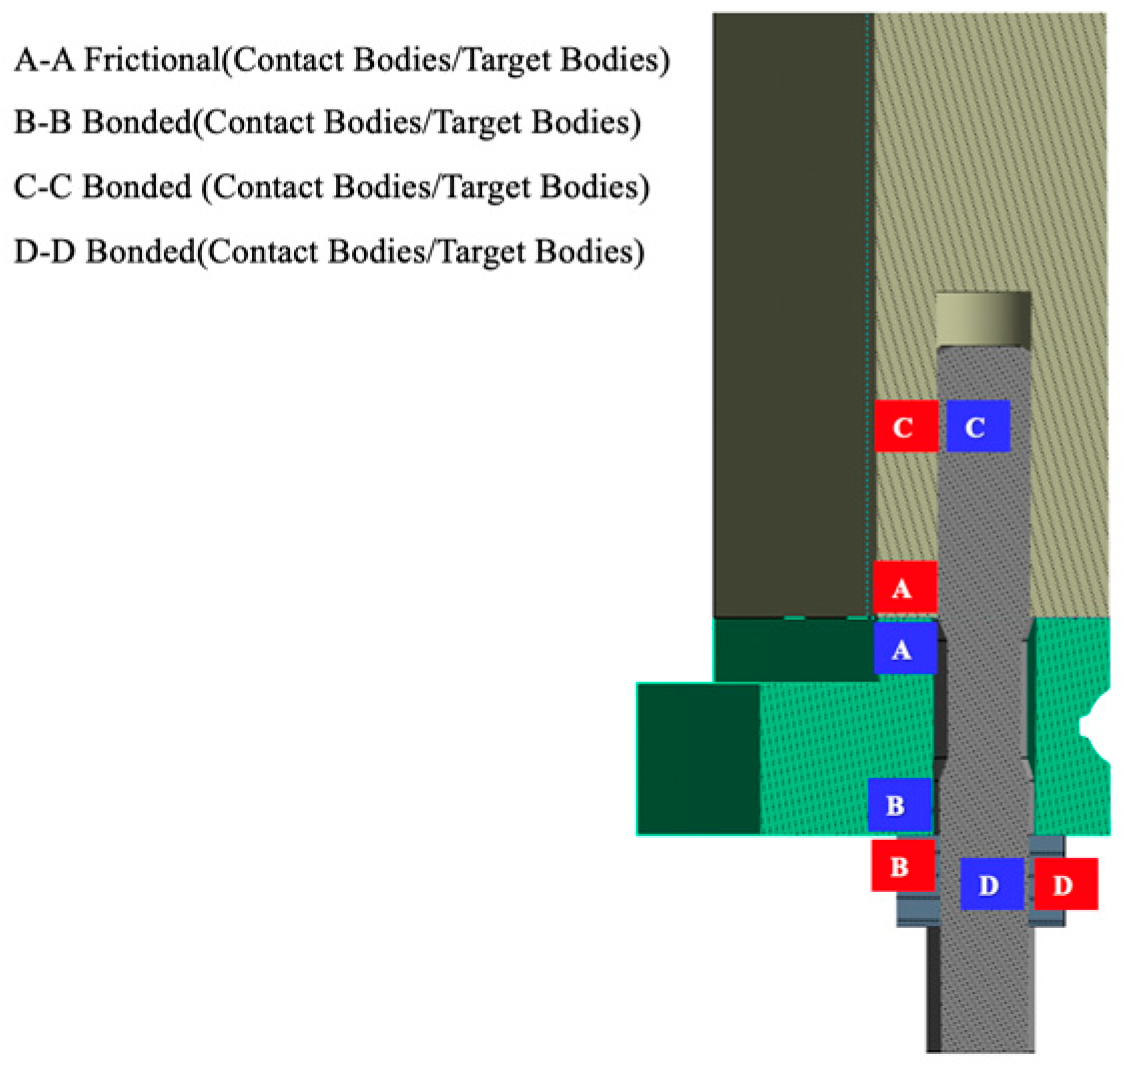
2.3. Bolted Connection Contact Settings
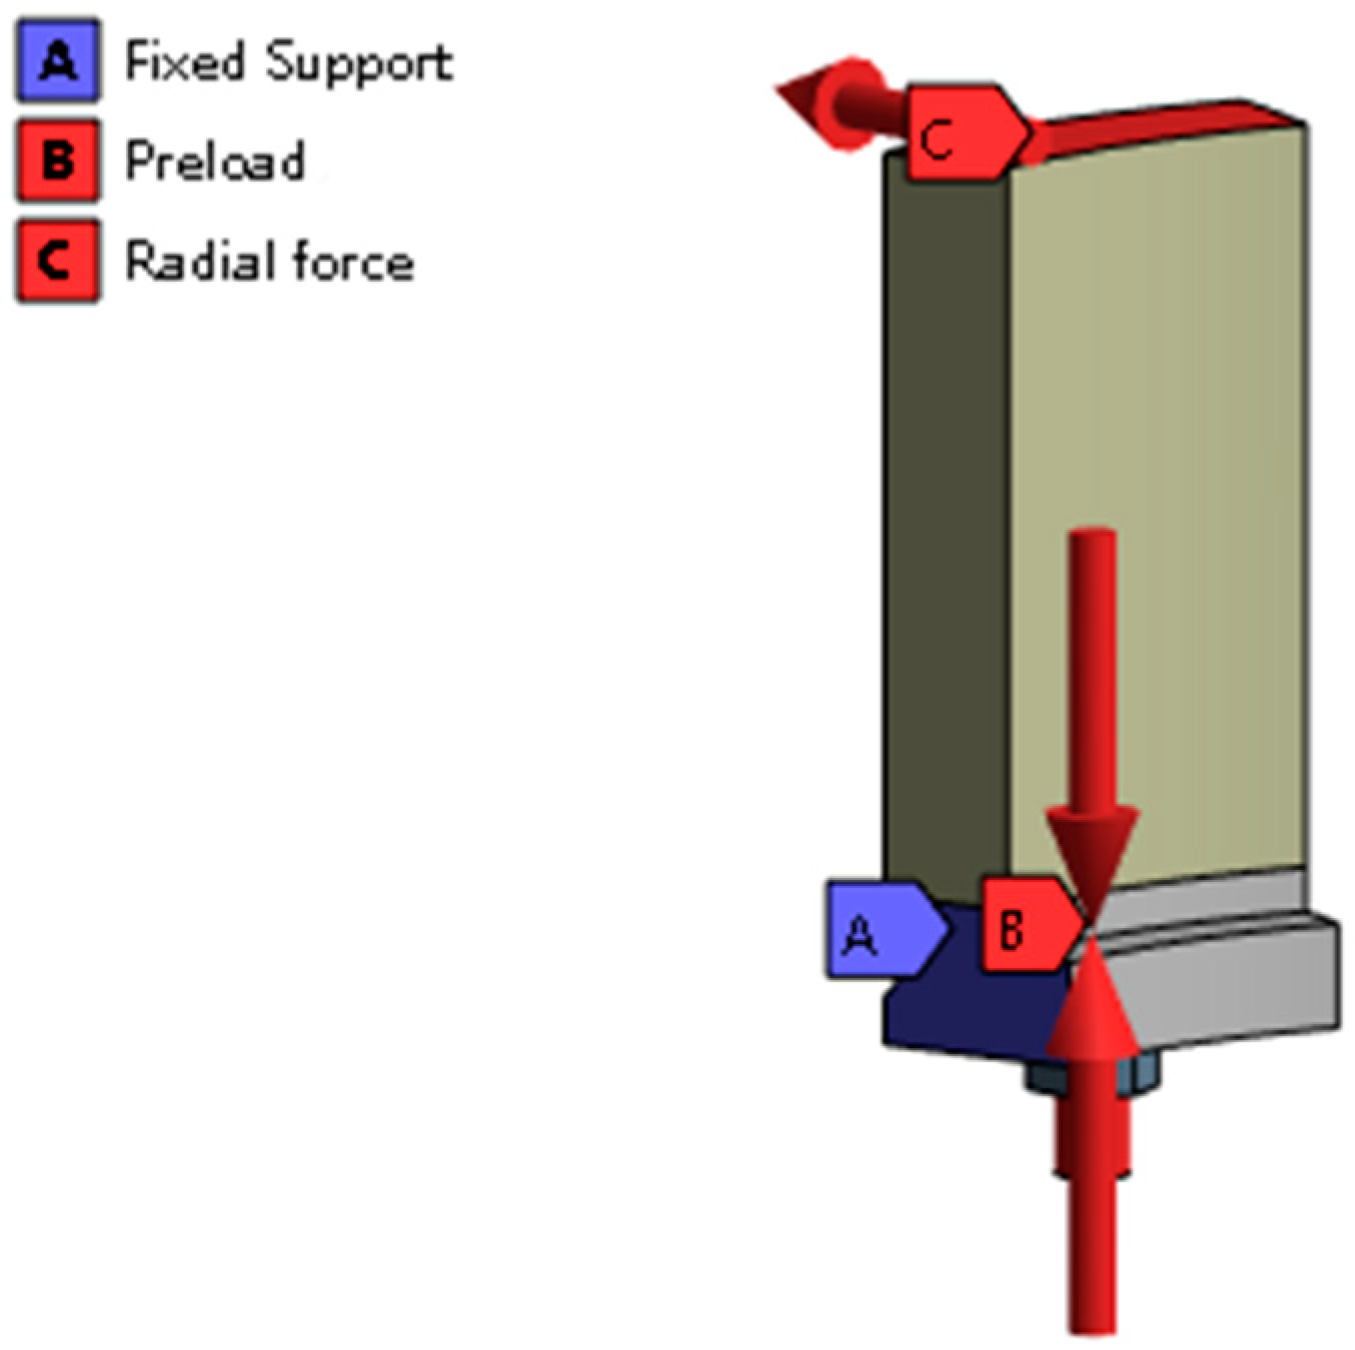
2.4. Boundary Load Condition
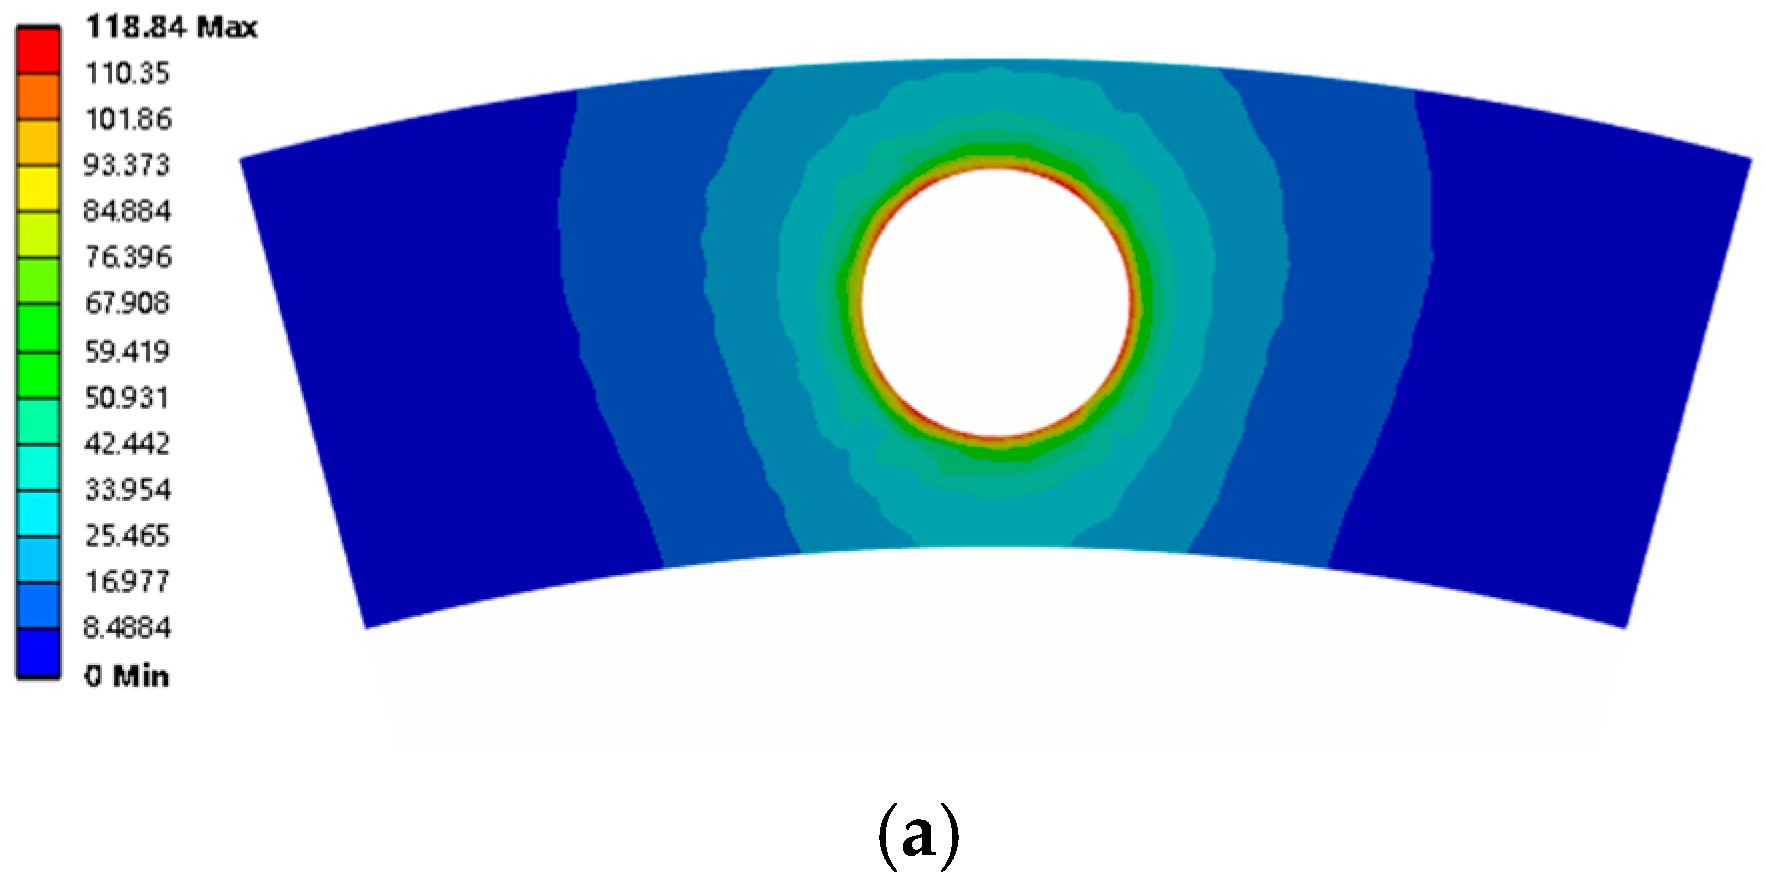
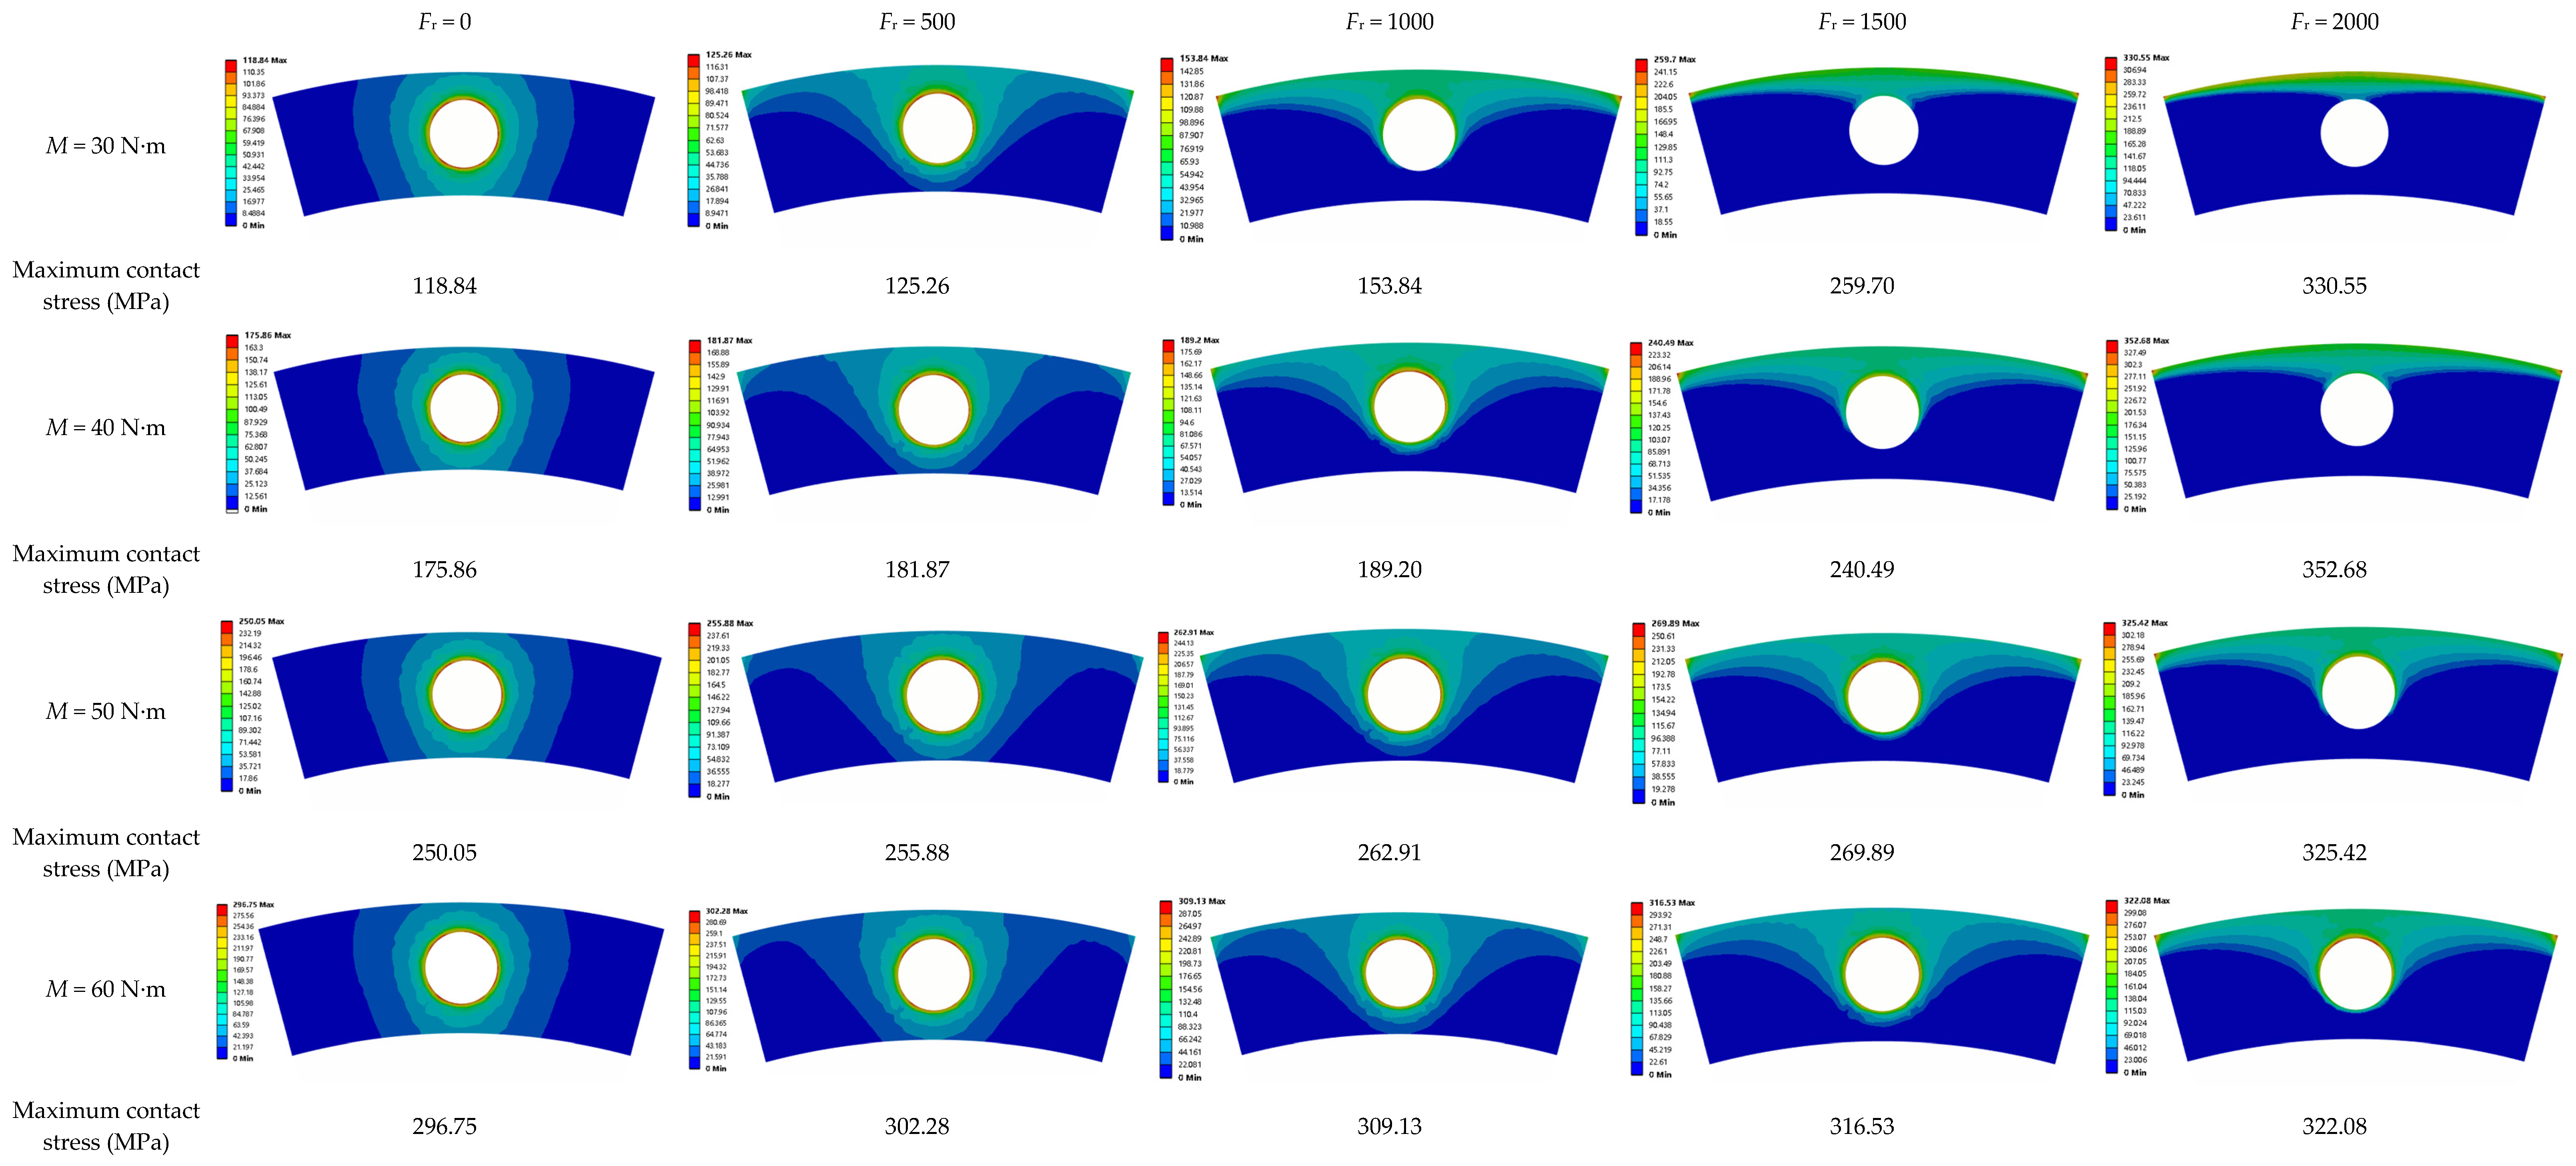
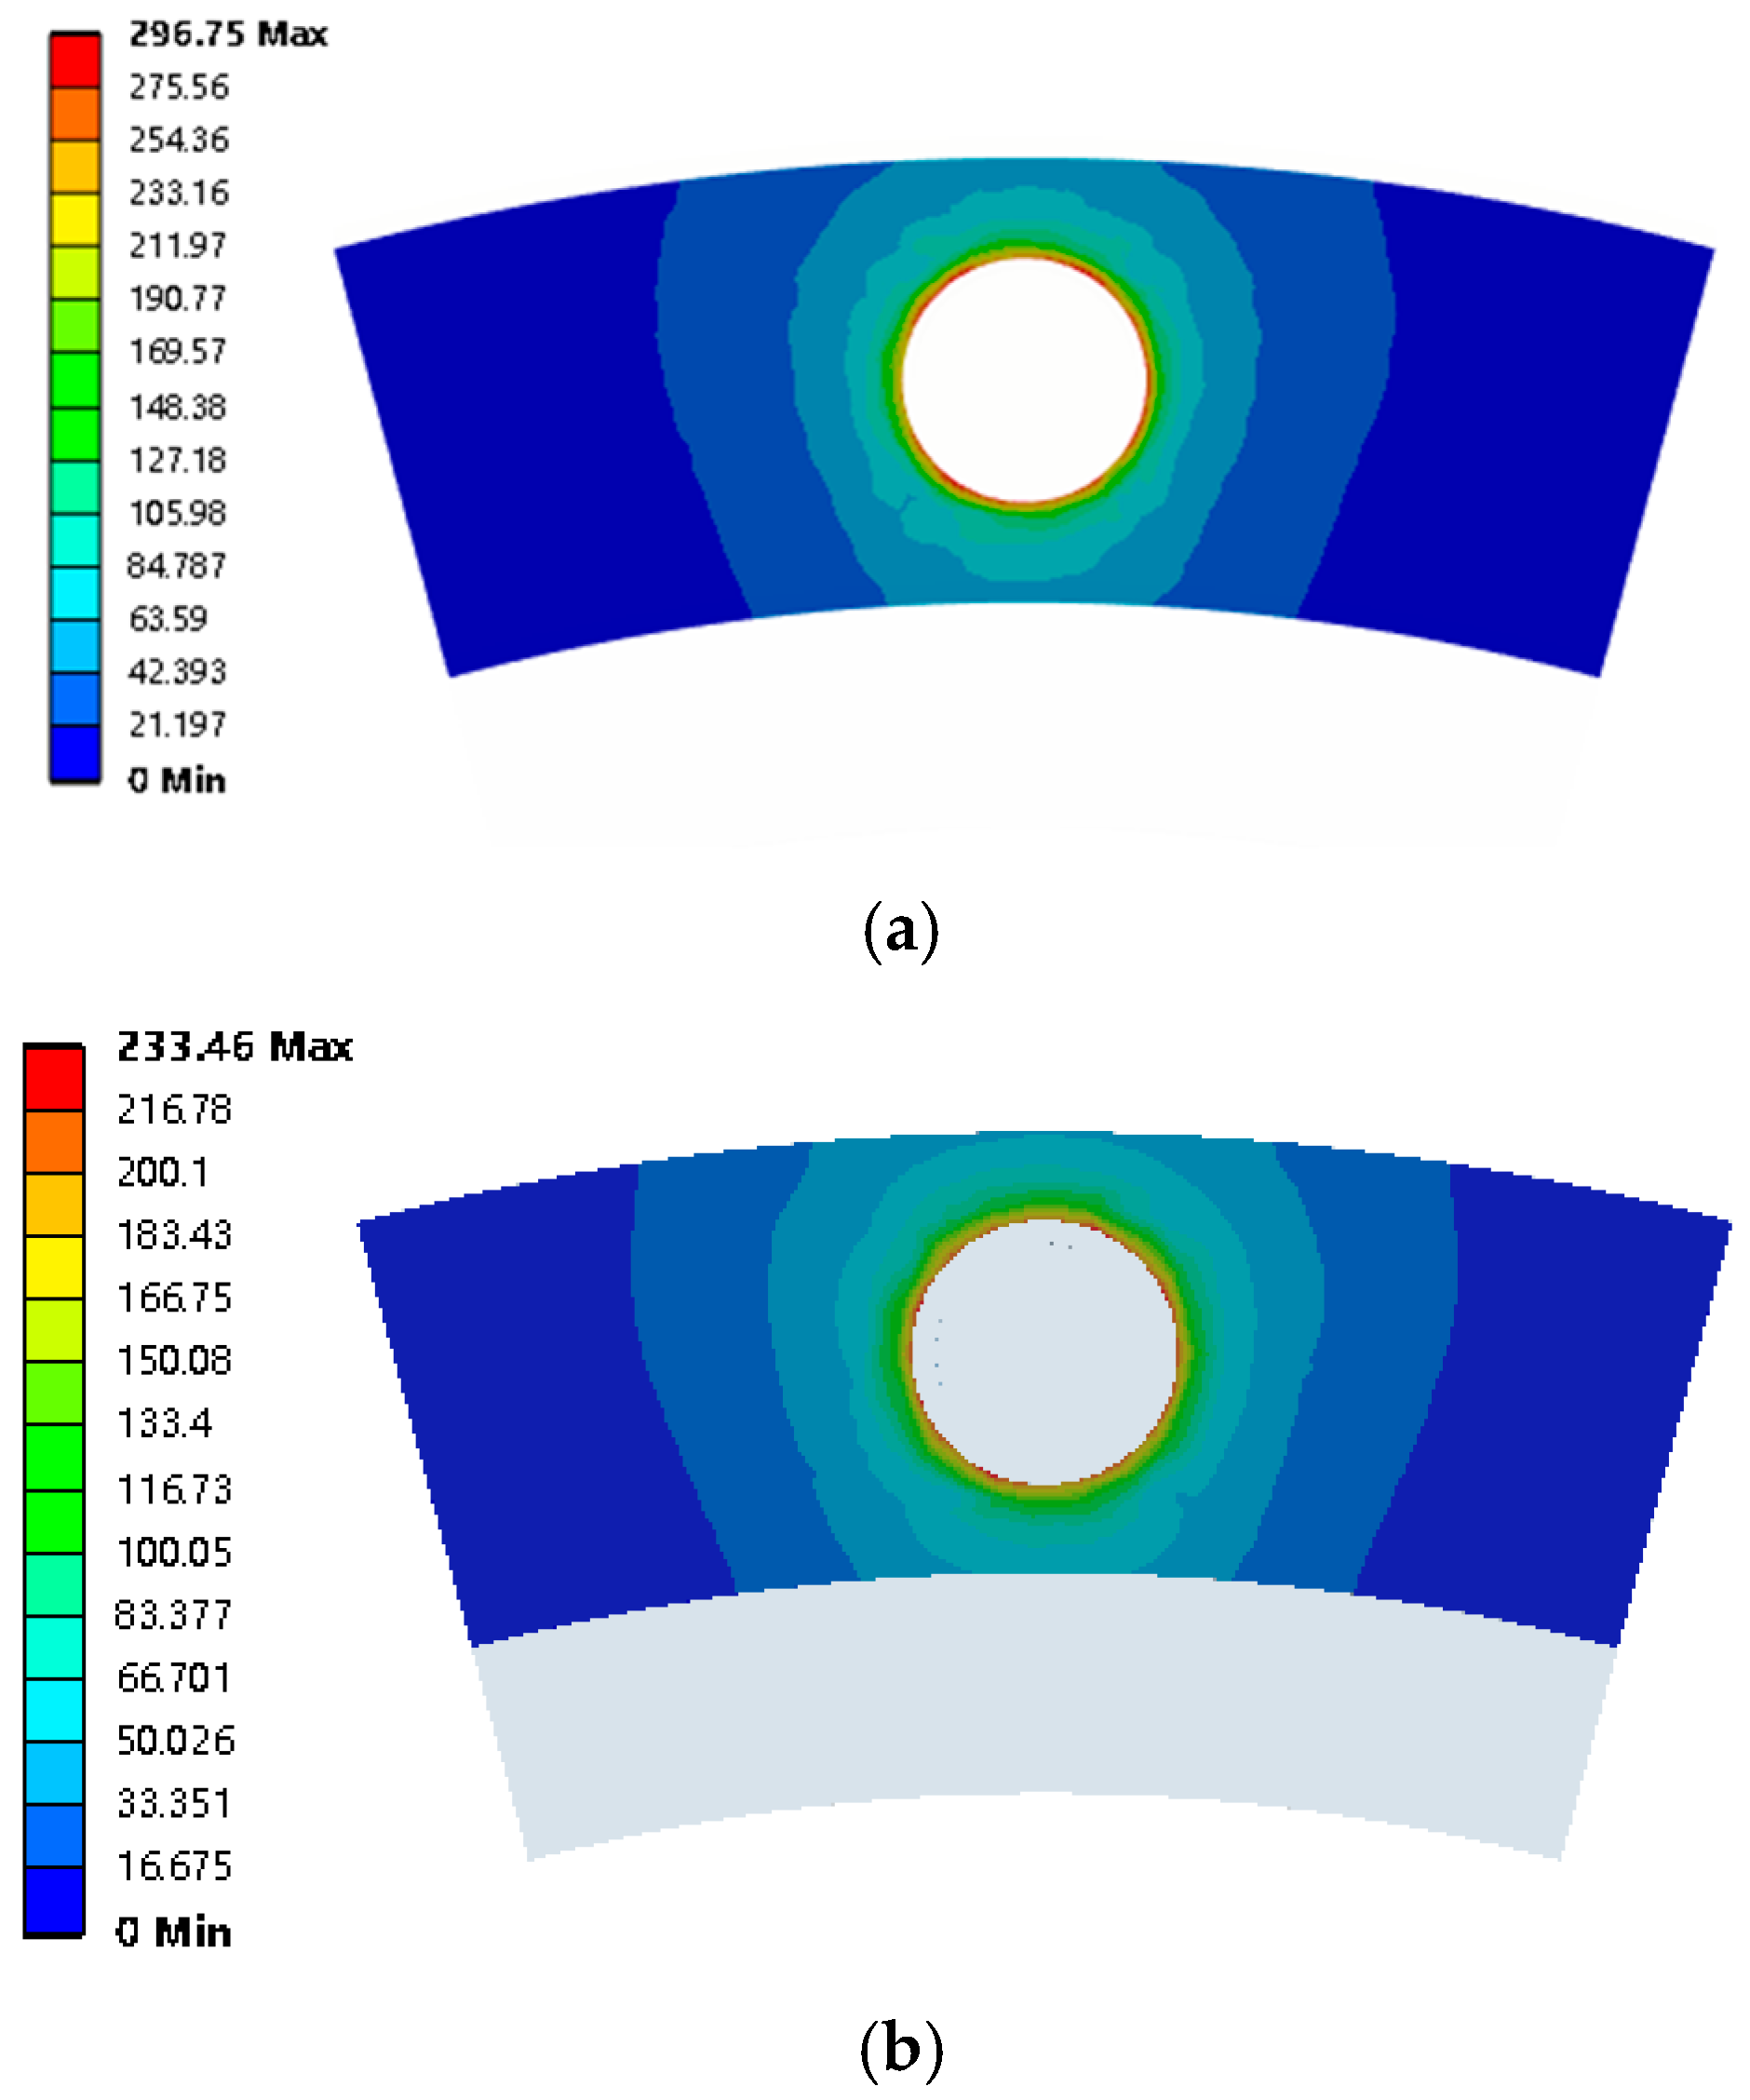
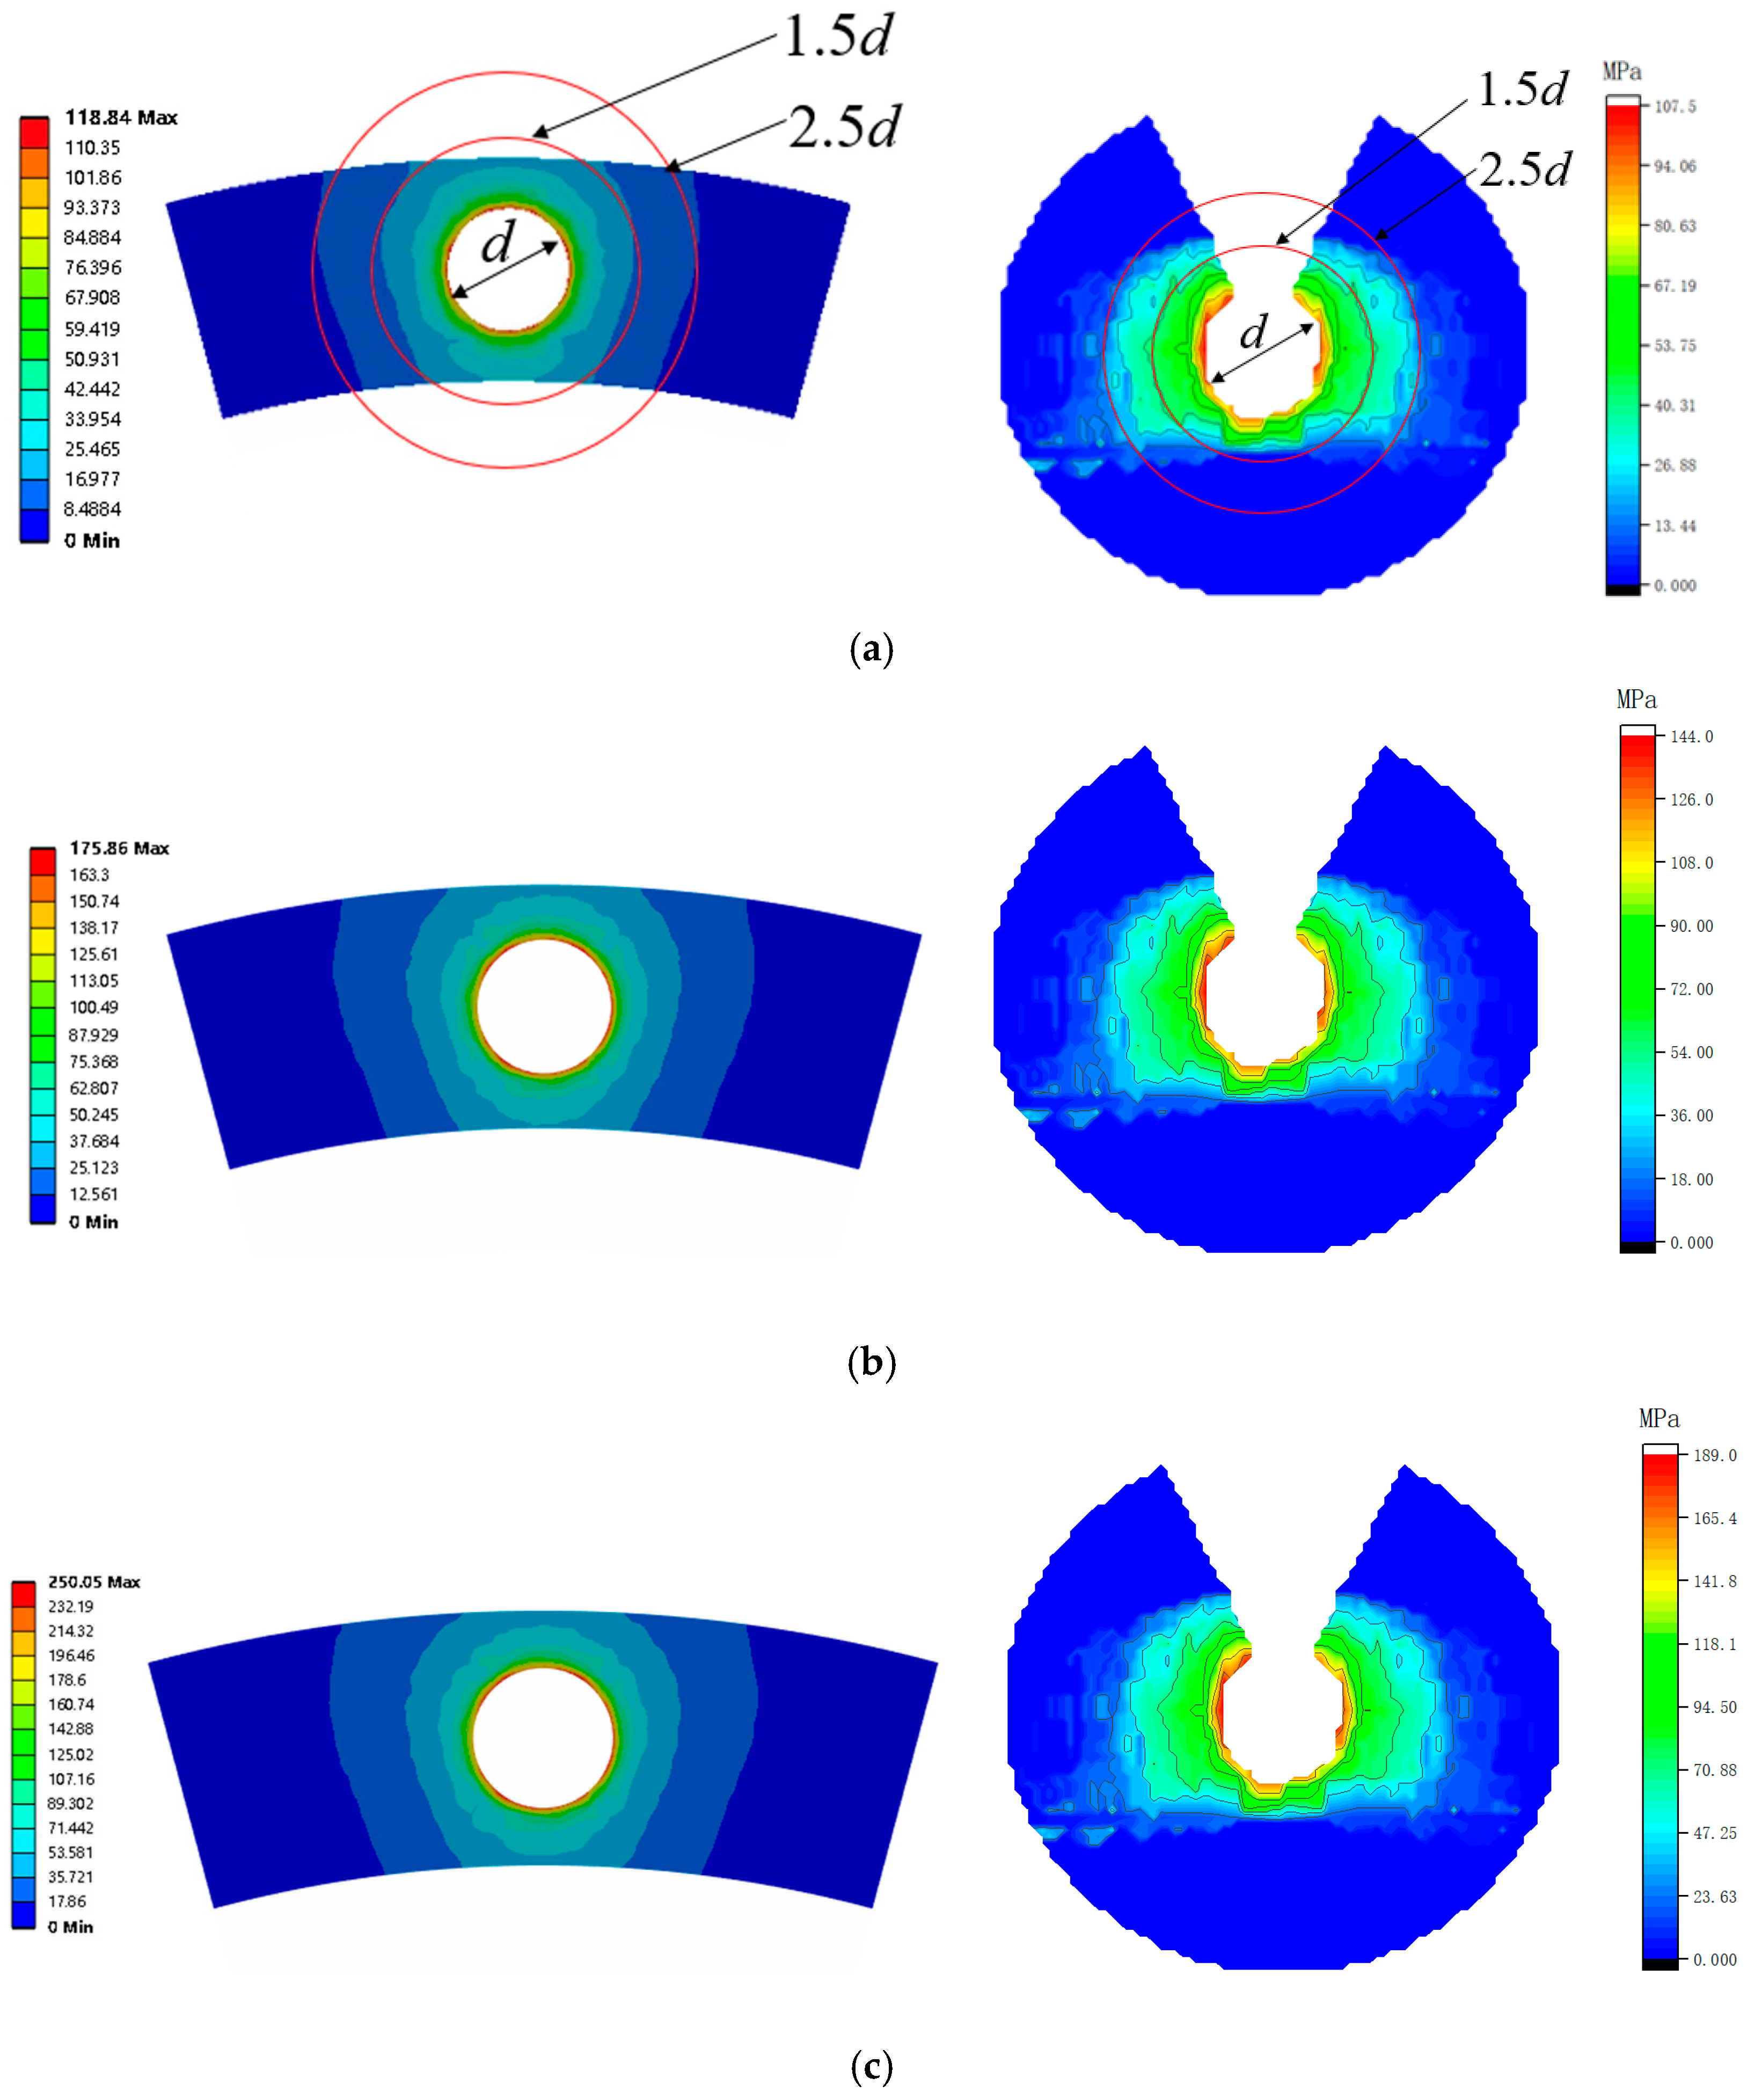
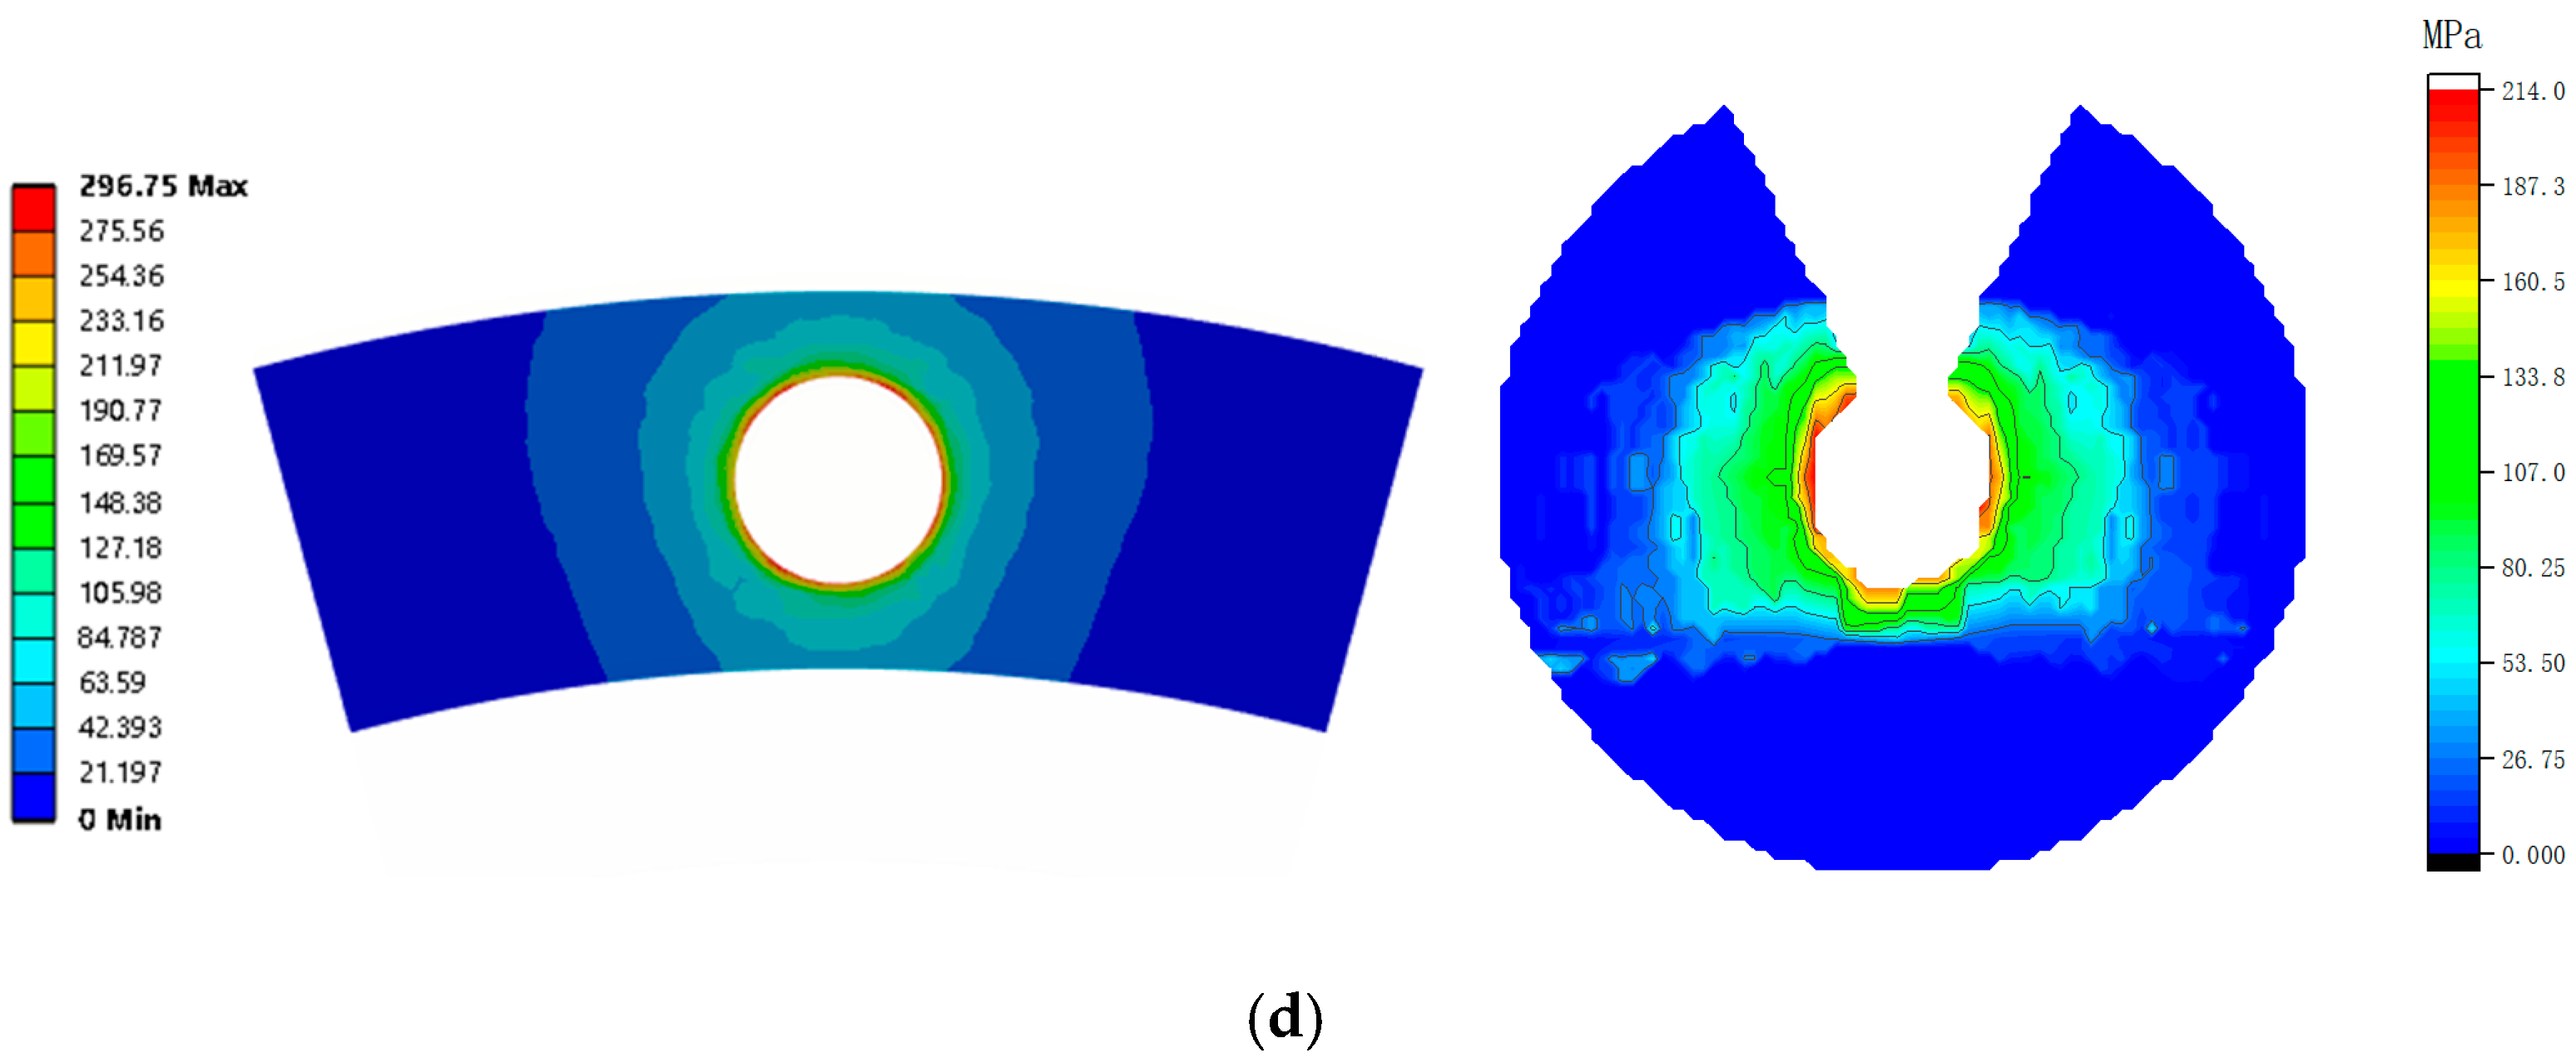
2.5. Contact Stress Analysis
3. Experimental Study of Contact Stress Distribution for Bolt Specimens Based on Thin-Film Pressure Sensors
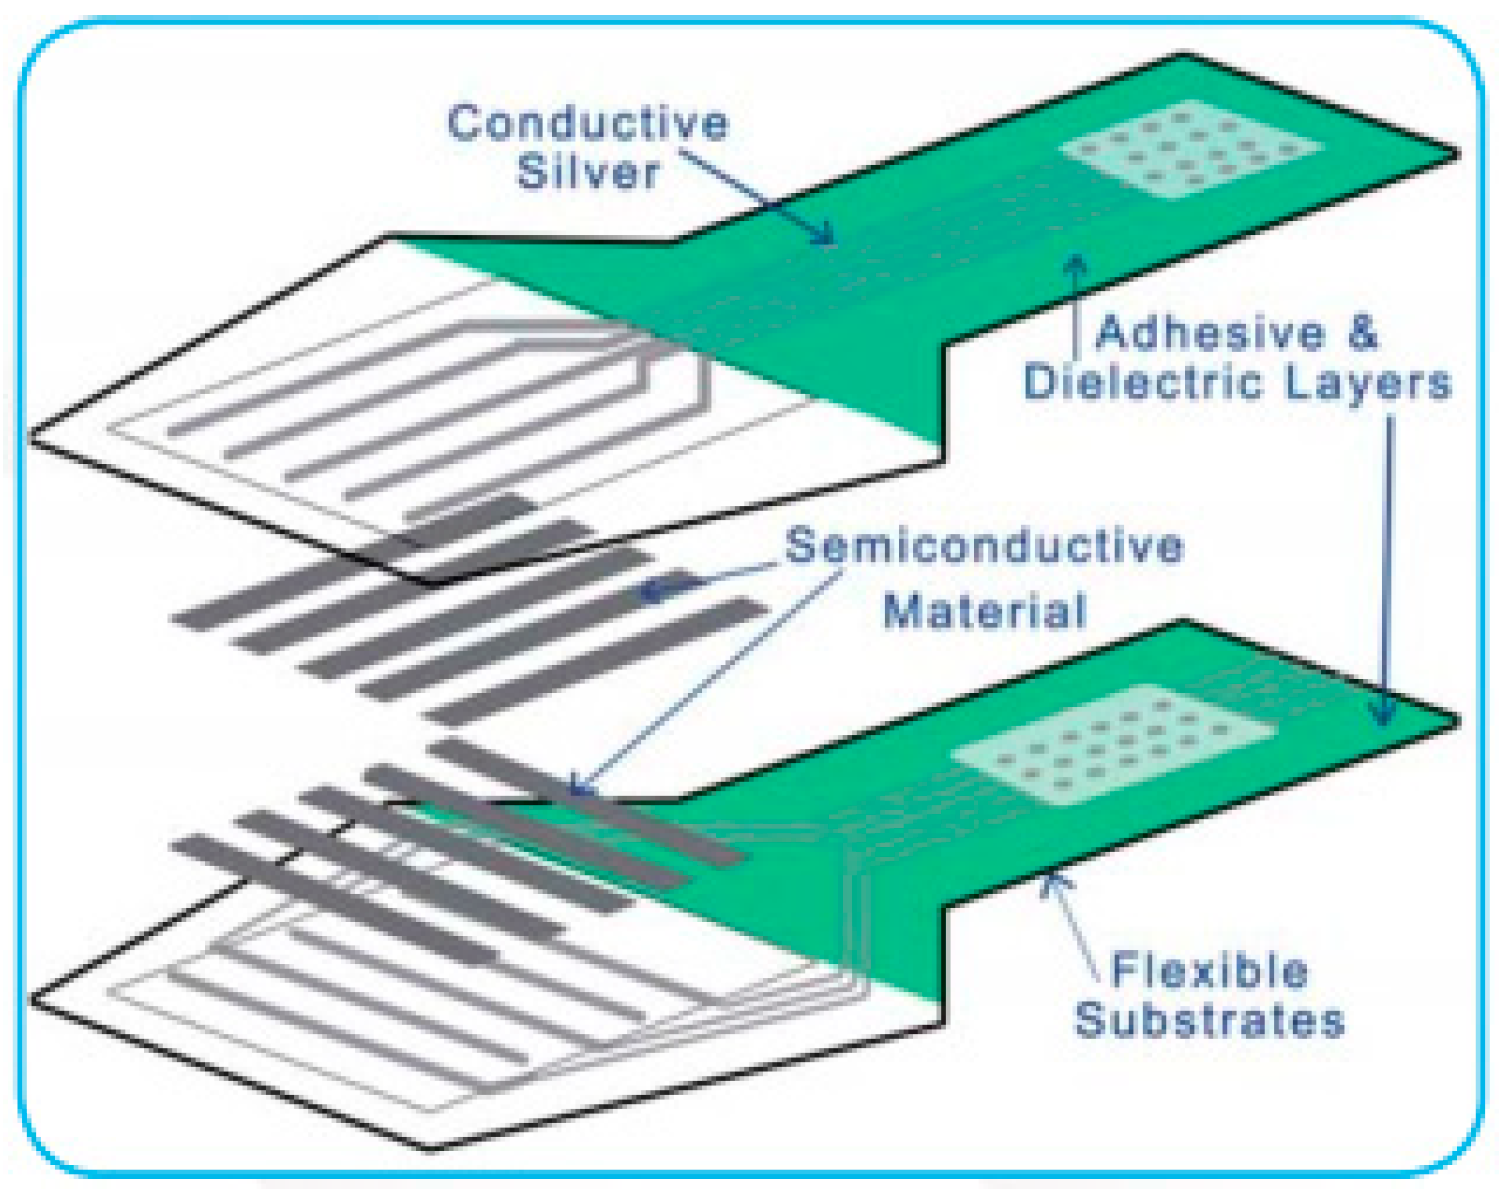
3.1. Experimental Principle
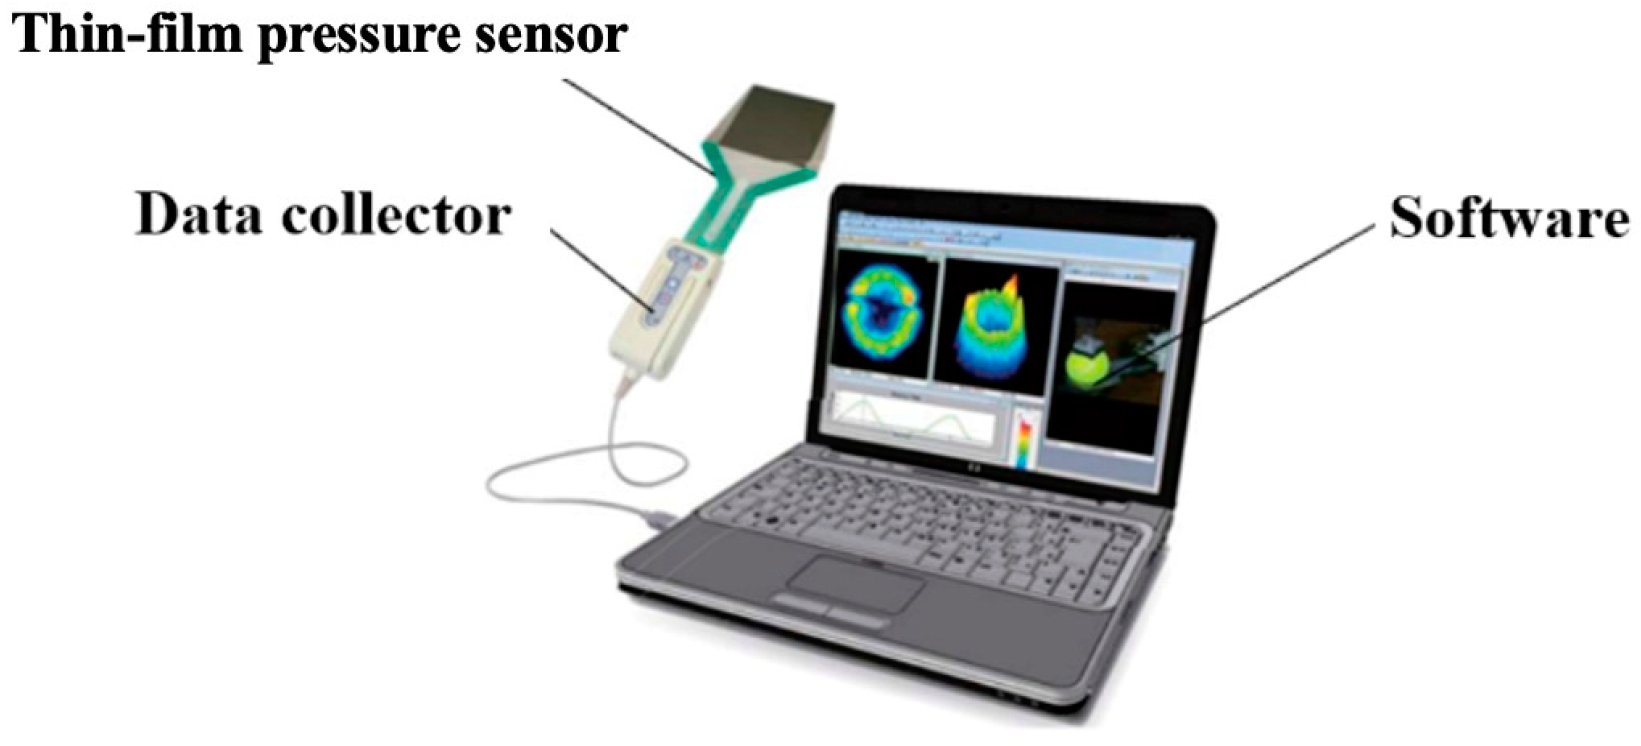
3.2. Experimental System
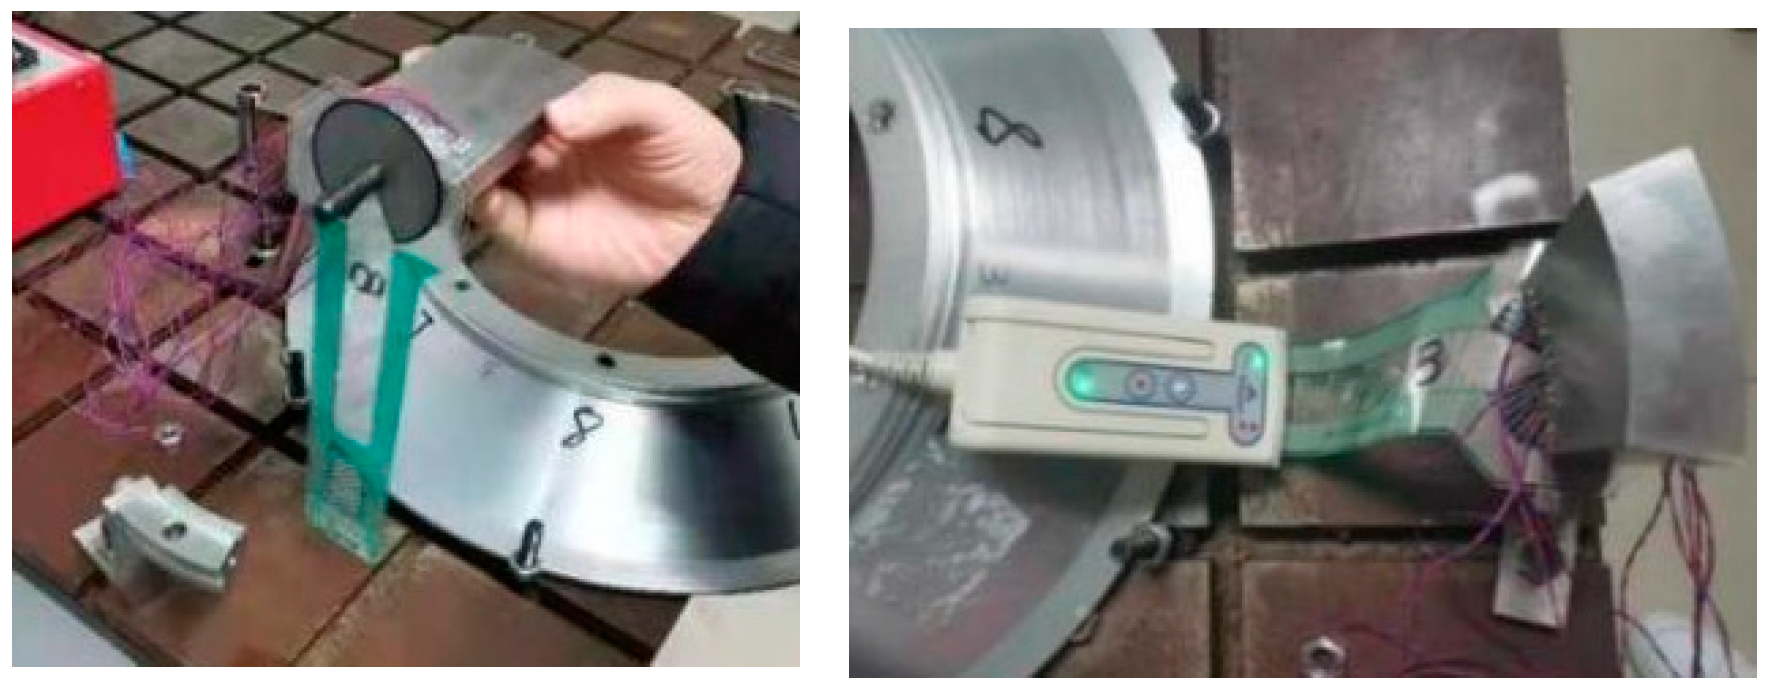
3.3. Experimental Procedure
3.4. Analysis of Experimental Results
4. Experimental Study of Stress Distribution in Bolt Assembly
4.1. Experimental System Construction
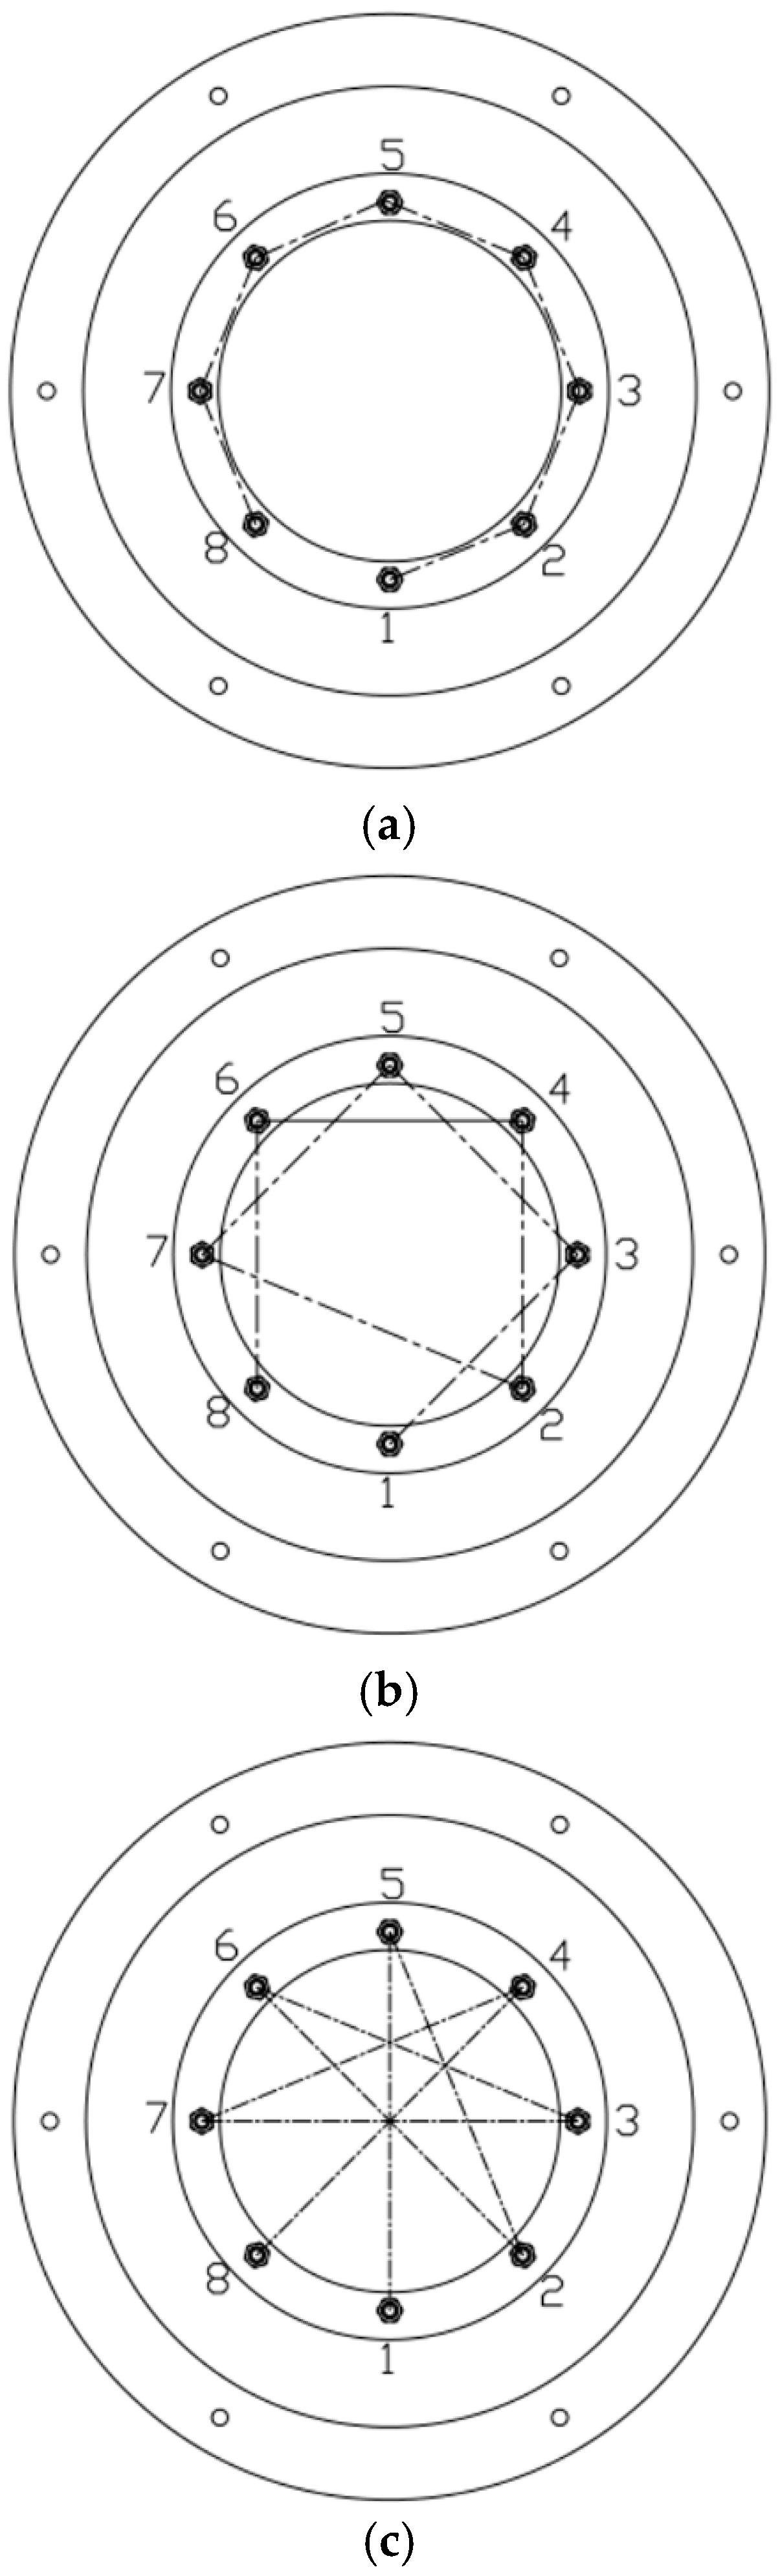
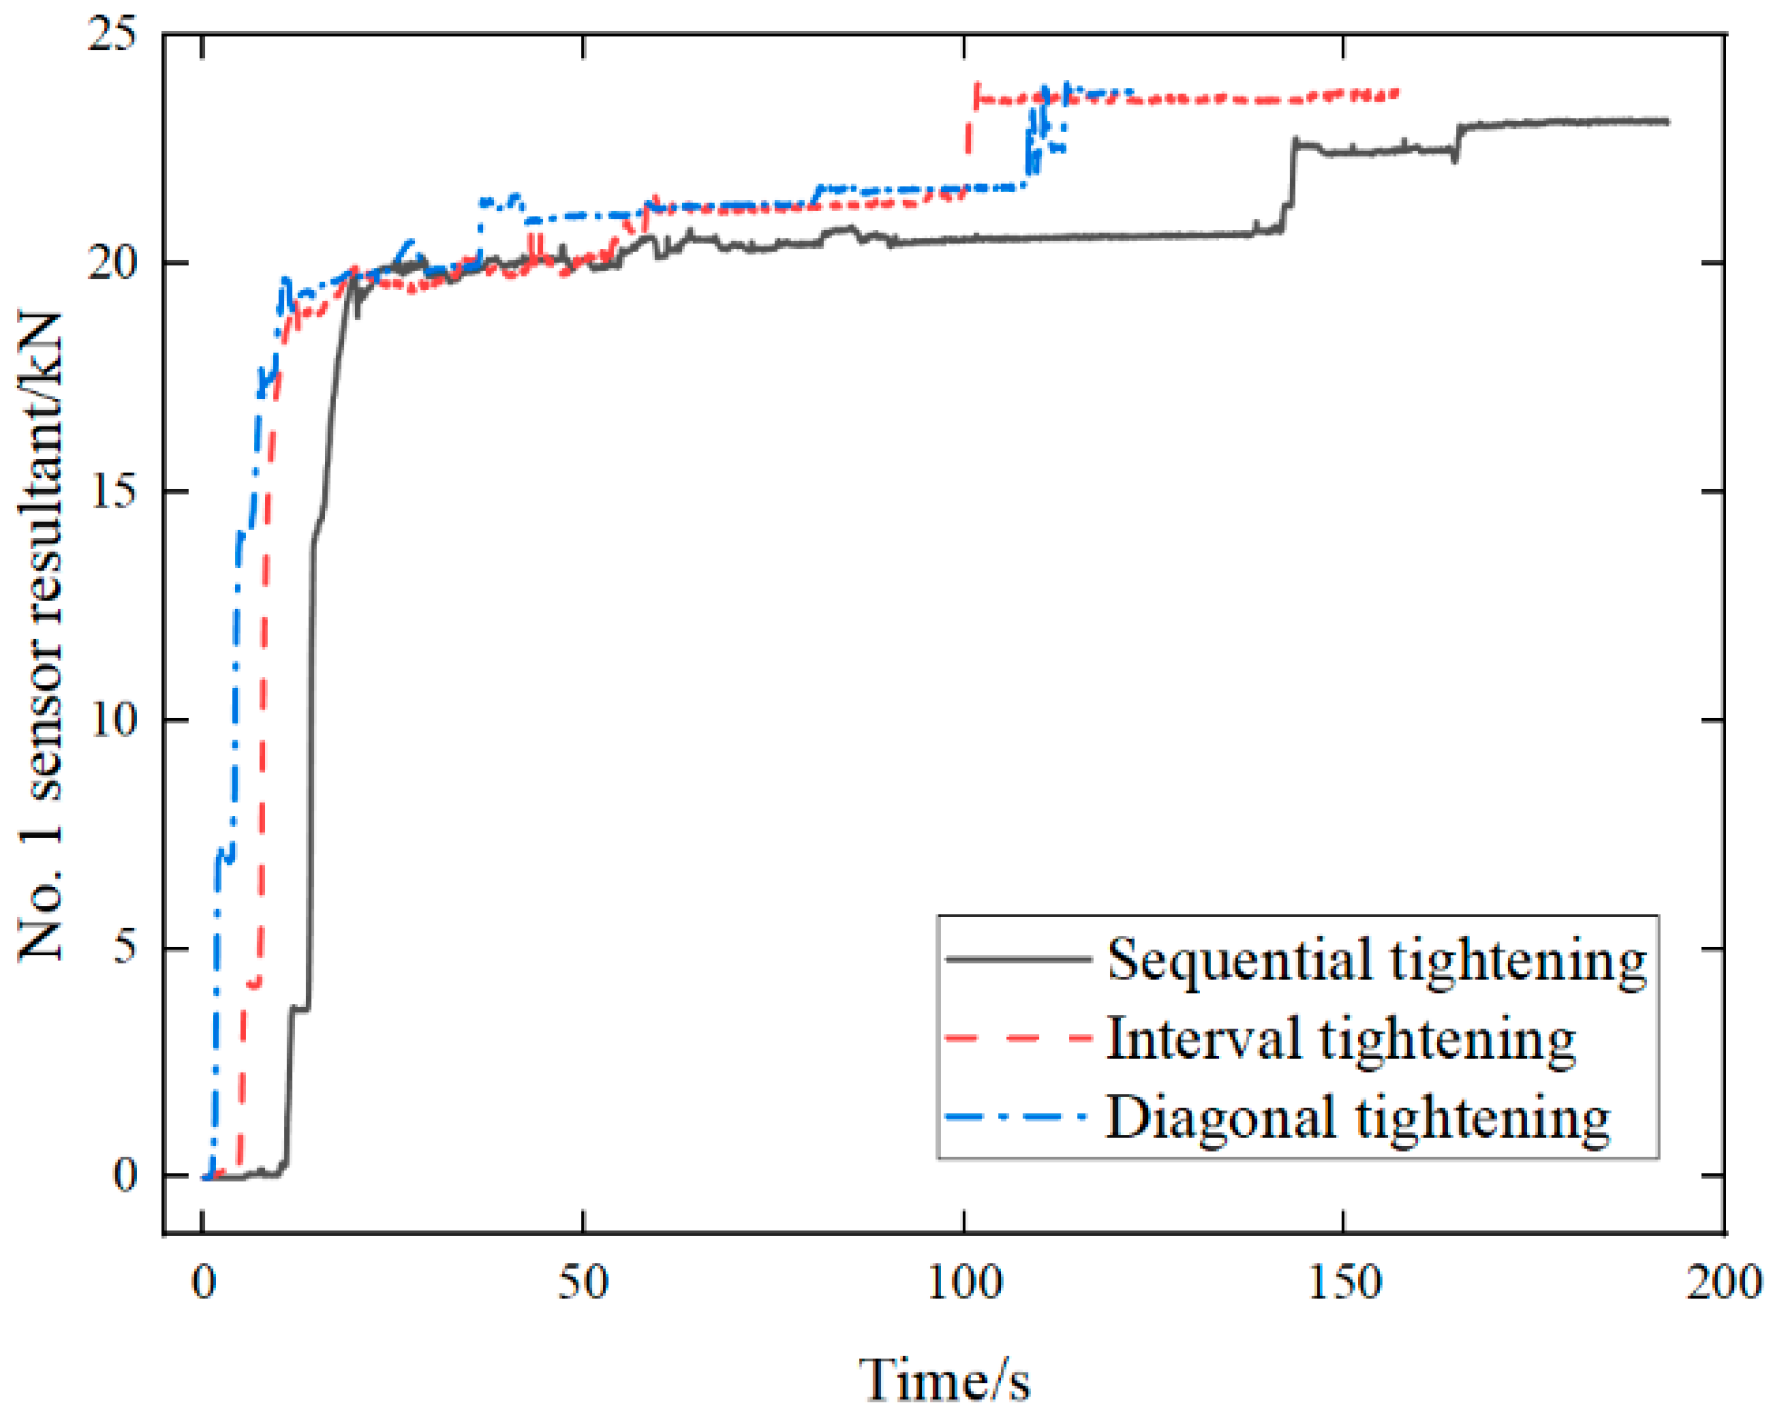
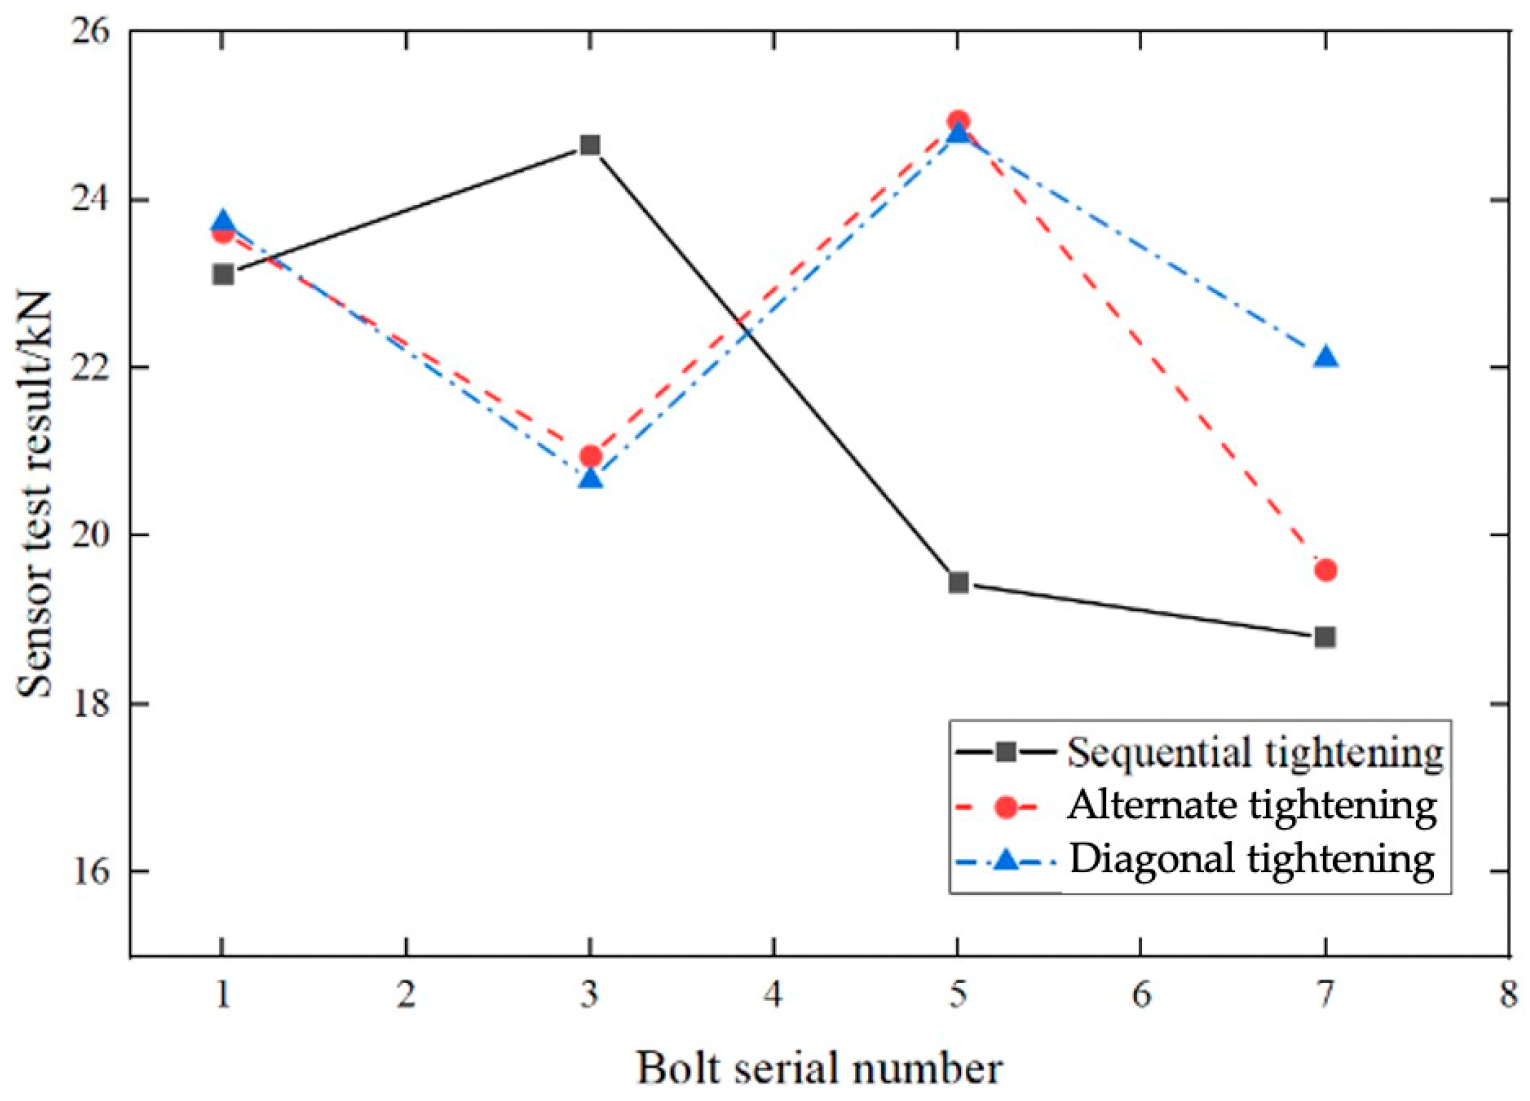
4.2. Influence of Tightening Process on Contact Stress Distribution
5. Conclusions
- (1)
- This study utilized numerical simulation to calculate the contact stress distribution of bolted connections according to the pitch bearing and blade of wind turbines. Additionally, the experiments of contact stress for the bolt specimen and bolt assembly were respectively designed based on a thin-film pressure sensor that could obtain the stress distribution pattern on the contact surface.
- (2)
- The results were compared and analyzed for numerical simulations and experiments. The preload was positively correlated with the maximum contact stress. The contact stress was symmetrically distributed around the bolt hole and decreased radially in a circular pattern. The contact stress decreased rapidly within 1.5 d and became negligible beyond 2.5 d. The magnitude of the preload force affected the contact stress magnitude but not its distribution range, whereas radial load affected the contact stress area.
- (3)
- The effects of different tightening methods on the test model of the bolt assembly were studied according to the experimental results. The contact stress distribution of bolted assemblies was obtained. These findings validate the advantages of diagonal tightening and provide a reliable tightening process for bolted assemblies in engineering applications.
Author Contributions
Funding
Data Availability Statement
Acknowledgments
Conflicts of Interest
References
- He, L.; Hao, L.; Qiao, W. Remote monitoring and diagnostics of pitch-bearing defects in an mw-scale wind turbine using pitch symmetrical-component analysis. IEEE Trans. Ind. Appl. 2021, 57, 3252–3261. [Google Scholar] [CrossRef]
- Chen, J.; Wang, Y.; Feng, Y. Design method of presented anchor bolt system for wind turbine foundation. Struct. Des. Tall Spec. Build. 2024, 33, e2153. [Google Scholar] [CrossRef]
- He, M.; Li, Z.; Ma, R.; Huang, D.; Liu, K.; Pei, Z. Experimental investigation and on—Site measurement of reverse—Balanced flange connections in wind turbine towers. Adv. Struct. Eng. 2015, 18, 1215–1225. [Google Scholar] [CrossRef]
- Yu, Q.; Bauwens, M.F.; Zhang, C.; Lichtenberger, A.W.; Weikle, R.M.; Barker, N.S. Improved micromachined terahertz on-wafer probe using integrated strain sensor. IEEE Trans. Microw. Theory Tech. 2013, 61, 4613–4620. [Google Scholar] [CrossRef]
- Tieu, A.; Liu, Y. Friction variation in the cold-rolling process. Tribol. Int. 2004, 37, 177–183. [Google Scholar] [CrossRef]
- Luks, T.; Horský, J.; Nilsson, A.; Jonsson, N.G.; Lagergren, J. Contact stress distribution and roll surface temperatures in the roll gap analyzed with different sensors. Metall. Ital. 2014, 106, 19–25. [Google Scholar]
- Mills, B.; Javadi, Y.; Abad, F.; Lotfian, S.; MacLeod, C.; Mehmanparast, A.; Pierce, G.; Gachagan, A. Inspection of wind turbine bolted connections using the ultrasonic phased array system. Heliyon 2024, 10, e34579. [Google Scholar] [CrossRef] [PubMed]
- Deters, C.; Lam, H.; Secco, E.; Wurdemann, H. Accurate bolt tightening using model-free fuzzy control for wind turbine hub bearing assembly. IEEE Trans. Control Syst. Technol. 2015, 23, 1–12. [Google Scholar] [CrossRef]
- Pan, Q.; Pan, R.; Shao, C.; Chang, M.; Xu, X. Research review of principles and methods for ultrasonic measurement of axial stress in bolts. Chin. J. Mech. Eng. 2020, 33, 11. [Google Scholar] [CrossRef]
- Wu, Z.; Yang, W.; Song, X.; Wei, K. Study on condition monitoring of pitch bearing based on stress measurement. Machines 2024, 12, 154. [Google Scholar] [CrossRef]
- Wang, S.; Du, J.; Chen, Y.; Wu, S.; Huang, Z. Influence of elliptical truncation on the raceway in a four-point contact pitching bearing. Eng. Fail. Anal. 2022, 141, 106711. [Google Scholar] [CrossRef]
- Xiao, J.; Wang, Y.; Zhang, D.; Zhang, X.; Guo, J. Testing of contact stress at ballast bed-soil subgrade interface under cyclic loading using the thin-film pressure sensor. J. Test. Eval. 2020, 48, 2104–2117. [Google Scholar] [CrossRef]
- Gutierrez-Rivera, M.; Jauregui-Vazquez, D.; Sierra-Hernandez, J.; Garcia-Mina, D.; Lopez-Dieguez, Y.; Estudillo-Ayala, J.; Rojas-Laguna, R. Low-pressure fiber-optic sensor by polyester Fabry-Perot cavity and its phase signal processing analysis. Sens. Actuators A Phys. 2020, 315, 112338. [Google Scholar] [CrossRef]
- Bian, D.; Sun, Y.; Wei, Z.; Chen, C.; Zhou, J.; Shao, C. Time-dependent leakage rate prediction method for bolted flange connection based on equivalent stress-temperature. Proc. Inst. Mech. Eng. Part E-J. Process Mech. Eng. 2024, 1–11. [Google Scholar] [CrossRef]
- Reszka, P.; Kania, L.; Pytlarz, R. Numerical analysis of the screw connection with preload tension used in the mounting of slewing bearings. J. KONES Powertrain Transp. 2012, 19, 465–472. [Google Scholar] [CrossRef]
- Qiu, M.; Yan, J.; Zhao, B.; Chen, L.; Bai, Y. A finite-element analysis of the connecting bolts of slewing bearings based on the orthogonal method. J. Mech. Sci. Technol. 2012, 26, 883–887. [Google Scholar] [CrossRef]
- Gong, H.; Ding, X.; Liu, J.; Feng, H. Review of research on loosening of threaded fasteners. Friction 2022, 10, 335–359. [Google Scholar] [CrossRef]
- Fukuoka, T.; Nomura, M. Proposition of helical thread modeling with accurate geometry and finite element analysis. Trans. ASME 2008, 130, 135–140. [Google Scholar] [CrossRef]
- Liu, M.; Geng, R.; Wang, J.; Li, Y.; Long, K.; Ding, W.; Zhou, Y. The investigation of various flange gaps on wind turbine tower bolt fatigue using finite-element method. Appl. Sci. 2024, 14, 3670. [Google Scholar] [CrossRef]
- Chang, Y.; Ding, J.; Fan, H.; Ding, Y.; Lu, H.; Chen, Y.; Shehzad, A.; Zhuang, H.; Chen, P. A hybrid method for bolted joint modeling considering multi-scale contact mechanics. Precis. Eng. 2022, 78, 171–188. [Google Scholar] [CrossRef]
- Zhang, H.; Chen, T.; Ji, K.; Zhu, M.; Ju, C. Study on preload of bolted connections in pitch bearing based on vibration modal analysis. Shock Vib. 2023, 2023, 6653564. [Google Scholar] [CrossRef]
- ASME PCC-1-2019; The American Society of Mechanical Engineers Guidelines for Pressure Boundary Bolted Flange Joint Assembly. An American National Standard; ASME: New York, NY, USA, 2019.


| Material | Modulus of Elasticity (GPa) | Poisson’s Ratio | Yield Strength (MPa) | Ultimate Strength (MPa) |
|---|---|---|---|---|
| Bearing inner ring | 210 | 0.3 | 930 | 1080 |
| Blade | 72 | 0.26 | — | 1173 |
| Bolt | 206 | 0.3 | 720 | 1080 |
| T (N·m) | F0 (N) |
|---|---|
| 5 | 2272.7 |
| 10 | 4545.5 |
| 20 | 9090.9 |
| 30 | 13,636.4 |
| 40 | 18,181.8 |
| 50 | 22,727.3 |
| 60 | 27,272.7 |
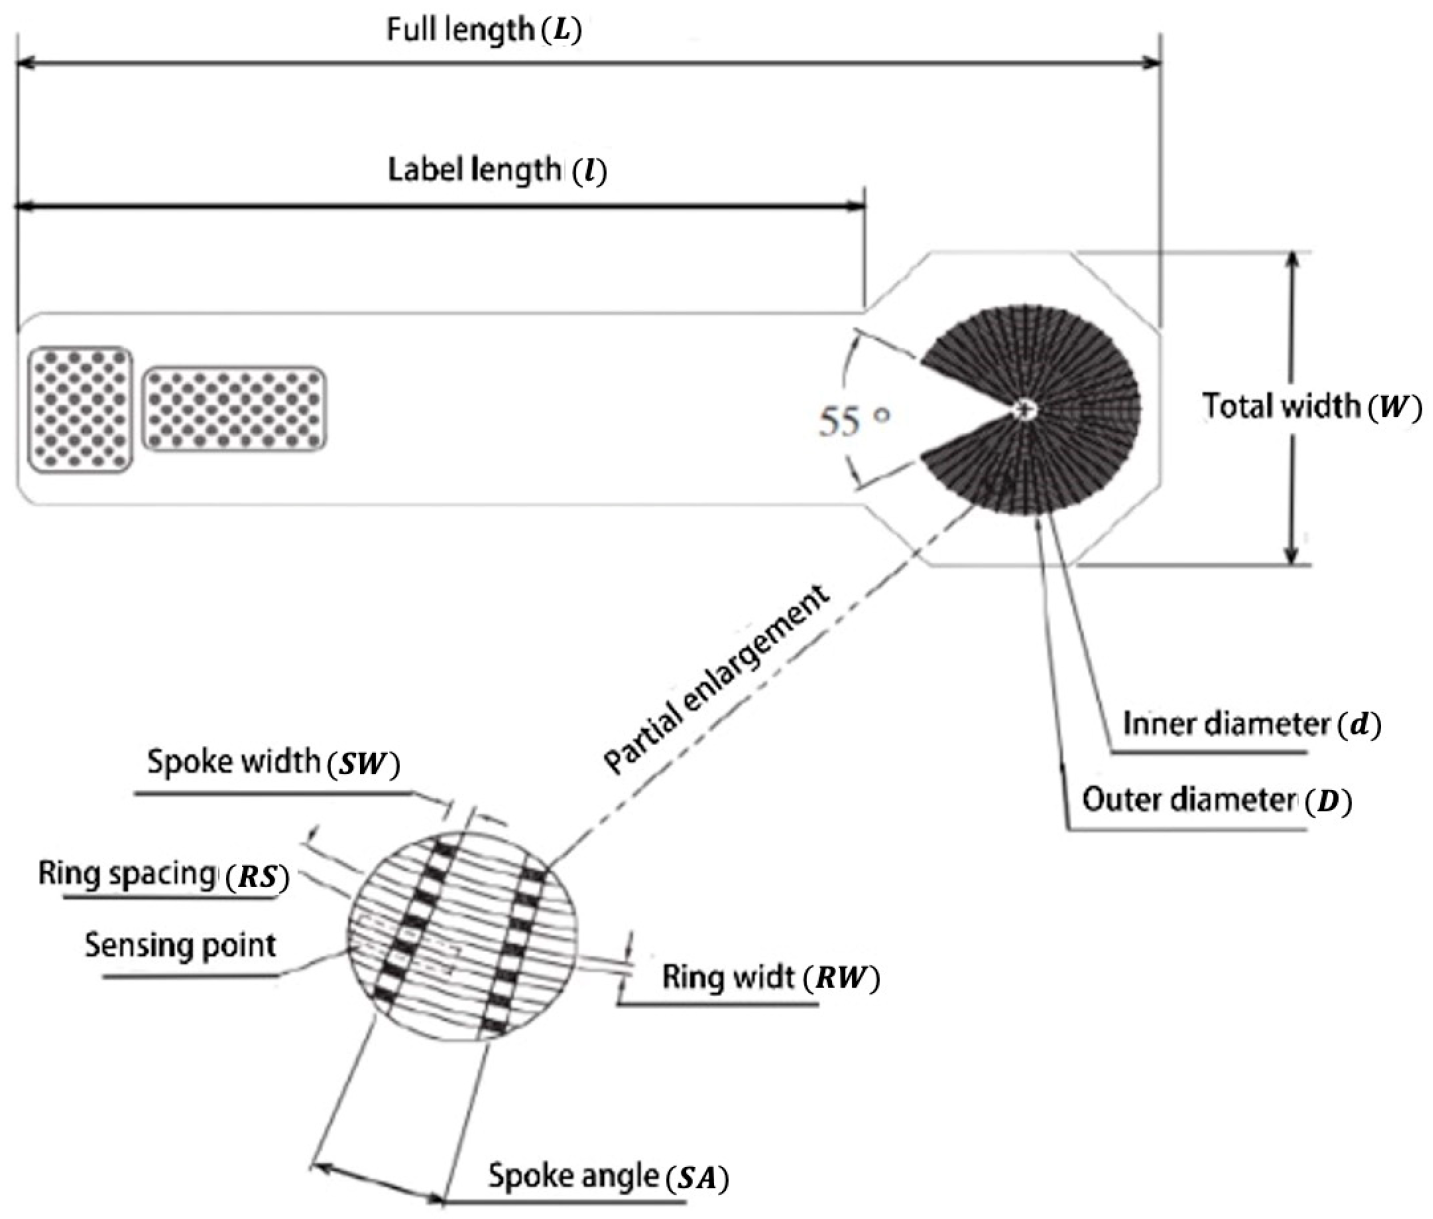
| L (mm) | W (mm) | l (mm) | d (mm) | D (mm) | SW (mm) | RW (mm) | RS (mm) | SA (deg) | Sensing Point | Pressure Range (kPa) |
|---|---|---|---|---|---|---|---|---|---|---|
| 254 | 76.6 | 189.8 | 10 | 50.8 | 0.5 | 0.3 | 0.6 | 6.9 | 1235 | 0~226,850 |
| Bolt Number | Sequential Tightening | Alternate Tightening | Diagonal Tightening |
|---|---|---|---|
| 1 | 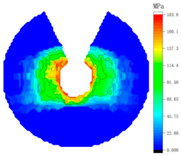 |  | 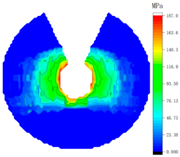 |
| 3 |  |  | 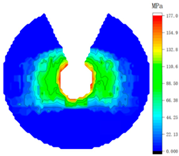 |
| 5 |  | 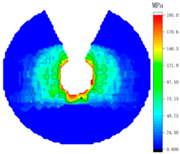 |  |
| 7 | 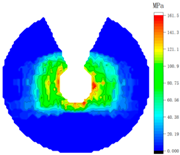 |  | 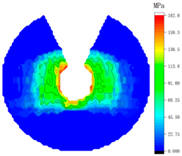 |
Disclaimer/Publisher’s Note: The statements, opinions and data contained in all publications are solely those of the individual author(s) and contributor(s) and not of MDPI and/or the editor(s). MDPI and/or the editor(s) disclaim responsibility for any injury to people or property resulting from any ideas, methods, instructions or products referred to in the content. |
© 2025 by the authors. Licensee MDPI, Basel, Switzerland. This article is an open access article distributed under the terms and conditions of the Creative Commons Attribution (CC BY) license (https://creativecommons.org/licenses/by/4.0/).
Share and Cite
Zhang, J.; Luo, W.; Chen, T.; Yan, X.; Zhang, J.; Zhu, M.; Zhang, H. Analysis and Experimental Study of Contact Stress in Bolted Connections of Pitch Bearings. Lubricants 2025, 13, 129. https://doi.org/10.3390/lubricants13030129
Zhang J, Luo W, Chen T, Yan X, Zhang J, Zhu M, Zhang H. Analysis and Experimental Study of Contact Stress in Bolted Connections of Pitch Bearings. Lubricants. 2025; 13(3):129. https://doi.org/10.3390/lubricants13030129
Chicago/Turabian StyleZhang, Jiuju, Wanxin Luo, Tao Chen, Xichao Yan, Jiaqi Zhang, Meng Zhu, and Hongwei Zhang. 2025. "Analysis and Experimental Study of Contact Stress in Bolted Connections of Pitch Bearings" Lubricants 13, no. 3: 129. https://doi.org/10.3390/lubricants13030129
APA StyleZhang, J., Luo, W., Chen, T., Yan, X., Zhang, J., Zhu, M., & Zhang, H. (2025). Analysis and Experimental Study of Contact Stress in Bolted Connections of Pitch Bearings. Lubricants, 13(3), 129. https://doi.org/10.3390/lubricants13030129