Abstract
Filtered cathodic vacuum arc (FCVA) deposition technology was applied to prepare tetrahedral amorphous carbon (taC) thin films with different substrate pulse biases. Their structure, adhesion strength, and corrosion behavior in 5 × 10⁻² M hydrochloric (HCl), sodium chloride (NaCl), calcium chloride (CaCl2), lead (II) chloride (PbCl2), and mercury (II) chloride (HgCl2) solutions were studied with respect to the substrate pulse bias. Increasing the substrate pulse bias from 0 to 1000 V increased the graphitization of the taC thin films and thereby resulted in a 9.9% increase in their adhesion strength from 406 mN to 446 mN. The taC thin films exhibited the lowest (8.48 × 10⁴ Ω to 11.55 × 10⁴ Ω) and highest (146.89 × 10⁴ Ω to 387.44 × 10⁴ Ω) corrosion resistance in the PbCl2 and HgCl2 solutions, respectively, while they had higher corrosion in the HCl (62.07 × 10⁴ Ω to 131.73 × 10⁴ Ω) solution than in both the NaCl (143 × 104 Ω to 231.31 × 10⁴ Ω) and CaCl2 (102.13 × 10⁴ Ω to 351.92 × 10⁴ Ω) solutions. Nevertheless, the taC thin films with higher substrate pulse biases had lower corrosion resistance in all the solutions used in this study. The substrate pulse bias emerged as a significant parameter in the FCVA deposition process, playing a crucial role in influencing the structure, adhesion strength, and corrosion resistance of taC thin films.
1. Introduction
Diamond-like carbon (DLC) is a highly versatile thin film material extensively utilized across numerous industries, including the automotive and biomedical sectors, particularly for tribological purposes. This is attributed to its exceptional properties, such as superior hardness, low friction coefficient, high resistance to wear and corrosion, chemical inertness, significant electrical resistivity, and excellent biocompatibility, among others [1,2]. Despite these advantages, the insulating nature of DLC thin films limits their applicability in electrochemical sensor technologies [3].
The development of electrochemical sensors is relatively important to address one of the most important global environmental issues, which is heavy metal pollution in aqueous solutions, since heavy metals, such as mercury (Hg), lead (Pb), etc., are the most harmful water pollutants [4]. Human activities, such as overuse and mismanagement of water resources, waste disposals, etc., are the major causes of the release of heavy metals into the environment, which can cause adverse effects on living organisms since they are very toxic and carcinogenic. Heavy metals persist in the environment for extended periods, often lasting decades or even centuries, as they are not biodegradable. Consequently, detecting heavy metals in drinking water is crucial for accurately assessing water quality, especially given the increasing global demand for safe and clean water [5]. It is essential to develop fast and precise sensing techniques for heavy metal tracing in aqueous solutions. For these reasons, nowadays, high-corrosion-resistant N-DLC thin-film electrodes have been interested in tracing heavy metals in various aqueous solutions after they have been successfully made conductive with nitrogen (N) doping because the extra electrons of N atoms doped as effective electronic donors enhance their n-type semiconductivity, while their graphitization associated with N-doping narrows their band gaps [6,7,8,9,10].
Physical vapor deposition (PVD) technologies are widely used to produce N-DLC thin films by sputtering carbon (C) targets in an N-rich environment [8,9,10]. The FCVA deposition technology is one of the PVD technologies used for producing taC thin films with high sp3 contents [1,8,9,10,11]. The extensive presence of sp3 bonds in DLC thin films promotes the development of rigid, cross-linking networks formed by sp3 bonding. These networks contribute to the films’ exceptional resistance to anodic dissolution in corrosive environments, in addition to the insulating properties of the films, as well as high residual stress. The resulting high residual stress in the films significantly restricts their achievable thickness [1,12,13,14].
It is well-known that thin films always have a higher density of pores compared to thick films, which can lead to an easy anodic dissolution of their underlying substrates via permeation of an electrolyte [15]. At the same time, the undermining of their substrates allows a larger volume of a permeated electrolyte, which further accelerates the anodic dissolution of the film/substrate interfaces and substrates and eventually causes delamination of the films when associated with the poor adhesion strength of the films [16,17]. These corrosion processes can result in the degradation of the electrochemical performance of N-DLC thin-film electrodes, such as repeatability, sensitivity, stability, etc., and even in their earlier failure during electrochemical measurements [9,10]. As such, the electrochemical performance and durability of N-DLC thin-film electrodes are heavily influenced by their thickness and the strength of their adhesion, as well as their corrosion resistance [18].
The FCVA deposition technology can produce N-taC thin-film electrodes with a higher concentration of sp3 bonds than other magnetron sputtering techniques but their increased residual stress makes it challenging to achieve high thickness [1,19]. However, from the corrosion point of view, N-taC thin-film electrodes produced by the FCVA deposition technology exhibit better electrochemical performance, such as higher sensitivity to metal ions, wider electrochemical potential windows (EPW), lower background current, higher stability, longer service life, etc., than N-DLC ones fabricated by magnetron sputtering deposition technologies thanks to their higher sp3 contents for their higher corrosion resistance. In addition, N-taC thin-film electrodes have comparable electrochemical performance, such as high sensitivity to metal ions, wide EPWs, etc., to that of boron (B)-doped diamond film electrodes produced by chemical vapor deposition (CVD) technologies at high temperatures [10,20,21,22]. Moreover, N-taC thin-film electrodes can be fabricated at room temperature (RT), which is not possible for the synthesis of diamond film electrodes [20,21]. The use of higher fabrication temperatures demands higher energies and costs [20,21].
In general, N-doping enhances the adhesion strength of taC thin films by increasing the proportion of sp2 bonds and thereby reducing their sp3-bonded cross-linking networks [22]. Unfortunately, such degradation of their sp3-bonded cross-linking structures leads to their decreased corrosion resistance, which negatively affects their electrochemical performance [16,23]. Therefore, the corrosion of N-taC thin-film electrodes is one of the major factors affecting their electrochemical performance in aqueous solutions.
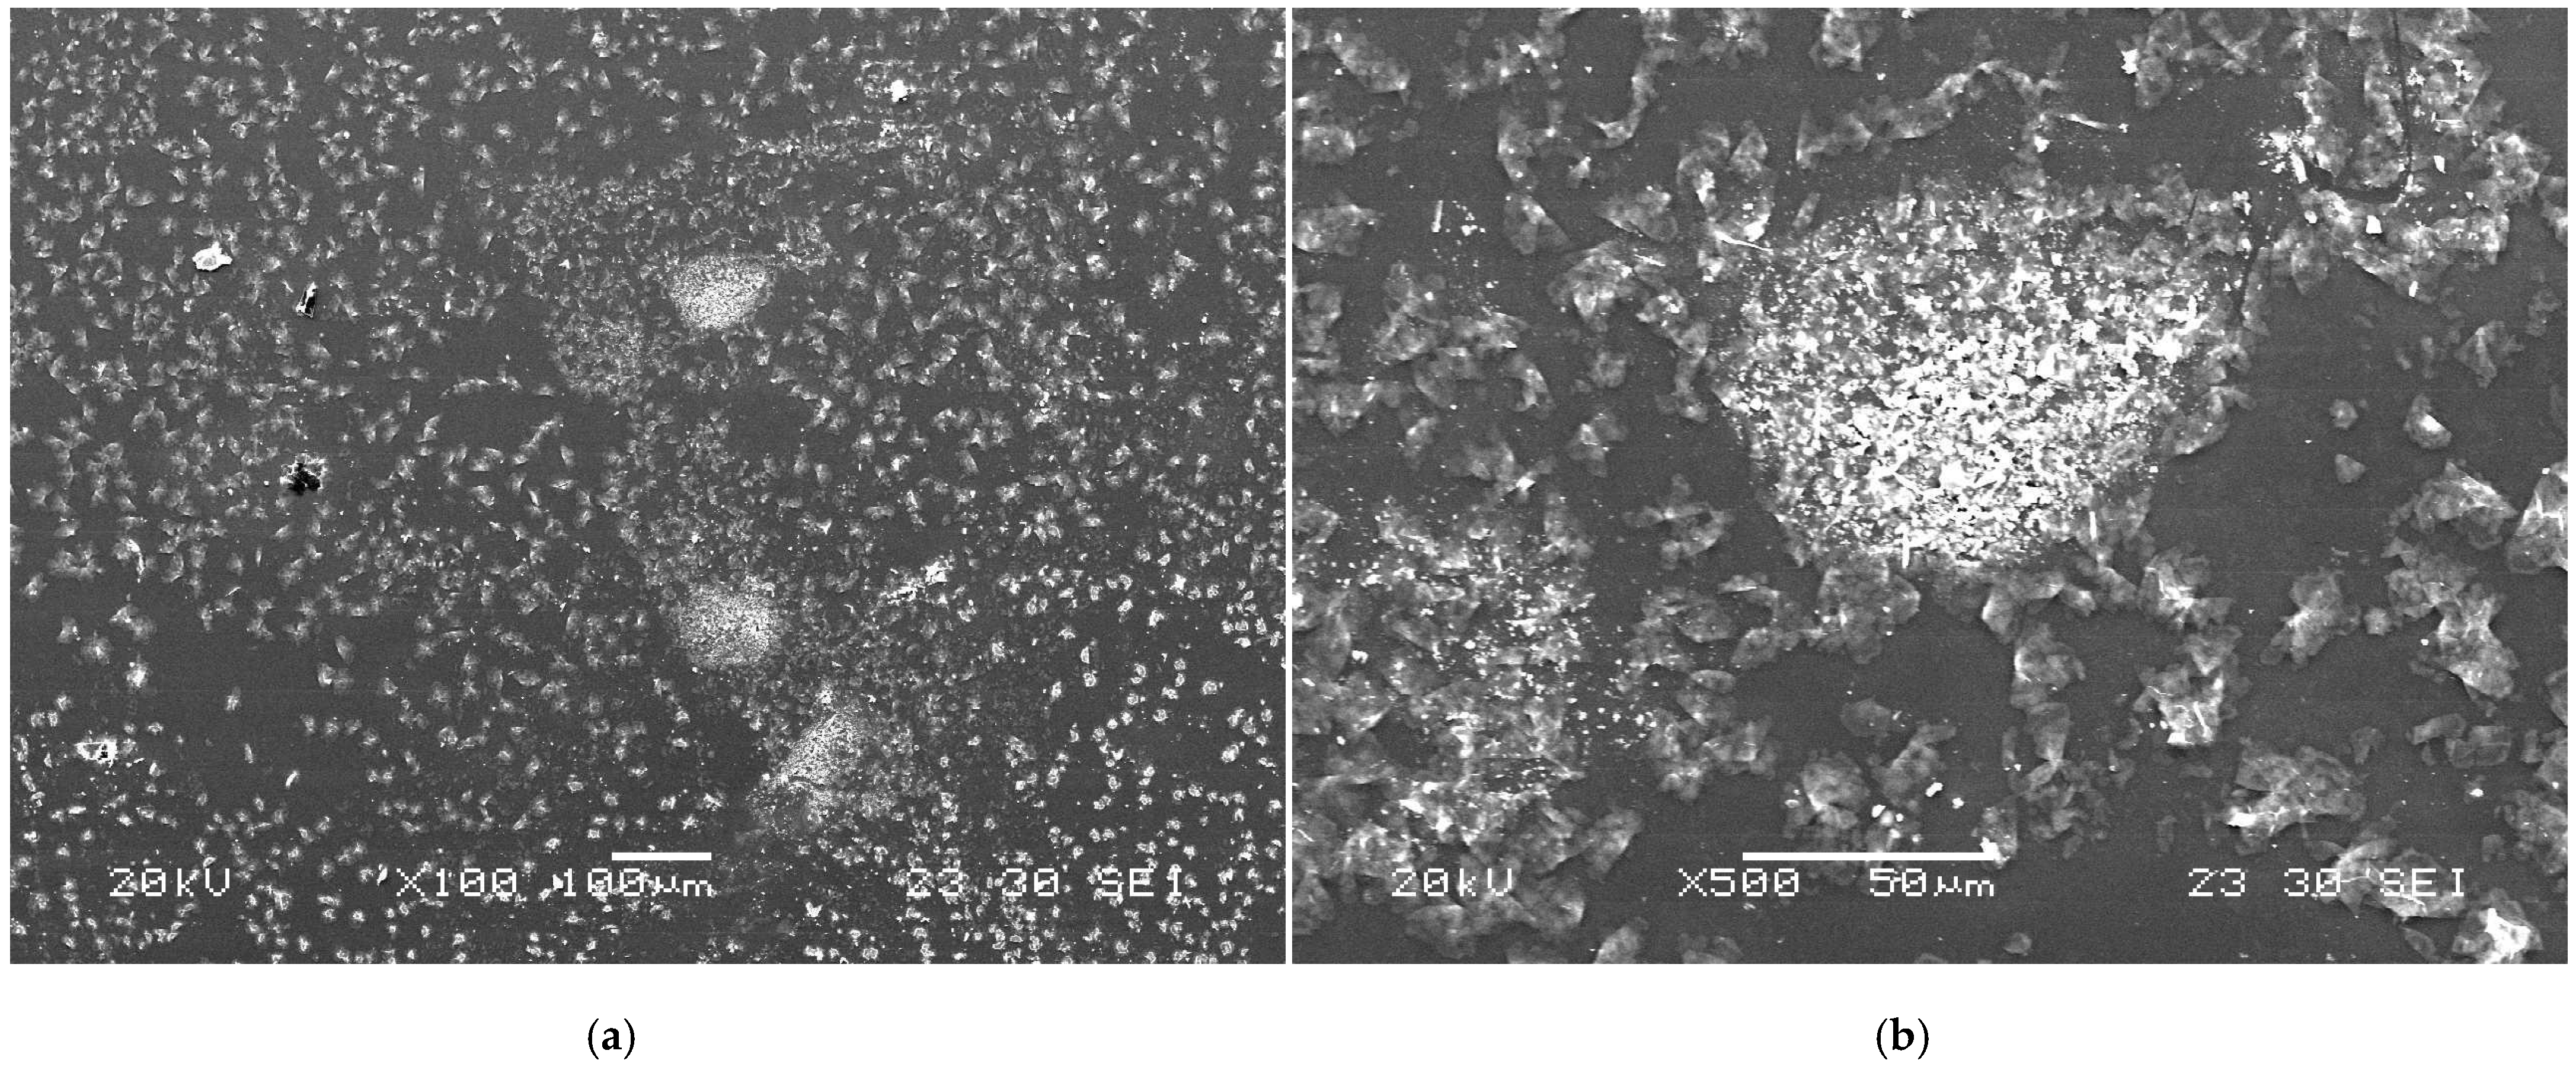
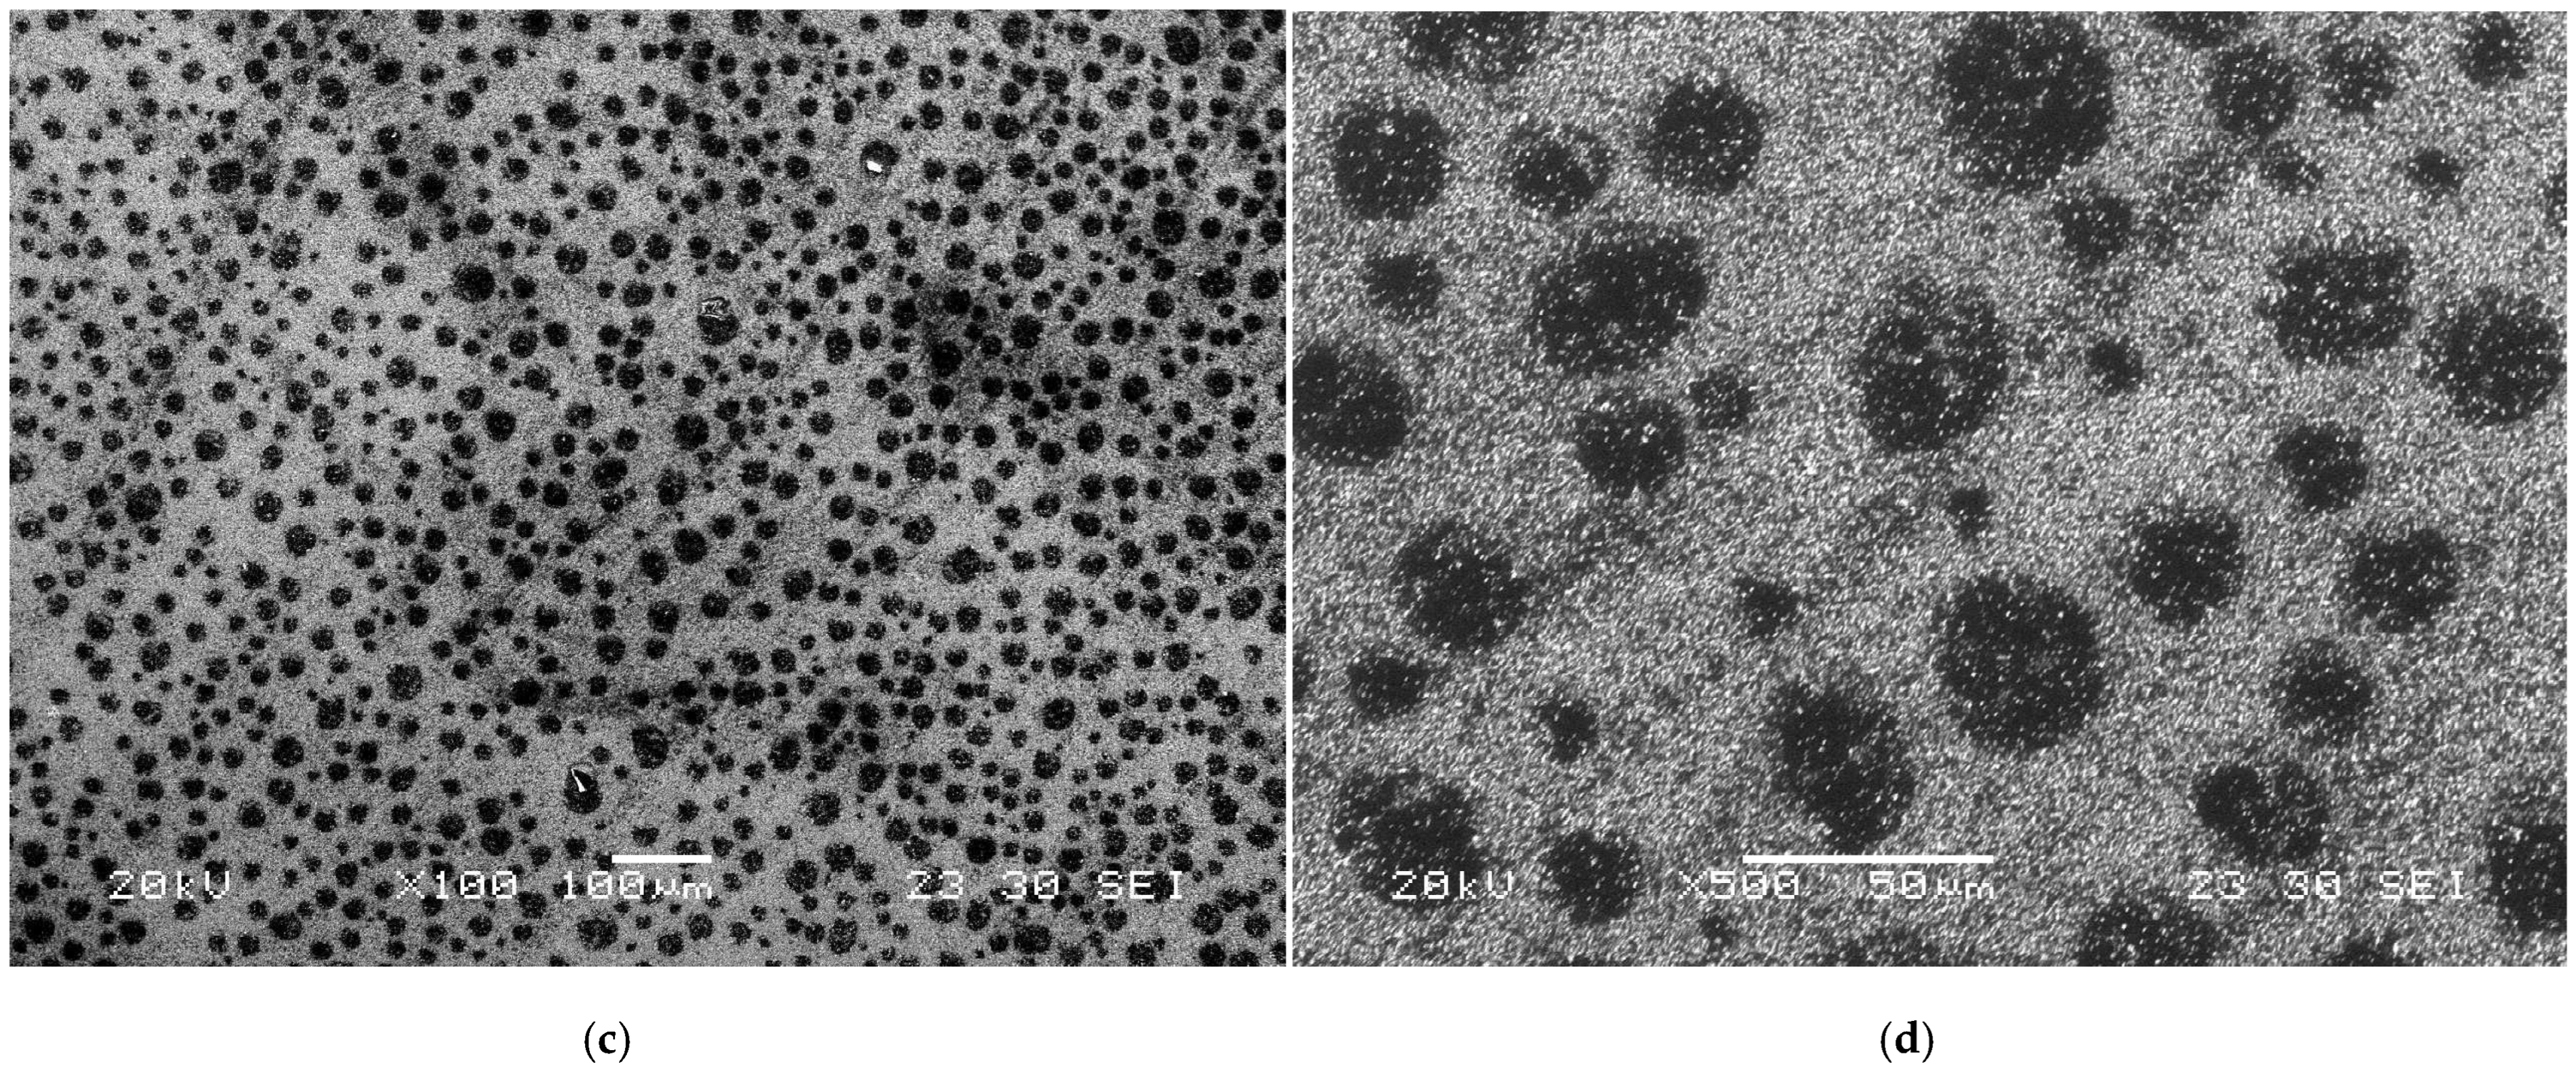
In addition to concerns about electrode material corrosion, contamination with trace metals is a major issue that degrades their electrochemical performance [24]. As shown in Figure 1a,b, the N-taC thin film surface, tested seven times in a 1 × 10⁻² M Hg2+ + 0.1 M NaCl solution with an adjusted pH of 6 using an LSASV technique, had reduced Hg or its compounds with localized damage (Figure 1b). After the LSASV test was continuously repeated 30 times, the surface morphology of the N-taC film (Figure 1c,d) was completely different from that of the one tested seven times. The existence of Hg-based deposits probably formed minute anodic or cathodic sites on the N-taC thin film surface with respect to their surroundings as a result of their different electrochemical potentials, so anodic or cathodic currents between them caused severe anodic dissolution of the film under the repeated potential scans. Hence, the observed black spots on the film surface can be related to the sites of deposits, as shown in Figure 1c,d. This case study clearly indicates that different types of heavy metals, pH of electrolytes, etc., cause a complication between the corrosion and electrochemical performance of N-taC thin-film electrodes, as there is a certain correlation between their poisoning and corrosion. Consequently, systematic investigation into the interplay of electrode materials with analytes during electrochemical testing is critical, as such studies offer vital insights for advancing carbon-based thin-film electrodes tailored for high-performance electrochemical sensing technologies.
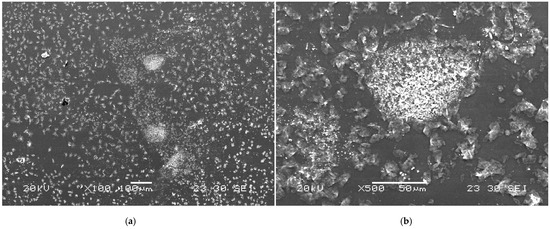
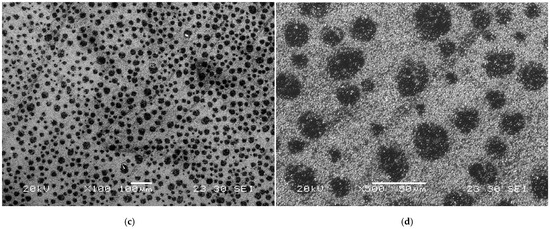
Figure 1.
Surface morphologies of N-taC thin film, produced on Si substrate via FCVA deposition process with an N2 flow rate of 20 sccm, observed at different magnifications after a linear sweep anodic stripping voltammetric (LSASV) test in a 1 × 10⁻² M Hg2+ + 0.1 M NaCl solution was continuously repeated (a,b) 7 times and (c,d) 30 times. The LSASV test consisted of two main steps: reducing Hg2+ ions from the solution onto the film surface by applying a negative deposition potential of −1.2 V vs. a standard saturated calomel reference electrode (SCE) for 120 s and stripping reduced Hg atoms from the film surface into the solution by the application of a potential scan from −0.7 to 0.1 V vs. SCE at a scan rate of 36.36 mV/s. The pH of the solution was adjusted to “6” by HCl (HCl → H+ + Cl−).
HCl and NaCl aqueous solutions are widely used as ionically conductive electrolytes for various electrochemical analyses but are highly corrosive [25]. In addition, NaCl can be abundantly found in seawater, wastewater, rainwater, lake water, underground water, etc., even in tap water. Khun et al. [26] investigated the corrosion behavior of N-taC thin films in a NaCl solution as well as the effects of solution pH on their long-term durability. Xiao et al. [27] investigated the effects of negative bias on the corrosion-protective performance of N-taC thin films over magnesium alloys. Although the corrosion resistance of DLC thin films has been widely investigated in acidic and NaCl solutions [25,26,27,28], their corrosion behavior in other chloride solutions, such as CaCl2, PbCl2, and HgCl2 aqueous solutions, has not been examined, especially for comparison. As mentioned above, Pb and Hg in aqueous solutions are highly toxic metallic analytes, and their ion forms can cause a complex electrochemical interaction with the surfaces of taC thin films during immersion. CaCl2 is heavily used as a more effective de-icer than NaCl to de-ice in snowy countries [29]. When it, however, enters the ecosystem as a contaminant, its high concentration can cause cardiovascular problems for human beings as well as irritation to the skin, eyes, and respiratory organs. Therefore, the CaCl2 solution was of interest in this study to investigate its electrochemical interactions with the taC thin films as a result of its capability to create a corrosive salt solution [30]. Nevertheless, the damaging degree of each chloride solution to taC thin films during electrochemical analysis has never been known and has not been reported in the literature yet. The main objective of this research is, therefore, to understand the corrosion mechanisms of 100 nm thick taC thin films in different acidic and chloride solutions and their electrochemical interactions with analytes in the solutions in comparison in order to improve the electrochemical performance of carbon-based thin film electrodes in the future.
In this work, undoped taC films fabricated via FCVA deposition on silicon substrates were employed to assess their corrosion behavior in aqueous electrolytes, circumventing interference from N-doped carbon-analyte interactions. Previous studies have established that the sp3-bonded carbon fraction in taC films is strongly dependent on the substrate bias voltage utilized during deposition [31,32,33]. Higher substrate bias voltages enhance sp3 hybridization density. However, excessive bias induces graphitization through sp3-to-sp2 bond conversion [31,32,33]. The optimization of substrate bias is crucial to successfully fabricate taC thin films with rigid amorphous carbon structures for their high corrosion resistance in aqueous solutions. Therefore, the taC thin films were produced by using different substrate pulse biases to investigate changes in their structure, adhesion strength, and corrosion resistance with respect to the substrate pulse bias. In addition, their corrosion behavior in HCl, NaCl, CaCl2, PbCl2, and HgCl2 solutions was comparatively studied, which has not been reported in the literature yet.
2. Experimental Details
2.1. Sample Preparation
The deposition of taC thin films on Si substrates (111) (1–6 × 10⁻³ Ωcm) was carried out using an FCVA deposition system (Nanofilm Technologies International, Singapore) with a pure graphite target of ≥99.95%C. Table 1 reports the FCVA deposition process parameters.

Table 1.
FCVA deposition process parameters used for taC thin films.
2.2. Characterization
A Dektak surface profilometer (Bruker, Billerica, MA, USA) was used to measure the thickness of the taC thin films.
Micro-Raman spectroscopy (Renishaw, Wotton-under-Edge, UK) was applied to accumulate the Raman spectra of the taC thin films with a He-Ne 632 nm laser. Their Raman results, such as positions, full widths-at-half-maximum (FWHMs), and the intensity (ID/IG) ratio of D (disorder-induced) and G (graphitic) peaks, were averaged from five random Raman measurements on each sample.
The atomic force microscopy (AFM) (Veeco Digital Instruments, S-3000, Plainview, NY, USA) with a Si3N4 tip in tapping mode was carried out to capture five surface topographies of the taC thin film in a scan area of 1 µm × 1 µm for each substrate pulse bias, from which their averaged surface roughness values, such as arithmetic mean roughness (Ra), root-mean-square roughness (Rq), average maximum peak height (Rpm), and average maximum valley depth (Rvm), were taken.
The adhesion between the taC thin films and the Si substrates was evaluated by means of a critical load using a micro-scratch test (Shimadzu SST-101, Kyoto, Japan), in which a diamond stylus of 15 µm in radius was dragged down onto their surfaces at a scratch rate of 10 µm/s and a down speed of 2 µm/s under progressive loading. The scan amplitude and frequency were 50 µm and 30 Hz, respectively. The average critical load was decided from five random measurements per sample.
The corrosion behavior of the taC thin films in acidic and chloride solutions was monitored by potentiodynamic polarization tests using an electrochemical workstation (EG&G263A potentiostat/galvanostat, Princeton, NJ, USA) at a scan rate of 0.8 mV/s. A standard three-electrode electrochemical cell (K0235, Princeton Applied Research, Oak Ridge, TN, USA) containing a taC thin film-coated working electrode, a standard saturated calomel reference electrode (SCE, 244 mV vs. SHE at 25 °C), and a platinum mesh counter electrode was applied. Their potentiodynamic polarization curves were obtained by shifting a potential from −0.5 V to 1.2 V vs. SCE and presented in a potential range of 0–1.2 V. A Tafel technique was used to fit their potentiodynamic polarization curves to get corrosion potential (Ecorr) and current (Icorr) values, and then their polarization resistance (Rp) values were calculated as mentioned in Ref. [13]. The corrosion results were confirmed by two to three measurements per sample.
The corroded surfaces of the taC thin films were observed using scanning electron microscopy (SEM) (JEOL-JSM-5600LV, Tokyo, Japan). The chemical compositions of corrosion products were measured using energy dispersive spectroscopy (EDS) attached to the SEM.
3. Results and Discussion
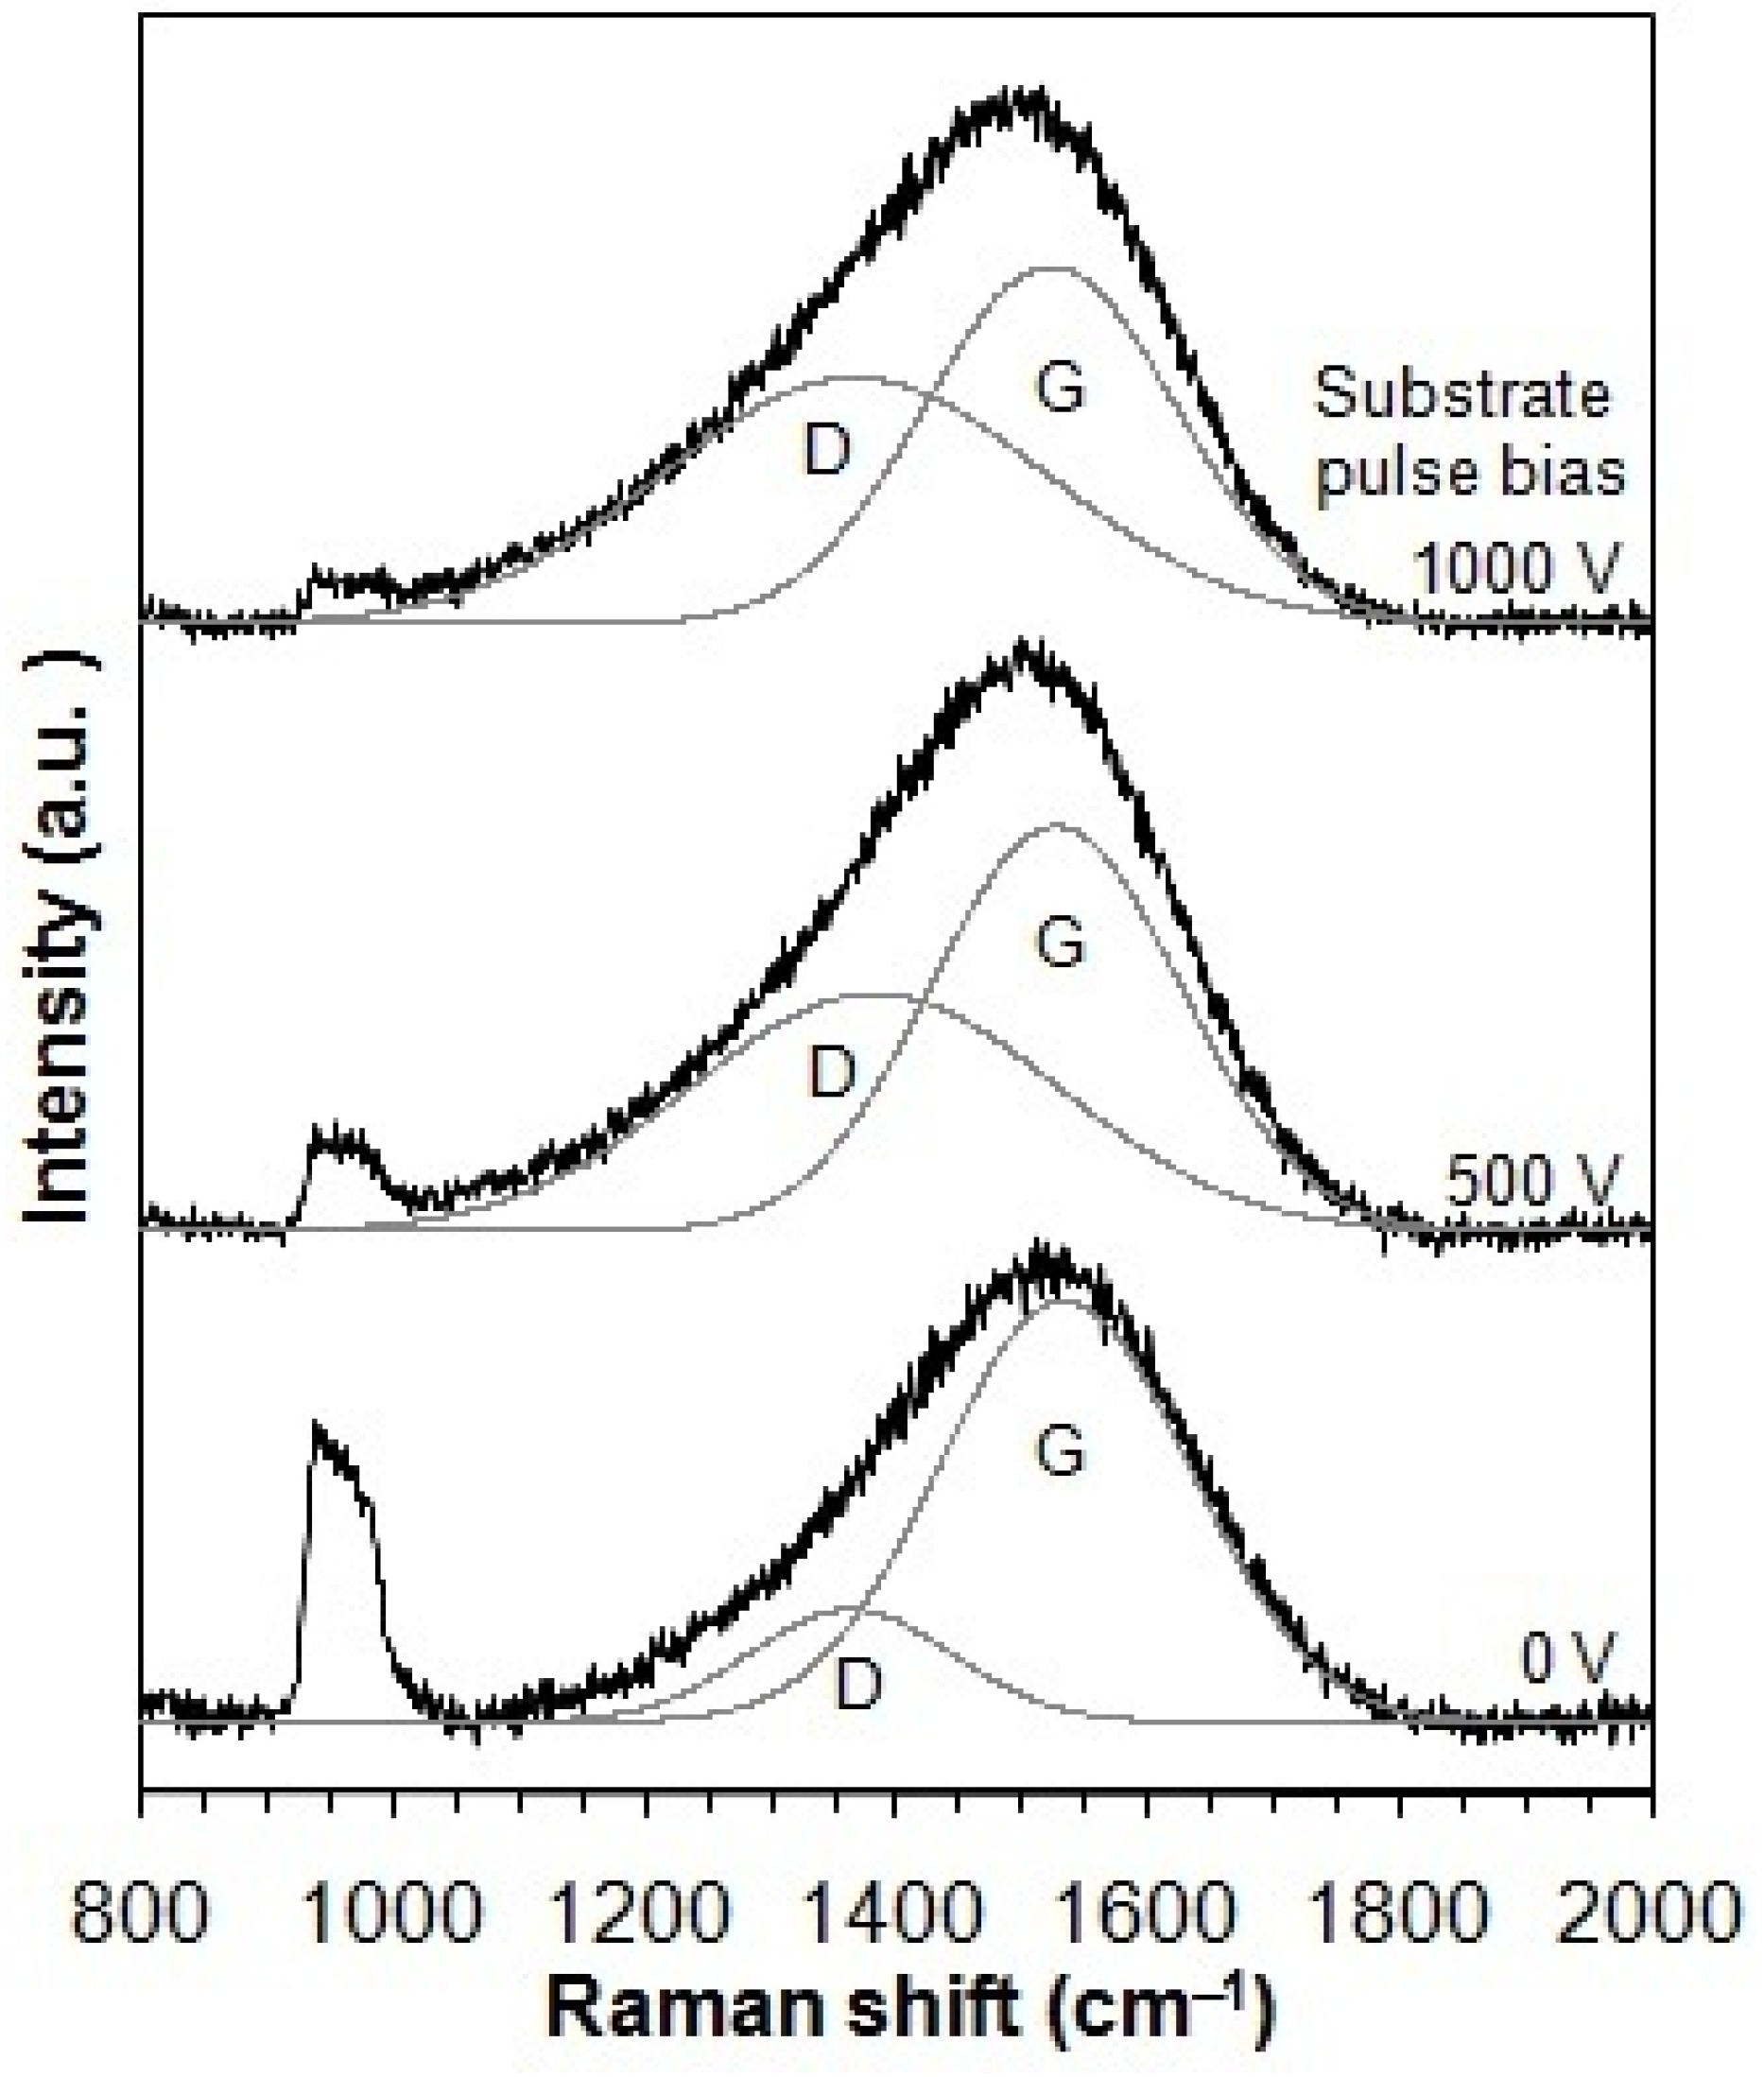
Figure 2 displays the Raman spectra of the taC thin films deposited under varying substrate pulse biases. These spectra were successfully deconvoluted into two Gaussian components corresponding to the G and D peaks, which are typical characteristics of disordered carbon materials. In the Raman spectra, the D peak more apparently develops with an increased substrate pulse bias. This indicates that the use of higher substrate pulse bias during the film deposition results in a larger number of rings in the taC thin films since the D peak is attributed to rings only in the C matrix [3,34]. The Raman peaks observed in the range of 950–1050 cm−1, originating from the Si substrate, exhibit lower intensity with higher substrate pulse bias. This attenuation likely arises from changes in the optical transparency of the taC films due to their graphitization [35,36].
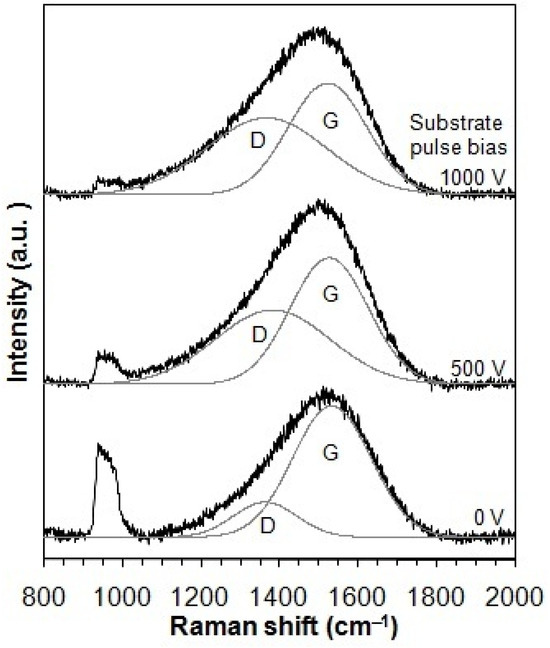
Figure 2.
Raman spectra of taC thin films with different substrate pulse biases.
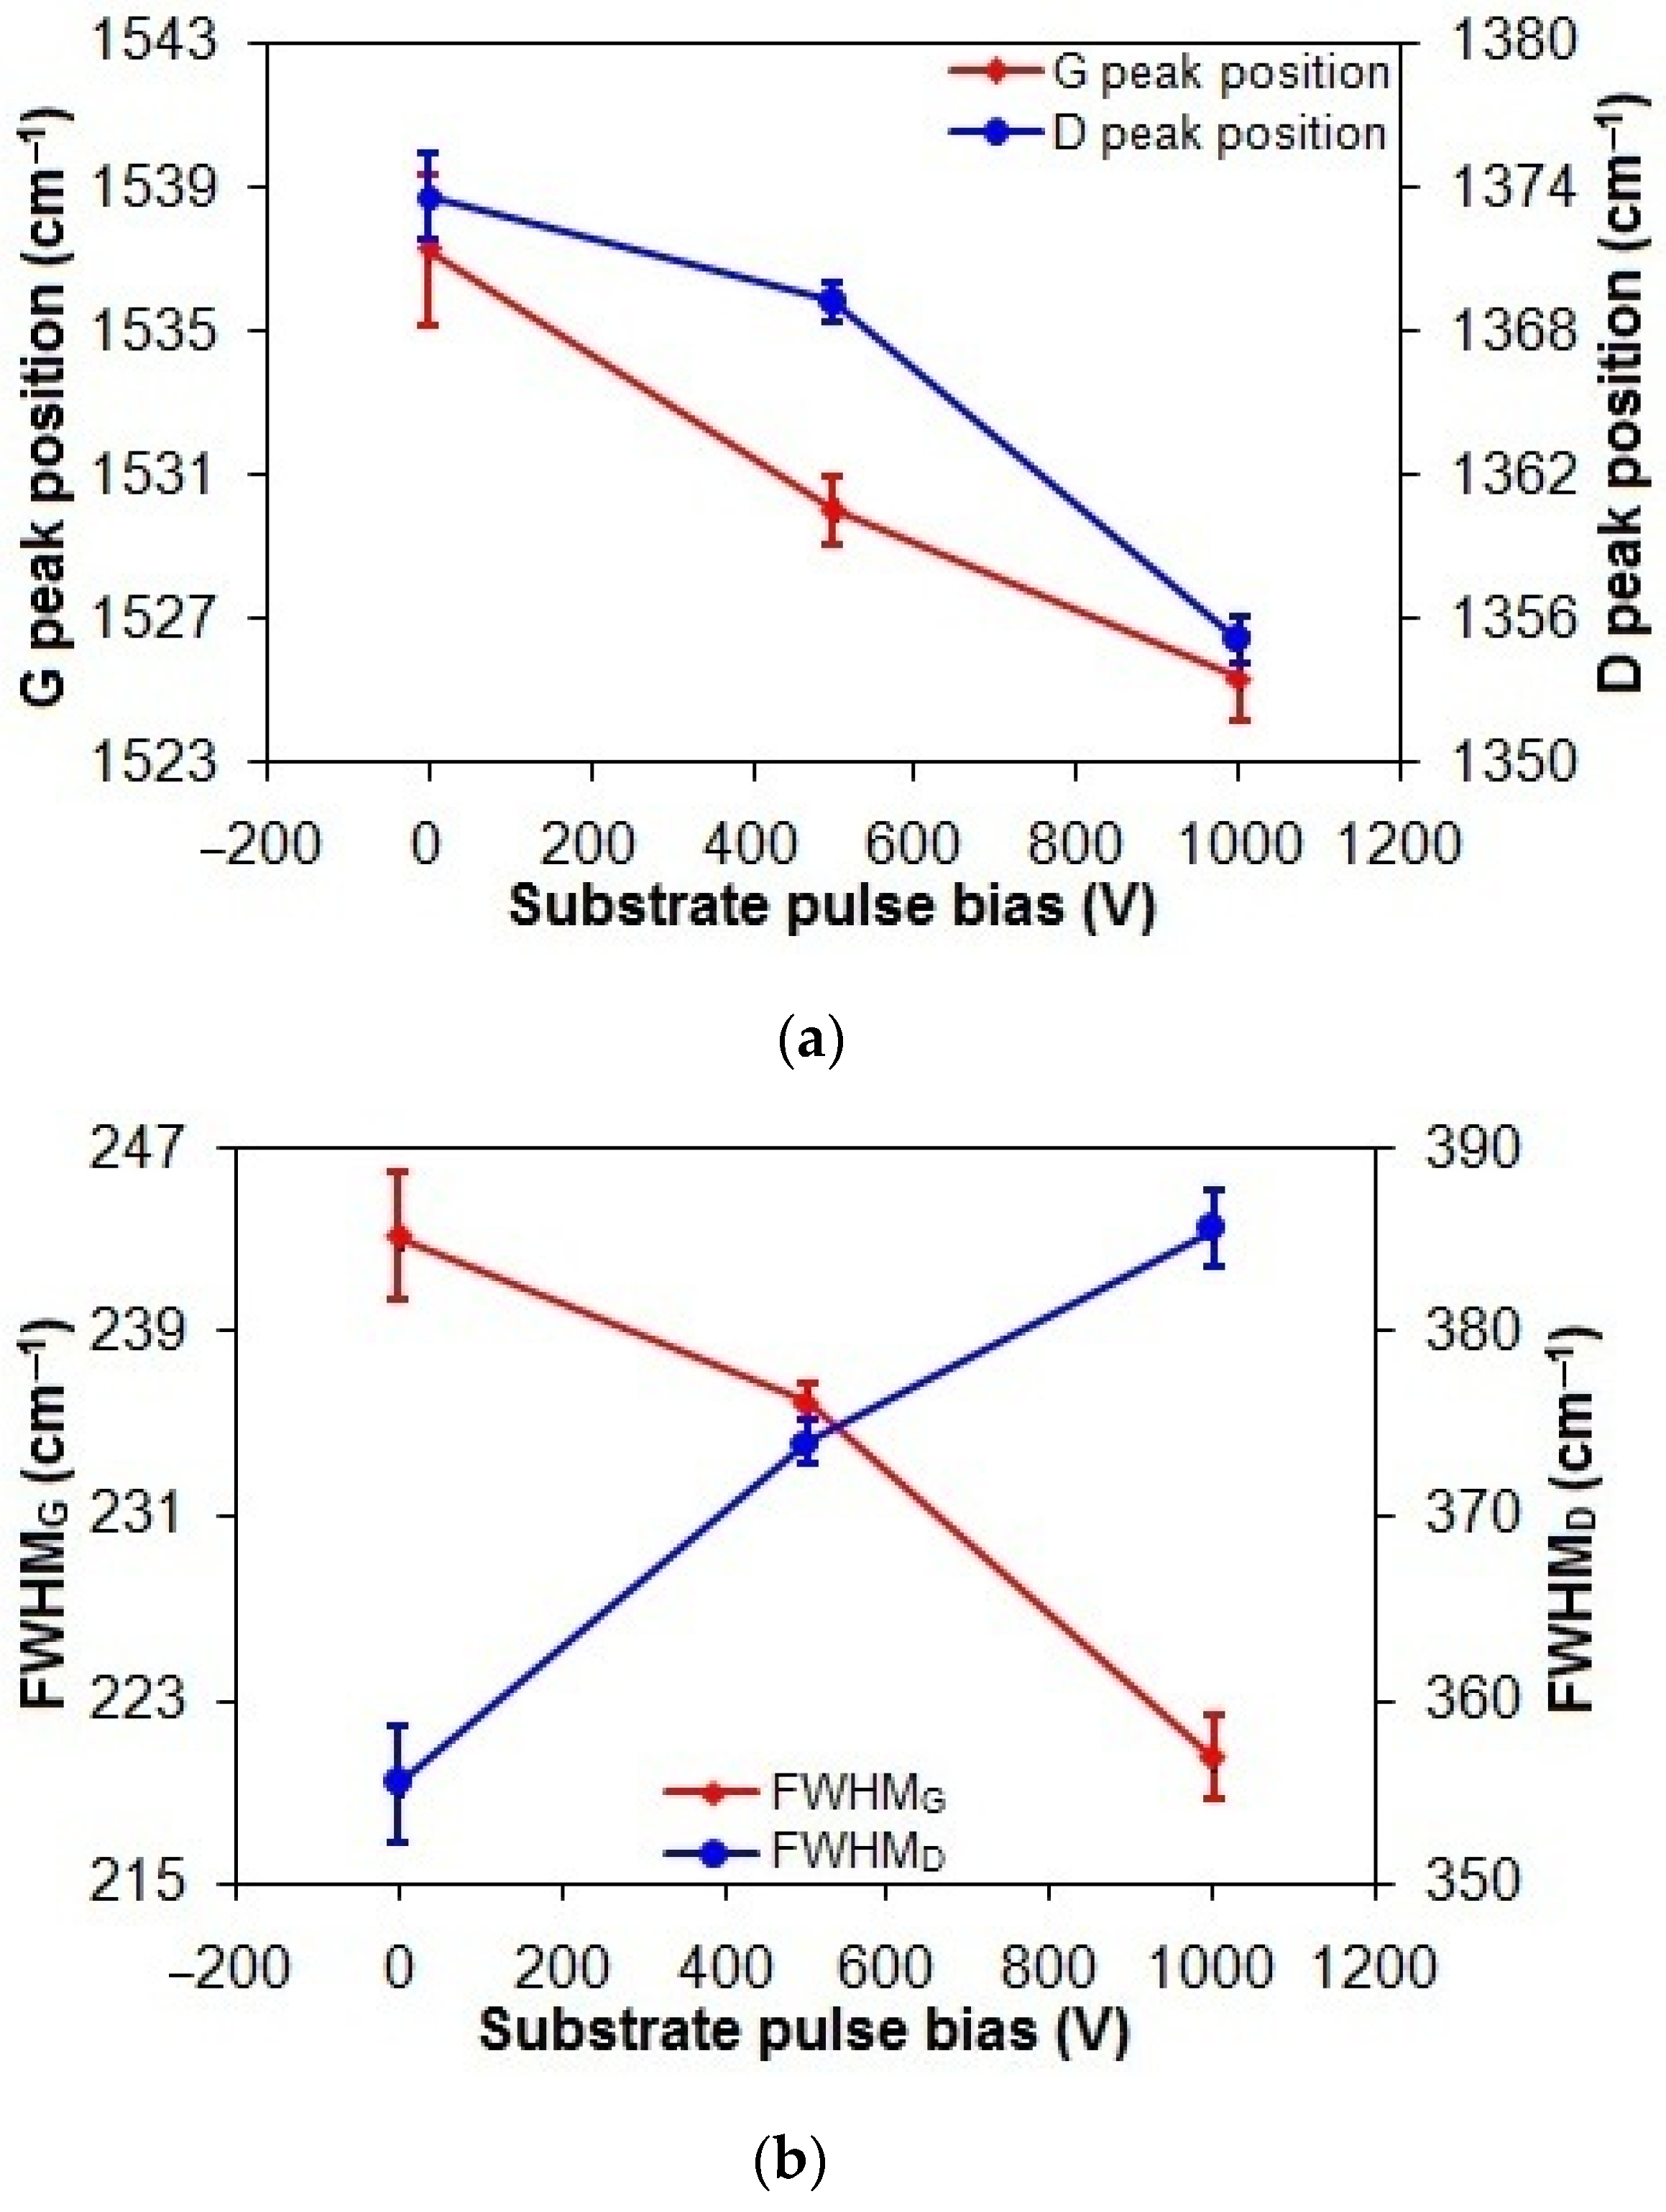
As shown in Figure 3a, the G and D peak positions of the taC thin films exhibit a progressive shift from 1537.2 cm−1 and 1373.6 cm−1 to 1525.3 cm−1 and 1355.1 cm−1, respectively, with an increasing substrate pulse bias from 0 V to 1000 V. This can be explained by the changes in sp2 bonding configuration from short chains to rings with their decreased sp3 content associated with their increased graphitization, thanks to the longer bond length of rings than that of chains for lower vibrational frequency [3,37].
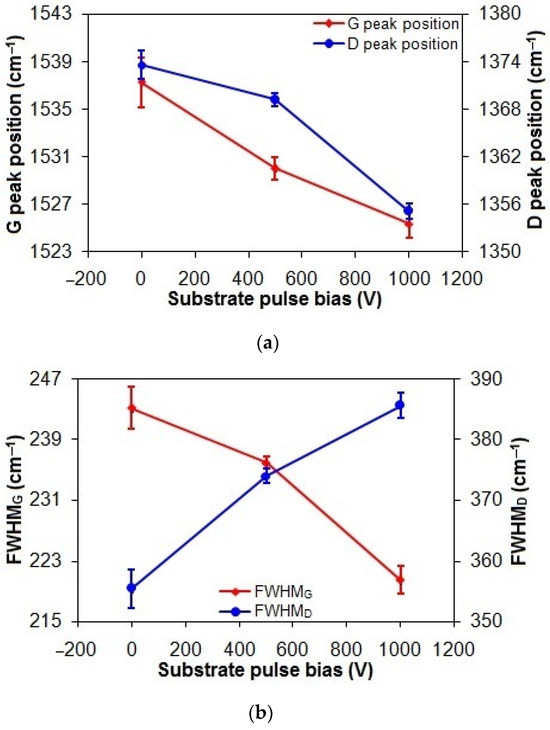
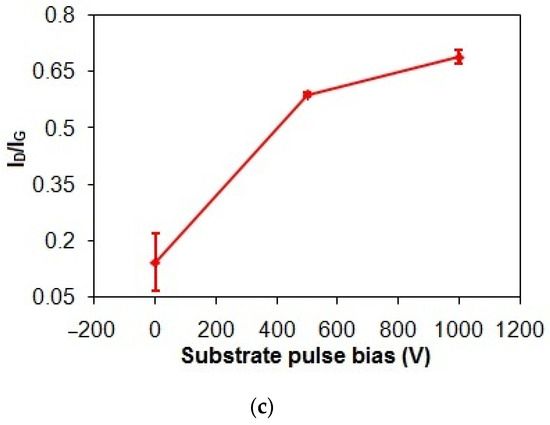
Figure 3.
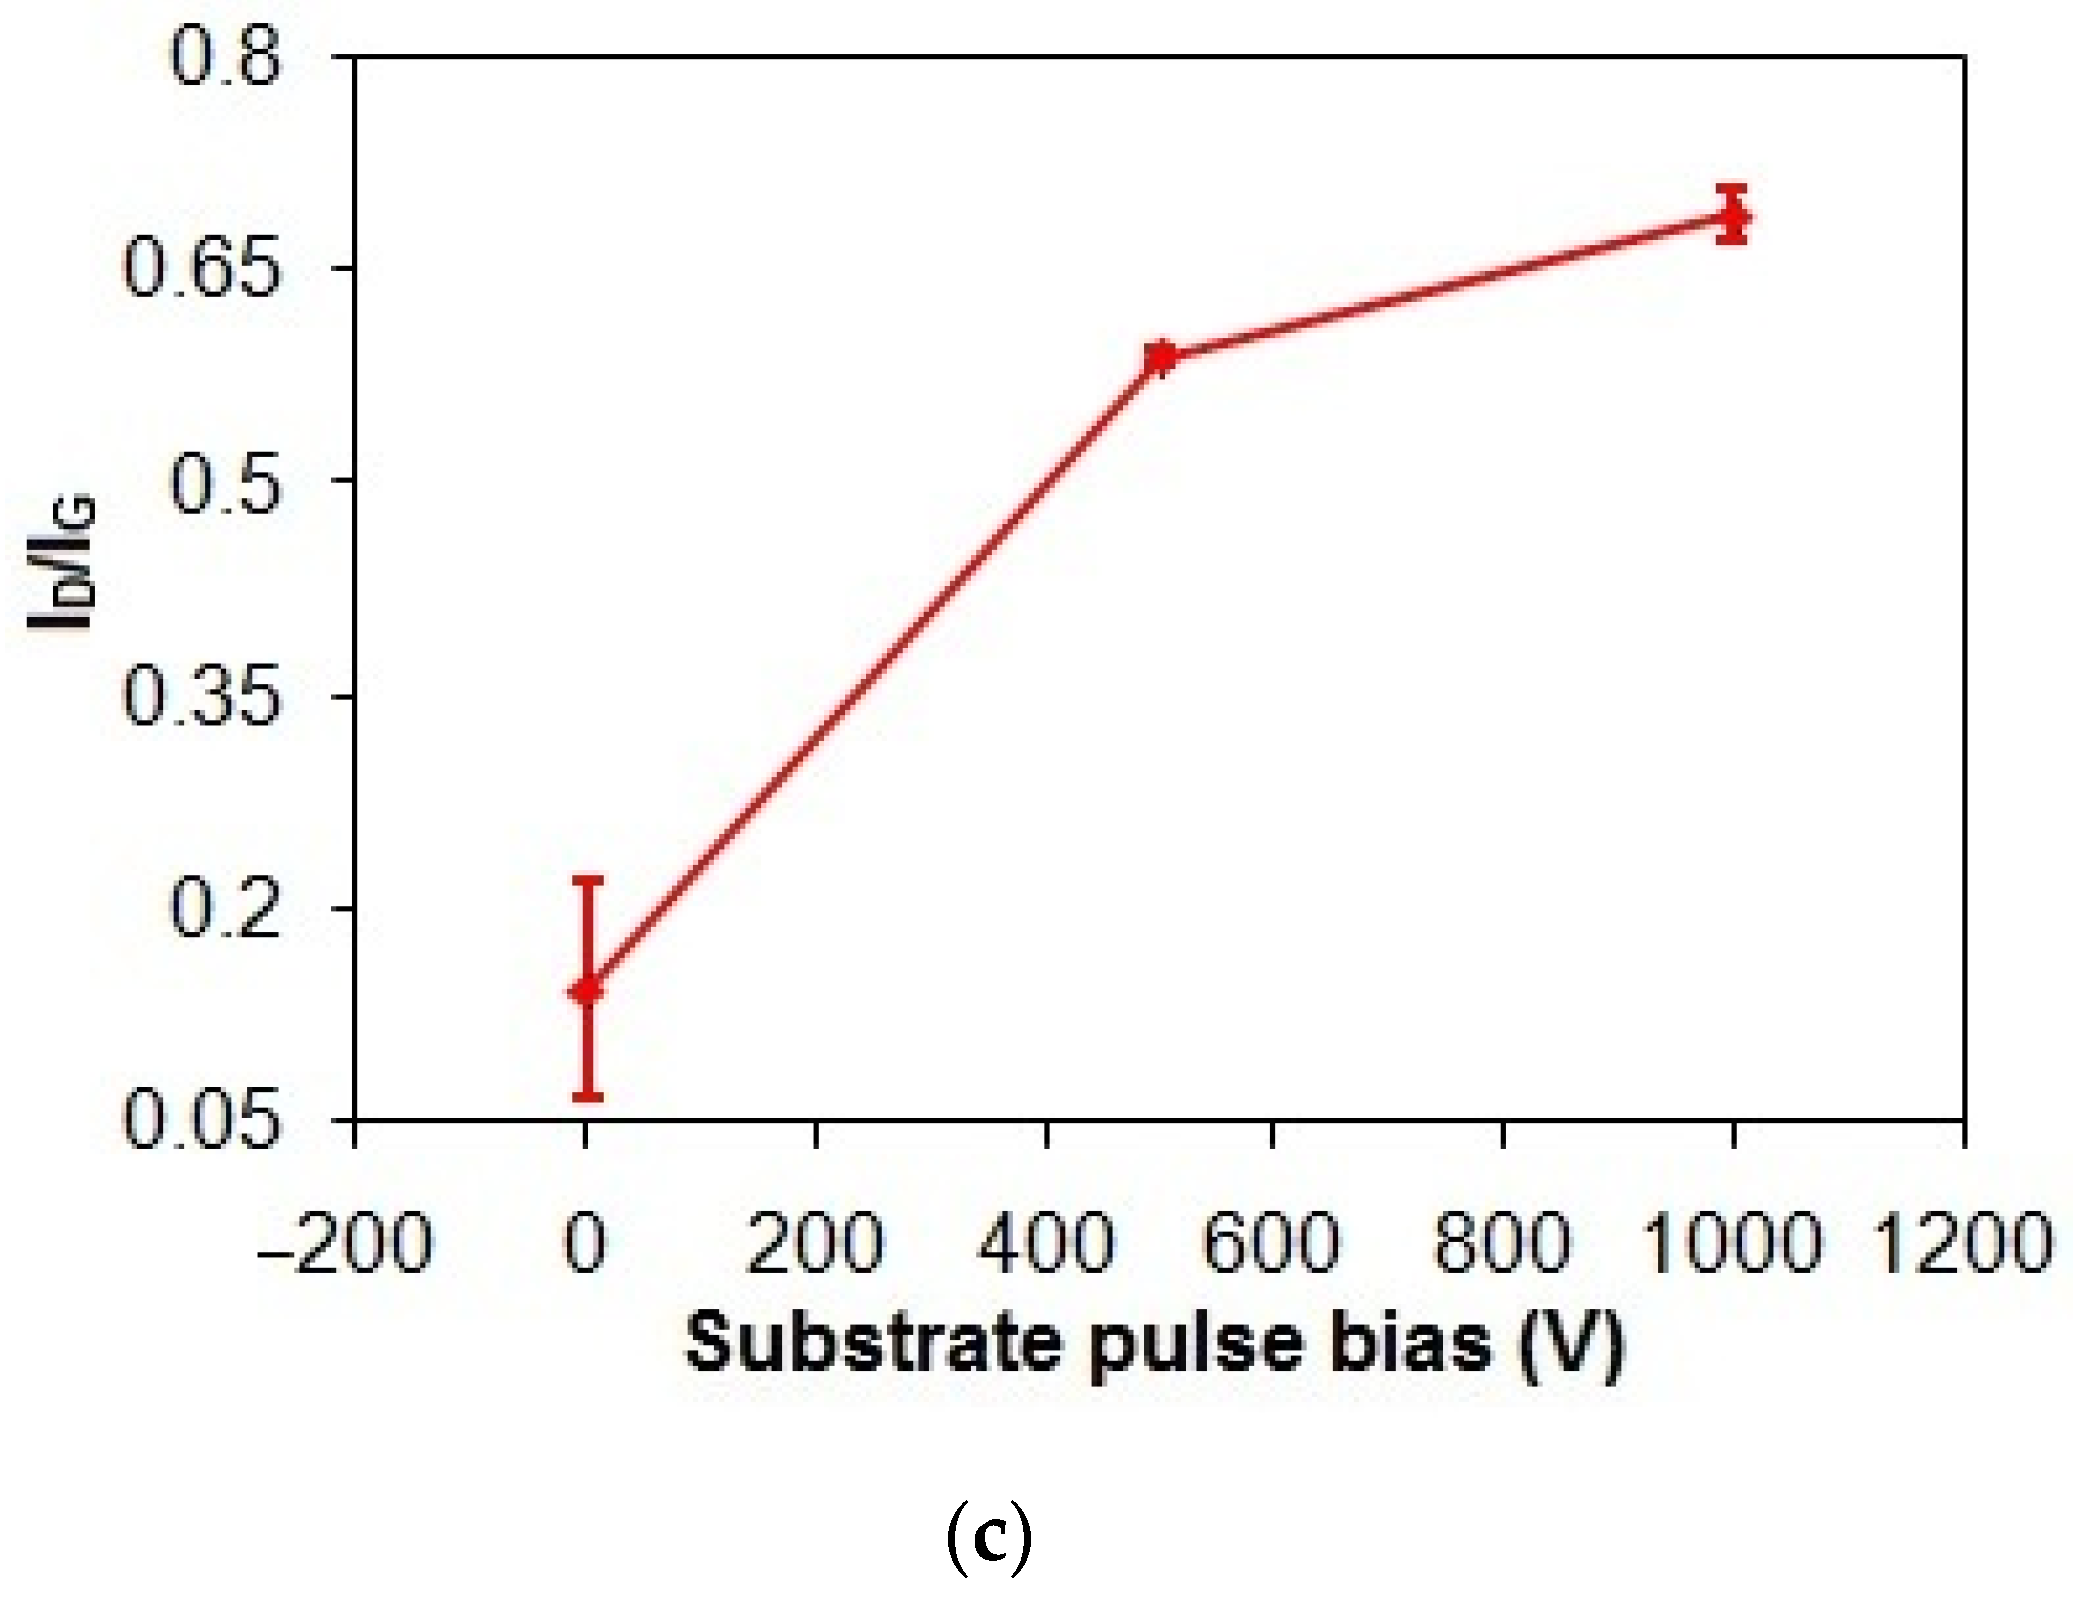
(a) Gand D peak positions, (b) FWHMG and FWHMD, and (c) ID/IG of taC thin films with different substrate pulse biases.
In Figure 3b, increasing the substrate pulse bias from 0 to 1000 V decreases the FWHMG of the taC thin films from 243.1 cm−1 to 220.5 cm−1. Since the FWHMG is an indication of the disorder of sp2 bonds, the decreased FWHMG of the taC thin films can be interpreted as the decreased disorder of sp2 bonds in their C matrixes [3,38]. However, the increased FWHMD of the taC thin films from 355.4 cm−1 to 385.6 cm−1 with an increased substrate pulse bias from 0 to 1000 V can be related to the increased disorder of rings in their C matrixes. The reason is that increasing the number of rings in the presence of the large number of sp3 bonds increases their disorder in the amorphous carbon structures of the taC thin films, which in turn weakens bonds and thereby lowers the vibrational density of states to cause the D peak position to shift downwards (Figure 3a) and the FWHMD to shift upwards (Figure 3b) [3,37].
In Figure 3c, the ID/IG of the taC thin films apparently increases from 0.14 to 0.7 (5 times higher) with an increased substrate pulse bias from 0 to 1000 V, indicating enhanced graphitization [3,37]. During the film deposition, the energetic bombardment of C species generates heat and dissipates it within the growing film, causing the graphitization of the film [3,39]. As a result, the increased substrate pulse bias results in the increased kinetic energies of C species and, thereby, the increased graphitization of the taC thin films for their increased ID/IG.
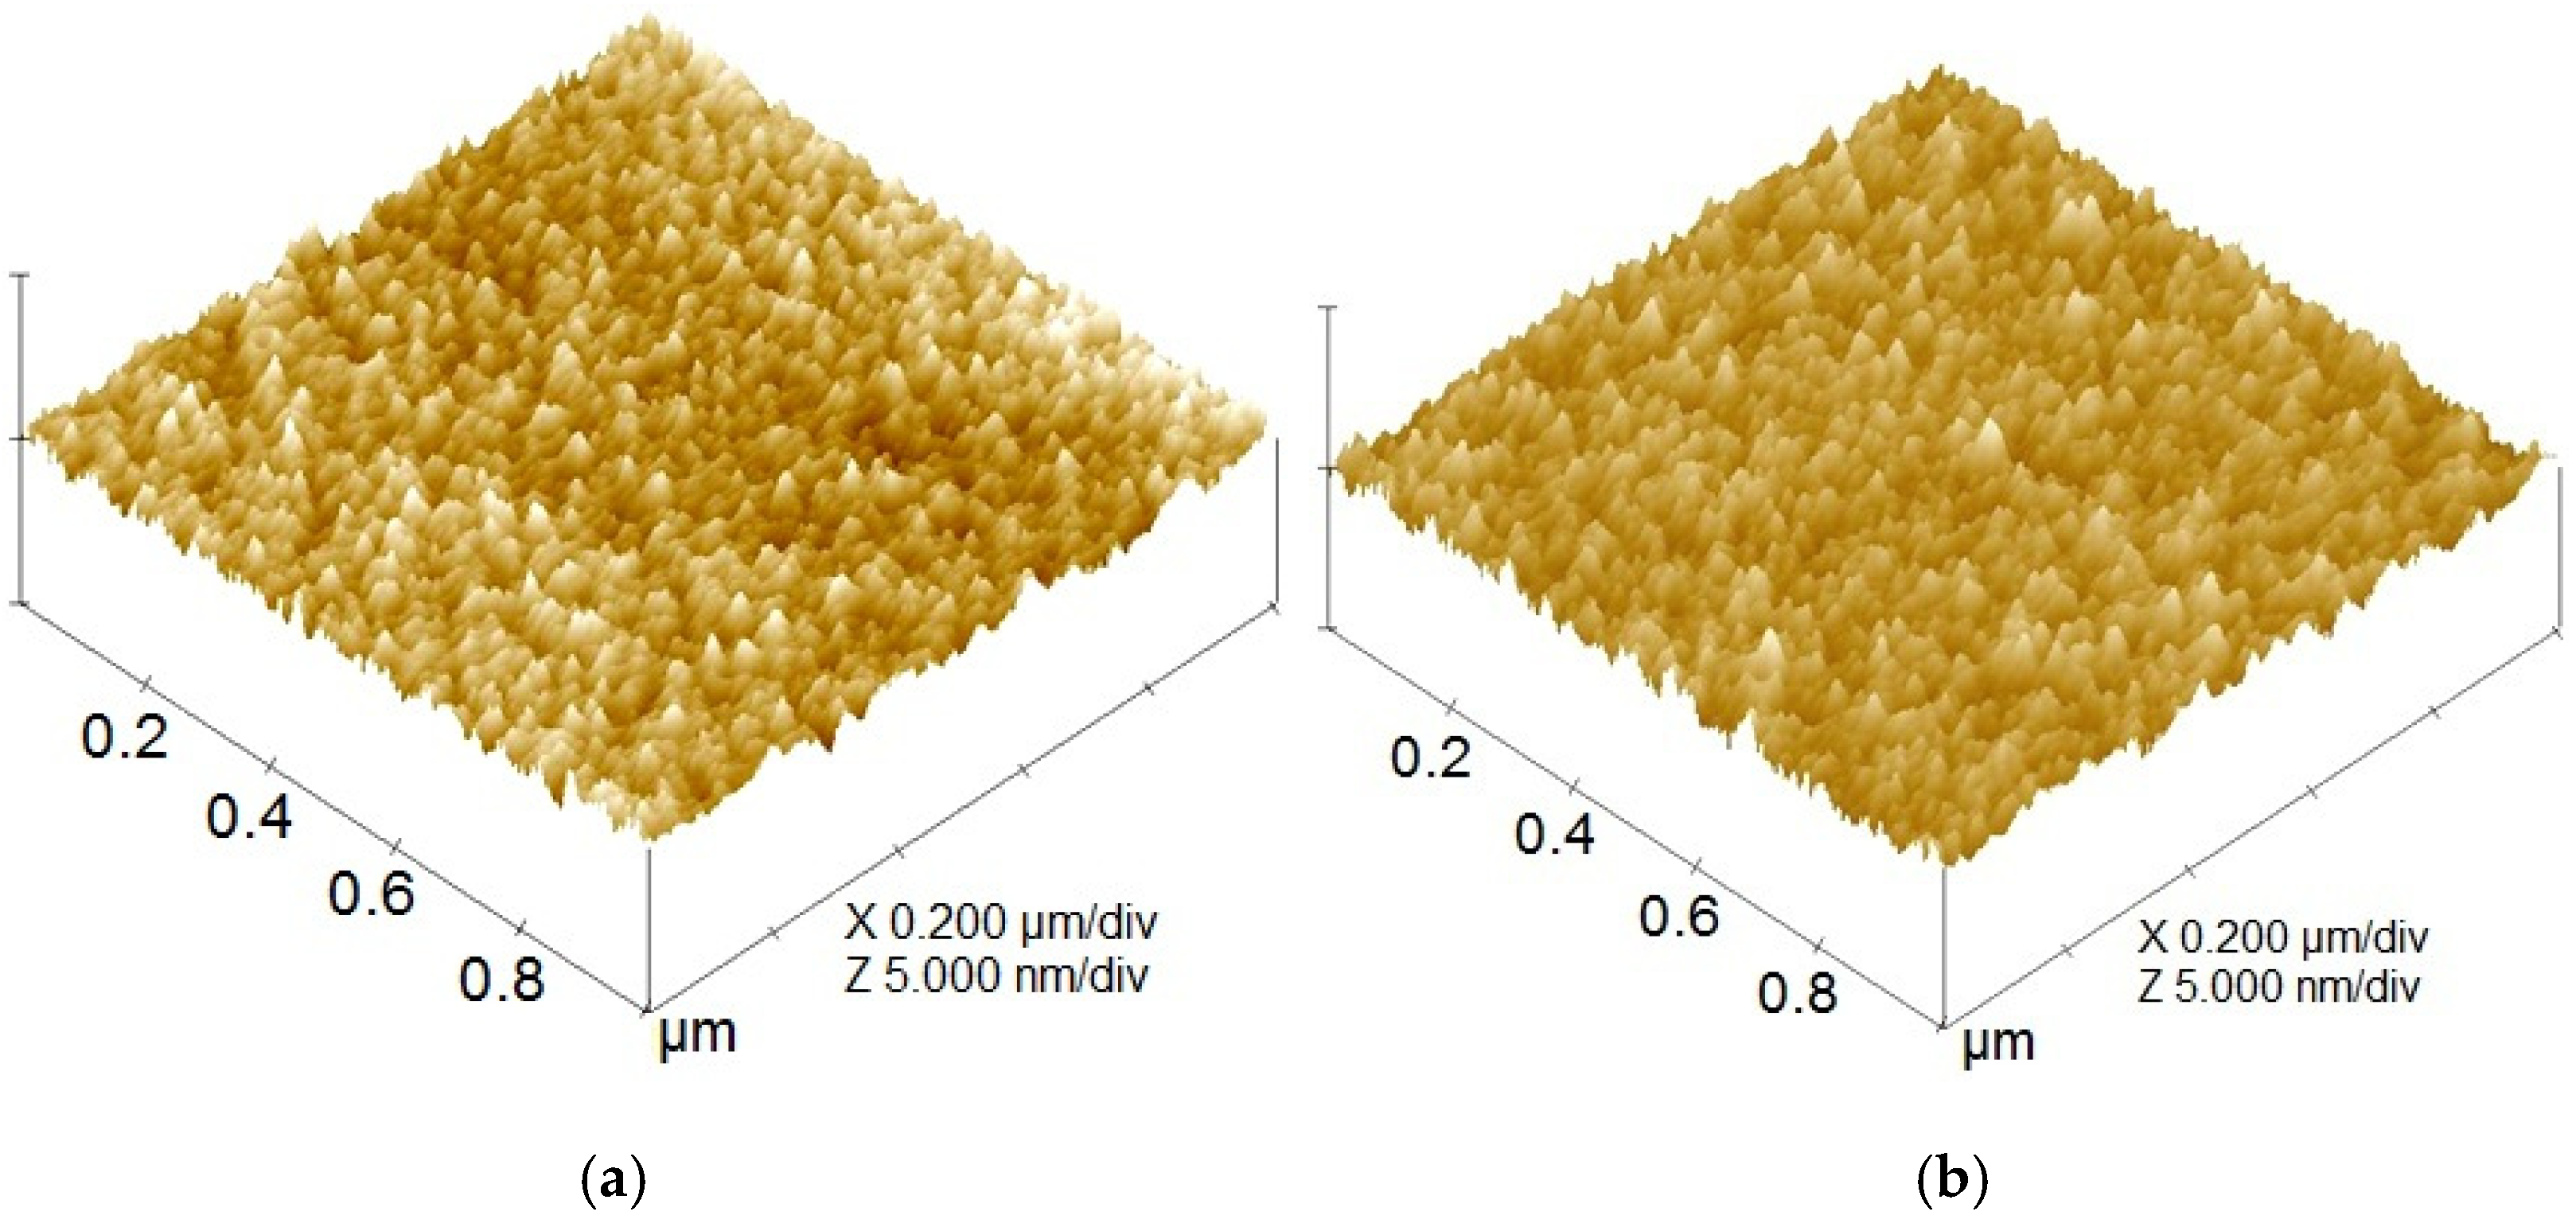
In Figure 4, protruded surface asperities are apparently found on the surface topographies of both taC thin films with 0 V and 1000 V. The smaller number of protruded asperities above the surface, especially brighter asperities, is found for the higher substrate pulse bias of 1000 V. Both thin films show their good continuity and uniformity. The surface roughness parameters were evaluated from these surface topographies.
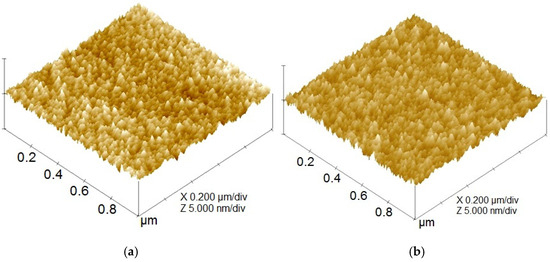
Figure 4.
Surface topographies of taC thin films with substrate pulse biases of (a) 0 V and (b) 1000 V.
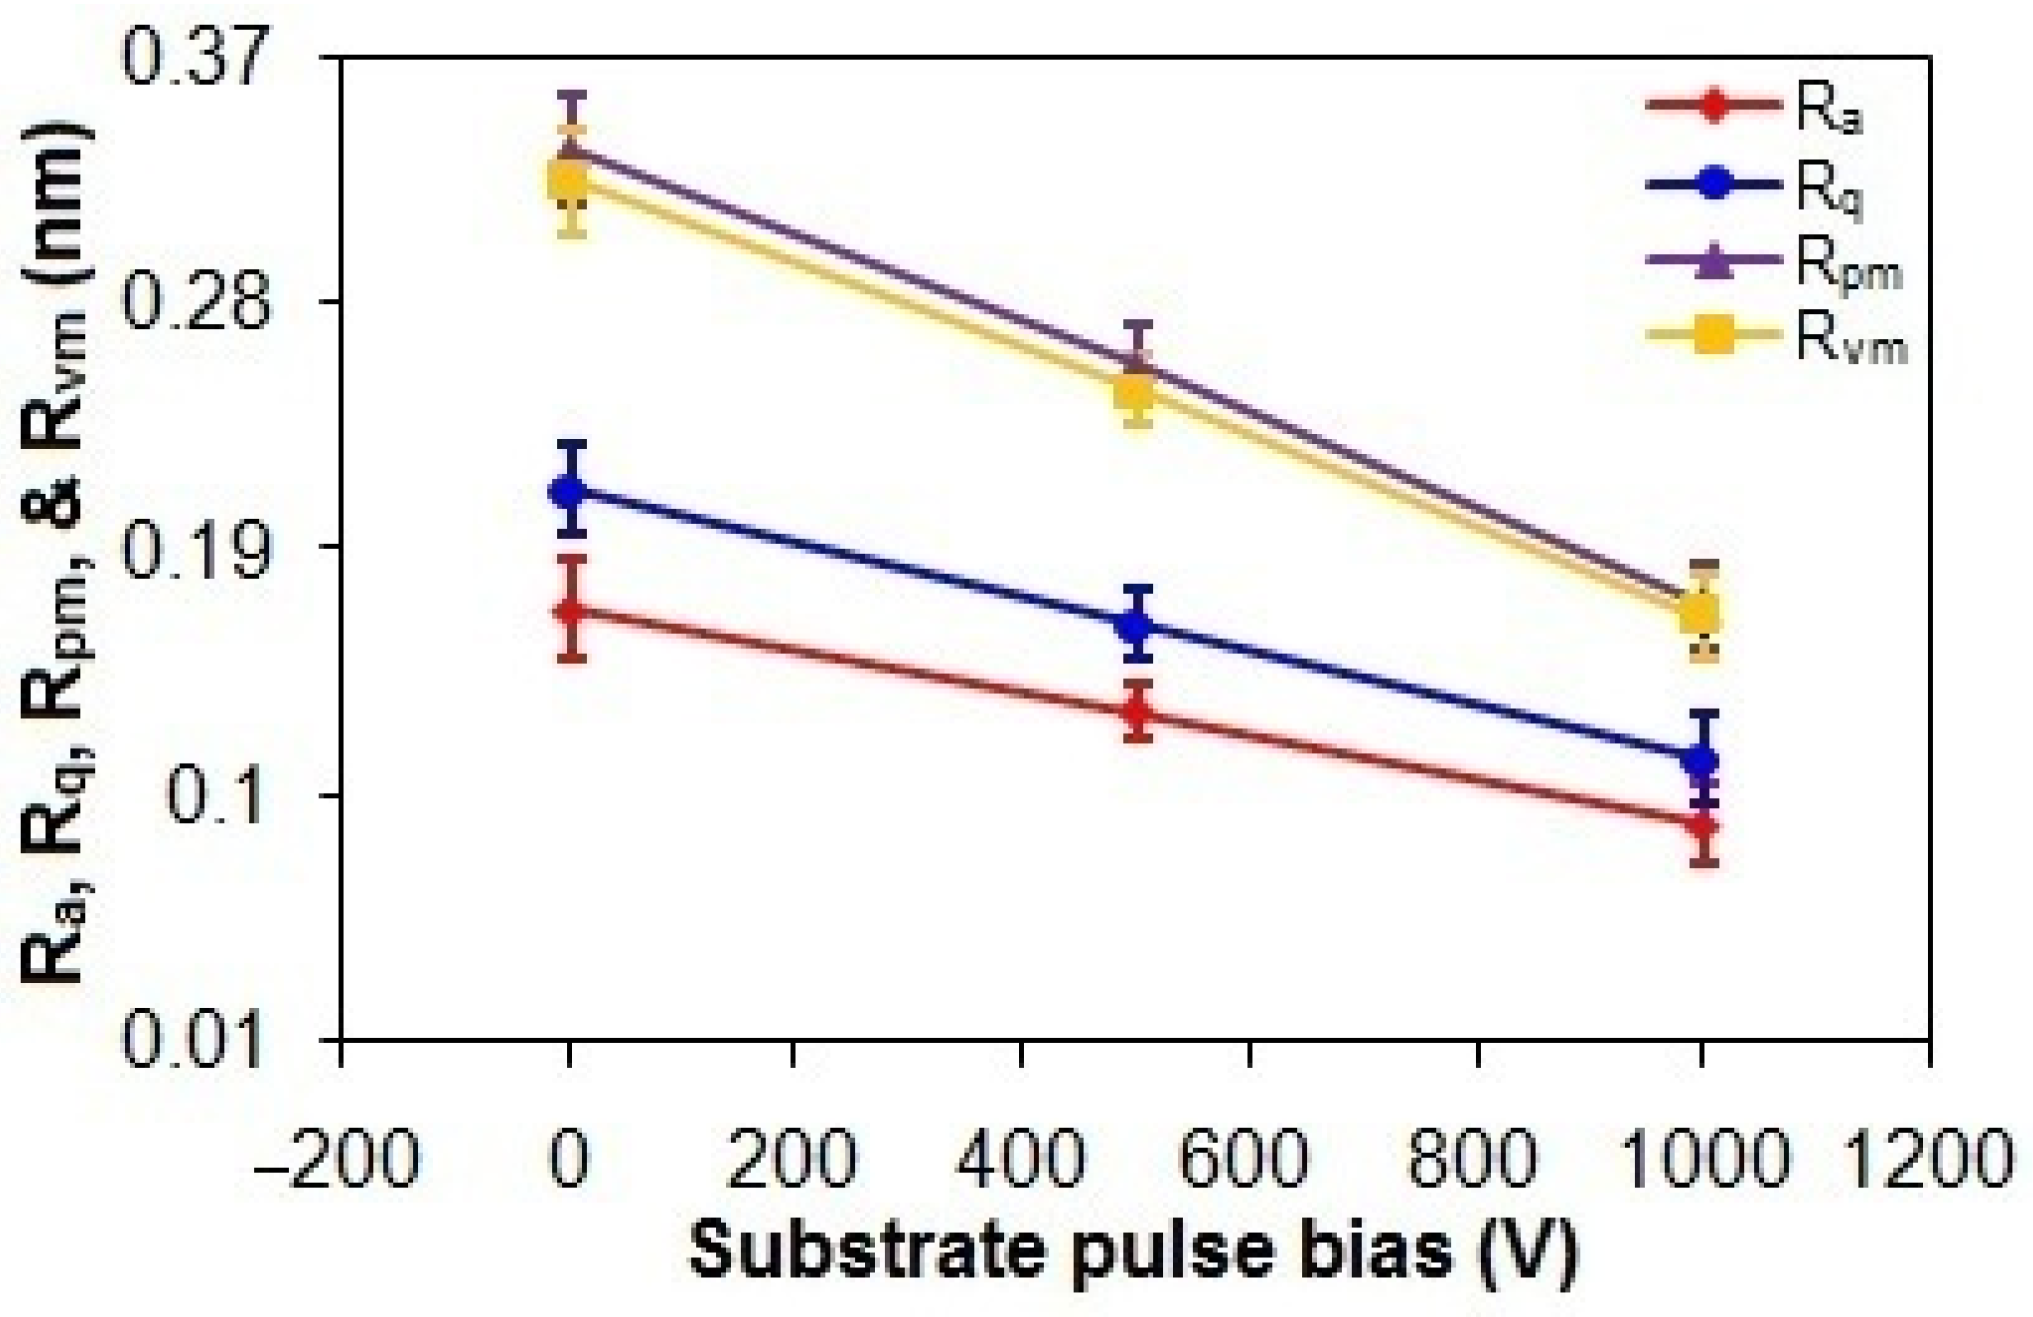
As shown in Figure 5, the Ra and Rq values of the ta-C thin films progressively decrease from 0.17 nm and 0.21 nm to 0.09 nm and 0.11 nm, respectively, with an increasing substrate pulse bias from 0 to 1000 V. While higher graphitization in carbon-based films is typically correlated to elevated surface roughness due to reduced film density from increased sp2 content [3,40], the observed reduction in roughness with higher substrate pulse bias contradicts this conventional expectation. This suggests that graphitization-induced morphological effects are secondary to deposition kinetics in this system. Specifically, the energetic bombardment of C species during deposition flattens the surface, effectively counteracting roughness-induced graphitization effects [3,41]. This is also supported by the reductions in the Rpm and Rvm values from 0.34 nm and 0.32 nm to 0.17 nm and 0.16 nm, respectively, with an increased substrate pulse bias from 0 V to 1000 V [41].
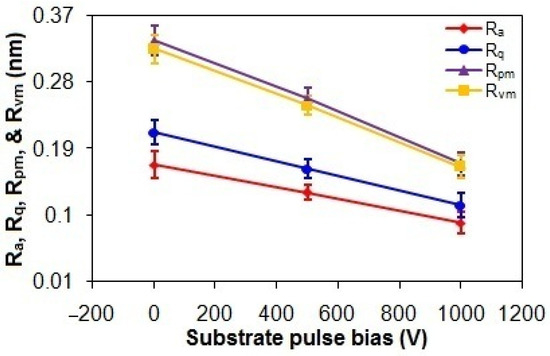
Figure 5.
Ra, Rq, Rpm, and Rvm values of taC thin films with different substrate pulse biases.
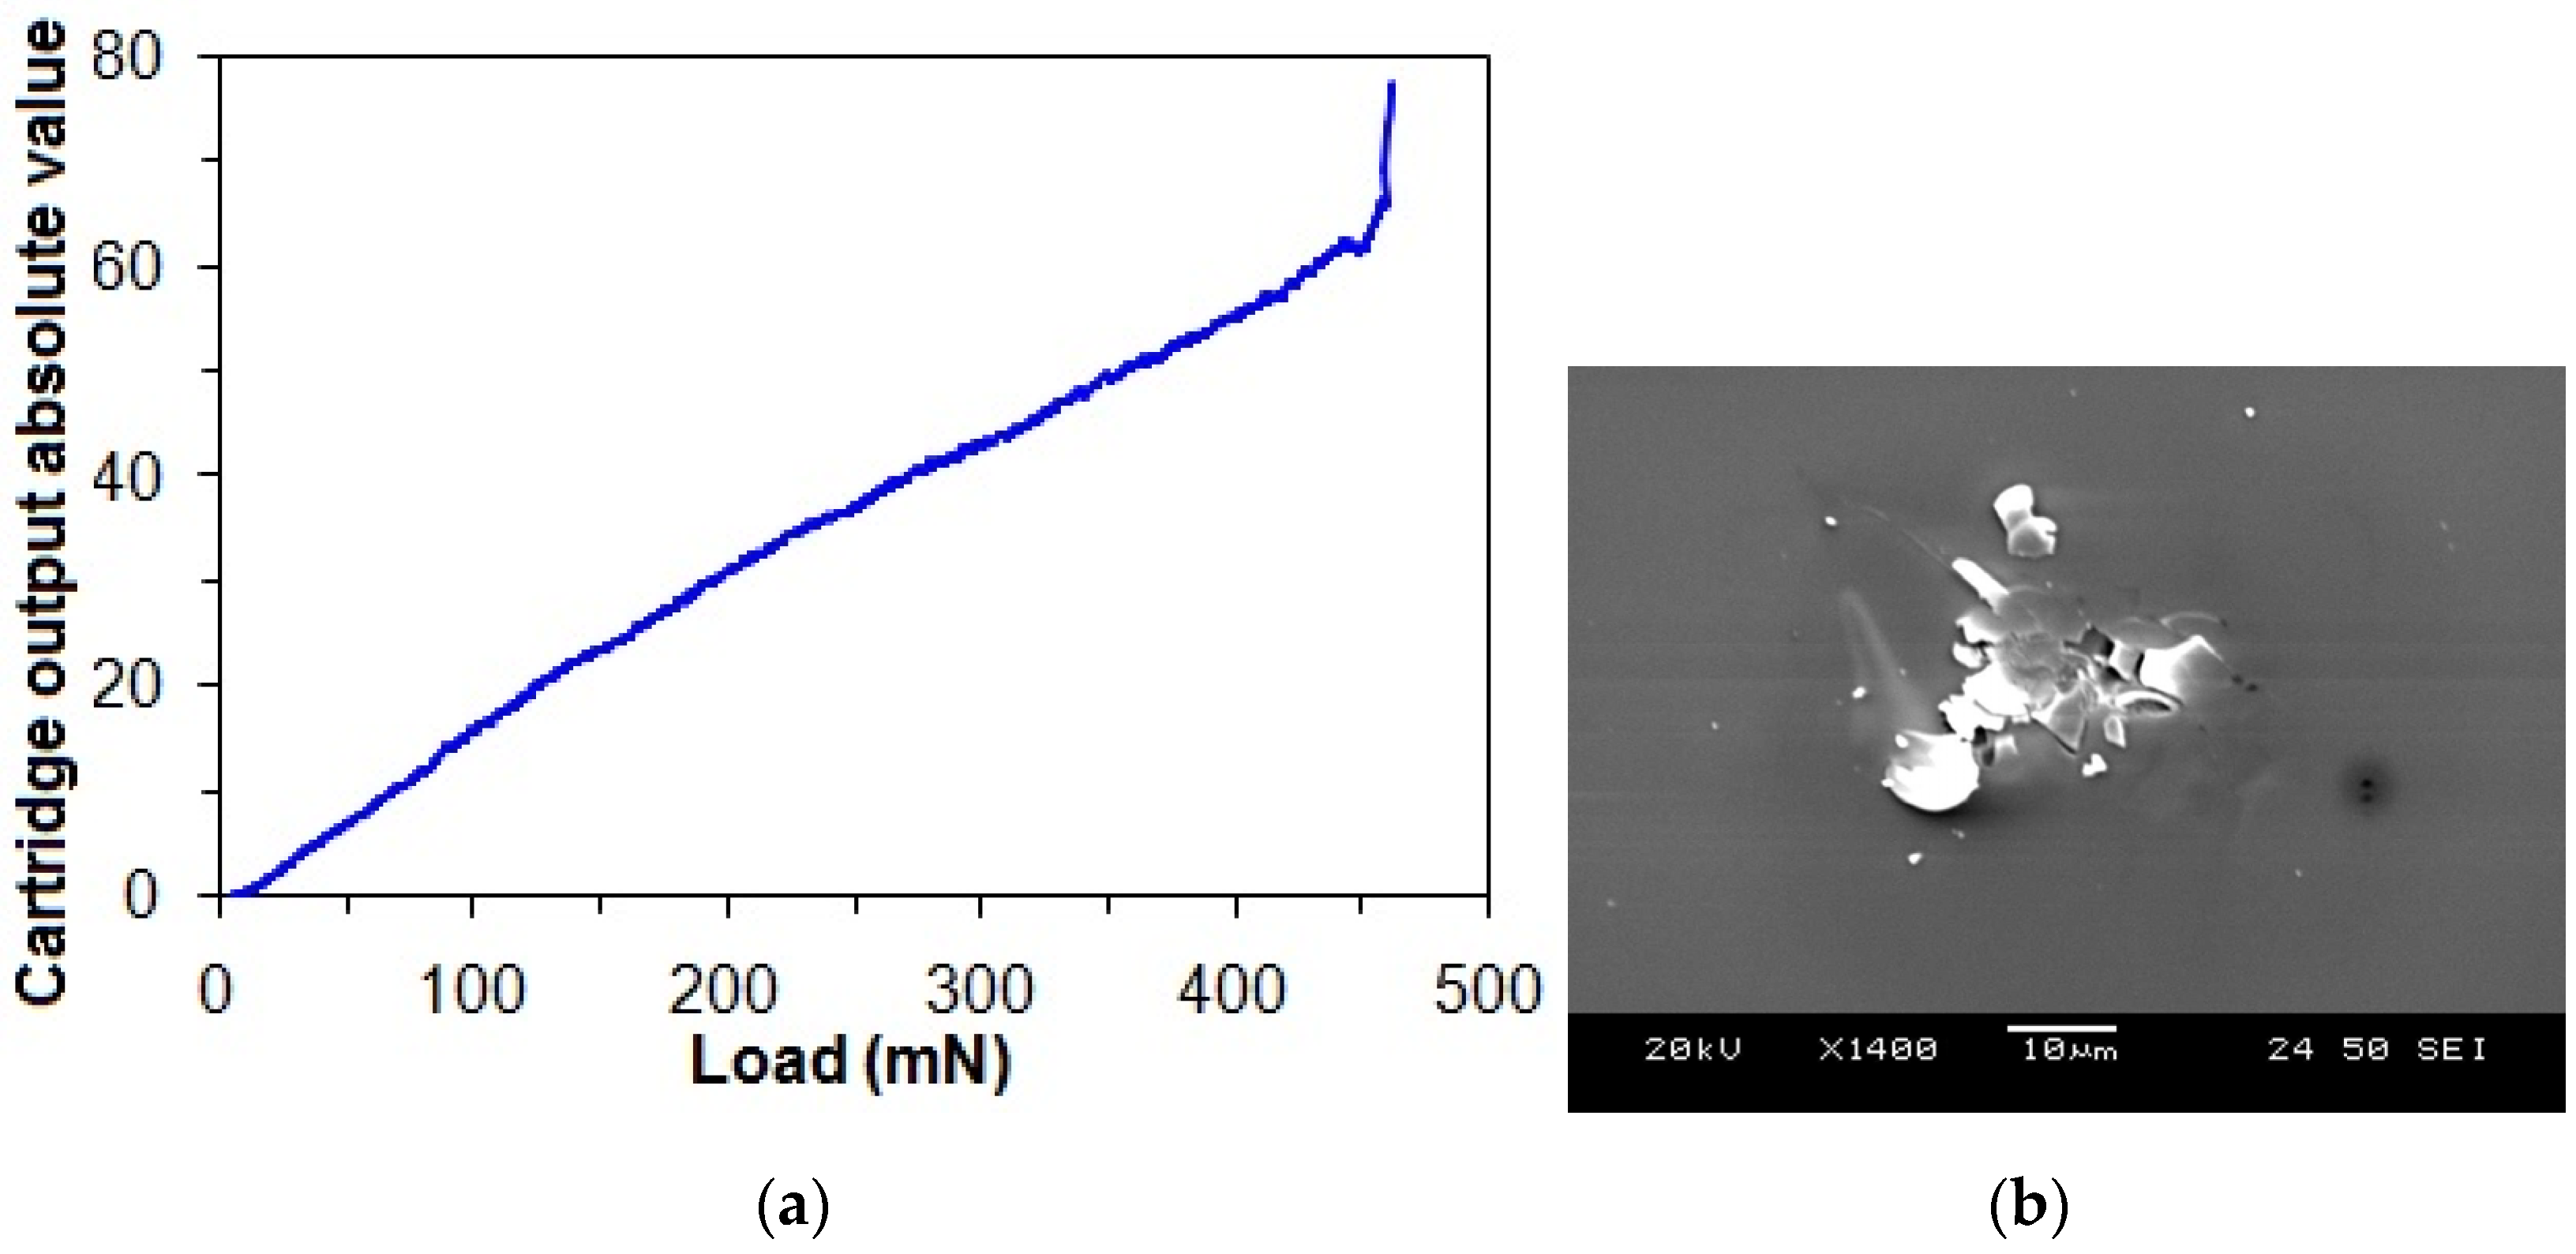
Figure 6a shows the representative progressive loading curve of the taC thin film with a substrate pulse bias of 1000 V, in which a critical load is taken from an abrupt change in the output signal, which is associated with an instant adhesive failure between the film and substrate. Therefore, the critical load is taken as a measure of film adhesion strength. There is no observation of any apparent changes in the trend of output signal versus load before the critical load (Figure 6a), and an observation of a microcrack only at the critical load implies that the cohesive strength of the taC thin film is strong enough to withstand scratch-induced damage until its adhesive failure occurs at the critical load.
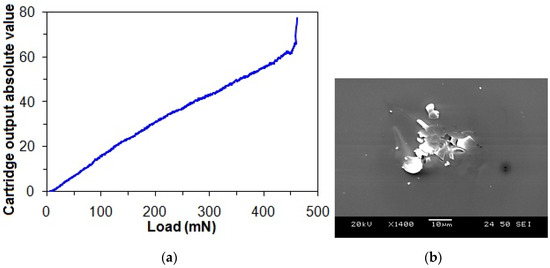
Figure 6.
(a) Progressive loading curve of taC thin film with a substrate pulse bias of 1000 V and (b) microcrack observed at its critical load.
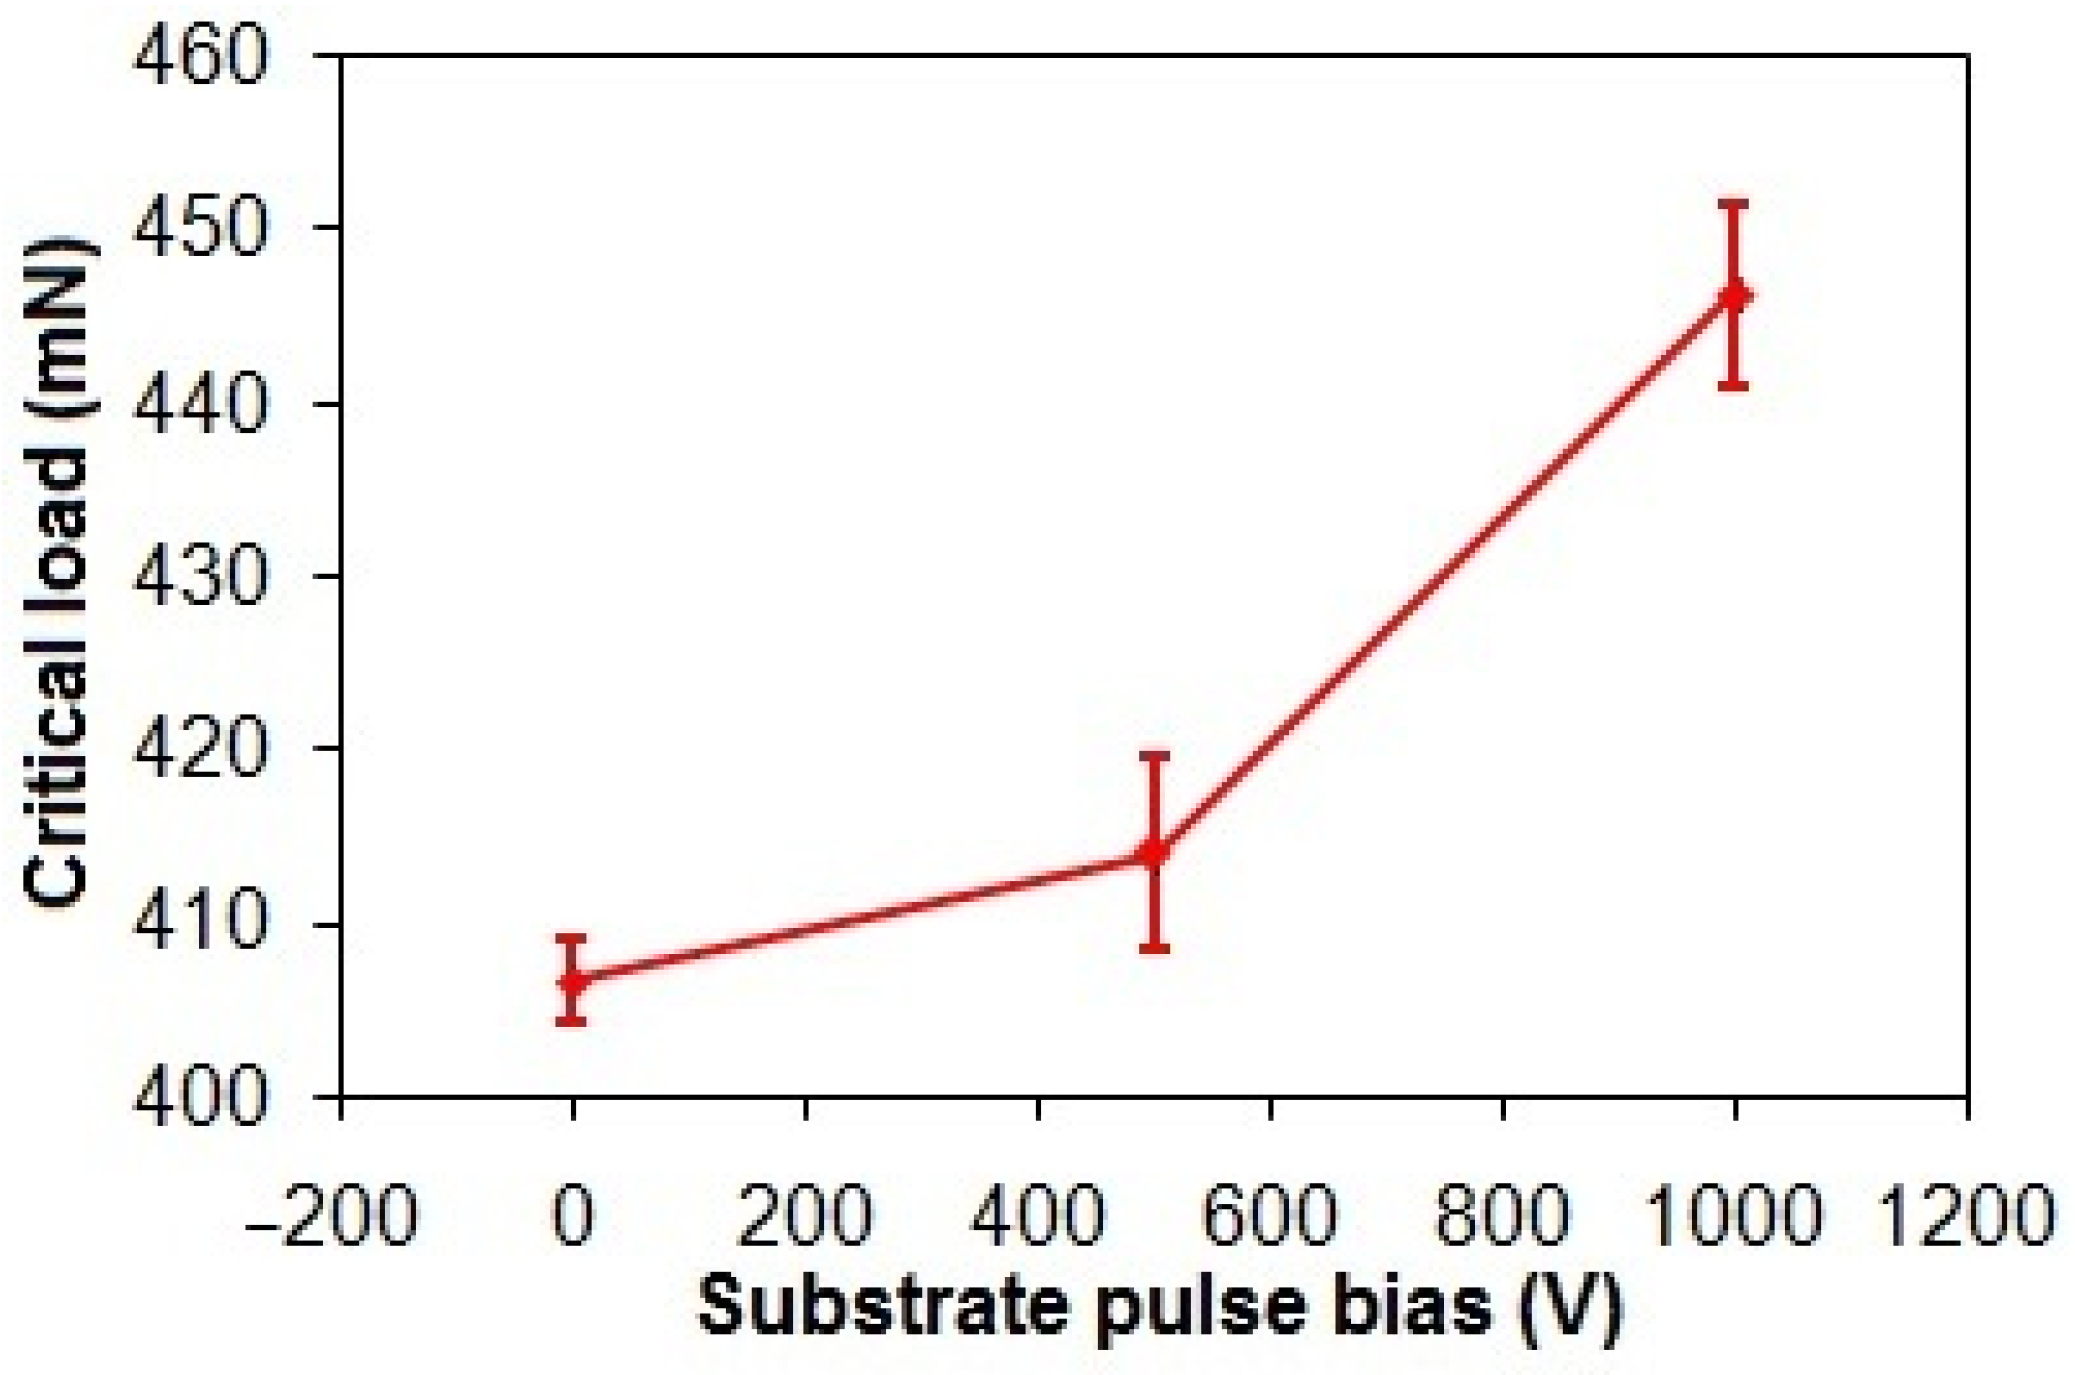
Figure 7 demonstrates a 9.9% increase in the critical loads of the taC thin films from 406 mN to 446 mN as the substrate pulse bias rises from 0 V to 1000 V. This elevation in critical load directly correlates to enhanced interfacial adhesion strength. Generally, the energetic bombardment of C species forms a rigid sp3-bonded cross-linking network that is responsible for high residual stress in the taC thin film [3,42]. However, the enhanced adhesion strength of the ta-C thin films observed with increasing substrate pulse bias is attributed to their progressive graphitization. This structural transition, marked by a reduction in sp3-bonded cross-linking and an elevated proportion of sp2-bonded configurations, reduces residual stress, thereby improving interfacial adhesion [43,44].
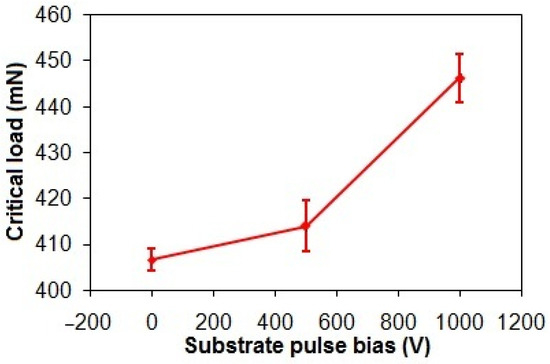
Figure 7.
Critical loads of taC thin films with different substrate pulse biases.
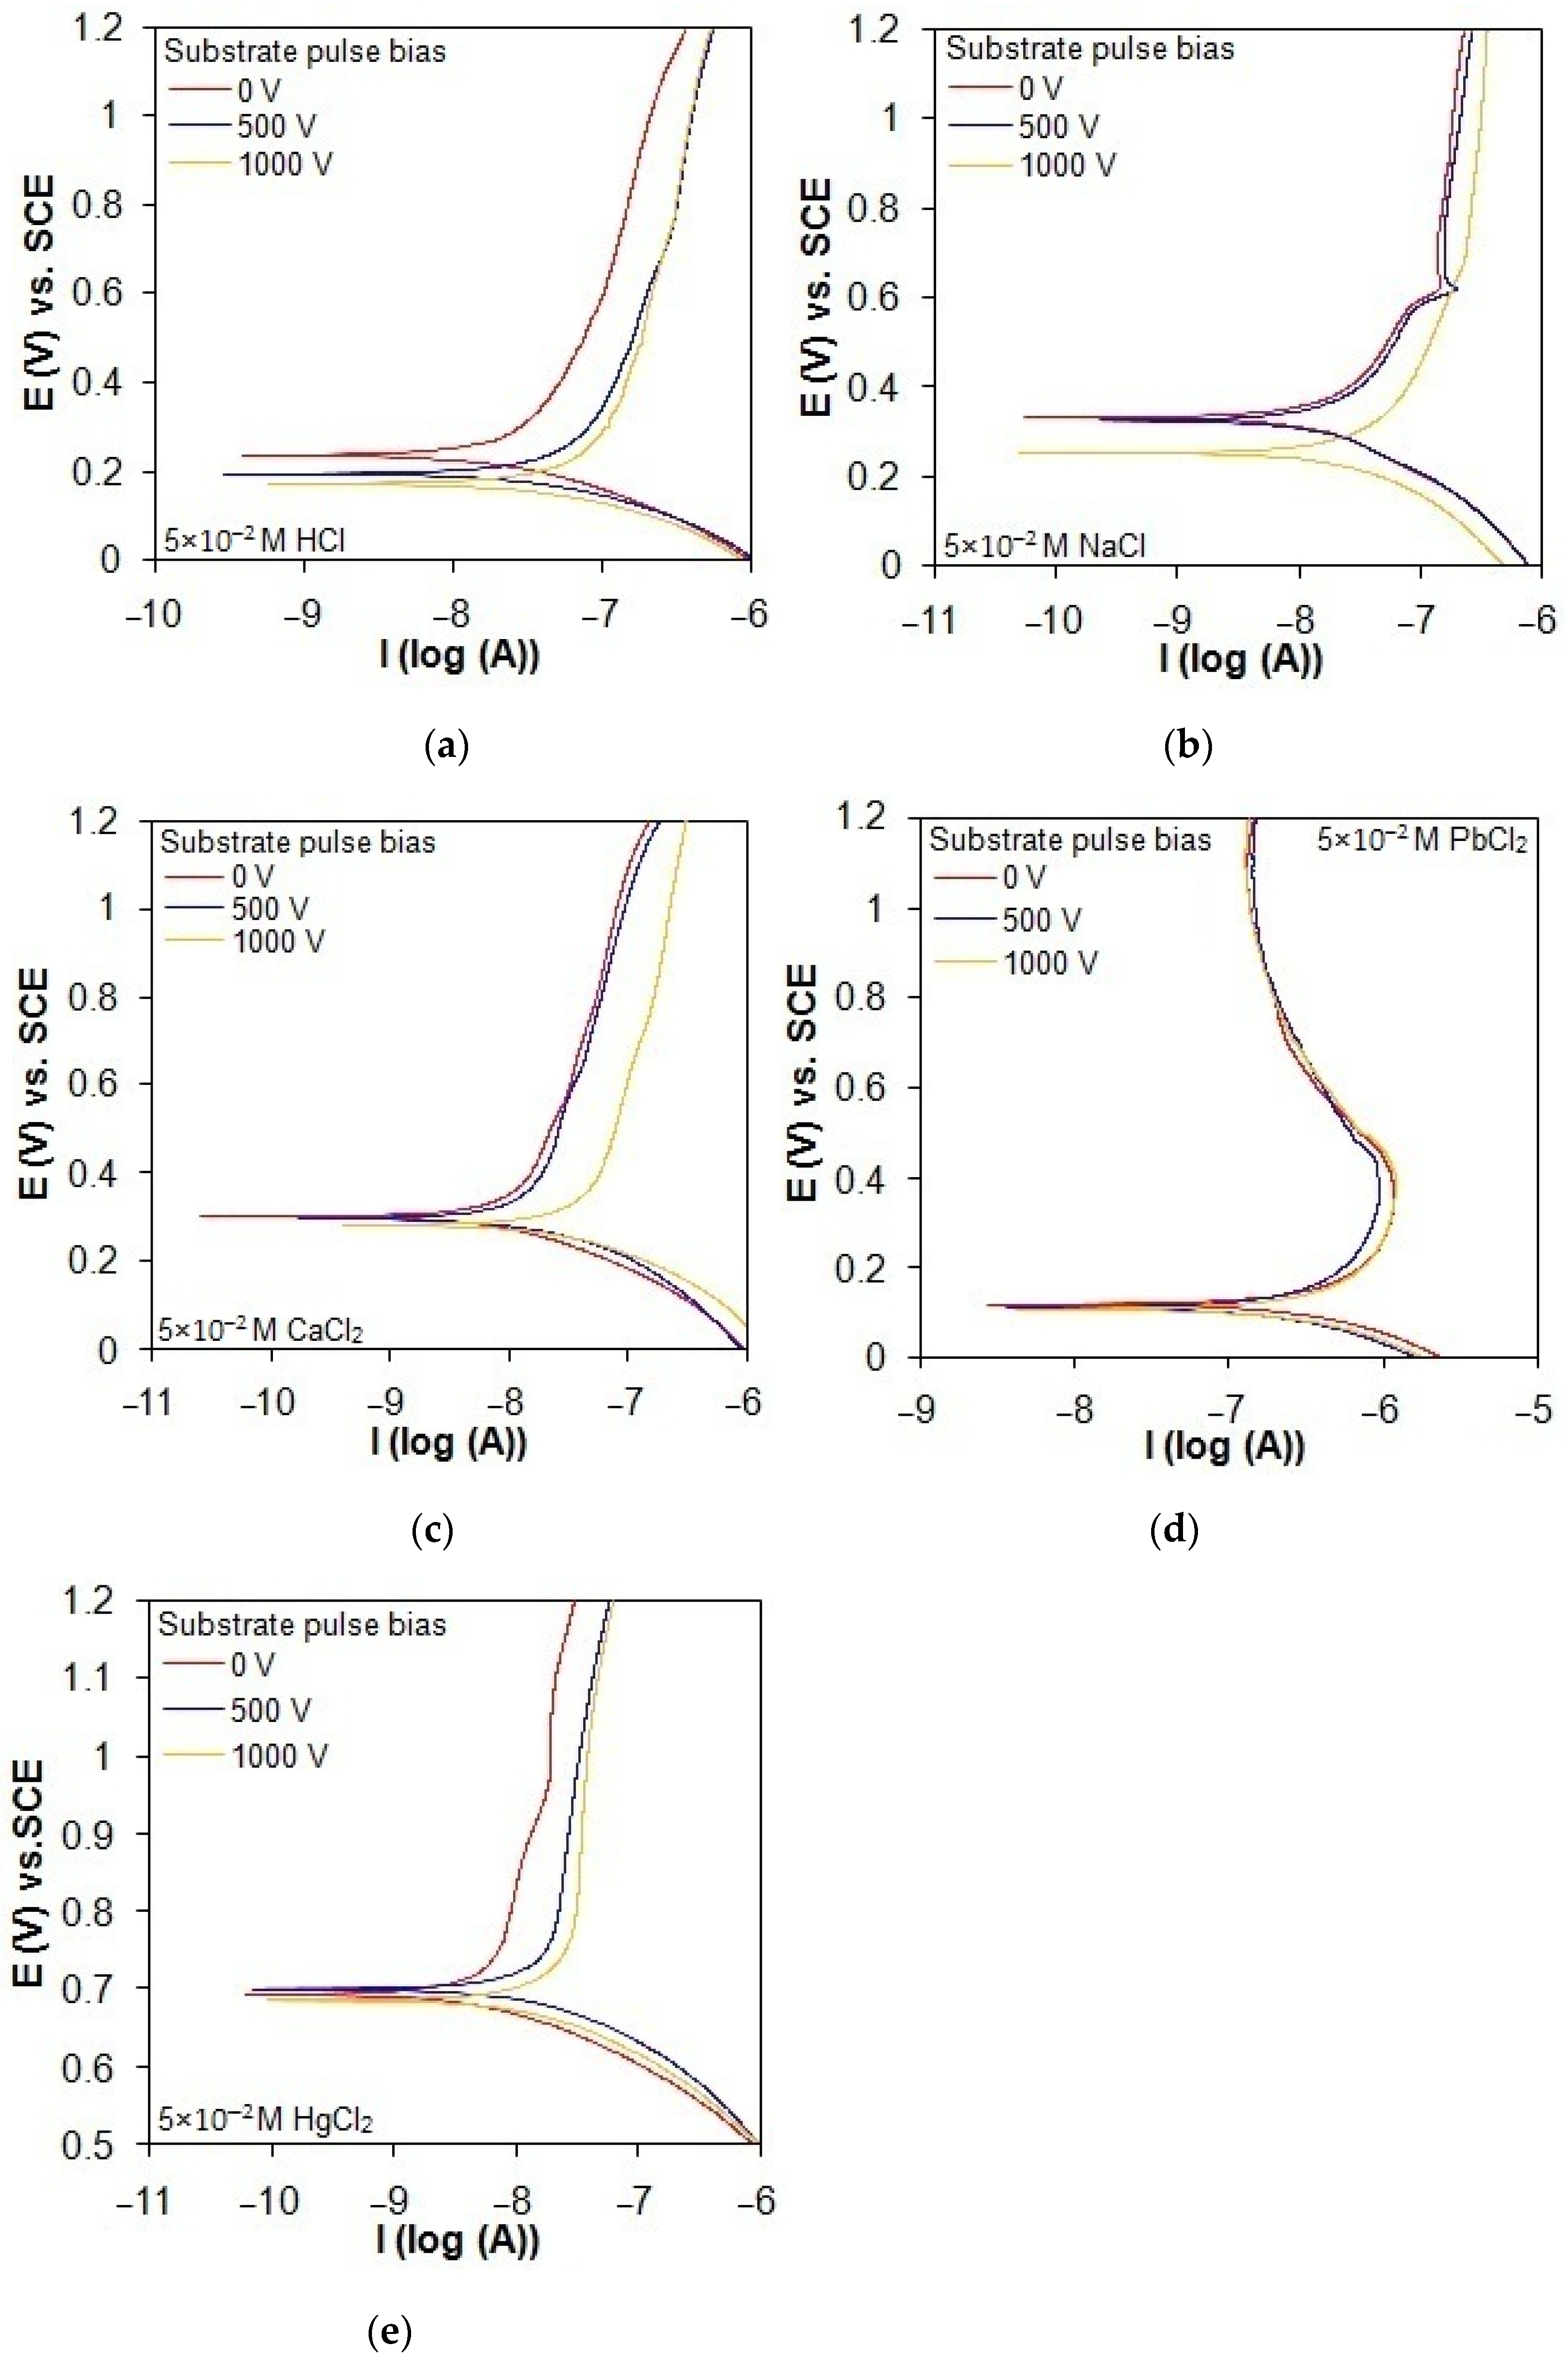
The potentiodynamic polarization behavior of the taC thin films deposited with different substrate pulse biases, evaluated in acidic and chloride solutions, is shown in Figure 8a–e. The polarization curves of the taC thin films with higher substrate pulse biases exist at smaller positive potentials and higher currents in all the solutions, indicating that the use of higher substrate pulse bias during the film depositions produces them with lower corrosion resistance in the solutions. The reason is that the taC thin films with higher substrate pulse biases have more degraded sp3-bonded cross-linking structures for their more readily anodic dissolution in the solutions [13,16,22,45]. Although the cathodic branches of the taC thin films are not apparently affected by different substrate pulse biases in all the solutions, their anodic branches seem to shift to higher currents with higher substrate pulse biases, as found in Figure 8a–e, thanks to their lower resistance to anodic dissolution. The taC thin films with different substrate pulse biases exhibit a steady increase in their anodic currents when shifting the applied potential to more positive values in the HCl, CaCl2, and HgCl2 solutions, as found in Figure 8a, Figure 8c, and Figure 8e, respectively, due to their stable corrosion. However, the taC thin films with substrate pulse biases of 0 V and 500 V show a breakdown in the NaCl solution at a potential of about 0.6 V vs. SCE, which is confirmed by an abrupt increase in their anodic currents in Figure 8b. In Figure 8d, the taC thin films tested in the PbCl2 solution have an apparent decrease in their anodic currents after the potential of 0.4 V vs. SCE as a result of their passivation behavior, with the formation of PbCl2 deposits on their surfaces [46].
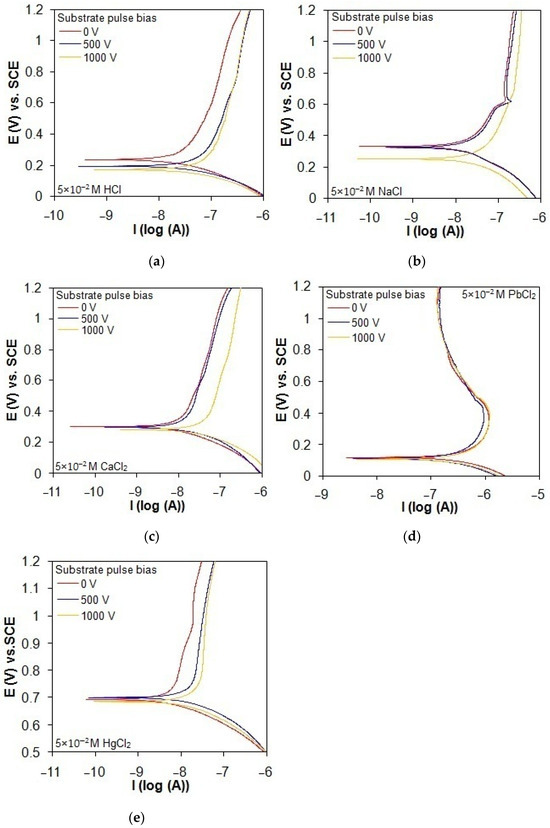
Figure 8.
Potentiodynamic polarization curves of taC thin films with different substrate pulse biases measured in (a) 5 × 10⁻² M HCl solution, (b) 5 × 10⁻² M NaCl solution, (c) 5 × 10⁻² M CaCl2 solution, (d) 5 × 10⁻² M PbCl2 solution, and (e) 5 × 10⁻² M HgCl2 solution at a scan rate of 0.8 mV/s.
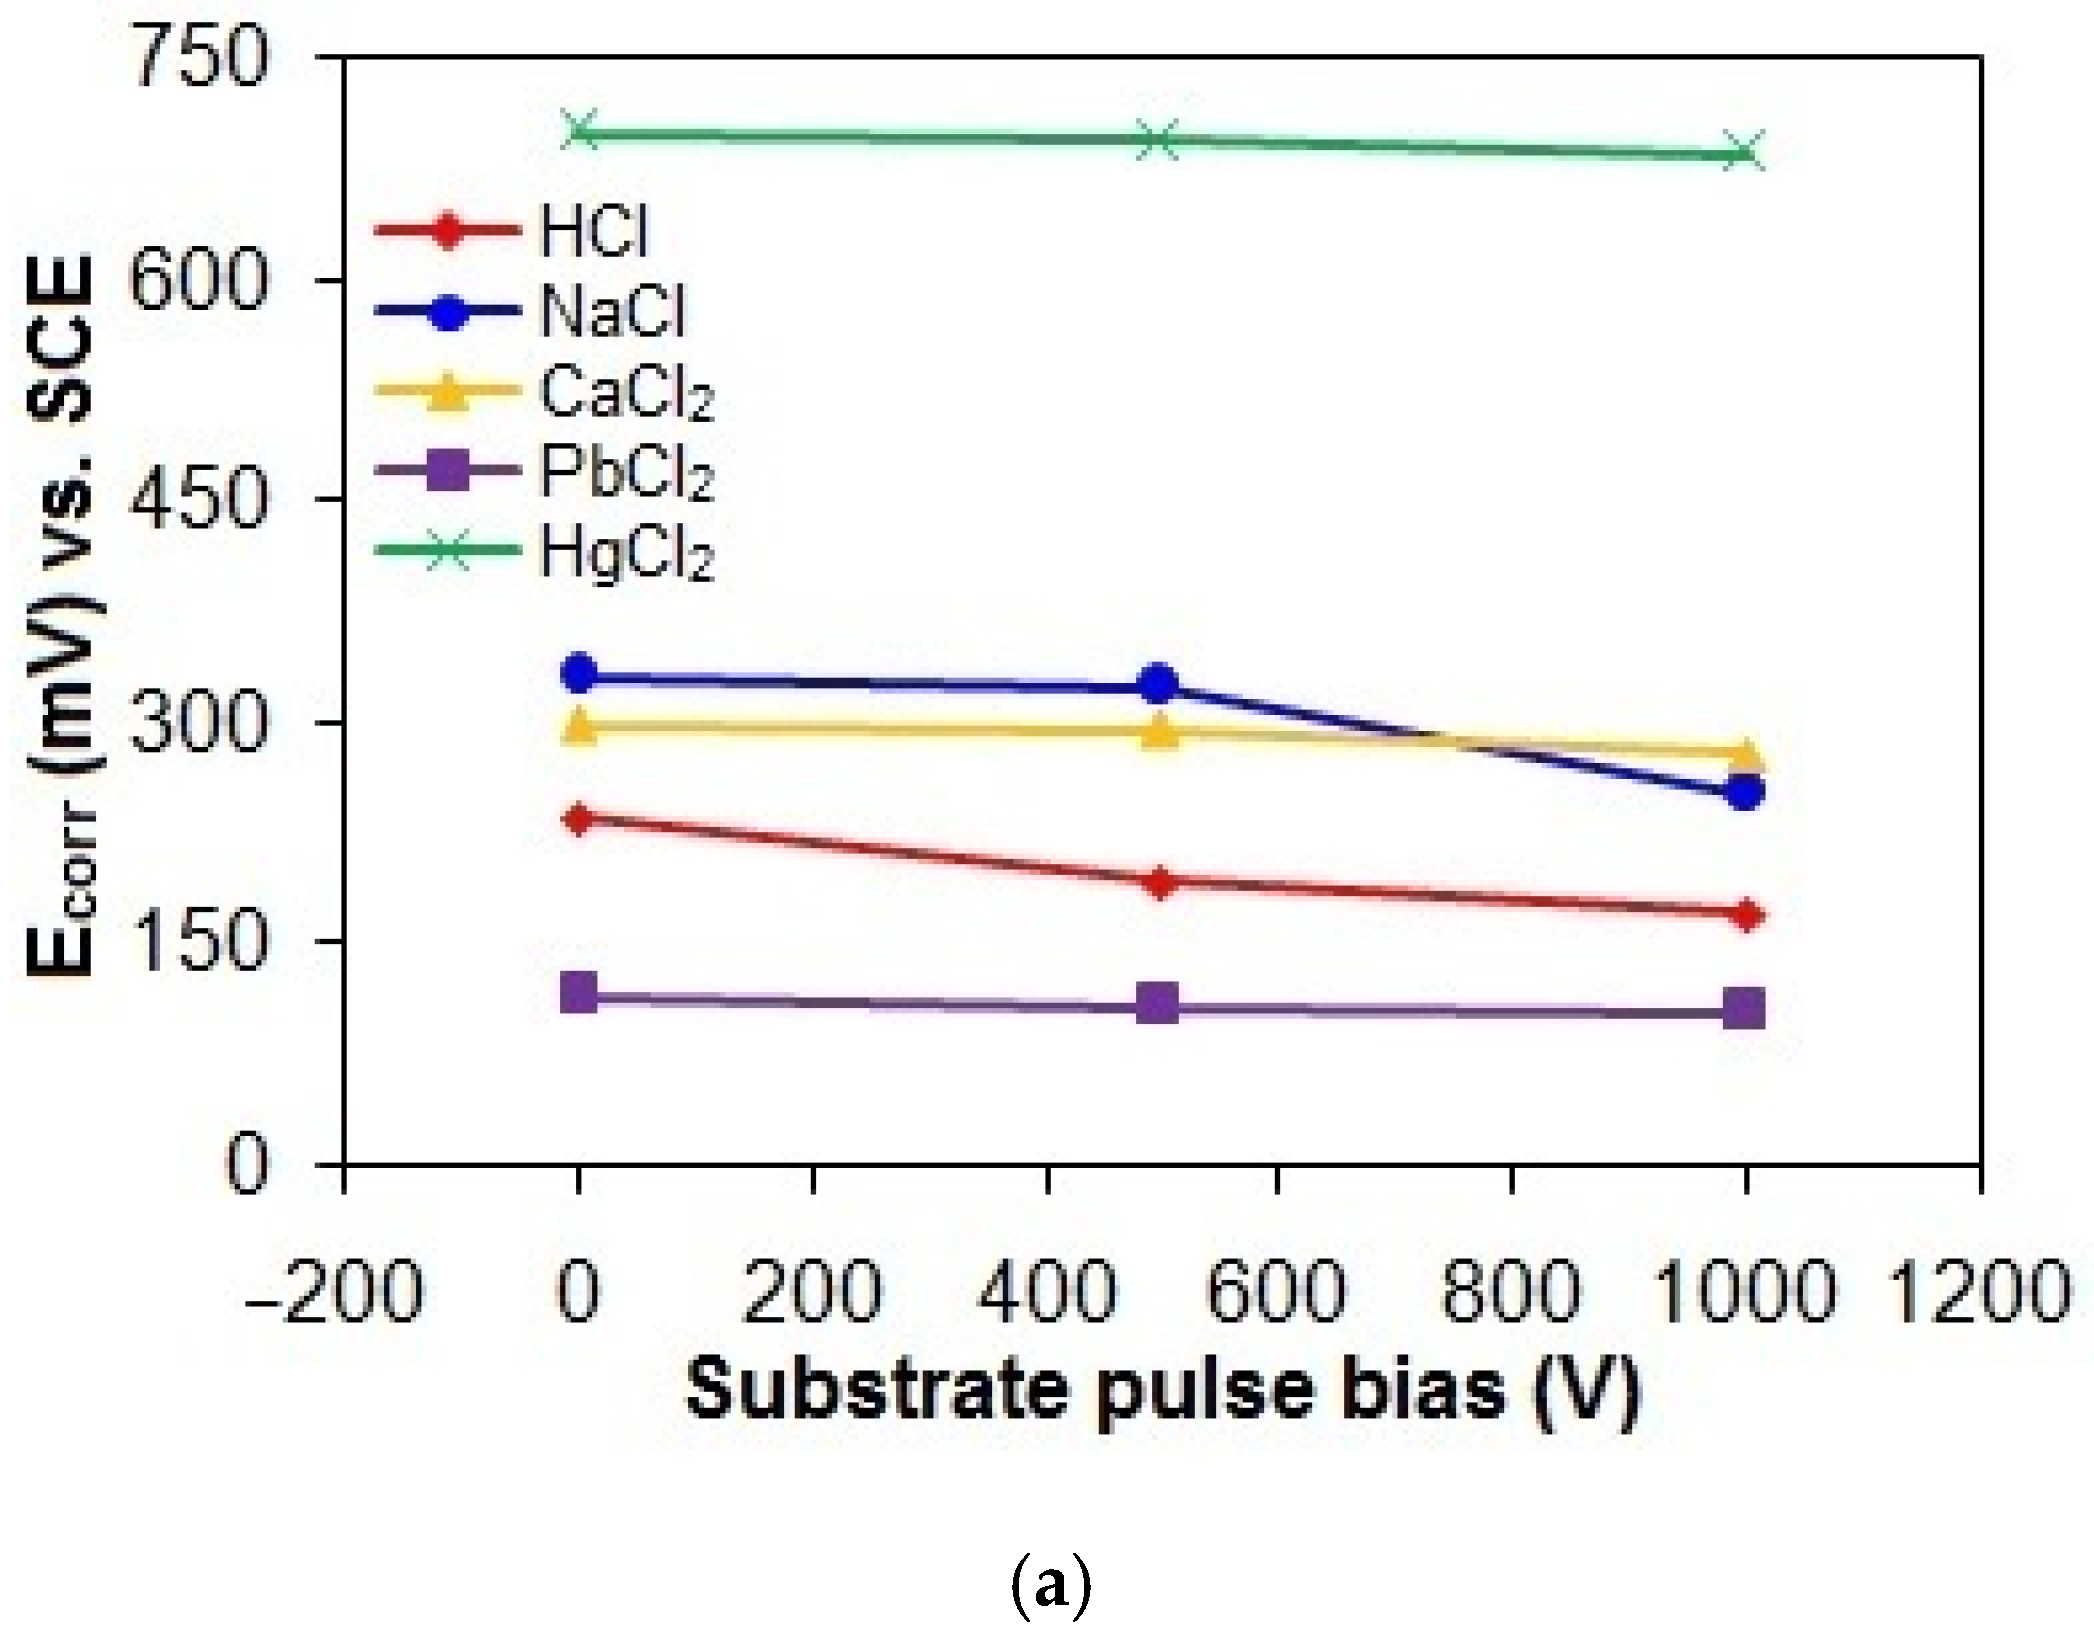
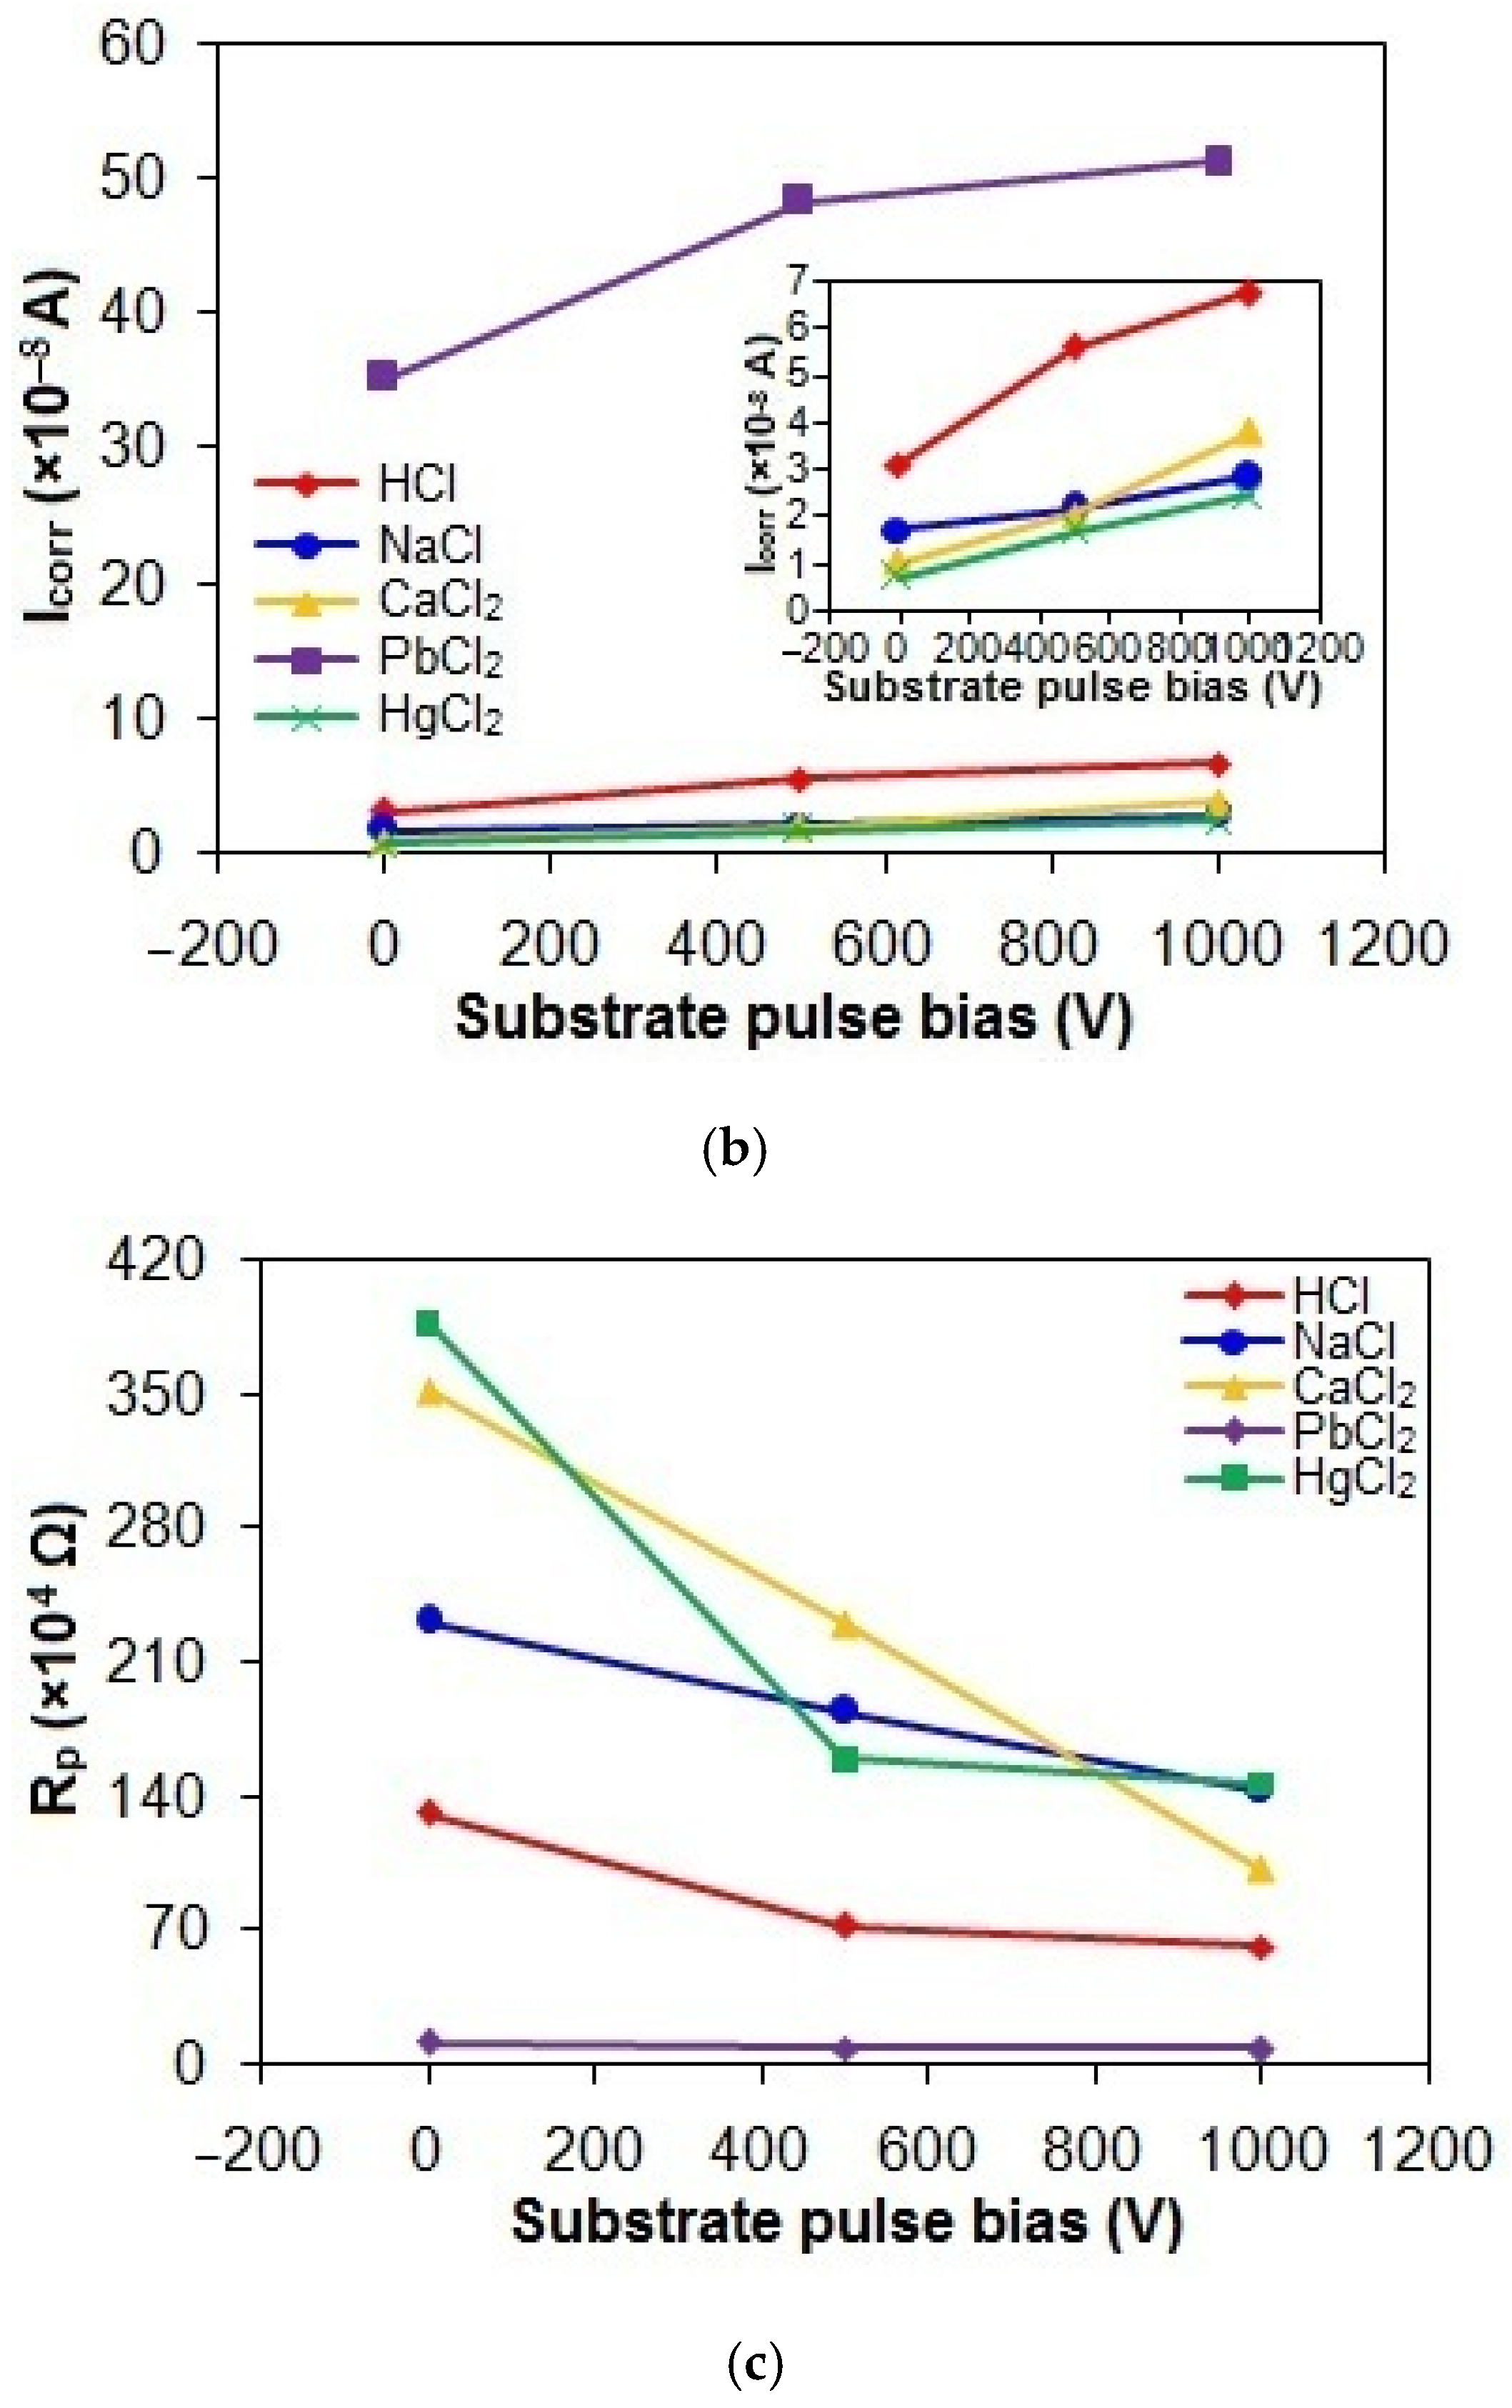
Figure 9a–c shows the Ecorr, Icorr, and Rp values of the taC thin films with different substrate pulse biases measured in the acidic and chloride solutions. The Ecorr, Icorr, and Rp values of the taC thin films in the HCl solution are 236 mV vs. SCE, 3.12 × 10⁻⁸ A, and 131.73 × 10⁴ Ω; 193 mV vs. SCE, 5.56 × 10⁻⁸ A, and 72.84 × 10⁴ Ω; and 171 mV vs. SCE, 6.73 × 10⁻⁸ A, and 62.07 × 10⁴ Ω for the substrate pulse biases of 0 V, 500 V, and 1000 V, respectively. When they are tested in the NaCl solution, their Ecorr, Icorr, and Rp values are 332 mV vs. SCE, 1.73 × 10⁻⁸ A, and 231.31 × 10⁴ Ω; 325 mV vs. SCE, 2.15 × 10⁻⁸ A, and 184.53 × 10⁴ Ω; and 252 mV vs. SCE, 2.85 × 10⁻⁸ A, and 143 × 104 Ω for the substrate pulse biases of 0 V, 500 V, and 1000 V, respectively. The Ecorr, Icorr, and Rp values of the taC thin films in the CaCl2 solution are 299 mV vs. SCE, 1.02 × 10⁻⁸ A, and 351.92 × 10⁴ Ω; 295 mV vs. SCE, 2.05 × 10⁻⁸ A, and 230.26 × 10⁴ Ω; and 280 mV vs. SCE, 3.81 × 10⁻⁸ A, and 102.13 × 10⁴ Ω for the substrate pulse biases of 0 V, 500 V, and 1000 V, respectively. Their more positive Ecorr, smaller Icorr, and larger Rp in the NaCl and CaCl2 solutions clearly indicate that they have lower corrosion in the chloride solutions than in the acidic solution.
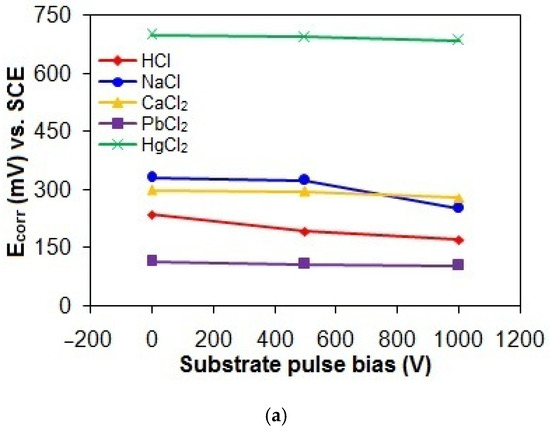
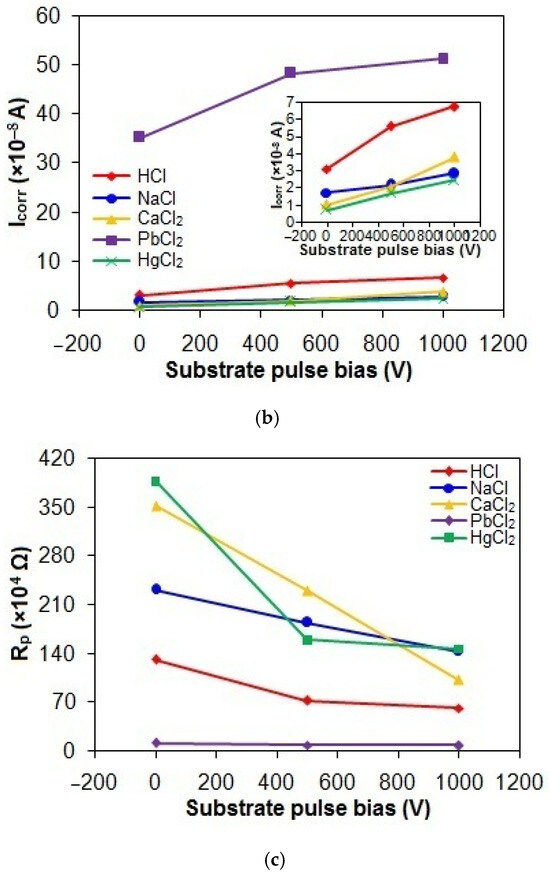
Figure 9.
(a) Ecorr, (b) Icorr, and (c) Rp values of taC thin films with different substrate pulse biases measured in acidic and chloride solutions.
In the corrosion mechanism, the anodic dissolution of film materials releases ions and electrons, and the released electrons pass through the bulk of the film to cathodic sites on the film surface where cathodic reactions of hydrogen (H+) ions dissociated from HCl (HCl → H+ + Cl−), hydronium (H3O+) ions produced via the protonation of H2O by HCl (HCl + H2O → H3O+ + Cl−), and dissolved O2 in the HCl solution discharge them via 2H+ + 2e− → H2↑, 2H3O+ + 2e− → H2O + H2↑, and O2 + 4H+ + 4e− → 2H2O, respectively [13,47,48]. Therefore, the high concentration of H+ ions accelerates the corrosion of the taC thin films in the HCl solution [13]. Compared to the HCl solution, the NaCl and CaCl2 solutions have a much lower concentration of H+ ions, since they contain only H+ ions dissociated from water molecules (H2O → OH− + H+) [13]. This is supported by the more positive Ecorr of the taC thin films in both chloride solutions associated with the lower concentration of H+ ions according to the Nyquist equation [26]. As a result, the taC thin films exhibit lower corrosion in both chloride solutions than in the acidic solution, although Cl− ions in these solutions are still corrosive in their own right [13,23,47,48].
The electrochemical reactions of Na+ and Ca2+ ions with water molecules produce hydroxides via 2Na+ + 2H2O + 2e− → H2 + 2NaOH and Ca2+ + 2H2O + 2e− → H2 + Ca(OH)2, respectively, as the pH values of the NaCl and CaCl2 solutions are not adjusted [49]. The resulting hydroxide species near the taC film surfaces serve as a barrier layer between electrochemically active species (EASs) (positively and negatively charged ions, etc.) and the film surfaces, resulting in lower corrosion of the films in both chloride solutions than in the acidic solution.
The taC thin films exhibit lower corrosion in the CaCl2 solution than in the NaCl solution, indicating the less corrosive effect of the liquid CaCl2, which is further supported by the occurrence of their breakdown only in the NaCl solution, as shown by the comparison of Figure 8b,c [50,51]. Generally, the solution adjacent to the film surface always contains water molecules and EASs, so its electrochemistry is different from that of the bulk solution. During corroding, released electrons accumulate negative charges on the film surface, which in turn attracts positively charged ions from the surrounding areas. Subsequently, discharging positively charged ions facilitates the oxidation of film materials. However, the adsorption of water molecules on the film surface and the hydration of ions near the film surface prevents the discharging of positively charged ions by electrons, thereby hindering the corrosion process [49]. It can be seen that Ca2+ ions have a greater positive charge than Na+ ions to get more easily hydrated by exerting a stronger electrostatic attraction on dipolar water molecules. It is therefore hypothesized that the existence of the larger number of hydrated Ca2+ ions near the taC thin film surfaces results in the lower corrosion of the films in the CaCl2 solution than in the NaCl solution by forming a thicker barrier layer between EASs and the film surfaces. In addition, the lower solubility (0.173 g/100 mL at 20 °C) of Ca(OH)2 in the aqueous solution compared to that (111 g/100 mL at 20 °C) of NaOH results in the larger amount of Ca(OH)2 species near the taC thin film surfaces, contributing to the lower corrosion of the films in the CaCl2 solution than in the NaCl solution [49].
The Ecorr, Icorr, and Rp values of the taC thin films measured in the PbCl2 solution are 116 mV vs. SCE, 35.23 × 10⁻⁸ A, and 11.55 × 10⁴ Ω; 108 mV vs. SCE, 48.28 × 10⁻⁸ A, and 9.18 × 10⁴ Ω; and 105 mV vs. SCE, 51.17 × 10⁻⁸ A, and 8.48 × 10⁴ Ω for the substrate pulse biases of 0 V, 500 V, and 1000 V, respectively, which are indicative of their highest corrosion in the PbCl2 solution. During shifting the potential from negative to positive values, the reduction of Pb2+ ions (PbCl2 → Pb2+ + 2Cl−) in the solution deposits Pb atoms on the film surfaces via Pb2+ + 2e− → Pb, so Pb deposits contribute to the overall anodic currents of the films via an anodic reaction of Pb → Pb2+ + 2e−, resulting in the highest corrosion of the films in the PbCl2 solution [52,53]. The lowest positive Ecorr values of the taC thin films in the PbCl2 solution are also probably attributed to the corrosion potential of Pb deposits on their surfaces [52,53].
In Figure 9, the taC thin films exhibit the lowest corrosion in the HgCl2 solution, which is confirmed by their Ecorr, Icorr, and Rp values of 700 mV vs. SCE, 0.73 × 10⁻⁸ A, and 387.44 × 10⁴ Ω for 0 V; 693 mV vs. SCE, 1.71 × 10⁻⁸ A, and 159.77 × 10⁴ Ω for 500 V; and 685 mV vs. SCE, 2.47 × 10⁻⁸ A, and 146.89 × 10⁴ Ω for 1000 V, respectively. It is known that the corrosion of taC thin films is greatly influenced by the concentration of EASs in an aqueous solution. Generally, the electrochemical reactions of the taC thin films consume EASs in the film/solution interface region, causing their concentration gradient between the interface and bulk regions. The steep concentration gradient of EASs facilitates the electrochemical dissolution reactions of the films by enhancing their transport to the film surfaces. Therefore, the lowest solubility of HgCl2 species in the aqueous solution among the chemicals used in this study results in the lowest concentration of EASs and thereby the lowest corrosion of the taC thin films through the lowest concentration gradient of EASs [18]. From the point of ionic conductivity view, the lowest solubility of HgCl2 species gives rise to the lowest ionic conductivity of the solution, which in turn results in the lowest mobility of EASs to electrochemically react with the taC films for the lowest corrosion of the latter. Furthermore, the limited solubility of HgCl2 species promotes their adsorption onto the film surfaces, which inhibits direct contact between the corrosive solution and the films. This shielding effect significantly reduces corrosion rates by obstructing electrolyte access. TaC thin films inherently exhibit structural defects, such as micropores, arising from a mismatch between C species’ deposition kinetics and surface adatom mobility during growth [54]. It is plausible that adsorbed corrosion products seal these surface pores, blocking diffusion pathways for the electrolyte to reach the underlying silicon substrate. This mechanism suppresses the rapid dissolution of the substrate and diminishes its contribution to the overall anodic current of the taC films [13,16,54]. The reaction of HgCl2 species with water molecules (HgCl2 + nH2O → [(H2O)nHgCl]+ + Cl−) in the aqueous solution can cause their hydration, so the hydrated species near the film surfaces retard the electrochemical dissolution reactions of the films by disturbing diffusion of EASs to the film surfaces [18]. At the same time, the possible formation of insoluble mercuric hydroxide (Hg(OH)2) species can also disturb the diffusion of EASs to the film surfaces. These are the reasons why the taC thin films show the lowest corrosion in the HgCl2 solution. The largest positive Ecorr values of the taC thin films in the HgCl2 solution are attributed to the corrosion potential of reduced Hg species (Hg2+ + 2e− → Hg) and their compounds deposited on the taC thin film surfaces because Hg is electrochemically nobler than C [49,55]. However, it should be noted that the existence of Hg or its compounds on the taC thin film surfaces can create anodic and cathodic sites with respect to their surroundings and may lead to the severe corrosion of the films during prolonged immersion in the HgCl2 solution, as found in Figure 1.
Nevertheless, the taC thin films consistently have lower corrosion in all the acidic and chloride solutions for the higher substrate pulse bias, as found in Figure 8 and Figure 9. Based on the Raman results in Figure 2 and Figure 3, increasing the substrate pulse bias increases the graphitization of the taC thin films, which means that the increased number of sp2 bonds increases the degradation of their sp3-bonded cross-linking networks and, thereby, their readily anodic dissolution [13,16,22,45]. It was reported that the electrical conductivity of taC thin film was associated with charge carrier hopping between sp2-hybridized sites in its amorphous carbon structure [22,56,57]. It is, therefore, hypothesized that the increased graphitization of the taC thin films increases the number of sp2 clusters in their C matrixes to increase the charge carrier hopping effect, resulting in their increased electrical conductivity. The promoted electrical conductivity of the taC thin films accelerates their anodic dissolution by facilitating the transport of released electrons through them [13,16,22,54]. Elevated substrate pulse bias likely intensifies the mismatch between the deposition kinetics of C species and the mobility of surface adatoms during taC film growth, thereby increasing pore density within the films [16,54]. These structural defects facilitate electrolyte permeation to the underlying Si substrates, enabling their anodic dissolution and amplifying the total anodic currents measured for the taC films. Consequently, the corrosion resistance of the taC films in the acidic and chloride electrolytes becomes lower with higher substrate pulse bias.
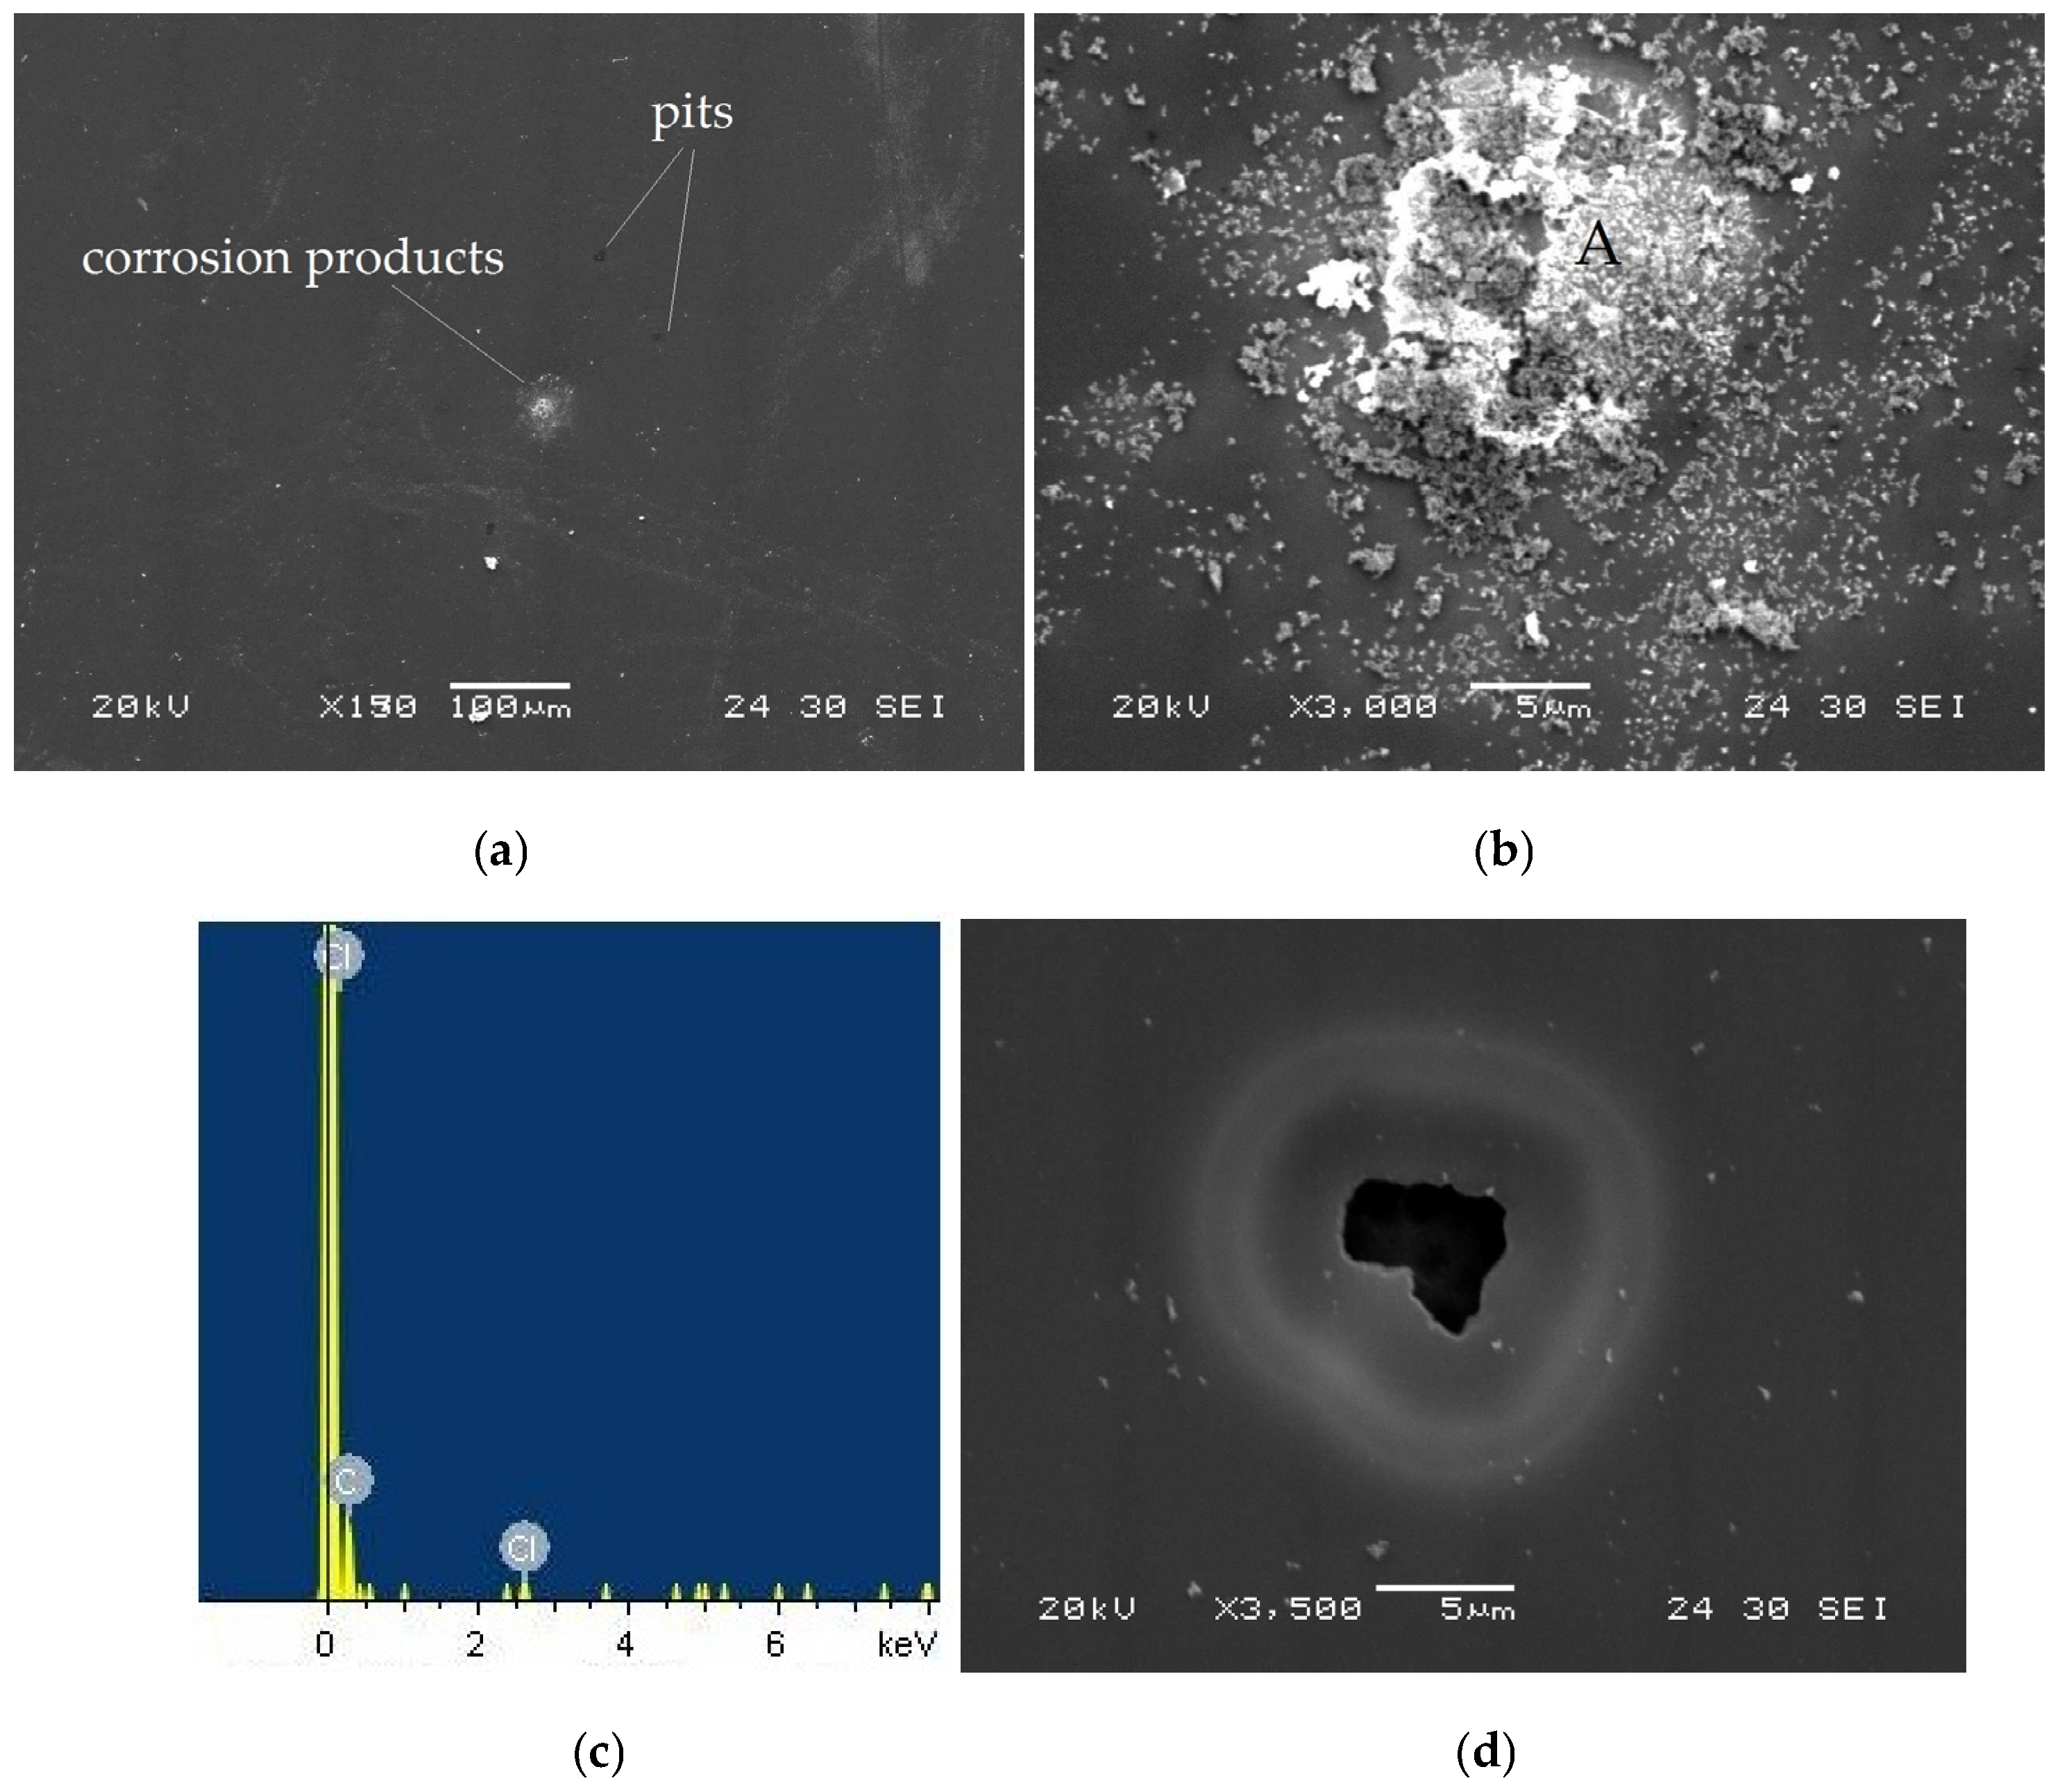
Figure 10a presents the surface morphology of the taC thin films deposited with a substrate pulse bias of 1000 V after electrochemical testing in an HCl solution. The taC thin film does not show any severe corrosion-induced surface damage, but, in Figure 10b, it has corrosion products on its surface, which result from its electrochemical reaction with the HCl solution, as confirmed by the observation of Cl and C peaks on the EDS spectrum of the products (Figure 9c) [13,16].
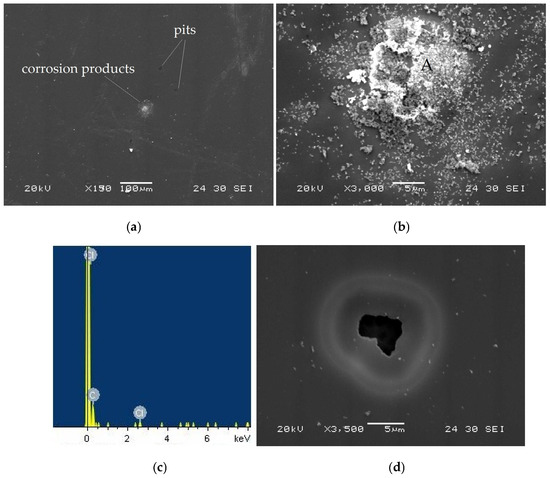
Figure 10.
(a) Surface morphology of taC thin film with a substrate pulse bias of 1000 V observed after potentiodynamic polarization measurement in a 5 × 10⁻² M HCl solution, (b) corrosion products on its surface, (c) EDX spectrum measured at location “A” in (b), and (d) pit observed on its surface.
The black spots on the taC thin film surface (Figure 10a) are pits formed during the corrosion test. This indicates that the taC thin film with 1000 V is susceptible to pitting corrosion in the HCl solution, which is further supported by the observed pit on its surface in Figure 10d. In the corrosion process, pores in the film grow and connect with adjacent pores to form pits [13,16]. As anodic dissolution progresses, the pits continue to expand, allowing the solution to penetrate deeper and reach the underlying Si substrate. This leads to its anodic dissolution and eventual undermining, as clearly shown in Figure 10d. The different electrochemical potentials of the film and substrate accelerate the anodic dissolution and undermining of the latter via galvanic corrosion between them [16,58]. The shape of the pit in Figure 10d also shows that the undermining rate of the Si substrate is higher than the anodic dissolution of the film, so the higher concentration of positively charged ions inside or around the pit attracts more negatively charged ions (Cl−). As a result, the solution inside the ring becomes more corrosive compared to the one outside the ring, thereby resulting in a higher anodic dissolution of the film inside than outside the ring, which is confirmed by the thinner film around the mouth of the pit. It is clear that the corrosion ring is the result of a transition from pitting corrosion to general corrosion [16].
In Figure 11a, the taC thin film with 1000 V tested in the NaCl solution does not have any apparent corrosion-induced surface damage except for corrosion products. The corrosion products formed on its surface in the NaCl solution (Figure 11b) are apparently dense, probably due to the formation of salt crystals via ionic attraction between Na+ and Cl− species adsorbed on its surface [59]. The observation of a pit on its surface (Figure 11c) is indicative of its susceptibility to pitting corrosion in the NaCl solution, but it seems to be less severe compared to the one in Figure 10d as a result of the lower anodic dissolution of the film in the NaCl solution.

Figure 11.
(a) Surface morphology of taC thin film with a substrate pulse bias of 1000 V observed after potentiodynamic polarization measurement in a 5 × 10⁻² M NaCl solution, and (b) corrosion product and (c) pit on its surface.
Figure 12a shows the taC thin film surface morphology with 1000 V tested in the CaCl2 solution, on which localized corrosion attack is found as marked with “B.” The EDS spectrum of the remaining at location B has Ca, Cl, and C peaks, indicating the involvement of Ca2+ and Cl− ions in the localized corrosion of the taC thin film. Such localized corrosion always initiates at structural defects, such as non-uniform distribution of sp2 and sp3 bonds, graphitic phases, pores, etc., on the film surface, since these surface defects behave as active sites in corrosive media [13,16]. The taC thin film with 1000 V has many graphitic phases as a result of its graphitization, which makes it susceptible to localized corrosion. The degraded sp3-bonded cross-linking structure of the taC thin film associated with its graphitization also facilitates its localized corrosion.

Figure 12.
(a) Surface morphology of taC thin film with a substrate pulse bias of 1000 V observed after potentiodynamic polarization measurement in a 5 × 10⁻² M CaCl2 solution, (b) EDX spectrum measured at location “B” in (a), and (c) pit on its surface.
The taC thin film is also prone to pitting corrosion in the CaCl2 solution, which is confirmed by the observed pit on its surface in Figure 12c. Based on Figure 12c, it is supposed that two adjacent pits grow together via their anodic dissolution and eventually connect to each other to form a larger pit, but this process is incomplete and leaves a pit with a wide mouth that is still not fully open yet. It is clear that the uniform, localized, and pitting corrosion of the taC thin films in the chloride solutions contributes to their overall corrosion.
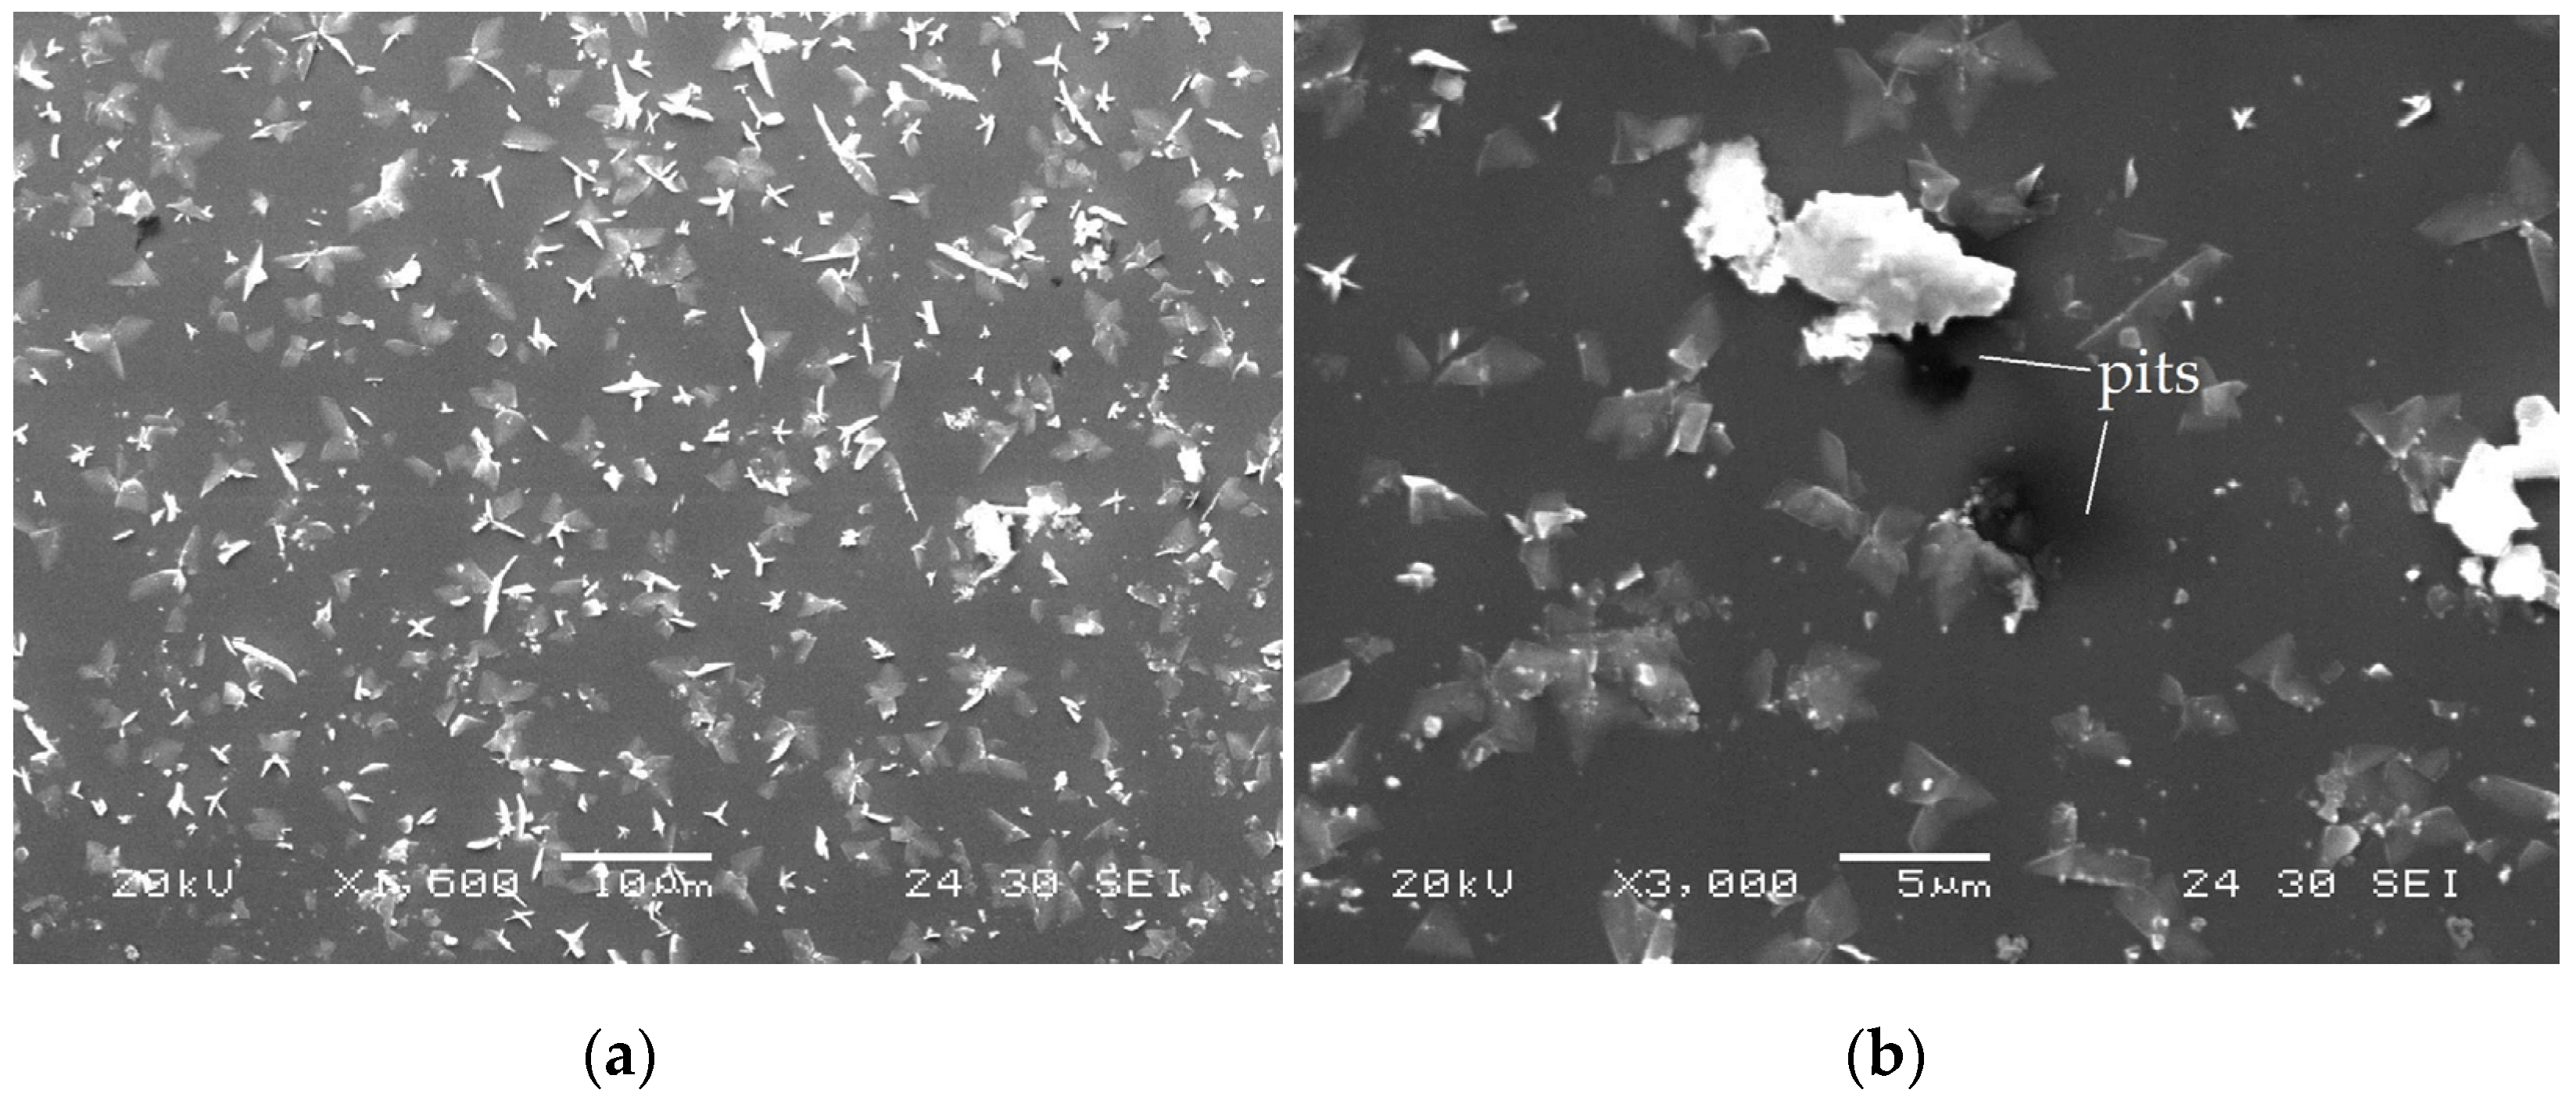
In Figure 13a,b, hierarchical flower-shaped deposits are found on the surface morphologies of the taC thin film with 0 V tested in the HgCl2 solution at different magnifications, probably due to the lowest solubility of HgCl2 in the aqueous solution. The EDS spectrum of the flower-shaped deposits (Figure 13c) has Hg and Cl peaks, which confirms that they are HgCl2 compounds. Although the surfaces of the taC thin films tested in the HCl, NaCl, and CaCl2 solutions are relatively clean, the observation of such flower-shaped deposits only in the HgCl2 solution reveals the stronger adsorption of HgCl2 deposits on their surfaces, indicating their poisoning in the HgCl2 solution.

Figure 13.
(a,b) Surface morphologies of taC thin film with a substrate pulse bias of 0 V observed at different magnifications after potentiodynamic polarization measurement in a 5 × 10⁻² M HgCl2 solution and (c) EDS spectrum measured at location “C” in (b).
In a comparison of Figure 13a and Figure 14a, HgCl2 deposits on the taC thin film surface with 1000 V are not in a distinct flower shape because the higher anodic dissolution of the film probably disturbs the formation of flower-shaped deposits. In Figure 14b, pits can also be found on the taC thin film surface with 1000 V in the HgCl2 solution; these are not found on the one with 0 Vas a result of its increased porosity associated with the increased substrate pulse bias. The pits have corrosion products inside, which could be HgCl2 deposits to block the free flow of the solution to the underlying Si substrate. That is why the taC thin films do not show pitting corrosion in the HgCl2 solution as severely as in the HCl, NaCl, and CaCl2 solutions, which is also responsible for their lowest corrosion in the HgCl2 solution.
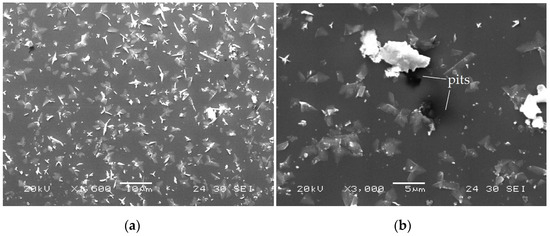
Figure 14.
(a,b) Surface morphologies of taC thin film with a substrate pulse bias of 1000 V observed at different magnifications after potentiodynamic polarization measurement in a 5 × 10⁻² M HgCl2 solution.
4. Conclusions
The FCVA deposition technique was applied to produce the taC thin films on Si substrates. The substrate pulse bias was varied from 0 to 1000 V to study changes in their structure and adhesion strength, while their corrosion behavior in the acidic and chloride solutions was investigated. Elevating the substrate pulse bias from 0 to 1000 V amplified graphitization of the taC thin films and concurrently resulted in a 9.9% increase in their adhesion strength from 406 mN to 446 mN because the breakdown of the rigid sp3-bonded cross-linking networks reduced residual stress and enhanced interfacial stability.
The taC thin films with different substrate pulse biases exhibited higher corrosion in the HCl solution (62.07 × 10⁴ Ω to 131.73 × 10⁴ Ω) than in the NaCl (143 × 104 Ω to 231.31 × 10⁴ Ω) and CaCl2 (102.13 × 10⁴ Ω to 351.92 × 10⁴ Ω) solutions because the high concentration of H+ ions accelerated their anodic dissolution in the HCl solution. The lower corrosion effect of the liquid CaCl2 gave rise to the lower corrosion of the taC thin films compared to their corrosion in the NaCl solution. The corrosion of the taC thin films in the PbCl2 solution (8.48 × 10⁴ Ω to 11.55 × 10⁴ Ω) was highest in this study because the anodic dissolution of reduced Pb on their surfaces contributed to their overall anodic currents. The taC thin films showed the lowest corrosion in the HgCl2 solution (146.89 × 10⁴ Ω to 387.44 × 10⁴ Ω) because the formation of HgCl2 compounds on their surfaces hindered their corrosion.
The taC thin films with higher substrate pulse biases had higher corrosion in all the solutions used in this study, which resulted from their degraded sp3-bonded cross-linking structures. It was clear that the substrate pulse bias was one of the major FCVA process parameters affecting the structure, adhesion strength, and corrosion of the taC thin films.
Author Contributions
Conceptualization, methodology, validation, formal analysis, investigation, data curation, writing—original draft preparation, writing—review and editing, and visualization, N.W.K.; Characterization and editing, A.W.-Y.T. All authors have read and agreed to the published version of the manuscript.
Funding
This work was supported by the research grant (EWI-0601-IRIS-035-00) from the Environment & Water Industry Development Council (EWI), Singapore.
Data Availability Statement
The raw data supporting the conclusions of this article will be made available by the authors upon request.
Conflicts of Interest
The authors declare no conflicts of interest.
References
- Barba, E.; Claver, A.; Montala, F.; Palacio, J.F.; Perez, C.J.L.; Sala, N.; Colominas, C.; Garcia, J.A. Study of the industrial application of diamond-like carbon coatings deposited on advanced tool steels. Coatings 2024, 14, 159. [Google Scholar] [CrossRef]
- Rajak, D.K.; Kumar, A.; Behera, A.; Menezes, P.L. Diamond-like carbon coatings: Classification, properties, and applications. Appl. Sci. 2021, 11, 4445. [Google Scholar] [CrossRef]
- Robertson, J. Diamond-like carbon amorphous. Mater. Sci. Eng. R Rep. 2002, 37, 129–281. [Google Scholar] [CrossRef]
- Sulthana, S.F.; Iqbal, U.M.; Suseela, S.B.; Anbazhagan, R.; Chinthaginjala, R.; Chitathuru, D.; Ahmad, I.; Kim, T.H. Electrochemical sensors for heavy metal ion detection in aqueous medium: A systematic system. ACS Omega 2024, 9, 25493–25512. [Google Scholar] [CrossRef]
- Aragay, G.; Pons, J.; Merkoçi, A. Recent trends in macro-, micro-, and nanomaterial-based tools and strategies for heavy-metal detection. Chem. Rev. 2011, 111, 3433–3458. [Google Scholar]
- Kundoo, S.; Kar, S. Nitrogen- and boron-doped diamond-like carbon thin films synthesis by electrodeposition from organic liquids and their characterization. Adv. Mater. Phys. Chem. 2013, 3, 25–32. [Google Scholar]
- Nilkar, M.; Ghodsi, F.E.; Jafari, S.; Thiry, D.; Snyders, R. Effects of nitrogen incorporation on N-doped DLC thin film electrodes fabricated by dielectric barrier discharge plasma: Structural evolution and electrochemical performances. J. Alloys Compd. 2021, 853, 157298. [Google Scholar]
- Shi, X.; Fu, H.; Shi, J.R.; Cheah, L.K.; Tay, B.K.; Hui, P. Electronic transport properties of nitrogen-doped amorphous carbon films deposited by the filtered cathodic vacuum technique. J. Phys. Condens. Matter 1998, 10, 9293. [Google Scholar]
- Liu, L.X.; Liu, E. Nitrogenated diamond-like carbon films for metal tracing. Surf. Coat. Technol. 2005, 198, 189–193. [Google Scholar]
- Khun, N.W.; Liu, E. Linear sweep anodic stripping voltammetry of heavy metals from nitrogen-doped tetrahedral amorphous carbon thin films. Electrochim. Acta 2009, 54, 2890–2898. [Google Scholar] [CrossRef]
- Vetter, J. 60 years of DLC coatings: Historical highlights and technical review of cathodic arc processes to synthesize various DLC types and their evolution for industrial applications. Surf. Coat. Technol. 2014, 257, 213–240. [Google Scholar] [CrossRef]
- Nagai, T.; Hiratsuka, M.; Alanazi, A.; Nakamori, H.; Hirakuri, K. Anticorrosion of DLC coating in acid solutions. Appl. Surf. Sci. 2021, 552, 149373. [Google Scholar] [CrossRef]
- Khun, N.W.; Liu, E. Enhancement of adhesion strengths and corrosion resistance of nitrogen or platinum/ruthenium/nitrogen-co-doped diamond-like carbon thin films by platinum/ruthenium interlayer. Diam. Relat. Mater. 2010, 19, 1065–1072. [Google Scholar] [CrossRef]
- Mohammed, O.; Salim, H.; Christelle, D.T.; Siegfried, P.; Mohammed, K.; Sofiane, D.; Hadj, L. Effect of DLC film thickness on residual stress and mechanical properties. Sci. Adv. Mater. 2015, 7, 157–162. [Google Scholar]
- Wei, J.; Guo, P.; Liu, L.L.; Li, H.; Wang, S.; Ke, P.; Saito, H.; Wang, A. Corrosion resistance of amorphous carbon film in 3.5 wt% NaCl solution for marine application. Electrochim. Acta 2020, 346, 136282. [Google Scholar]
- Khun, N.W.; Liu, E. Nitrogen-induced degradation of corrosion resistance of platinum/ruthenium/nitrogen-doped diamond-like carbon thin films. J. Electrochem. Soc. 2010, 157, C269. [Google Scholar]
- Calderon, S.; Alves, C.F.A.; Manninen, N.K.; Cavaleiro, A.; Carvalho, S. Electrochemical corrosion of nano-structured magnetron-sputtered coatings. Coatings 2019, 9, 682. [Google Scholar] [CrossRef]
- Ye, Y.; Jia, S.; Zhang, D.; Liu, W.; Zhao, H. A study for anticorrosion and tribological behaviour of thin/thick diamond-like carbon films in seawater. Surf. Topogr. Metrol. Prop. 2018, 6, 014004. [Google Scholar] [CrossRef]
- Rahman, M.A.; Maguire, P.; Roy, S.S.; McCann, R.; McKavanagh, F.; McLaughlin, J.A. Sp3 content in ta-C films vs. pluse bias width to the substrate: A correlative structural analysis. Diam. Relat. Mater. 2009, 18, 1343–1347. [Google Scholar]
- Hupert, M.; Muck, A.; Wang, J.; Stotter, J.; Cvackova, Z.; Haymond, S.; Show, Y.; Swain, G.M. Conductive diamond thin films in electrochemistry. Diam. Relat. Mater. 2003, 12, 1940–1949. [Google Scholar]
- Swain, G.M.; Anderson, A.B.; Angus, J.C. Applications of diamond thin films in electrochemistry. MRS Bull. 1998, 23, 56–60. [Google Scholar]
- Bootkul, D.; Supsermpol, B.; Saenphinit, N.; Aramwit, C.; Intarasiri, S. Nitrogen doping for adhesion improvement of DLC film deposited on Si substrate by filtered cathodic vacuum arc technique. Appl. Surf. Sci. 2014, 310, 284–292. [Google Scholar]
- Zhang, Y.; Gao, P.; Chen, D.; Zhou, Y.W. Structure-related corrosion behaviour of DLC films in high Cl- environment. Corros. Rev. 2021, 39, 465–476. [Google Scholar]
- Niessen, R.A.H.; Notten, P.H.L. Reference electrode-induced surface poisoning of thin film electrodes. J. Electrochem. Soc. 2005, 152, A2051. [Google Scholar]
- Lu, Y.; Liang, X.; Niyungeko, C.; Zhou, J.; Xu, J.; Tian, G. A review of the identification and detection of heavy metal ions in the environment by voltammetry. Talanta 2018, 178, 324–338. [Google Scholar]
- Khun, N.W.; Liu, E.; Zeng, X.T. Corrosion behaviour of nitrogen-doped diamond-like thin films in NaCl solutions. Corros. Sci. 2009, 51, 2158–2164. [Google Scholar]
- Xiao, Z.; Ren, L.; Guo, C.; Liang, L.; Dai, Y.; Tang, K.; Lu, L.; Qi, F.; She, J.; Wang, L.; et al. Enhanced corrosion resistance, mechanical properties, and biocompatibility of N-DLC coatings prepared on WE43 alloy via FCVA technology. J. Alloys Compd. 2005, 1010, 178106. [Google Scholar]
- Zhao, M.; Ren, Y.; Chen, D.; Li, J.; Wang, Q.; Zhou, Y. Localized corrosion of nitrogen-doped diamond-like carbon films on the surface of 304 stainless steel. Surf. Coat. Technol. 2024, 484, 130810. [Google Scholar]
- Locke, C.E.; Kennelley, K.J.; Boren, M.D.; Luster, V.A. study of corrosion properties of a new deicer, calcium magnesium acetate. Transp. Res. Rec. 1987, 1113, 30–38. [Google Scholar]
- Mori, G.; Vidic, K.J.; Bucher, E.; Yasir, M.; Hornauer, D.; Nachtnebel, M.; Fitzek, H.; Schroettner, H. The influence of NaCl and CaCl2-induced high-temperature corrosion on the aqueous corrosion resistance of stainless steels. Mater. Corros. 2019, 70, 1071–1086. [Google Scholar]
- Liu, F.X.; Yao, K.L.; Liu, Z.L. Substrate bias effects on structure of tetrahedral amorphous carbon films by Raman spectroscopy. Diam. Relat. Mater. 2007, 16, 1746–1751. [Google Scholar] [CrossRef]
- Zhou, J.; Han, J.; Meng, S.; Wang, J.; Zheng, W. Correlations between substrate bias, microstructure, and surface morphology of tetrahedral amorphous carbon film. Vacuum 2003, 72, 285–290. [Google Scholar] [CrossRef]
- Ishpal; Panwar, O.S.; Srivastava, A.K.; Kumar, S.; Tripathi, R.K.; Kumar, M.; Singh, S. Effect of substrate bias in amorphous carbon films having embedded nanocrystallites. Surf. Coat. Technol. 2011, 206, 155–164. [Google Scholar] [CrossRef]
- Gerstner, E.G.; Lukins, P.B.; McKenzie, D.R.; McCulloch, D.G. Substrate bias effects on the structural and electronic properties of tetrahedral amorphous carbon. Phys. Rev. B 1996, 54, 14504. [Google Scholar] [CrossRef]
- Zhao, J.F.; Lemoine, P.; Liu, Z.H.; Quinn, J.P.; Maguire, P.; McLaughlin, J.A. A study of microstructure and nanomechanical properties of silicon-incorporated DLC films deposited on silicon substrates. Diam. Relat. Mater. 2001, 10, 1070–1075. [Google Scholar] [CrossRef]
- Prawer, S.; Nugent, K.W.; Lifshitz, Y.; Lempert, G.D.; Grossman, E.; Kulik, J.; Avigal, I.; Kalish, R. Systematic variation of the Raman spectra of DLC films as a function of sp2:sp3 composition. Diam. Relat. Mater. 1996, 5, 433–438. [Google Scholar] [CrossRef]
- Kohler, T.; Frauenheim, T.; Jungnickel, G. Stability, chemical bonding, and vibrational properties of amorphous carbon at different mass densities. Phys. Rev. B 1995, 52, 11837. [Google Scholar] [CrossRef]
- Ferrari, A.C.; Robertson, J. Interpretation of Raman spectra of disordered and amorphous carbon. Phys. Rev. B 2000, 61, 14095. [Google Scholar] [CrossRef]
- Robertson, J. Diamond-like carbon. Pure Appl. Chem. 2009, 66, 1789–1796. [Google Scholar] [CrossRef]
- Nakao, S.; Yukimura, K.; Nakano, S.; Ogiso, H. DLC coating by HiPIMS: The influence of substrate bias voltage. IEEE Trans. Plasma Sci. 2013, 41, 1819–1829. [Google Scholar] [CrossRef]
- Zhang, Y.B.; Lau, S.P.; Sheeja, D.; Tay, B.K. Study of mechanical properties and stress of tetrahedral amorphous carbon films prepared by pulse biasing. Surf. Coat. Technol. 2005, 195, 338–343. [Google Scholar]
- Robertson, J. Mechanism of sp3 bond formation in the growth of diamond-like carbon. Diam. Relat. Mater. 2005, 14, 942–948. [Google Scholar] [CrossRef]
- Kametani, N.; Nakamura, M.; Yashiro, K.; Takaki, T. Impact of temperature on residual stress and bonding in diamond-like carbon film: A molecular dynamics study under various deposition conditions. Comput. Mater. Sci. 2024, 238, 112950. [Google Scholar]
- Liu, E.; Li, L.; Blanpain, B.; Cells, J.P. Residual stresses of diamond and diamond-like carbon films. J. Appl. Phys. 2005, 98, 073515. [Google Scholar] [CrossRef]
- Guo, D.; Zhang, S.; Huang, T.; Wu, S.; Ma, X.; Guo, F. Corrosion properties of DLC film in weak acid and alkali solutions. Coatings 2022, 12, 1776. [Google Scholar] [CrossRef]
- Haarberg, G.M.; Store, T.; Barresen, B.; Tunold, R. Electrochemical studies of lead deposition from pure molten lead chloride. ECS Proc. 1994, 1994-13, 463–467. [Google Scholar]
- Cui, M.J.; Pu, J.; Zhang, G.; Wang, L.; Xue, Q. The corrosion behaviours of multilayer diamond-like carbon coatings: Influence of deposition periods and corrosive medium. RSC Adv. 2016, 6, 28570–28578. [Google Scholar] [CrossRef]
- Holleman, A.F.; Wiberg, E.; Ealeson, M.; Brewer, W.D.; Aylett, B.J. Inorganic Chemistry; De Gruyter: New York, NY, USA, 2001. [Google Scholar]
- Bockris, J.O.M.; Reddy, A.K.N. Modern Electrochemistry; Kluwer Academic Publishers: New York, NY, USA, 1997; Volume 2. [Google Scholar]
- Beom, W.J.; Yun, K.S.; Park, C.J.; Ryu, H.J.; Kim, Y.H. Comparison of influences of NaCl and CaCl2 on the corrosion of 11% and 17% Cr ferritic stainless steels during cyclic corrosion test. Corros. Sci. 2010, 52, 734–739. [Google Scholar]
- Acosta, V.V.; Bianchi, G.L. Effects of Ca2+ ions on the localized corrosion of carbon steel influence of the associated anion. Appl. Sci. 2023, 13, 11056. [Google Scholar] [CrossRef]
- Bojinov, M.; Jappinen, E.; Saaria, T.; Sipila, K.; Toivonen, A. Effect of lead and applied potential on corrosion of carbon steel in steam generator crevice solutions. Corros. Sci. 2019, 159, 108117. [Google Scholar] [CrossRef]
- Lindmark, H.; Jonsson, T.; Liske, J. A time-resolved study of PbCl2-induced corrosion of low-alloyed steel in the presence of water vapour at 400 °C. Corros. Sci. 2024, 229, 111843. [Google Scholar]
- Zeng, A.; Liu, E.; Annergren, I.F.; Tan, S.N.; Zhang, S.; Hing, P.; Gao, J. EIS capacitance diagnosis of nanoporosity effect on the corrosion protection of DLC films. Diam. Relat. Mater. 2002, 11, 160–168. [Google Scholar]
- Yerga, D.M.; Garcia, M.B.G.; Garcia, A.C. Electrochemical determination of mercury: A review. Talanta 2013, 116, 1091–1104. [Google Scholar]
- Schiffmann, K.I.; Fryda, M.; Goerigk, G.; Lauer, R.; Hinze, P.; Bulack, A. Sizes and distance of metal clusters in Au, Pt, W and Fe-containing diamond-like carbon hard coatings: A comprehensive study by small-angle X-ray scattering, wide angle X-ray diffraction, transmission electronmicroscopy and scanning tunneling microscopy. Thin Solid Films 1999, 347, 60–71. [Google Scholar]
- Pleskov, Y.V.; Evstefeeva, Y.E.; Baranov, A.M. Threshold effect of admixtures of platinum on the electrochemical activity of amorphous diamond-like carbon thin films. Diam. Relat. Mater. 2002, 11, 1518–1522. [Google Scholar]
- Peng, F.; Lin, Y.; Zhang, D.; Ruan, Q.; Tang, K.; Li, M.; Liu, X.; Chu, P.K.; Zhang, Y. Corrosion behaviour and biocompatibility of diamond-like carbon-coated zinc: An in Vitro study. ACS Omega 2021, 6, 9843–9851. [Google Scholar]
- He, Z.; Liu, X.; Li, Y.; Yang, H.; Ding, Z.; Luo, Y.; Shi, G. Unexpected iron corrosion by excess sodium in two-dimensional Na-Cl crystals of abnormal stoichiometries at ambient conditions. J. Colloid Interface Sci. 2023, 648, 102–107. [Google Scholar]
Disclaimer/Publisher’s Note: The statements, opinions and data contained in all publications are solely those of the individual author(s) and contributor(s) and not of MDPI and/or the editor(s). MDPI and/or the editor(s) disclaim responsibility for any injury to people or property resulting from any ideas, methods, instructions or products referred to in the content. |
© 2025 by the authors. Licensee MDPI, Basel, Switzerland. This article is an open access article distributed under the terms and conditions of the Creative Commons Attribution (CC BY) license (https://creativecommons.org/licenses/by/4.0/).

