Article

Study on the Dynamic Characteristics of the Gear Lubrication Flow Field with Baffles and Optimization Design Strategies

1
Institute of Information Engineering, Quzhou College of Technology, Quzhou 324000, China
2
College of Mechanical Engineering, Zhejiang University of Technology, Hangzhou 310014, China
3
School of Mechanical Engineering, Zhejiang University of Water Resources and Electric Power, Hangzhou 310018, China
*
Author to whom correspondence should be addressed.
Lubricants 2025, 13(4), 143; https://doi.org/10.3390/lubricants13040143
Submission received: 23 January 2025 / Revised: 2 March 2025 / Accepted: 13 March 2025 / Published: 25 March 2025

Abstract

:
The gear transmission system occupies a core position in mechanical equipment due to its numerous advantages such as high efficiency, high reliability, and long durability, making it an indispensable key component. Investigating the distribution mechanism of the two-phase flow field in gear transmission systems and its optimization design strategies is crucial for enhancing the efficiency and reliability of gearboxes. This paper couples the Lattice Boltzmann Method (LBM) with Large Eddy Simulation (LES) to construct a dynamic modeling and solution method suitable for the lubrication flow field of high-speed gears with baffles. The core objective is to explore the distribution mechanism and dynamic characteristics of the lubrication flow field in gears with baffles. Based on the LBM–LES coupled model, this paper sets up a two-phase flow dynamic model for the high-speed gear lubrication flow field. By conducting a detailed analysis of the dynamic evolution of the lubrication process in the gearbox with the presence of baffles, this study reveals the changing patterns of flow field dynamics under different flow velocities and configurations of mixing components. The research findings indicate that when the radial speed of the gears reaches 8 m/s, a stable oil film can be formed on the gear surface, which is crucial for ensuring smooth operation and reducing wear. Additionally, it has been confirmed that larger baffle diameters and hole diameters can effectively increase the enthalpy of the fluid, thereby optimizing energy transfer and thermal performance. However, it is noted that a larger baffle diameter is not always better; when it exceeds a certain limit, the performance improvement effect gradually diminishes, indicating the existence of an optimal baffle diameter value. By optimizing the design of the baffle, the flow characteristics and energy dissipation of the fluid within the gearbox can be controlled, improving thermal management and lubrication performance. These research findings provide valuable references for the lubrication design and optimization of gear transmission systems in high-tech fields such as aviation and aerospace. They can help relevant technicians gain a deeper understanding of the complex mechanisms involved in the lubrication process, allowing for the design of more efficient and reliable lubrication systems, effectively enhancing the performance of the entire transmission system, and promoting progress and development in related technological fields.

1. Introduction

With rapid technological advancements, gear transmission systems have become key components in mechanical equipment. With a range of comprehensive advantages such as high precision, high efficiency, high reliability, and long durability, they have emerged as the preferred transmission solution in various high-end equipment fields, including the aerospace, construction machinery, marine vessel, industrial robot, and machine tool fields, occupying a crucial position in the mechanical sector [1,2,3,4,5]. As industries continue to thrive, the performance requirements for transmission systems are becoming more stringent. This is true in the aerospace sector, where transmission systems face harsh challenges. It must maintain high precision and reliability even in extreme temperatures and weightlessness, ensuring the stable operation of critical equipment like aircraft. For high-end applications such as industrial robots and precision machinery, the responsibilities of gear transmission systems are even more daunting. It the main challenge is how to achieve lightweight design while maintaining high precision and rigidity to meet the dual demands of flexibility and efficiency in these devices.
In the design process of gear transmission systems, efficiency and durability are undoubtedly critical considerations. These two parameters not only relate to the equipment’s cost effectiveness but also have a profound impact on power performance, reliability, and environmental friendliness. As the gear system operates at high speeds, the friction between the gears generates a significant amount of heat. If lubrication measures are inadequate, it may lead to pitting and adhesion on the gear surfaces, shortening the lifespan of the gears. Moreover, high-speed rotation can disrupt the flow of the lubricant, reducing its effectiveness and exacerbating wear on the gears during high-speed operation [6,7]. Therefore, in-depth research on the distribution of the lubrication flow field within the gearbox and optimization design strategies is crucial for enhancing the efficiency and reliability of the gearbox. Through precise analysis of the flow field, it can gain clear insights into the dynamic flow of the lubricant within the gearbox. This not only provides a scientific basis for the design of the lubrication system but also improves the lubrication conditions of the gears and bearings, extending their service life and providing a solid guarantee for the stable operation and efficient production of mechanical equipment.
In gear transmission systems, adequate lubrication of the gearbox is key to ensuring safe operation. During the operation of the gearbox, the relative sliding friction between the gear tooth surfaces and the friction between the gears and the lubricating oil generate a significant amount of heat, and the quality of lubrication affects the performance of the transmission system. For example, insufficient lubrication of the gears can lead to increased temperature, vibration, and abnormal noise [8,9,10,11]. As the gear line speed increases, the airflow generated by the rotating gears can create an air barrier, which hinders the flow of lubricating oil to the gear meshing points, resulting in the dispersion of oil flow and even a reduction in the amount of oil in the meshing area, thereby decreasing the lubrication effectiveness. In high-speed gear transmission systems, gear lubrication exhibits characteristics such as an unsteady state, two-phase oil–gas flow, and complex flow field distribution, making it difficult to study through theoretical or experimental means, leading to unclear patterns of complex oil–gas two-phase flow formed in the gearbox lubrication. How to smooth the relationship between the lubrication process and lubrication performance, design the minimum lubricating oil content, and determine whether the gears can be lubricated are pressing lubrication issues that need to be addressed. Furthermore, when designing the layout of the gear transmission system or selecting operating parameters, if the thermal behavior and temperature distribution of the transmission system can be predicted, it would allow for more targeted optimization of the design scheme to enhance the reliability of gear transmission and extend its service life. Relevant research results show [12,13,14,15] that computational fluid dynamics (CFD) can simulate the flow of fluid around the product, evaluate the mixing performance, transmission characteristics and other key indicators of the product, so as to guide the relevant industrial production process. Therefore, it is necessary to gain an in-depth understanding of the flow dynamics and thermodynamic properties of the lubricating oil inside the gearbox by the CFD technology, to determine an ideal analytical strategy for the lubrication mechanism of the transmission oil flow, and to master the interaction mechanisms of the gas–liquid two-phase flow within the gearbox as well as optimization design strategies. This is of great significance for ensuring the stable operation of various rotating components inside the transmission and for improving the lifespan and efficiency of the gearbox.
The study of lubrication performance occupies a central position in the field of gear transmission systems. Scholars adopt a combination of model simulation and experimental validation to enhance research quality through mutual verification, and some progress has been made [16,17,18]. However, due to the complexity of the transmission structure and errors in modeling calculations, research on gear lubrication transmission still faces many challenges. Wang et al. [19] used the moving particle semi-implicit (MPS) method to analyze the flow field of the lubrication model for reducers, finding that insufficient lubrication oil can lead to under-lubrication of the gear system, accelerating the rise in gear temperature. Liu et al. [20] compared the finite volume method (FVM) with photographs of the splashing lubrication flow field taken by high-speed cameras, discovering that the power loss due to oil agitation obtained by the FVM method is more consistent with experimental results. Dai et al. [21] established a splashing lubrication analytical model for spiral bevel gears based on CFD technology, introducing dynamic oil immersion depth to quantify the impact of oil agitation loss under medium- and low-speed conditions, achieving predictions of no-load losses. Hu et al. [22] analyzed the lubrication process of spiral bevel gearboxes, finding that the dynamic motion of the transmission significantly affects the pumping effect in the gear meshing area, reducing lubrication performance in that area and leading to insufficient lubrication of the gears. Hill et al. [23] studied the power loss during the meshing of spur gear pairs operating under flooded conditions based on CFD, quantifying the main influencing factors such as rotational speed, temperature, oil level, and gear structural design. Hildebrand et al. [24] analyzed the internal flow field of a straight gearbox with guide plates, identifying the contributions of different tooth surface areas to the oil agitation resistance torque, and explained the strong interaction between the tooth side pressure and the shear force that leads to the oil agitation resistance torque. Boness et al. [25] studied the resistance torque experienced by gear motion in different oil states and found that as the Reynolds number increases, low-viscosity lubricating oil results in higher power losses.
Overall, the research in the field of gear lubrication has matured, mainly focusing on the study of the lubrication flow field distribution and oil churning losses in gearboxes. Although a few researchers have analyzed the lubrication modeling and thermodynamic characteristics of complex gearboxes, the lubrication dynamics and optimization design strategies for gear systems with baffles remain unclear. Therefore, analyzing the lubrication characteristics and optimization design strategies of high-speed gears with baffles is still a challenge. From the current research progress, the finite volume method (FVM) has been applied in gearbox lubrication studies and has shown high accuracy. However, FVM faces many challenges when dealing with strongly nonlinear problems such as splash lubrication in gearboxes, including the need to handle small gaps at gear meshing points, gear surface movement, grid division difficulties, high hardware requirements, and slow computation speeds [26,27,28]. This is particularly limiting in large engineering projects with complex geometric structures. For meshless methods, the Lattice Boltzmann Method (LBM) has performed well in simulating the flow field distribution in gearboxes, but its effectiveness in predicting oil churning power losses still needs improvement [29,30,31,32].
In the field of gear lubrication research, the primary task is to develop modeling and solving techniques for gear lubrication systems that can handle multi-field coupling. This is crucial for gaining an in-depth understanding of the lubrication and dynamic characteristics of gearboxes. Therefore, this study selects a high-speed gearbox model as the research object and employs the LBM to conduct a detailed analysis of the dynamic evolution of the gear lubrication process when baffles are present. Furthermore, numerical simulations of the lubrication flow field in the gearbox under different rotational speeds, baffle configurations, and oil immersion depths are performed, revealing the variations in flow field dynamics under different flow rates and configurations of mixed components.
The core contribution of this study lies in the development of a new method for dynamic modeling and solving of high-speed gear lubrication flow fields based on LBM–LES coupling. It delves into the lubrication dynamics characteristics and optimization design strategies during the complex meshing process of gearboxes. The research findings provide valuable references for the lubrication design and optimization of gear transmission systems in high-tech fields such as aviation and aerospace, helping relevant technicians understand the complex mechanisms involved in the lubrication process, thereby enabling the design of more efficient and reliable lubrication systems, and enhancing the performance of the entire transmission system.

2. High-Speed Gear Lubricating Oil Field Mathematical Analysis Model

2.1. Mathematical Model of Gear Lubrication Based on LBM

In the Lattice Boltzmann Method (LBM), a Cartesian grid is employed, with each cell containing a set of probability distribution functions (PDFs) that describe the particle distribution at that point. During the streaming phase, these PDFs are transferred to adjacent cells based on the direction of particle movement. Subsequently, in the collision phase, the PDFs are adjusted towards thermodynamic equilibrium, ensuring that the macroscopic fluid dynamics align with the microscopic behavior of the system [33,34]. By discretizing the distribution function of the fluid and simulating its evolution over time, the LBM effectively reproduces the macroscopic flow characteristics of the fluid. This method is inspired by the Boltzmann equation, a differential equation that describes the motion of molecular gases. By discretizing the Boltzmann equation, the Lattice Boltzmann Equation (LBE) can be derived, enabling numerical simulations on computers. Compared to traditional computational fluid dynamics methods, the LBM’s computational strategy effectively addresses certain limitations of the VOF and SPH methods, particularly in handling dynamic grids. This makes the LBM a novel approach for simulating high-speed gear lubrication.
The LBM is inspired by the Boltzmann equation, a differential equation that describes motion of molecular gases. This method involves discretizing the Boltzmann–BGK equation in terms of space, time, and velocity, which leads to the derivation of the Lattice Boltzmann Equation (LBE). The Lattice Boltzmann–BGK (Bhatnagar–Gross–Krook) equation can be expressed as follows [35]:
f a x + e α δ t , t + δ t f α x , t = 1 τ f α e q x , t
In the equation, fα(x,t) is the lattice velocity vector of the particle distribution function, and eα is the probability density distribution function in the A directions. τ is the dimensionless relaxation time, and on the right side of the equation is the BGK collision term. fαeq is the equilibrium distribution function corresponding to the particle distribution function term, and its equation is as follows:
f α x , t = ω α ρ 1 + e α u c s 2 + e α u 2 4 c s 2 u 2 2 c s 2
where eα is discrete velocity, α is the direction of discrete velocity, cs is the lattice sound speed, u is the fluid velocity at position x and time t, and ωα is the weight coefficient, indicating the weight coefficients and the magnitude of the lattice sound speed under different DnQm models. In the DnQm model, n represents the spatial dimension, and m represents the number of velocity directions.
D3Q15 and D3Q19 are commonly used models for establishing three-dimensional models. The D3Q19 model uses 19 discrete velocities in three-dimensional space, enabling a more accurate representation of the fluid’s motion characteristics compared to models such as D3Q15. It captures details like the velocity gradient within the fluid with greater precision, which is especially crucial for addressing complex fluid dynamics problems. Consequently, this paper adopts the D3Q19 model. The velocity configuration of D3Q19 is as follows [36]:
c = c 0 1 1 0 0 0 0 1 1 1 1 1 1 1 1 0 0 0 0 0 0 0 1 1 0 0 1 1 1 1 0 0 0 0 1 1 1 1 0 0 0 0 0 1 1 0 0 0 0 1 1 1 1 1 1 1 1
In the formula, c = δx/δt, where δx is the grid step size and δt is the time step size. The Maxwell–Boltzmann distribution function takes the following form:
f α e q = ρ ω α 1 + 3 e α u c 2 + 9 e α u 2 2 c 4 3 u 2 2 c s 2
where ωα (weight factor) is
ω α = 1 3 , α = 0 1 18 , α = 1 , , 6 1 36 , α = 7 , , 18
From this, we can derive that the evolution equation for D3Q19 is
f α x + e α δ t , t + δ t = f α x , t 1 τ f α x , t f α e q x , t , α = 1 , , 18

2.2. LBM–LES Coupling Model

The LBM (Lattice Boltzmann Method) is a numerical computation technique that operates from a mesoscopic perspective used to solve the Navier–Stokes equations. In turbulent numerical simulations, when used in isolation, it is often not ideal for handling more chaotic flows due to its limitations concerning Reynolds numbers. To better simulate turbulent flows at high Reynolds numbers, the sub-grid scale (SGS) stress model from Large Eddy Simulation (LES) is combined with the LBM. This combined approach has emerged as a mainstream direction in current research [37,38,39].
The overall idea of the LBM–LES coupling model is to replace the relaxation time in the original LBM model with a total relaxation time, which consists of a single relaxation time and a vortex viscosity relaxation time. By introducing the vortex viscosity relaxation time, the model takes into account the turbulent effects at the sub-grid scale, thereby improving its capacity to capture complex turbulent phenomena and enhancing simulation accuracy.
τ e = τ + τ s g s
where τe is the total relaxation time, τ is the single relaxation time, ν is a function of the molecular viscosity, and the turbulent viscous relaxation time τsgs is related to the turbulent viscosity νt. It determines the rate at which the relevant states at the grid nodes approach local equilibrium. The equivalent viscosity coefficient can be expressed in terms of the total relaxation time as follows [40]:
ν e = e 2 Δ t 6 2 τ e 1
Meanwhile, assume that the molecular viscosity coefficient and the single-term time satisfy the following relationship:
ν = e 2 Δ t 6 2 τ 1
The vortex viscosity relaxation time and the turbulent viscosity coefficient are shown in the following formula [41]:
τ s g s = 3 ν t e 2 Δ t
The turbulent viscosity coefficient vt is
ν t = C s Δ ¯ 2 2 S ¯ ν S ¯ ν
In the equation, the strain rate tensor S ¯ ν is a function of the non-equilibrium momentum tensor, based on the Chapman–Enskog expansion. The distribution function of the Lattice Boltzmann Method (LBM) has the capability to compute S ¯ ν .
S ¯ γ = 3 2 e 2 ρ τ + τ s g s Δ t k = 0 18 e k i e k j f k f k e q
where i and j represent two adjacent lattice points. The combined Equations (10) and (12) can express the vortex viscosity relaxation time as
τ s g s = 3 e 2 Δ t ν t = 3 e 2 Δ t C s Δ ¯ 2 2 S ¯ γ S ¯ γ
Therefore, the vortex viscosity relaxation time is as follow [42]
τ s g s = 9 C s Δ ¯ 2 2 e 4 ρ τ + τ s g s Δ t 2 2 i j ν
where i j = k e k i e k j f k f k e q .
In the above formula, the relaxation time of the SGS model is
τ s g s = τ + τ 2 + 18 C s Δ ¯ 2 2 i j ν / e 4 ρ Δ t 2 2
The overall relaxation time is defined as
τ e = τ + τ s g s = τ + τ 2 + 18 C s Δ ¯ 2 2 i j ν / e 4 ρ Δ t 2 2
The coupled Smagorinsky model and LBM-based LBM–LES hybrid model is described as follows:
f i x + e α δ t , t + δ t f i x , t = 1 τ e f i x , t f i e q x , t

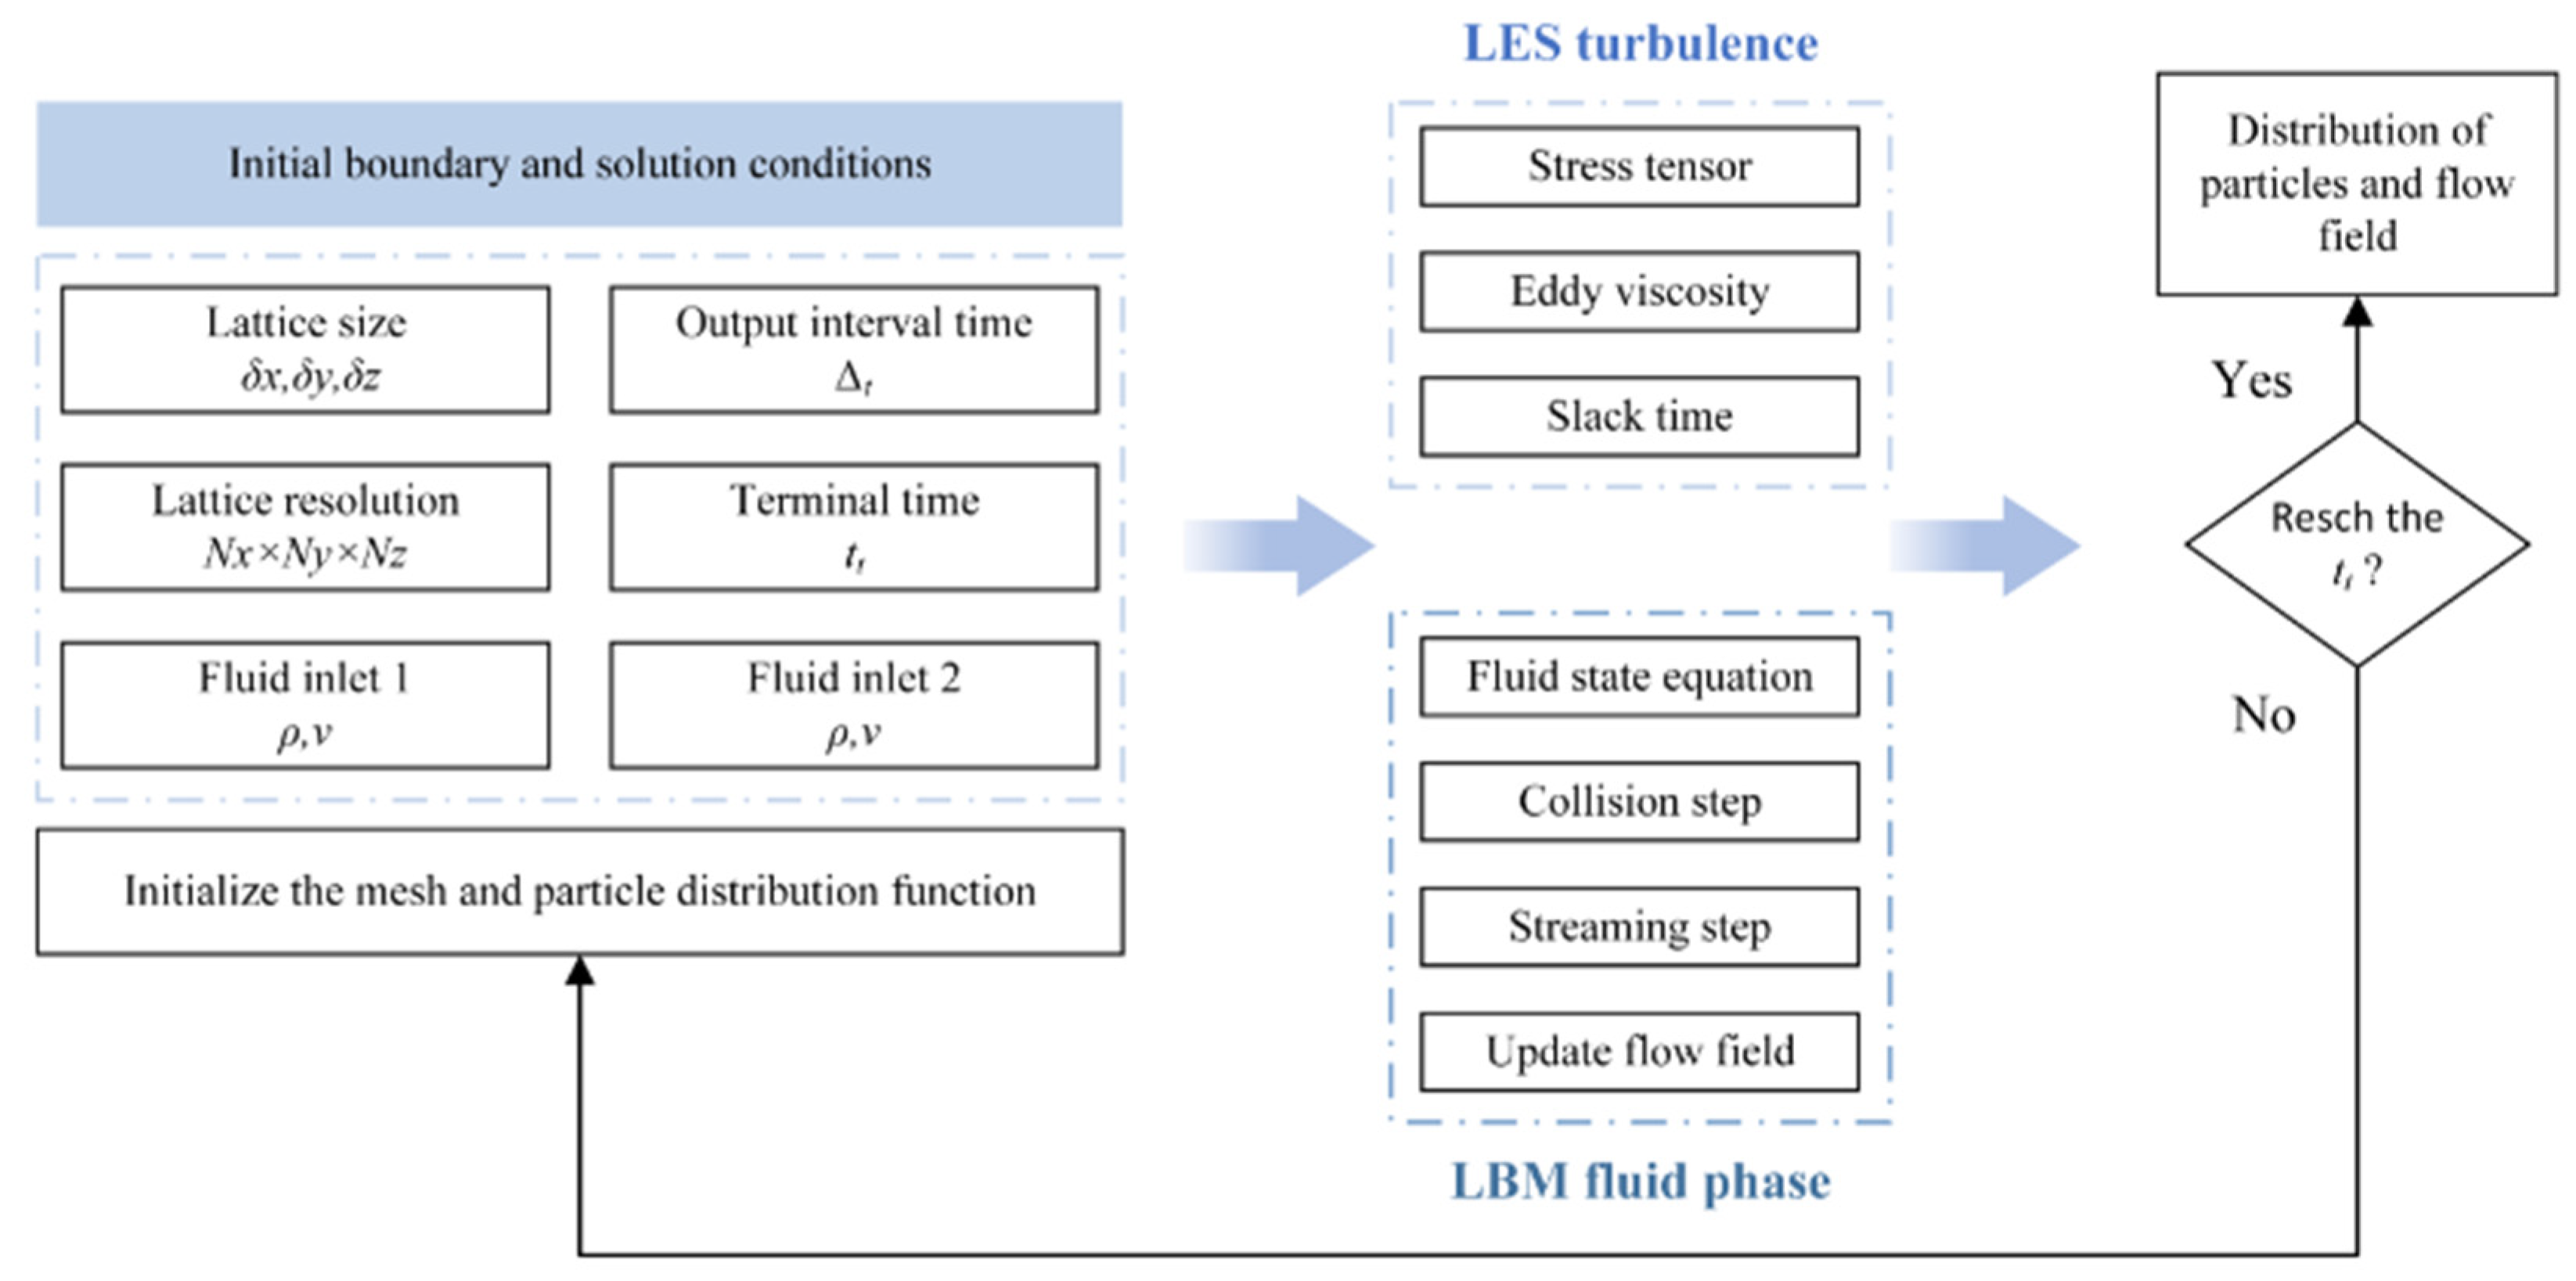
2.3. Gear Lubrication Solving Process Based on LBM–LES Coupling

In this section, we develop a static mixed numerical solving technique that combines the LBM and LES based on the mathematical model discussed earlier, as illustrated in Figure 1. This technique aims to provide an efficient and accurate method for simulating fluid dynamics. The computational process is broadly divided into several key steps: setting initial boundary conditions, solving the governing equations of the LBM, and solving the equations of LES. First, we need to determine the relevant fundamental parameters of the computational domain, which include, but are not limited to, grid sizes (δx, δy, δz), time step (∆t), output time interval, grid resolution (Nx, Ny, Nz), simulation termination time (tt), and the inlet conditions of the fluid. These parameters are essential for defining the accuracy and scope of the simulation.
In the initialization phase, a grid structure for the flow field is established, and the particle distribution function is initialized. This step provides the necessary initial conditions for the simulation and serves as the foundation for the entire computational process. Next, we solve for the fluid phase using the LBM control equations. 1. Solve the state equation of the fluid to determine its current state. 2. Perform the collision step to simulate interactions between particles. 3. Update the migration step to reflect the movement of particles within the fluid. 4. Update the entire flow field to account for changes in fluid dynamics. Through these steps, we can obtain the pressure field and velocity field of the fluid, which are crucial for understanding its behavior and characteristics.
Building on previous work, we conducted a comprehensive analysis of the flow field using the LES turbulence model, with the goal of capturing large-scale vortex activities in turbulence more accurately. Key components of the LES model include the resolution of the stress tensor, the determination of the eddy viscosity coefficient, and the optimization of the time relaxation parameter. This model significantly enhances the simulation accuracy of large-scale turbulent structures by filtering out the effects of small-scale, high-frequency vortices. During the simulation process, the system checks at each time step whether the current time has reached the preset end time. If it has not been reached, the simulation continues, incorporating iterative updates of both the flow field and the turbulence field; if it has been reached, the simulation will stop and output the final calculation results, including fluid velocity and pressure distribution. This calculation process not only effectively addresses the complexity of the two-phase mixing problem but also provides a solid and reliable numerical data foundation for subsequent analysis work.

3. Numerical Model of High-Speed Gear Lubricating Oil

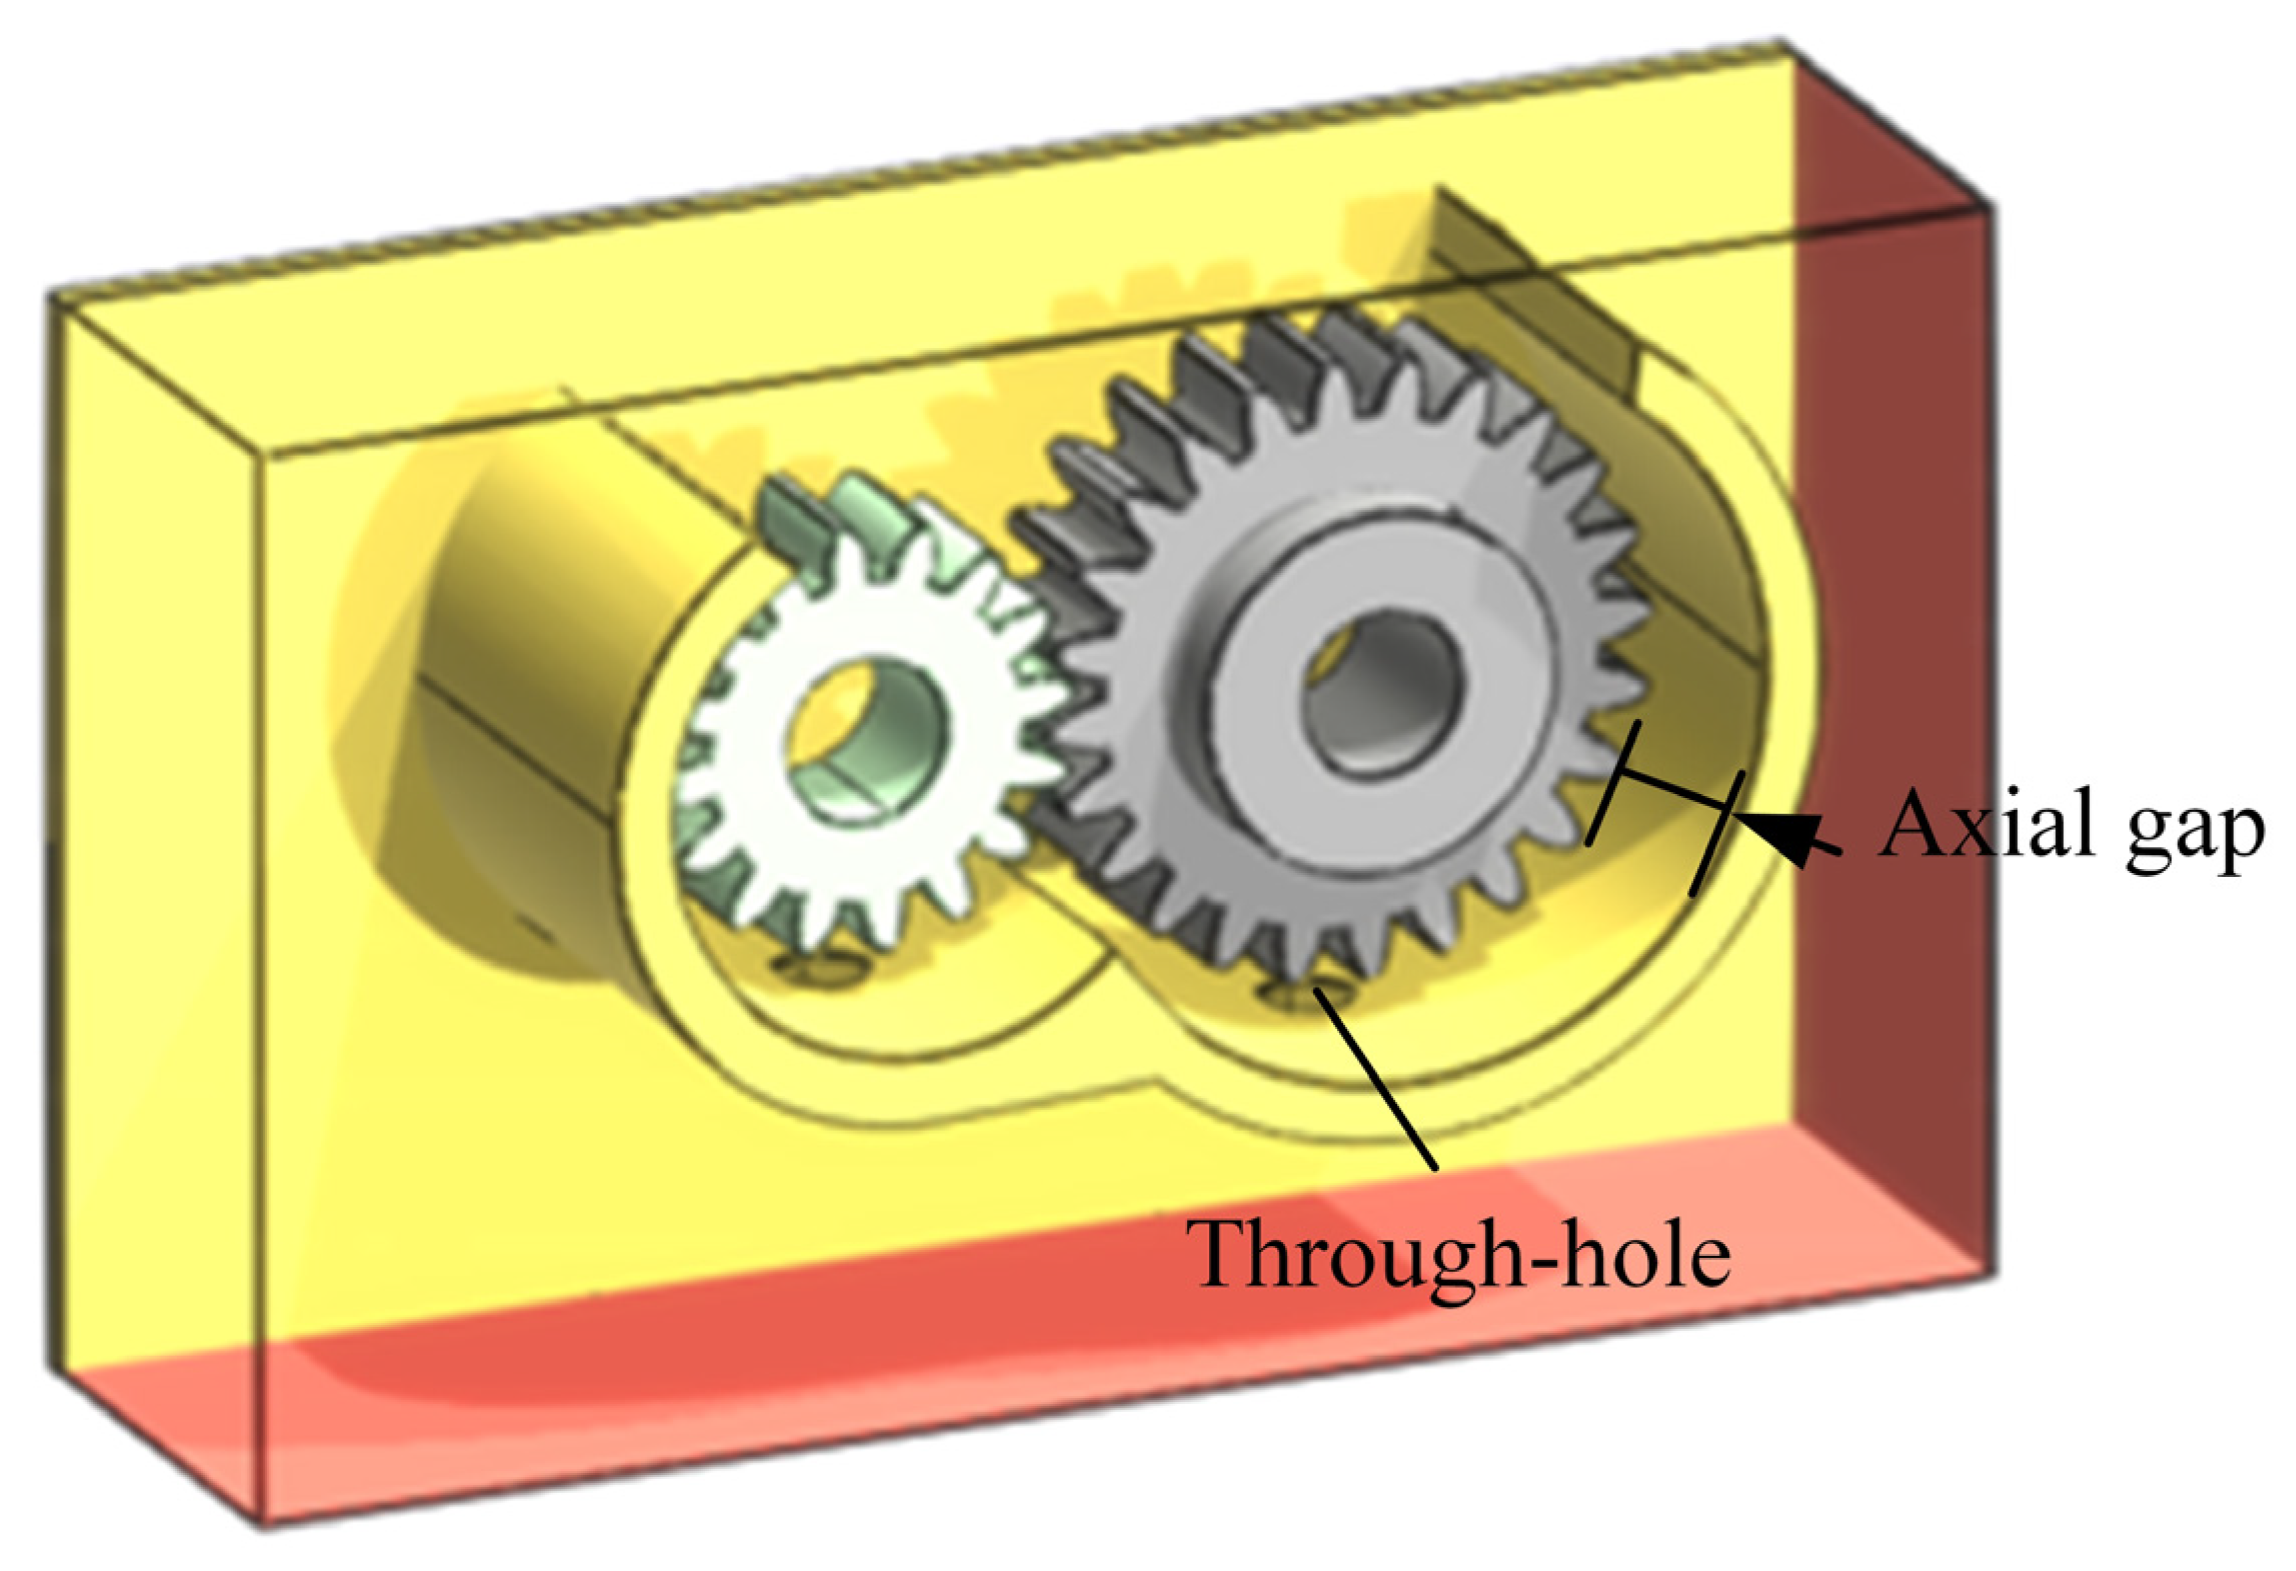
3.1. Geometric Model

In a gear transmission system, the agitation of lubricating oil within the gearbox is a key mechanism for achieving lubrication and cooling of internal components. When the gears rotate, the lubricating oil is stirred and splashes, and these splashed oil droplets can evenly cover the surfaces of the gears and other components within the gearbox, thereby forming a layer of oil film between moving parts. This effectively reduces the friction coefficient, minimizes wear, and simultaneously carries away heat generated by friction, providing a cooling effect and ensuring the stable operation of the gear transmission system. To further study the flow field distribution within the gearbox, we constructed a three-dimensional model of the gearbox. Based on specific analytical needs and the set boundary conditions, we reasonably defined the boundary areas and simplified the structures of components such as shafts and bearings within the gearbox system. These structures have a relatively small impact on the flow field, and their simplification will not lead to significant deviations in the overall analysis results; instead, it allows us to focus more on the flow field characteristics in the core areas.
Based on a gear-based geometric model, the fluid shell inside the gearbox is extracted to represent the fluid domain within the gearbox, as shown in Figure 2. To comply with the design specifications of the gearbox and simplify the model, the fluid domain is designed as a simplified rectangular shape, with its boundaries set 10 mm away from the nearest point of the gears and a width of 20 mm. The model includes two gears and a baffle, with overall dimensions of the gearbox model being 150 mm × 80 mm × 20 mm, and it contains lubricating oil with a height of 20 mm. The radius of the small gear is 30 mm, while the radius of the large gear is 45 mm. There are two small holes with a radius of 8 mm at the bottom of the gears. The model achieves power and motion transmission through the meshing of the small and large gears. This structure has broad application value in mechanical engineering. The basic parameters of the gear pair in the model are detailed in Table 1. These parameters not only determine the load capacity and transmission efficiency of the gears but also significantly influence the distribution of the flow field. By accurately setting these basic parameters, we can construct a geometric structure in the model that is highly consistent with the actual gear pair, thereby providing strong data support for in-depth research on the flow field characteristics within the gearbox and optimizing the lubrication and cooling effects of the gear transmission system.
The phenomenon of tooth surface contact in the gear meshing area is not allowed. The fluid space between the tooth surfaces in the gear meshing area is extremely narrow. The mesh size in this area must be very small to accurately capture the flow details of the fluid between the tooth surfaces. During the iterative calculations and mesh updates, such size differences can easily lead to mesh deformation. Once the mesh deforms, it can result in inaccurate calculation results and may even cause computational errors, preventing the entire simulation process from proceeding normally. Additionally, excessively small mesh sizes can lead to another serious issue: a significant increase in computation time. To address these problems, by increasing the center distance of the gear pair by 1 mm, the differences in mesh size in the meshing area are effectively reduced, which lowers the total number of meshes, thereby optimizing the simulation process and shortening computation time.

3.2. Initial Conditions and Boundary Conditions

When conducting gear lubrication simulations, the initial conditions and boundary conditions are key factors that determine the accuracy of the simulation results, with the relevant parameters shown in Table 1. The simulations were performed using XFlow 2022 (Dassault Systèmes), high-fidelity CFD software based on the Lattice Boltzmann Method (LBM), which inherently resolves transient multiphase flows and complex moving boundaries through particle-based discretization. The initial temperature is set to an ambient temperature of 20 °C to simulate the initial thermal state of the system when it is not in operation. The initial velocity of the lubricant is set to zero, reflecting the stationary state of the system before startup. The initial value of the pressure field inside the gearbox is set to an atmospheric pressure of 101,325 Pa to simulate the environmental pressure under normal working conditions.
During the simulation process, the pressure-based solver demonstrated excellent stability and accuracy in handling fluid pressure, velocity, and other parameters in the complex flow field environment within the gearbox. To accurately capture the dynamic changes in the fluid in a short time, the time step for solving was finely set to 2 × 10⁻⁵ seconds, ensuring both the precision of the simulation and effective control of the computational load. Once the simulation calculations converged, an in-depth analysis of the simulation results was conducted.

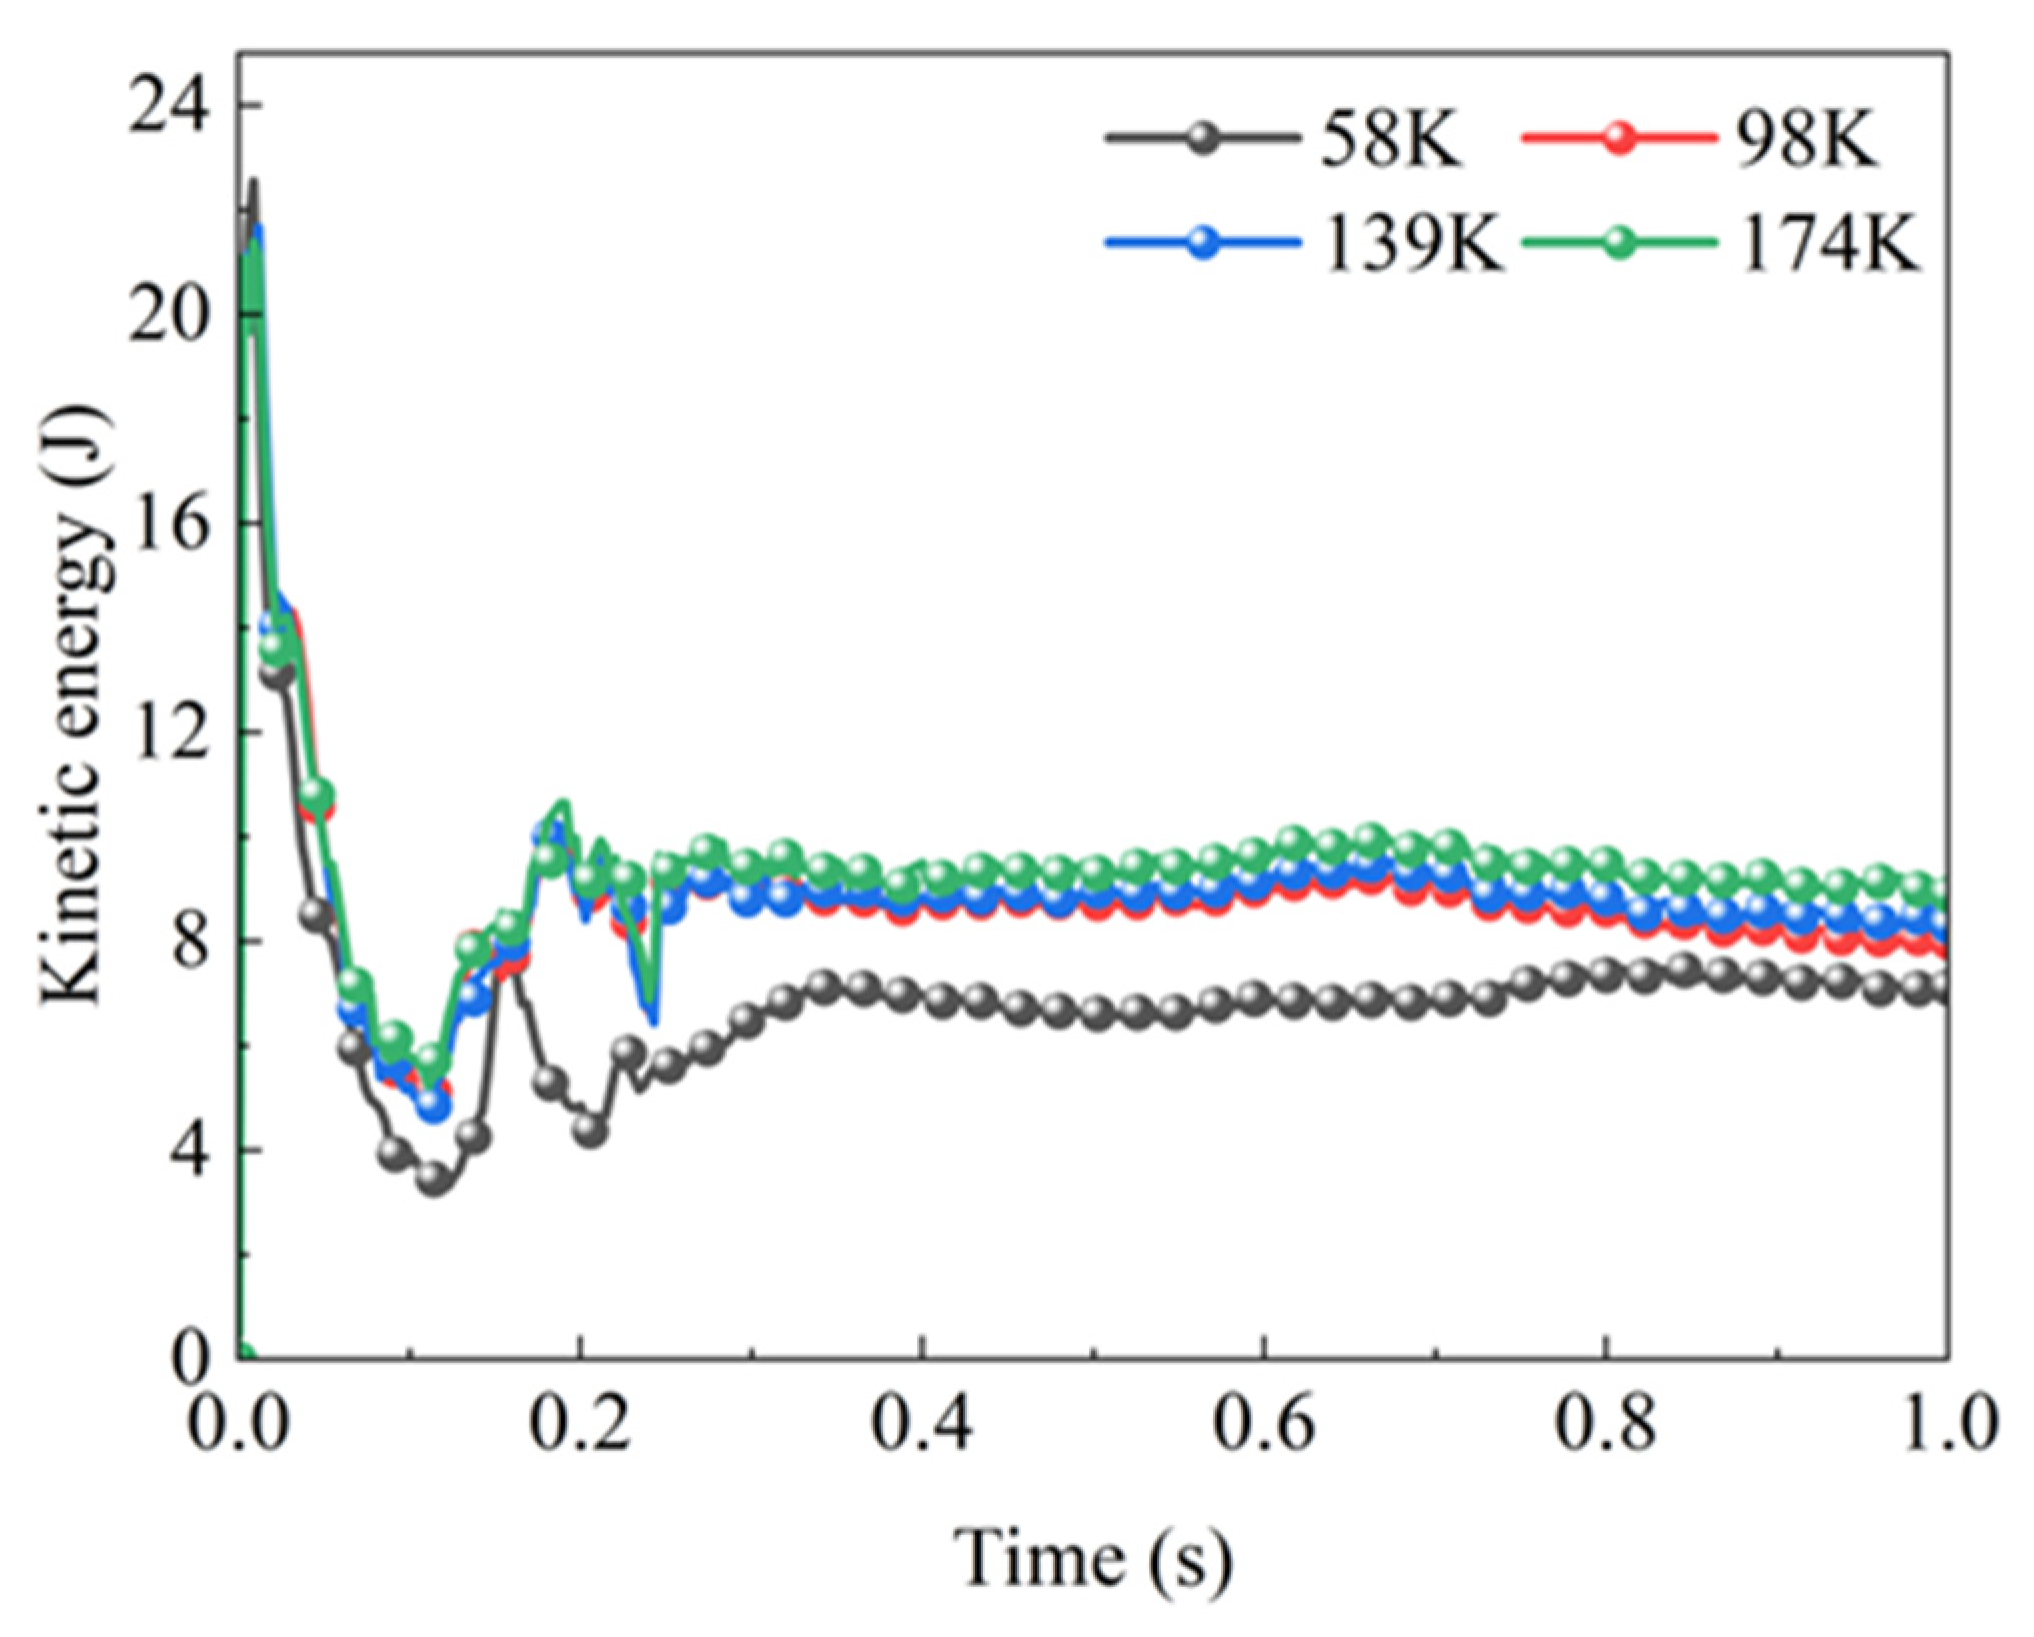
3.3. Lattice Independence Verification

In the field of numerical simulation, the accuracy and reliability of numerical computation results are closely related to the quality and density of the lattice [43,44,45]. A lattice density that is too high can improve result accuracy but significantly increases the computational workload, reducing computational efficiency; conversely, a lattice density that is too low may lead to insufficient result accuracy, failing to accurately reflect the actual situation. Therefore, ensuring the lattice independence of the results is a key step in validating simulation accuracy during numerical simulation research, as it effectively avoids errors introduced by improper selection of lattice density. In this study, the lattice was meticulously divided, and the lattice independence was verified by comparing simulation results at different lattice densities. Simulations were conducted using lattices of varying densities, resulting in the variation curve of fluid kinetic energy, as shown in Figure 3.
From the figure, it can be seen that at the initial moment, all curves exhibit relatively high kinetic energy values, primarily due to the vigorous movement of the fluid in the initial stage. However, as the number of lattices continuously increases, the rates of decline in the kinetic energy curve during the initial phase and the final stable value both show a trend of gradually becoming consistent. This indicates that as the lattice density increases, the dependence of the simulation results on lattice resolution is gradually weakening. When the lattice resolution reaches 98 k, the kinetic energy curves at different lattice densities almost completely overlap, indicating that, at this lattice density, the simulation results have essentially freed themselves from the constraints of lattice size, achieving lattice independence. Therefore, the simulations conducted with a lattice resolution of 98 k have a high degree of credibility and reference value.

4. Numerical Simulation and Discussion of High-Speed Gear Lubrication Oil Field

In this study, the evolution of oil volume fraction, velocity, and turbulence intensity in the gearbox with baffles operating at 3600 r/min under the same geometric parameters is first analyzed. Then, the turbulence intensity and vorticity distribution of the flow field at different velocities (2 m/s, 6 m/s, and 8 m/s) are compared. Next, the impact of oil depth and axial spacing on oil coverage is investigated. Finally, the influence of baffle hole diameter and axial spacing on the enthalpy of the flow field and the vortex potential energy in the flow field is explored.

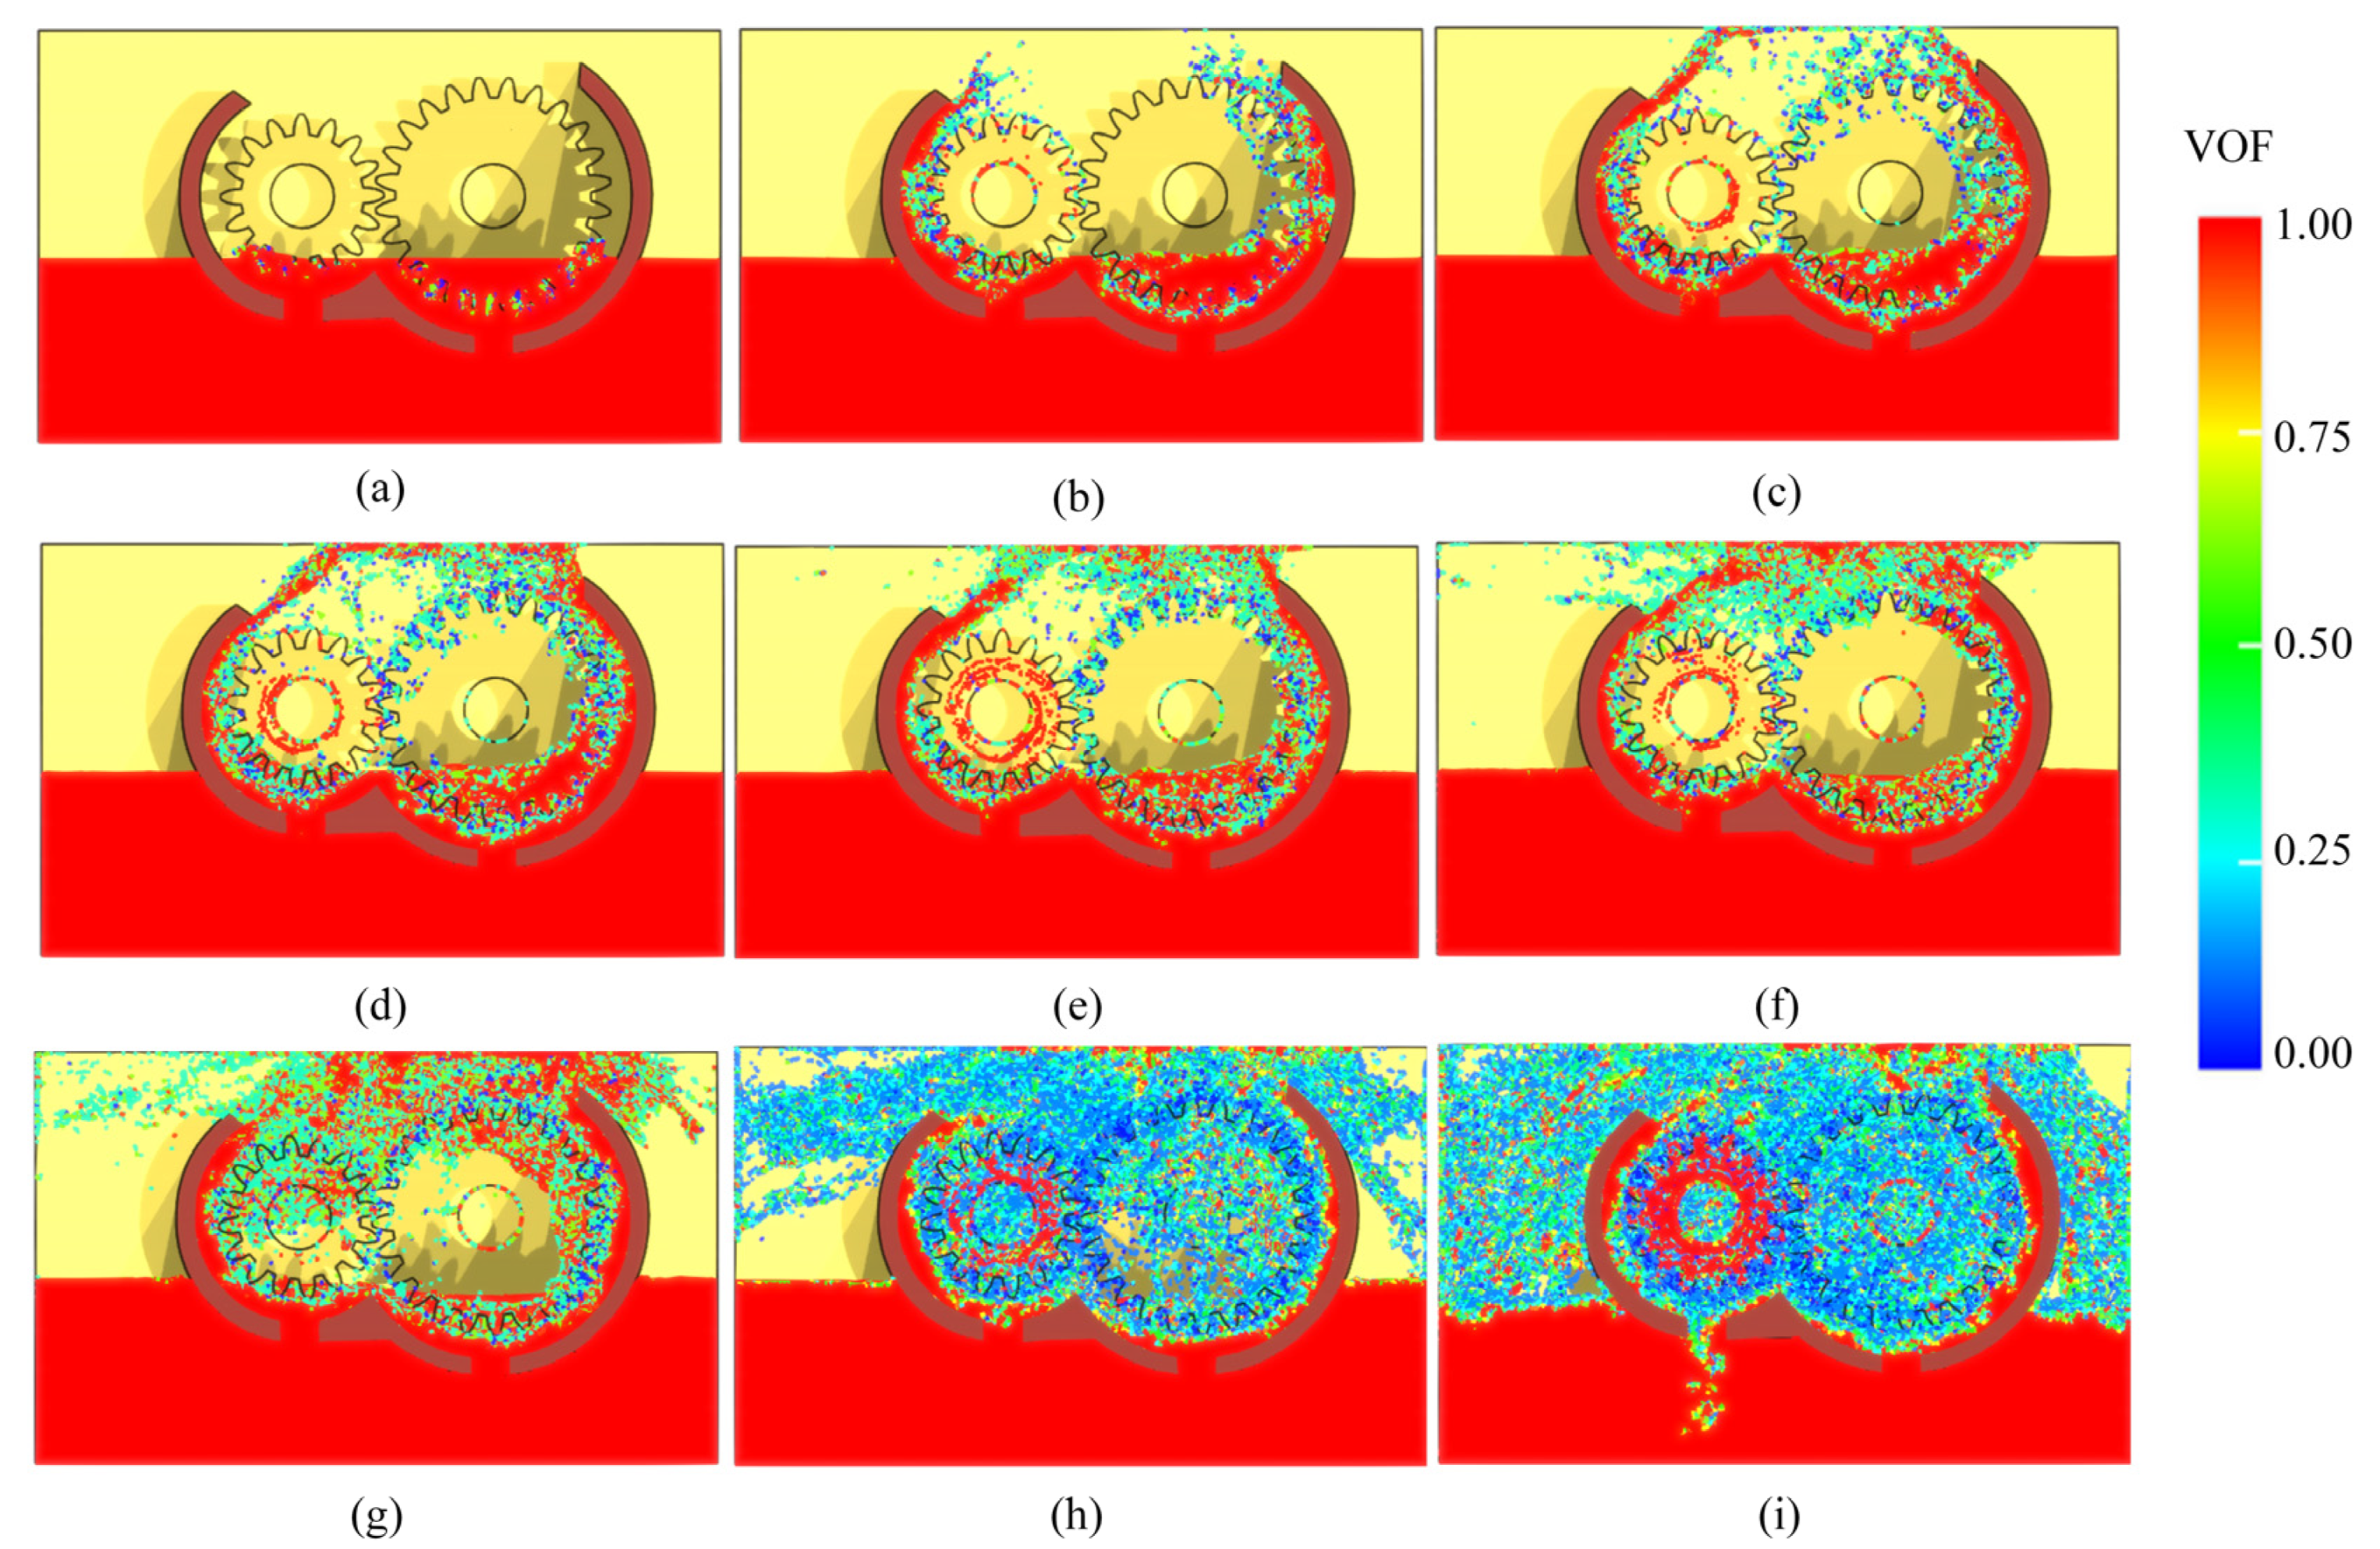
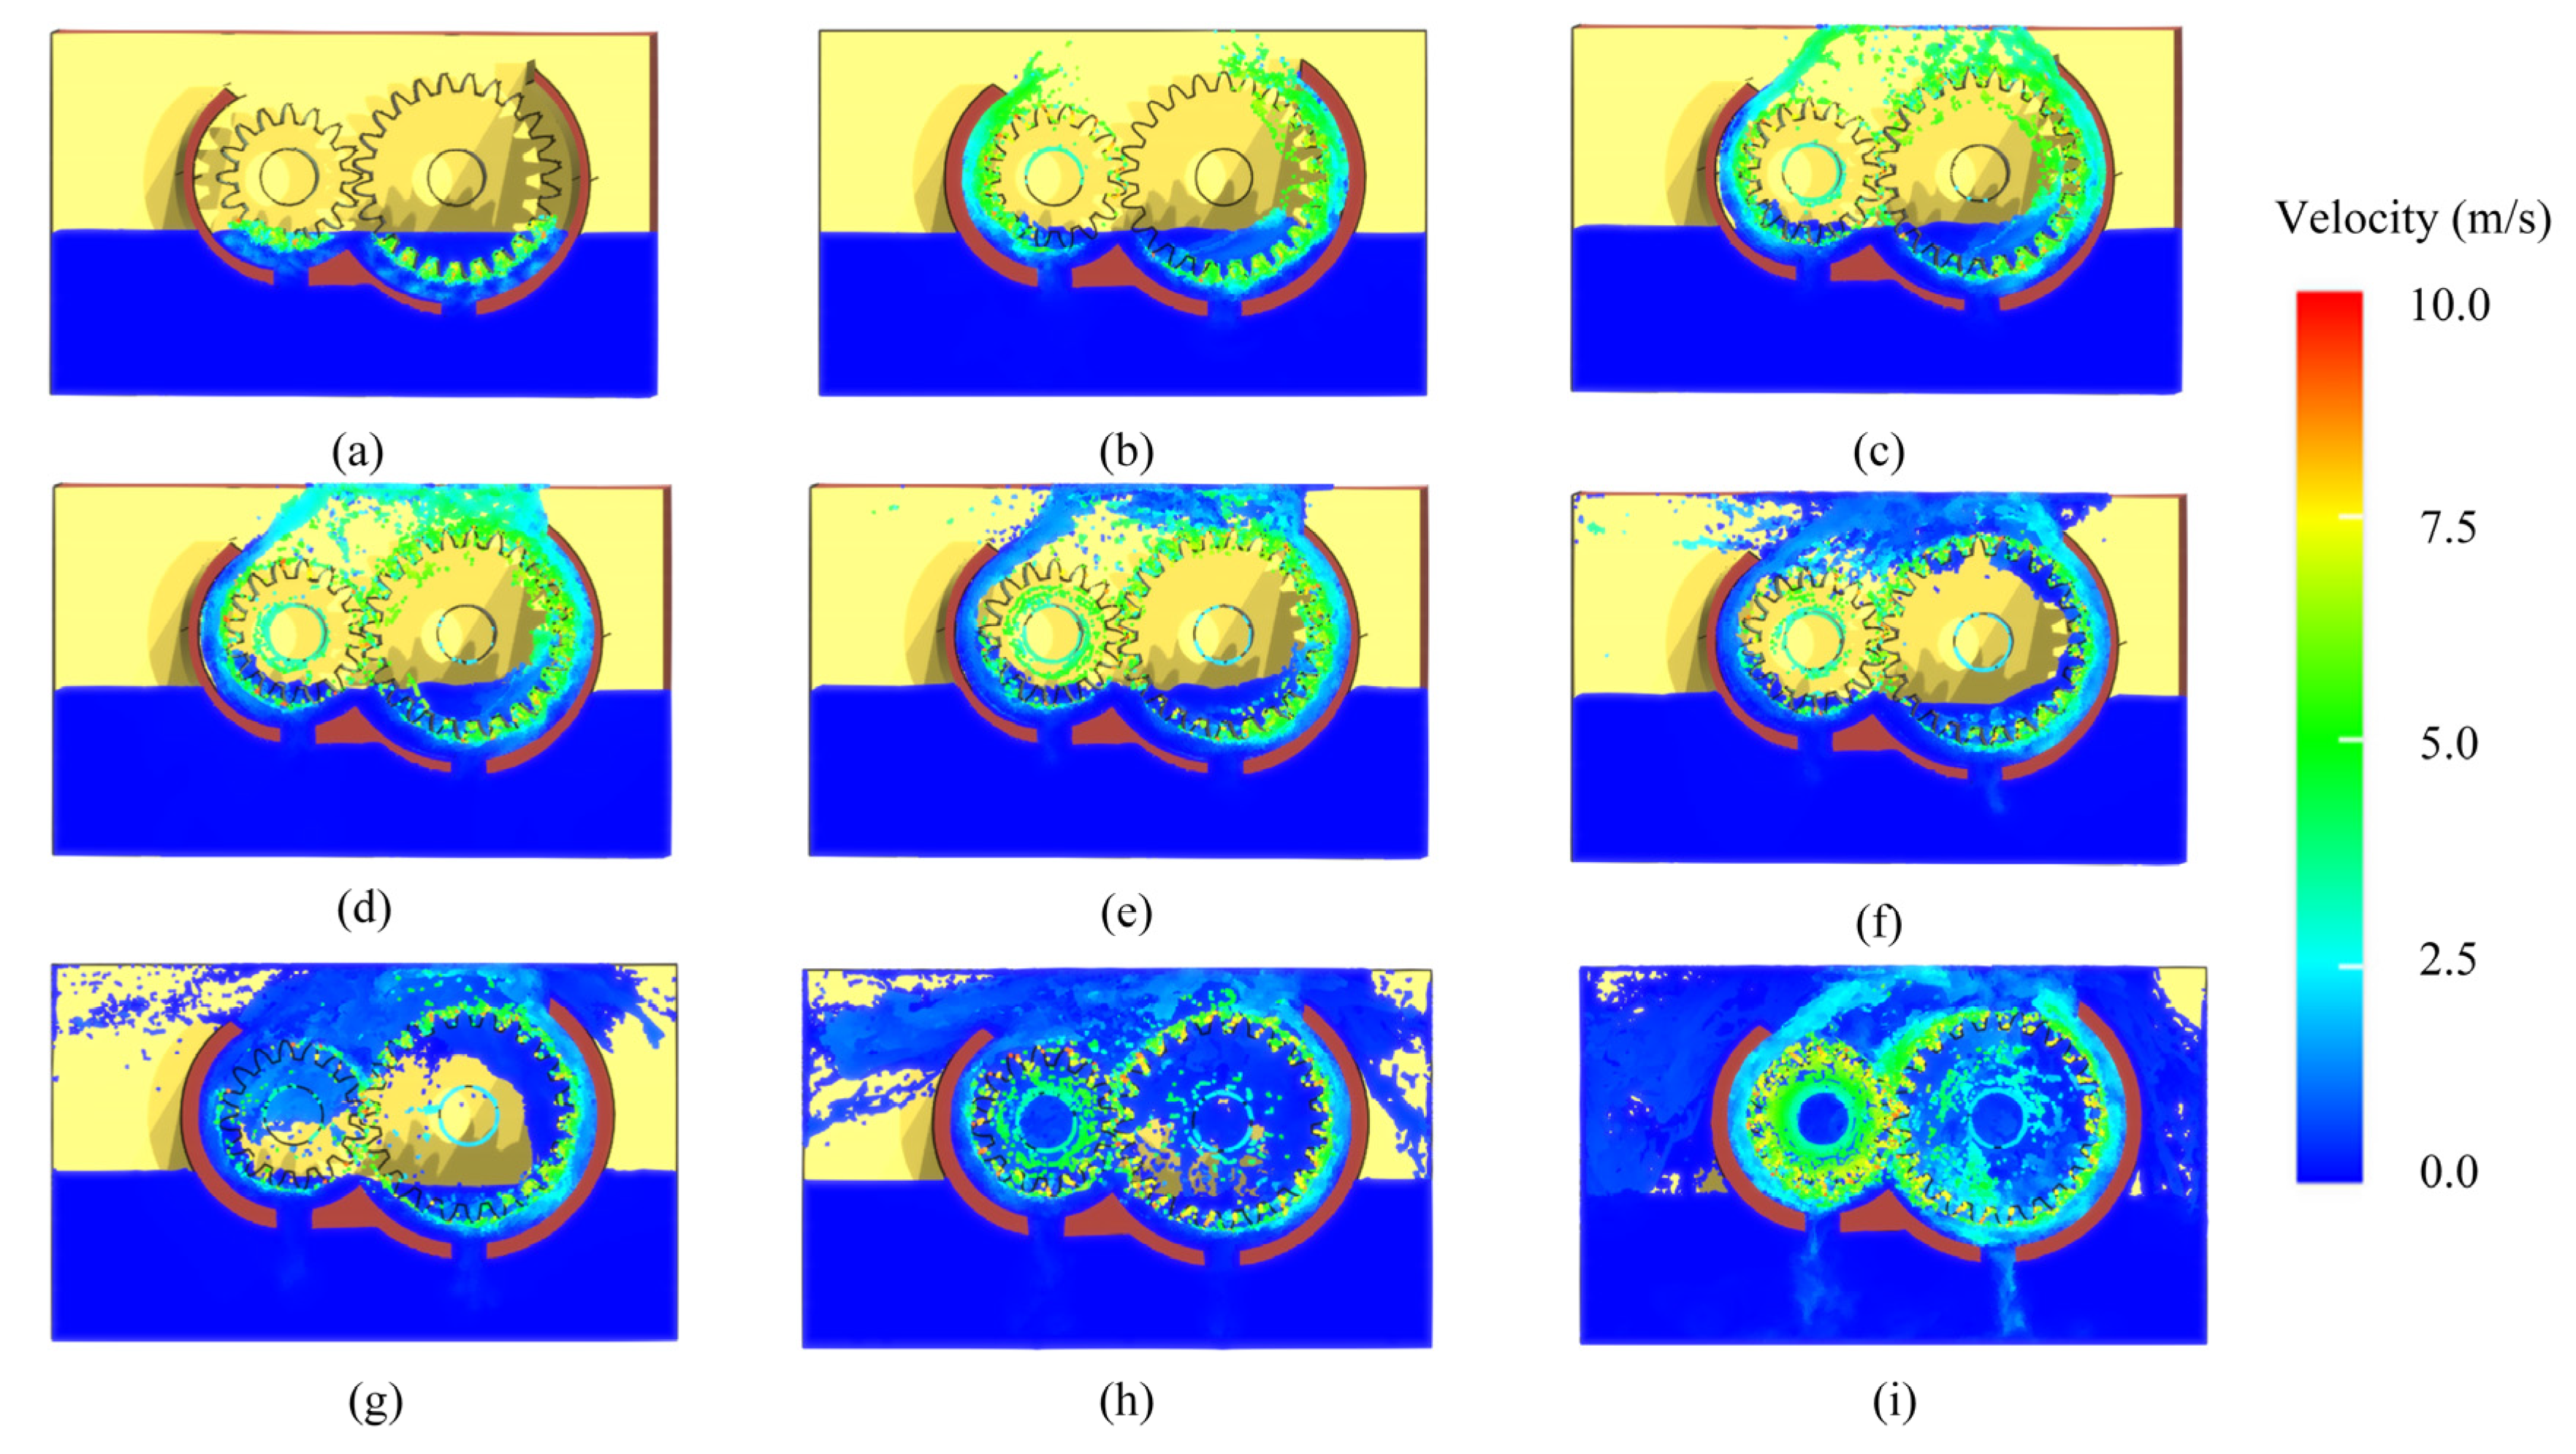
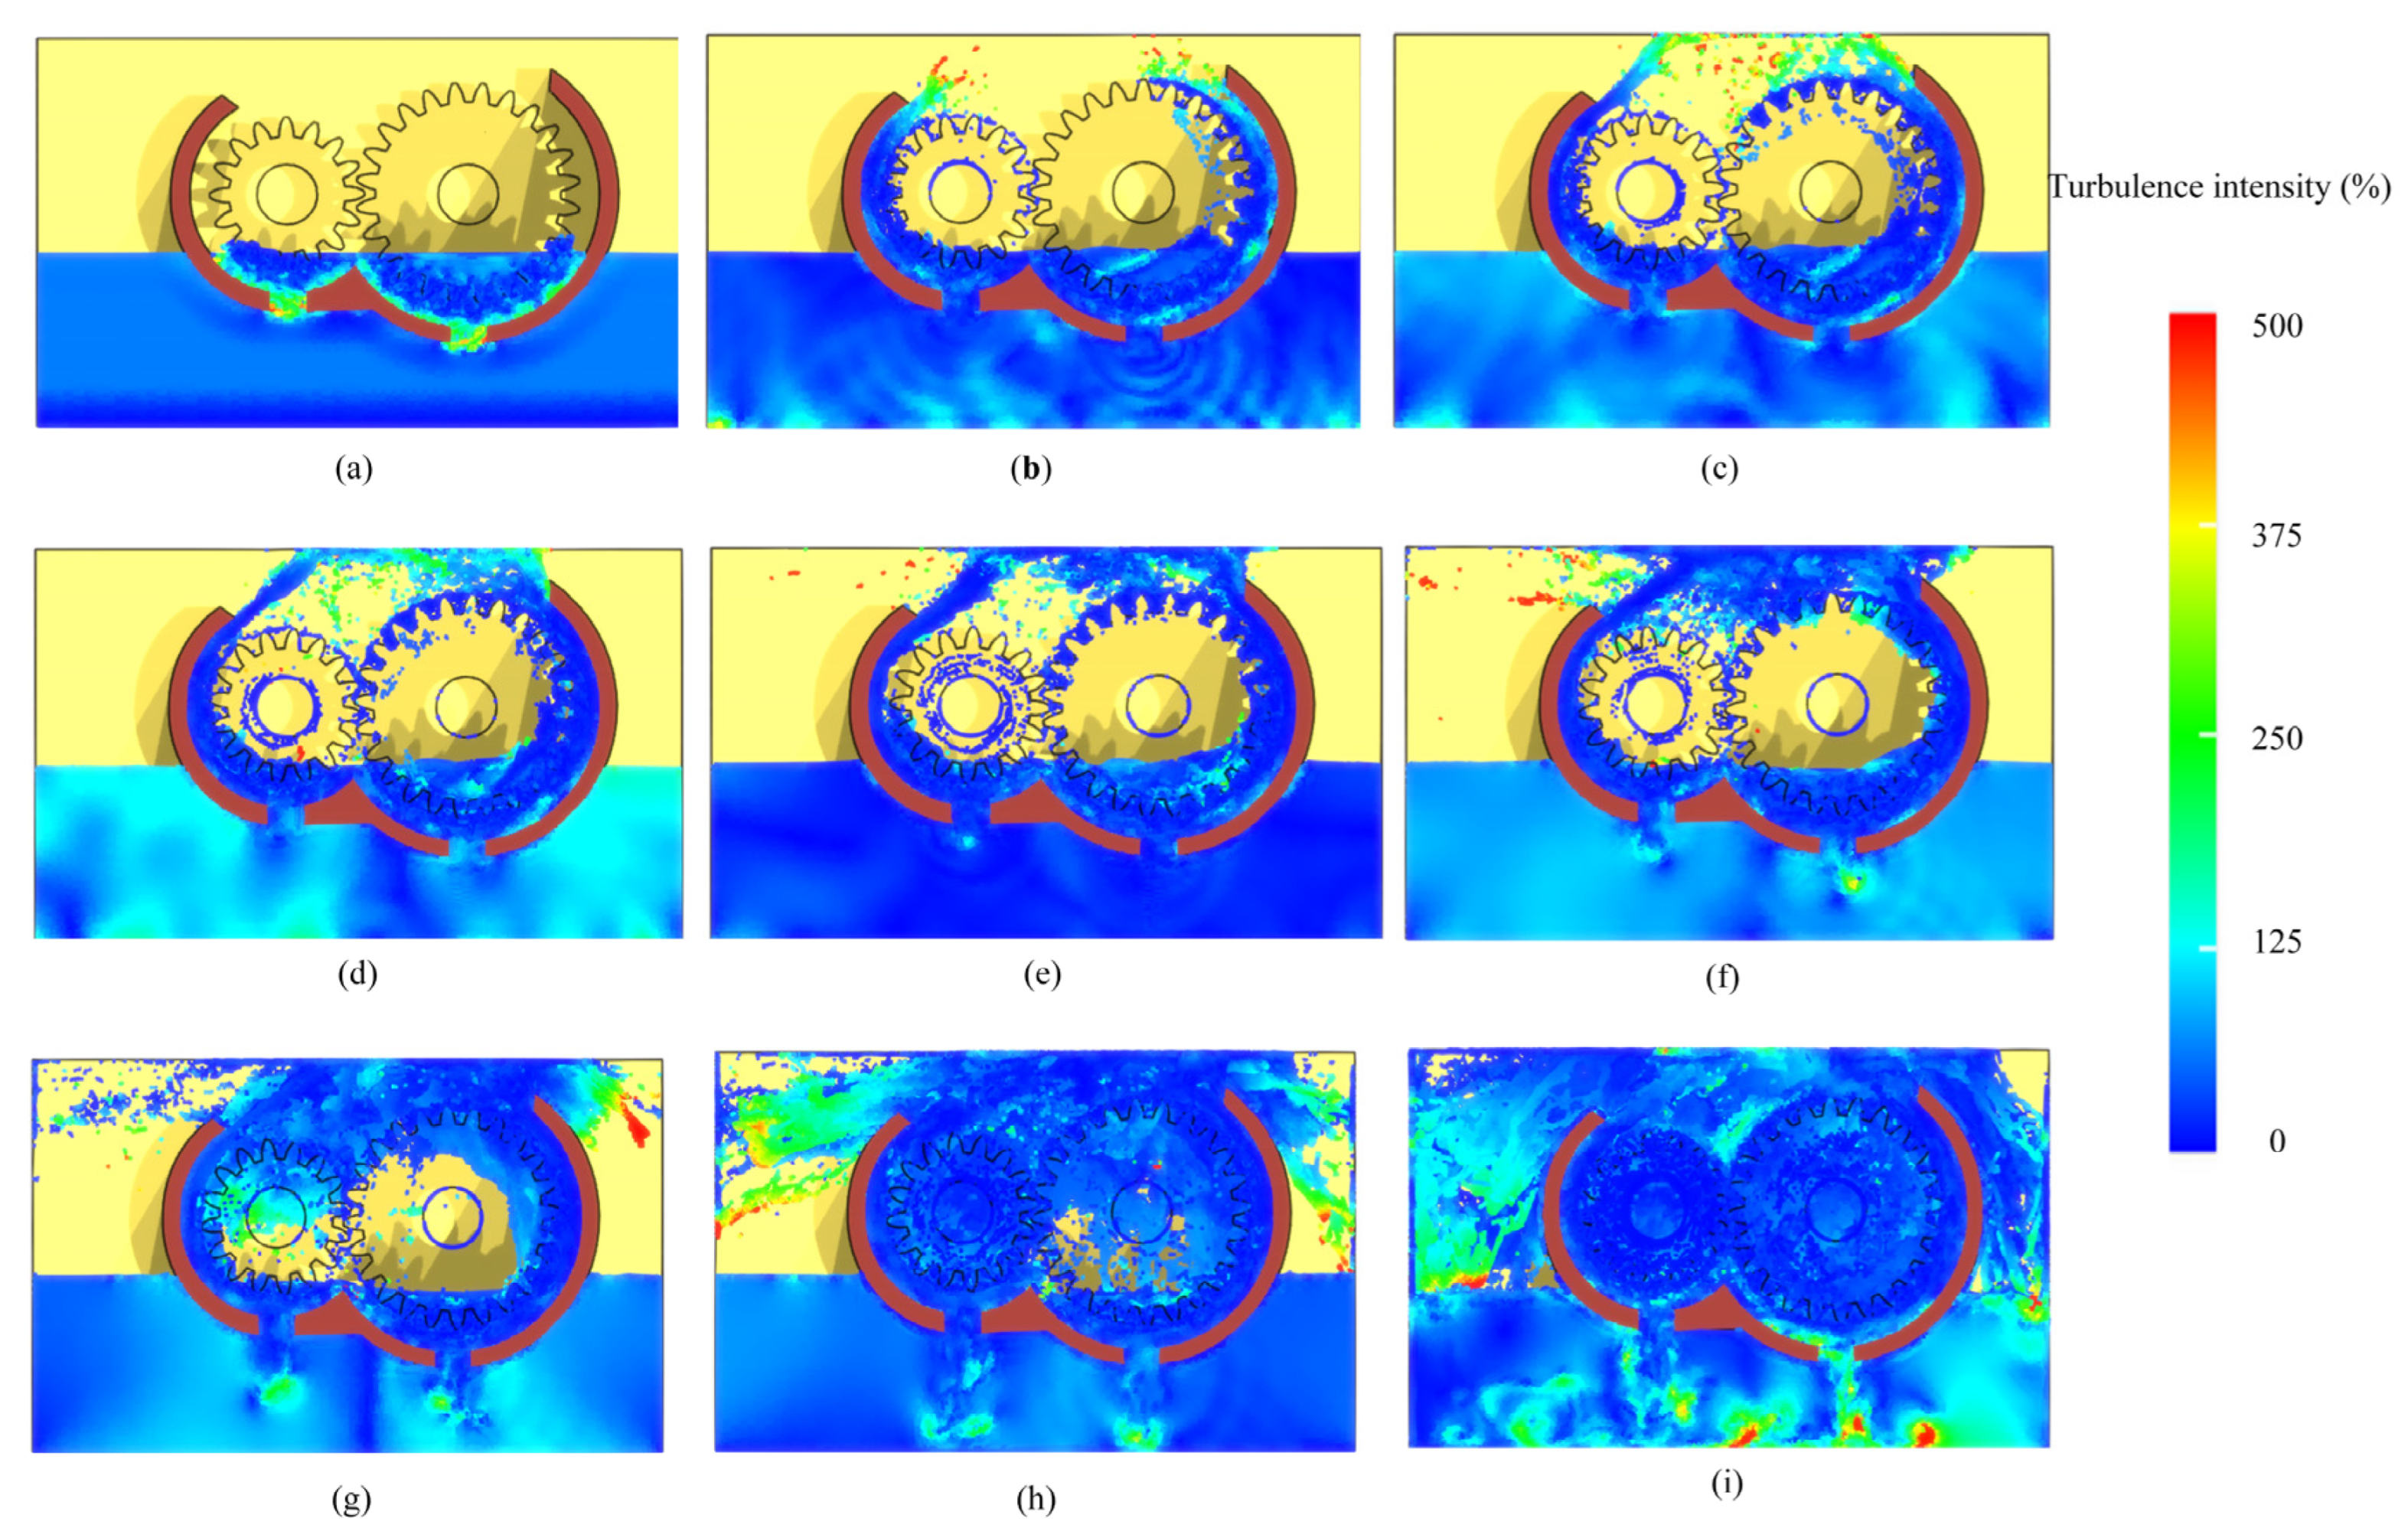
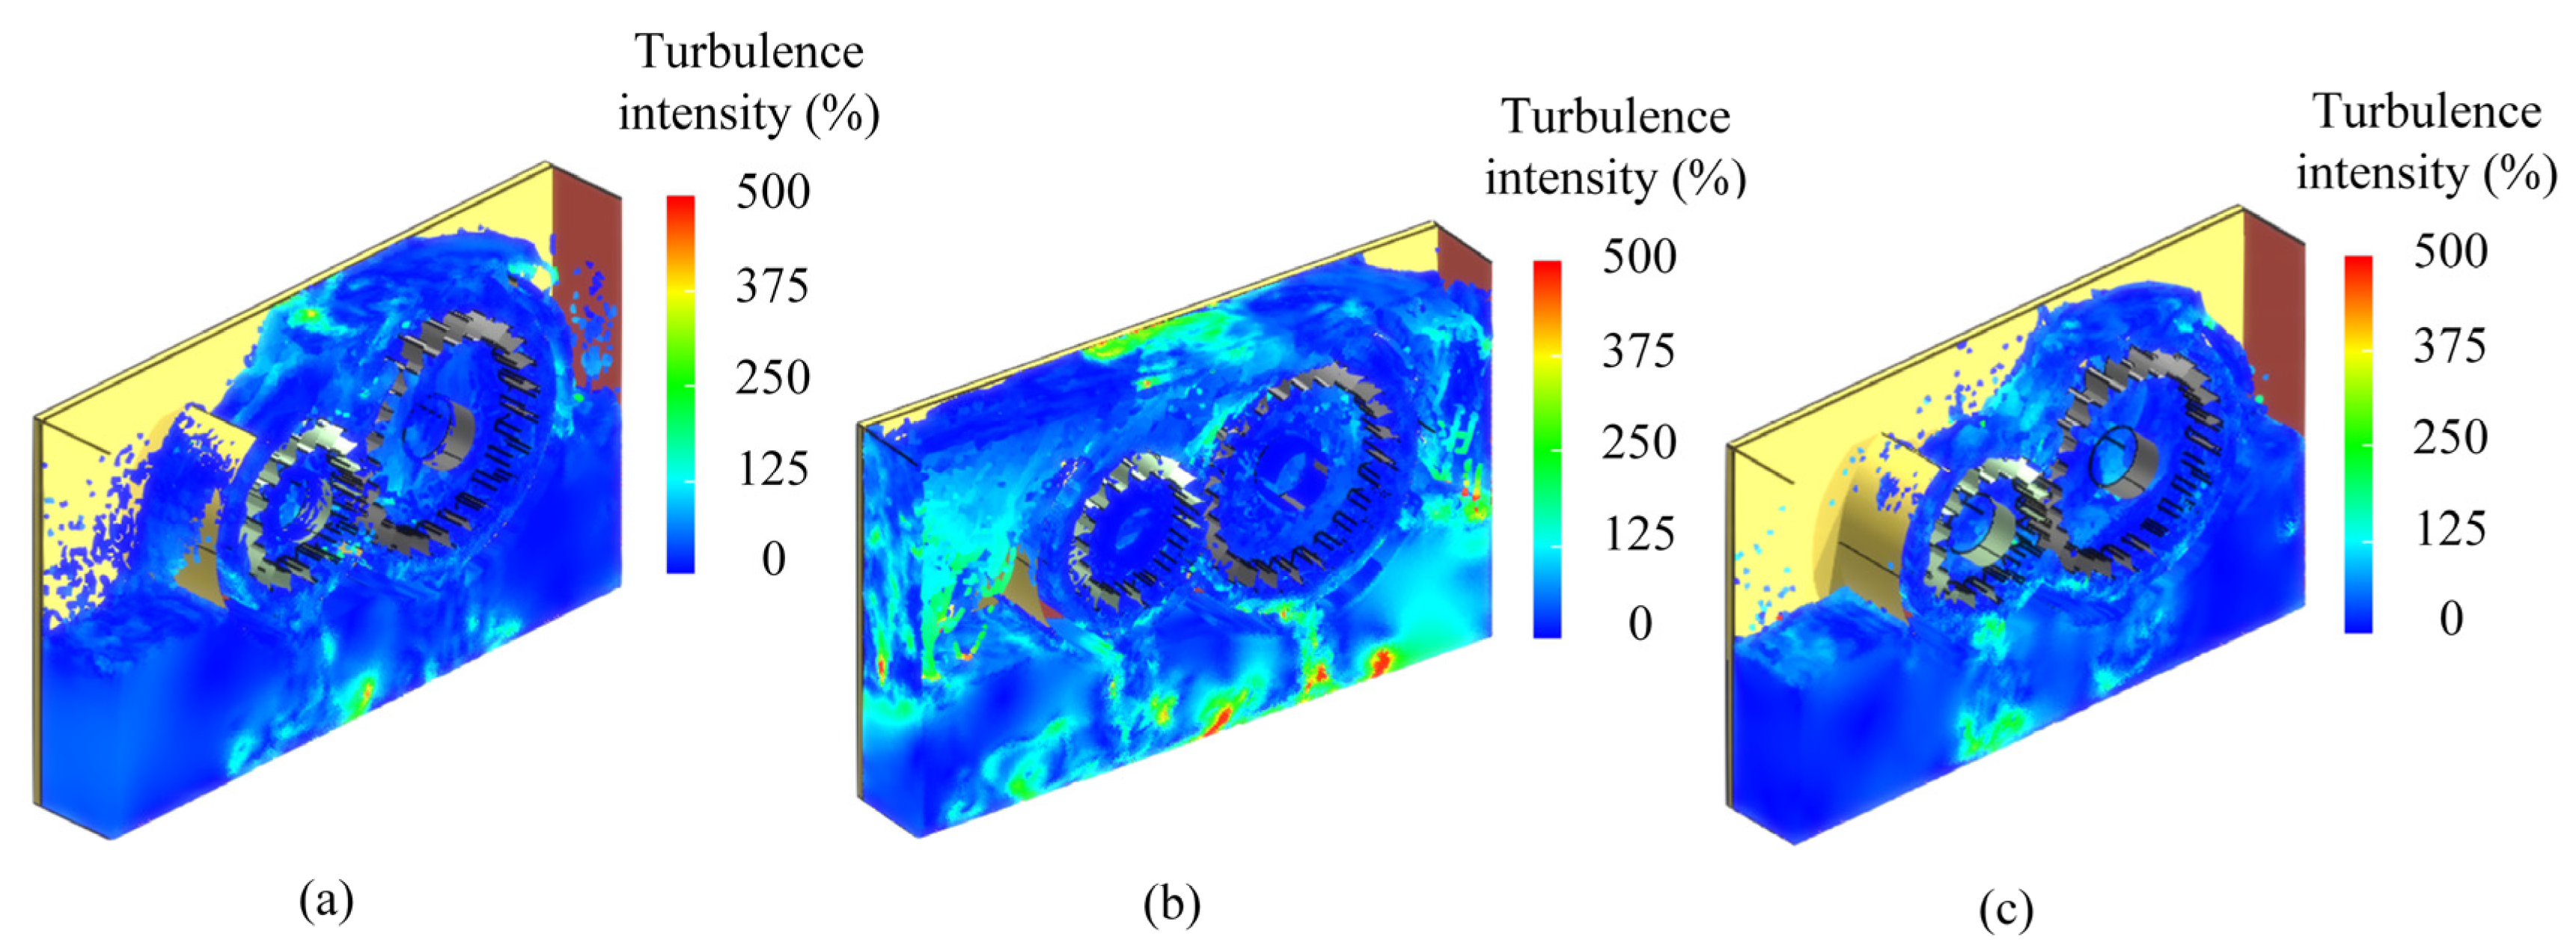
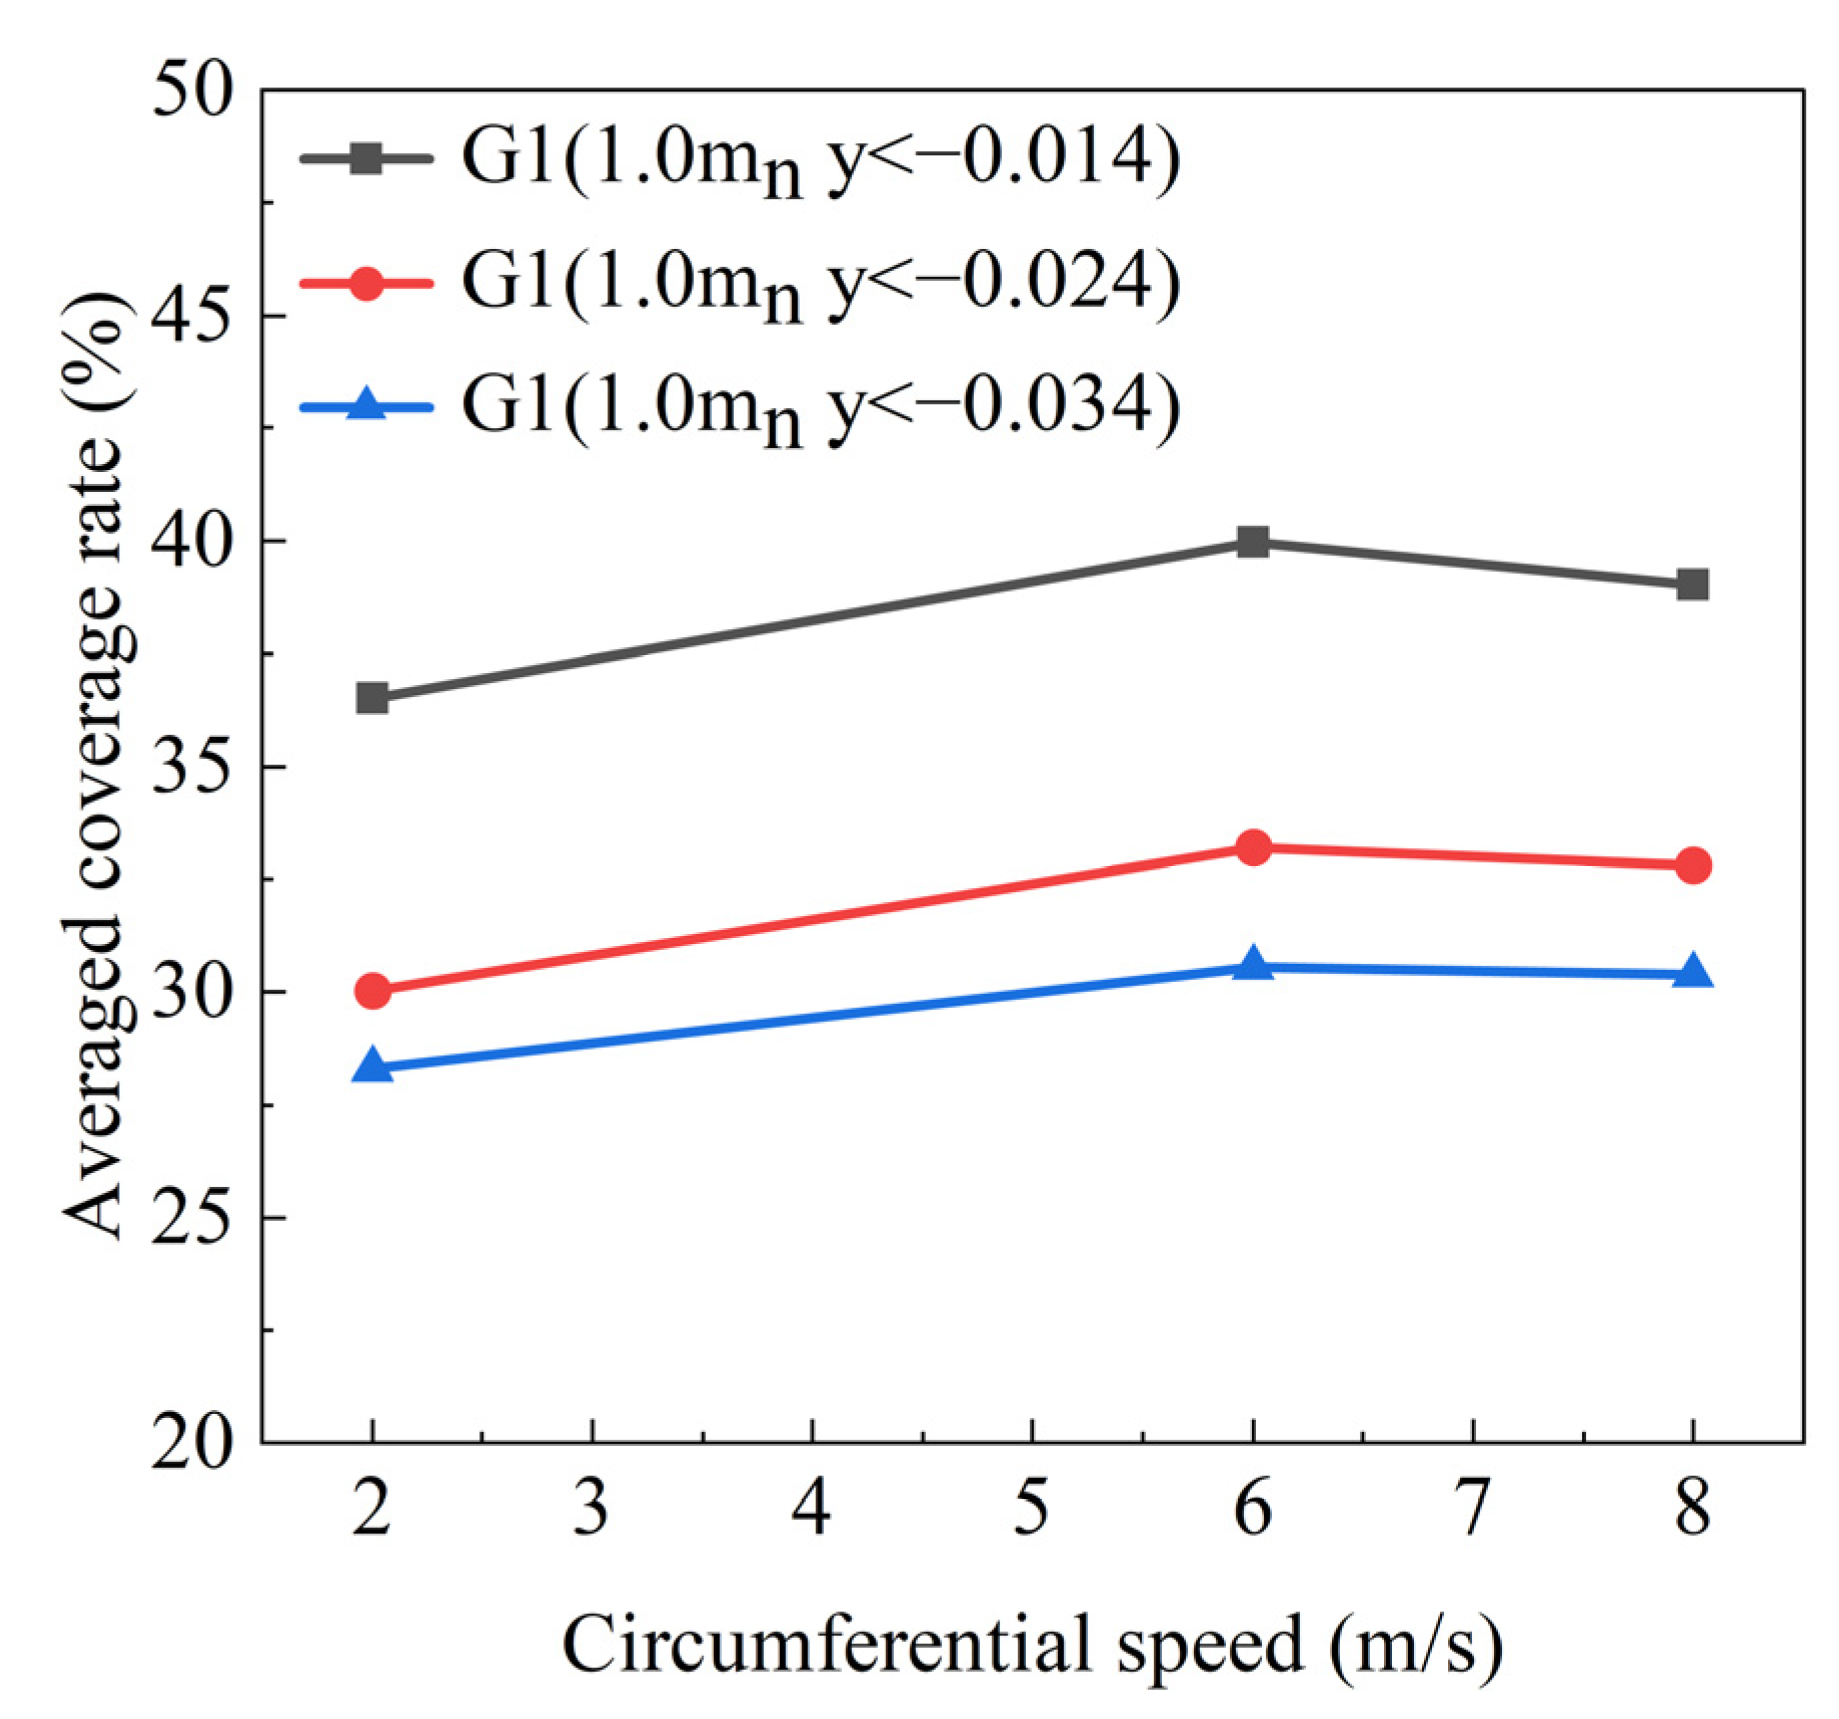
Distribution Pattern of Lubrication Oil in High-Speed Gearbox

To investigate the oil distribution within the gearbox under a gear rotational speed of 3600 r/min, the variation in the liquid phase volume fraction over time is analyzed, as shown in Figure 4. Each subplot represents the fluid distribution under different temporal conditions. In the initial state, a small amount of fluid is distributed around the gear, with a color close to red, which indicates that the fluid volume fraction is approximately 1.0, as shown in Figure 4. As time progresses, the fluid forms a more complex distribution around the gears, as shown in Figure 4b,c. Part of the fluid adheres to the lower surface of the gears, while a small portion flows toward the overflow hole at the center of the gear bottom. The distribution of the fluid volume fraction becomes uneven, with some fluid moving to the top of the housing and being displaced toward the gear meshing area. In Figure 4d–f, the fluid distribution becomes increasingly complicated, with more mixing regions appearing. The oil carried by the small and large gears converges at the center, creating an impact phenomenon before flowing toward the top of the gearbox. In Figure 4g,h, the fluid distribution reaches a more complex state, with the fluid surrounding the gears gradually mixing evenly with the air. In Figure 4i, the lubrication oil attains a stable distribution within the gearbox, with a higher concentration observed at the gear tooth tips and roots. In contrast, the oil distribution in the gear gap is lower, indicating that the lubrication oil is primarily concentrated in the key lubrication areas.
The observed phenomenon indicates that the oil supply in the gear meshing area initially increases before stabilizing over time. This suggests that gear speed significantly influences the distribution of lubrication oil. Higher speeds result in more intense splashing and a broader distribution of oil. Furthermore, the design of the bottom oil guide structure improves the internal flow field distribution and lubrication state within the gearbox. The volume fraction contours provide a comprehensive visualization of the changes in the internal flow field parameters of the gearbox and offer profound insights into the evolution of the gearbox flow field.
The velocity distribution of the oil in the lubrication system is crucial for lubrication efficiency. Figure 5 illustrates the velocity distribution of the oil in the gear transmission system under a rotational speed of 3600 r/min at different time points. In Figure 5a, the velocity distribution of the gear is primarily concentrated at the bottom, with higher velocities at the edges of the gear bottom, while other areas exhibit lower velocities. In Figure 5b,c, the rotation of the gears agitates the lubrication oil, with higher velocities at the regions where the gears contact the walls. Due to the obstruction caused by the walls, the lubrication oil moves along the curved surface towards the top of the gearbox, where it converges. The presence of the wall allows the lubrication oil to better lubricate the top gears, thereby enhancing lubrication efficiency. In Figure 5d–f, the velocity distribution in the gear meshing area becomes more complex, with higher fluid velocities. This indicates that the rotation of the gears drives fluid motion, creating regions of high fluid velocity. The fluid velocity is higher on both sides of the gear, resulting from the interaction between the gear teeth and the walls. In Figure 5g–i, the fluid velocity in the gear meshing area is higher, exhibiting a significant velocity gradient, which in turn results in higher shear stress. This is due to the rotation of the gears, which drives the surrounding fluid flow. The meshing and disengagement of the gear teeth cause the fluid to accelerate and decelerate, resulting in high-velocity fluid flow in the meshing area. Furthermore, under the centrifugal force generated by the rotation of the gear, the fluid flows outward from the center of the gear and forms centrifugal flow in the top region of the gear. During this process, the geometry and surface roughness of the gear teeth influence the fluid flow pattern.
Turbulence intensity is an index to measure the degree of turbulence activity in fluid flow, which reflects the degree of random fluctuation of fluid velocity. Figure 6 illustrates the temporal variation in turbulence intensity within the fluid flow in the gearbox operating at 3600 r/min. In the initial stage of gear rotation, the turbulence intensity is low, as shown in Figure 6a. As time progresses, the turbulence intensity gradually increases, as depicted in Figure 6b,c. The rotation of the gear is the primary cause of fluid motion and the increase in turbulence intensity. The rotation of the gear drives the surrounding fluid and generates shear forces that induce turbulence. In Figure 6d,e, the turbulence intensity at the top of the gearbox increases significantly during the interaction between the oil and the wall of the gearbox. In Figure 6f–i, as the gear speed increases, higher turbulence intensity is observed on both sides of the gearbox. The bottom of the gearbox also experiences significant turbulence due to the disturbance effect. The geometry and motion of the gears lead to fluid dynamic effects, such as vortices and flow separation, which contribute to the increase in turbulence intensity.
Figure 7 shows the variation in turbulent intensity within the gearbox with changes in the tangential velocity of the gear. When the tangential velocity of the gear increases from 2 m/s to 8 m/s, a significant change in turbulent intensity within the gearbox is observed. At low radial velocities of the gear, the lower turbulent intensity of the fluid indicates a weak interaction between the fluid and the gear, with the fluid dynamics being more orderly. However, as the tangential velocity of the gear gradually increases, the disturbance in the fluid becomes more significant at moderate speeds, with the turbulent region around the gear expanding, especially in the gear teeth area and the downstream wake. The increase in turbulence is caused by the strong force exerted by the high-speed rotating gears on the surrounding fluid, which leads to a more chaotic and disordered fluid flow. But when the tangential velocity of the gear continues to increase and reaches a certain critical value, the turbulent intensity weakens. This phenomenon can be attributed to the optimized design of the baffle, which guides and constrains the fluid flow, effectively creating a stable flow region within the baffle. The results indicate that most of the fluid is contained within the stable region, and only when the gear tangential velocity is within a specific range does the fluid escape from the baffle region.
The experimental results demonstrate that the lubricant volume fraction exhibits temporally heterogeneous distribution characteristics, with pronounced high-concentration zones forming specifically within the gear meshing zone, while reduced oil film thickness in gear gaps arises from fluid centrifugal effects. This distribution pattern exhibits a strong correlation with the centrifugal force field generated by high-speed gear rotation and the flow-guiding effect of baffles. As the rotational speed increases, the accumulation of lubricant at tooth tips and roots intensifies, confirming a prioritized oil supply mechanism to critical contact regions during dynamic lubrication. Notably, a spatiotemporal coupling exists between fluid velocity distribution and turbulence intensity evolution: transient high-speed flows in the meshing zone not only enhance lubricant transport to engagement areas but also trigger localized turbulence surges, which may compromise oil film stability.
Figure 8 shows the vorticity intensity contours of the fluid inside the gearbox at different gear radial velocities. Vorticity is a physical quantity that measures local rotational motion in a fluid, and its intensity reflects the degree of rotation and the complexity of the flow. It is evident that as the gear tangential velocity increases, the vorticity intensity rises significantly, particularly in the regions adjacent to the gears, where rotational motion becomes more pronounced. At lower radial velocities (2 m/s), the vorticity intensity is relatively low, and the rotational motion of fluid remains stable. As the velocity increases, fluid disturbances become more pronounced, and the shear effects between the gear teeth intensify. The vortex structure evolves into a more complex form, with large-scale vorticity distributions emerging in the downstream wake region, gradually creating distinct high-vorticity zones that considerably impact the stability of the flow field. The distribution of vorticity around the gears indicates that increasing speed exacerbates the nonlinear characteristics of the flow field, thereby imposing greater demands on the aerodynamic performance and fluid dynamics of the gear.
Figure 9 illustrates the relationship between average lubrication oil coverage and rotational speed. As the circumferential speed increases, the lubrication oil coverage on the gear surface gradually rises until it reaches a certain value, after which the growth rate slows and a slight decrease occurs. This concentrated distribution of lubricant aids in forming a stable oil film, which is essential for protecting mechanical equipment and ensuring smooth operation. There are variations in the initial coverage rate and the degree of decrease at different oil immersion depths. As the immersion depth increases, the average oil coverage on the gear surface improves. The variation in coverage and initial coverage rate shows significant differences under different immersion depths. Overall, with the increase in immersion depth, the average oil coverage on the gear surface rises. The results show that the deeper oil immersion depth can effectively improve the lubrication coverage of the gear surface, improve the contact and friction conditions between gears, and reduce friction loss and wear. In practical applications, optimizing oil immersion depth and adjusting operating speeds can further improve the oil film coverage on the gear surface, thereby enhancing lubrication conditions and performance.
Figure 10 illustrates the relationship between the average coverage rate of the baffle and gear with varying axial gaps and the circumferential velocity. The four curves in the figure represent the cases where the axial gap is 1.0, 0.6, 1.4, and 1.8 times the standard value, respectively. As the circumferential velocity increases, the average coverage rate initially increases significantly and then slightly decreases. The magnitude of the decrease and the initial coverage rate vary under different axial gap conditions. At low circumferential velocities, a smaller axial gap (0.6 mn) can sustain a higher average coverage rate. This suggests that, in low-speed operating environments, a smaller baffle can more effectively retain the lubricating oil on the lubrication surface, thereby reducing friction and potential wear. As the circumferential velocity increases, the average coverage rate decreases under all axial gap conditions, with the decline being relatively slower for smaller axial gaps. This suggests that under high-speed operating conditions, a smaller axial gap baffle can maintain lubrication effectiveness more persistently. This characteristic is particularly crucial for equipment operating at high circumferential velocities, as such equipment encounters greater lubrication challenges. On the other hand, the baffle with a larger axial gap (1.8 mn) exhibits a slow increase in average coverage at high speeds, which may lead to uneven distribution of the lubricant on the lubricating surface, thereby increasing the risk of wear. This suggests that, when designing lubrication systems for high-speed operations, the axial gap size of the baffle must be carefully considered to ensure adequate lubrication performance.
The addition of a baffle outside the gearbox significantly influences the temporal variation characteristics of fluid enthalpy within the gearbox, as shown in Figure 11a. Enthalpy, as a key parameter representing the energy state of a thermodynamic system, directly reflects the efficiency of energy conversion and transfer within the system. During the initial phase, the fluid enthalpy values under all through-hole diameter conditions rise rapidly, fluctuate to a certain magnitude, and ultimately stabilize. This indicates that the system quickly absorbs energy upon startup and gradually reaches a thermodynamic equilibrium state. Analysis reveals that the influence of different through-hole diameters on fluid enthalpy varies significantly. When the through-hole diameter is 4 mm, the fluid enthalpy is at its lowest; conversely, when the through-hole diameter is 12 mm, the fluid enthalpy reaches its highest. However, the difference in enthalpy values between the 8 mm and 12 mm through-hole diameters is notably smaller than the difference between the 4 mm and 8 mm diameters. When the through-hole diameter is small (4 mm), the reduced flow area hinders the convection and energy exchange, leading to a lower enthalpy value. As the diameter increases to 8 mm or above, the convection and mixing of the fluid are significantly enhanced, leading to more efficient energy transfer within the system and a notable increase in enthalpy. However, as the through-hole diameter increases from 8 mm to 12 mm, the improvement in fluid mixing diminishes, and the further enhancement in energy transfer efficiency approaches saturation. Therefore, the impact of through-hole diameter on fluid enthalpy follows a nonlinear trend, indicating that an optimized through-hole design contributes to balancing fluid dynamics performance and thermodynamic efficiency.
Figure 11b illustrates the dynamic characteristics of fluid vorticity potential energy over time within the gearbox under varying through-hole diameters. Vorticity potential energy, serving as a parameter to characterize the intensity of vortical motion within the fluid, has a direct impact on the lubrication performance within the gearbox. The data indicate that under all conditions, the vorticity potential energy is initially high, rapidly decreasing before stabilizing. The rapid initial decline can be attributed to the strong response induced by the introduction of the baffle, which triggers significant vortical motion. Over time, the vortical motion diminishes, leading to a gradual reduction and stabilization of the vortical energy. The diameter of the through-hole significantly influences the stabilized vortical energy. In scenarios with smaller diameter in the perforations, the stabilized vortical energy is higher, primarily due to increased local flow resistance, which induces stronger vortical motion. Conversely, larger diameters significantly reduce the vortical energy, suggesting that an enlarged perforation reduces fluid resistance, thereby mitigating vortical motion. By adjusting the diameter of the baffle perforations, the vortical intensity can be effectively controlled, thereby influencing the kinetic energy and the energy dissipation process.
Figure 12a illustrates the effect of different axial gaps between the gear and the added baffle on the temporal variation in fluid enthalpy within the gearbox. In the initial phase, the fluid enthalpy rises sharply before gradually reaching a steady state. Under different axial clearance conditions, the stable value of fluid enthalpy varies. The increase in the gap between the baffle and the gear raises the enthalpy of the fluid within the gearbox. However, as the axial gap increases from 1.4 mm to 1.8 mm, the effect of the increase in fluid enthalpy gradually diminishes. The results indicate that within the optimal gap range, an increase in the gap enhances fluid mixing and energy transfer, thereby improving thermodynamic performance. However, beyond this range, further increases in the gap have a limited effect on improving thermodynamic performance. Future research will integrate real-world operating conditions to optimize the baffle design and balance fluid dynamics and thermal efficiency.
Figure 12b illustrates the time-dependent variation in the vorticity potential energy of the fluid within the gearbox, influenced by different externally installed gap baffles. Initially, the vorticity potential energy is elevated across all gap conditions, but it then experiences a rapid decline before stabilizing. This behavior is attributed to the influence of the baffles on the internal fluid dynamics of the gearbox, which causes a swift adjustment in its energy state, leading to a quick increase in vorticity potential energy. As time progresses, the system gradually approaches thermodynamic equilibrium, resulting in a corresponding stabilization of the vorticity potential energy. Under varying baffle diameter conditions, the stable values of fluid vorticity potential energy exhibit notable differences. A baffle with a smaller gap results in fluid vorticity potential energy stabilizing at a lower level, whereas a baffle with a larger gap leads to a higher stable fluid vorticity potential energy. The smaller gap baffle increases resistance to fluid flow, thereby promoting energy dissipation. In contrast, the larger gap baffle reduces fluid resistance, resulting in less energy dissipation compared to the smaller gap baffle. These findings underscore the importance of studying variations in fluid vorticity potential for optimizing the design and operation of gearboxes. By adjusting the baffle gap, one can control the flow and energy dissipation characteristics of the fluid within the gearbox, thereby enhancing thermal management and lubrication performance. This has significant practical implications for improving gearbox operational efficiency, reducing energy loss, and extending the lifespan of equipment.

5. Conclusions

This paper presents a novel approach to investigating the flow field distribution and optimization design of gear transmission systems, which are crucial for improving gearbox efficiency and reliability. The innovative coupling technique, combining the Lattice Boltzmann Method (LBM) and Large Eddy Simulation (LES), is introduced as a key contribution. This novel coupling method significantly enhances the accuracy and efficiency of modeling the complex fluid dynamics within the high-speed gear lubrication flow fields. Furthermore, this paper develops a new solution strategy to analyze the heat transfer dynamics of these systems, focusing on the effects of baffles on the flow characteristics. The proposed modeling framework not only provides a detailed understanding of the flow field distribution mechanisms but also offers valuable insights into the dynamic characteristics of gear lubrication, contributing to the optimization of gear transmission systems.
(1)
Based on the LBM–LES coupled model, a modeling and heat transfer dynamics framework for high-speed gear lubrication flow fields was established. The flow field distribution mechanisms during the gear rotation process were investigated in detail. By analyzing the dynamic evolution of the gear lubrication process under the presence of baffles in the gearbox, this study examined the dynamic variations in key parameters. These include turbulent kinetic energy, velocity, and pressure drop under different flow velocities and mixer configurations. The results provide a solid theoretical foundation for subsequent optimization designs.
(2)
The rotational speed of gears is one of the key factors influencing their lubrication performance. This study found that, as the gear speed increased beyond a critical threshold, the turbulence intensity tended to stabilize. The vorticity also stabilized at this point. This phenomenon can be attributed to the optimized baffle design. The design skillfully guides and constrains fluid flow, creating a relatively stable flow region within the baffle. As a result, the lubrication performance is effectively enhanced, ensuring the efficient and stable operation of the gear transmission system.
(3)
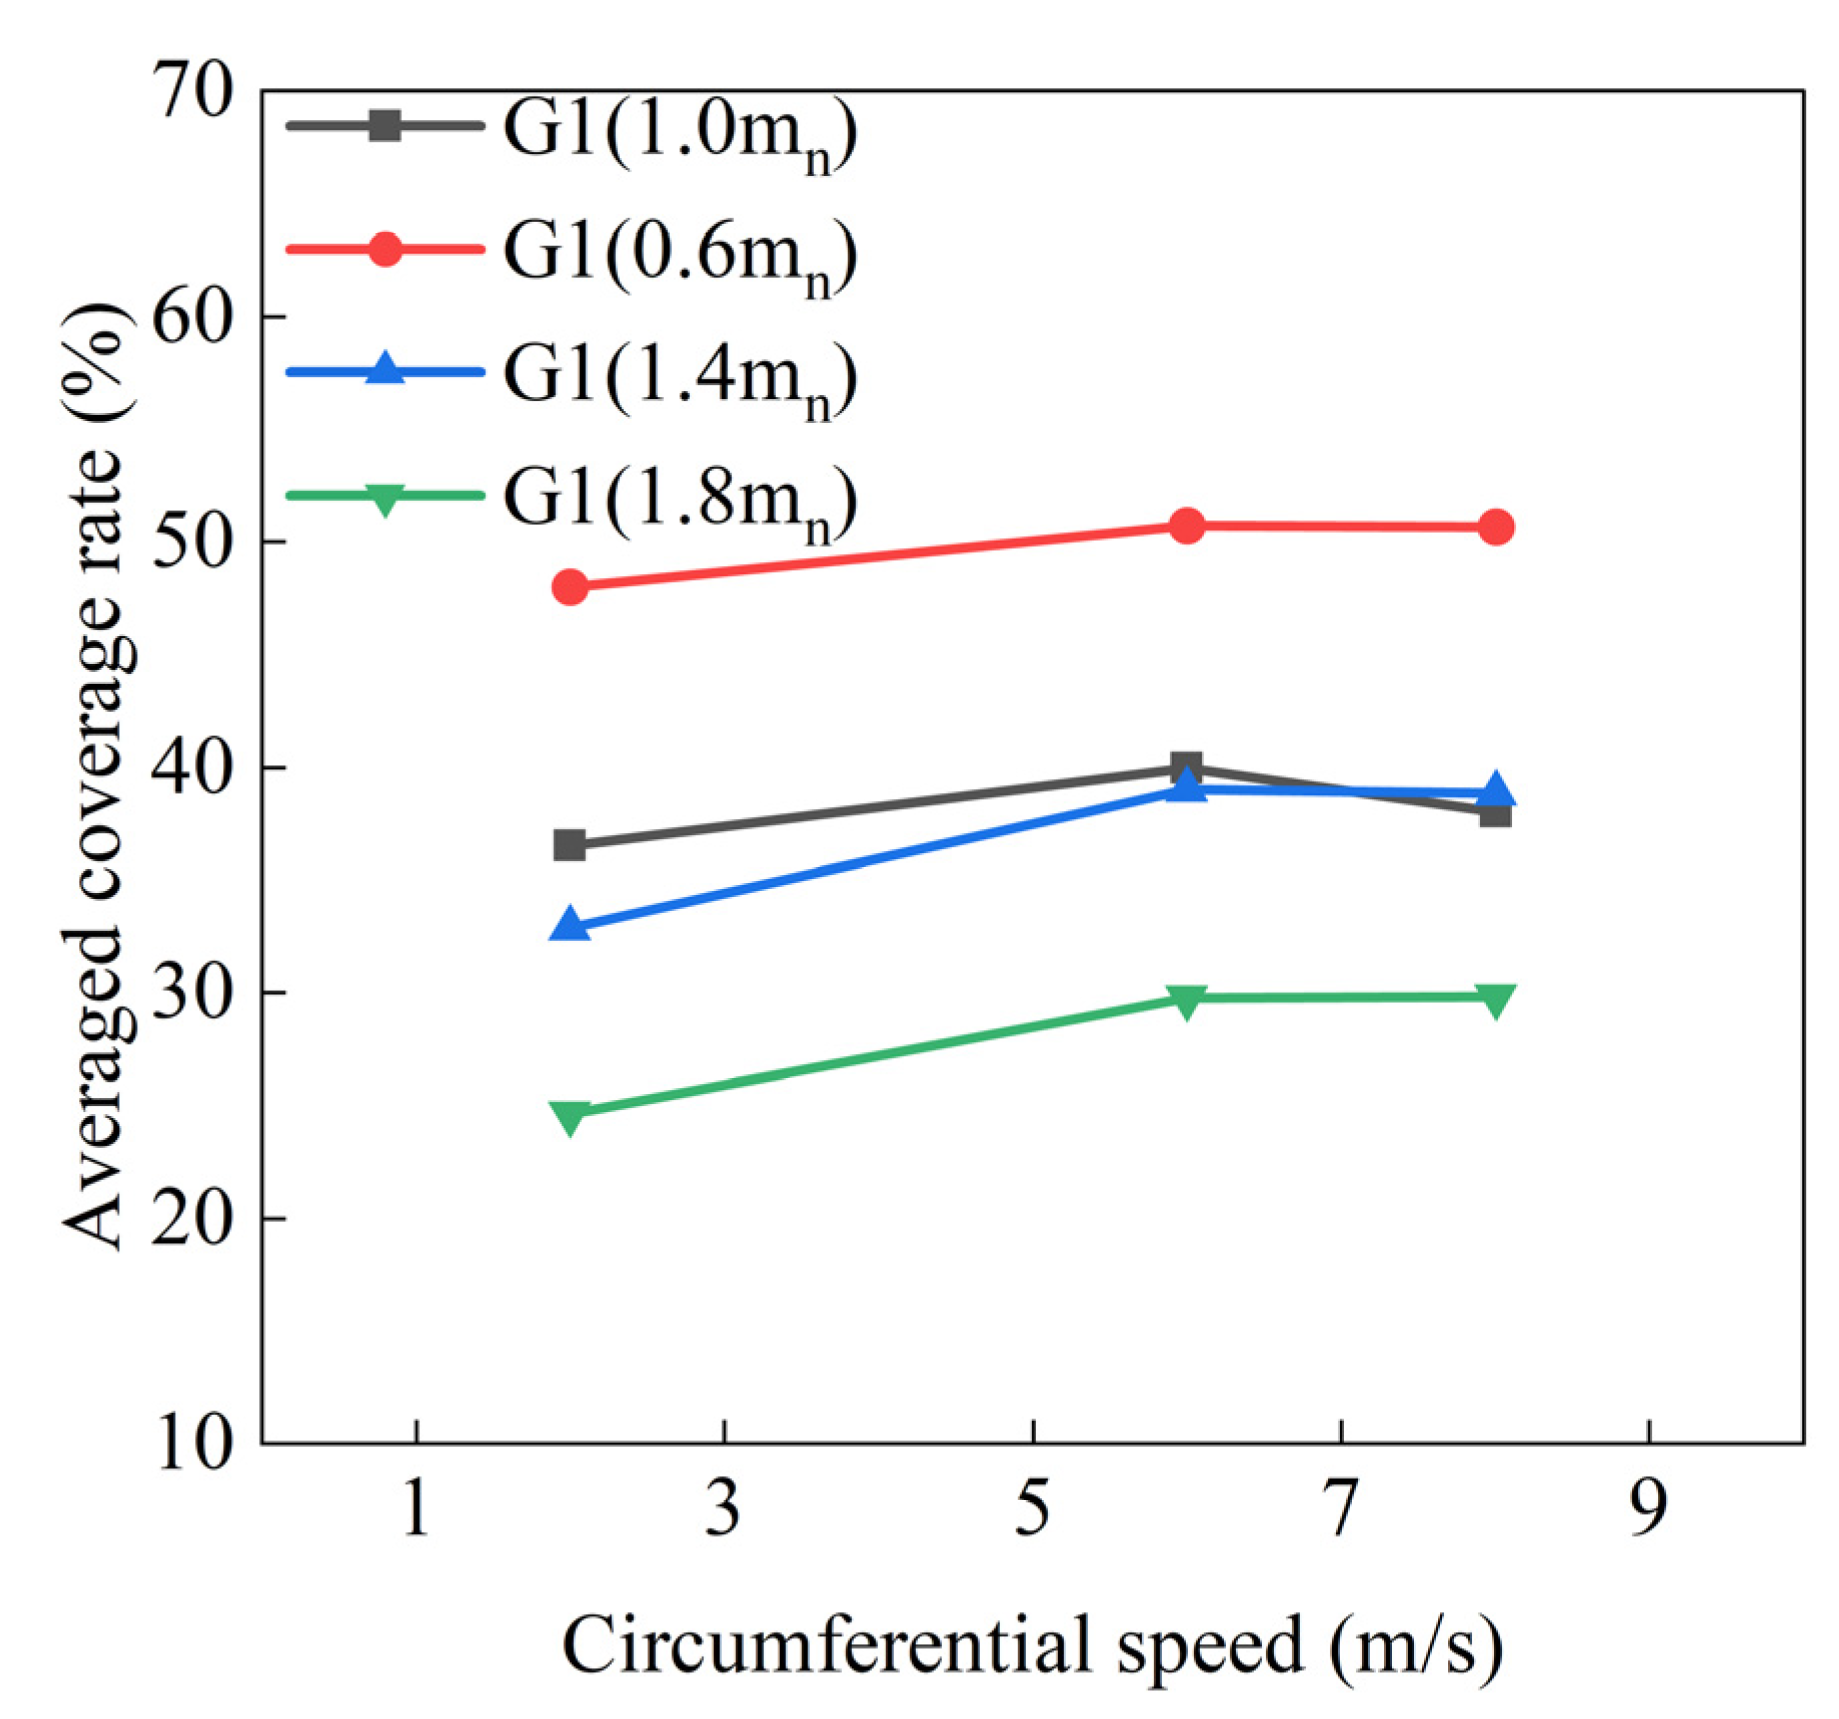
Enhancing the oil level is crucial for improving the lubrication performance of gears and bearings. The results indicate that when the radial speed of the gears reaches 8 m/s, a stable oil film can form on the gear surface. Moreover, an appropriate increase in the oil level helps to more evenly cover the gear surface with oil. This further enhances lubrication performance, reduces wear risks, and extends equipment lifespan.
(4)
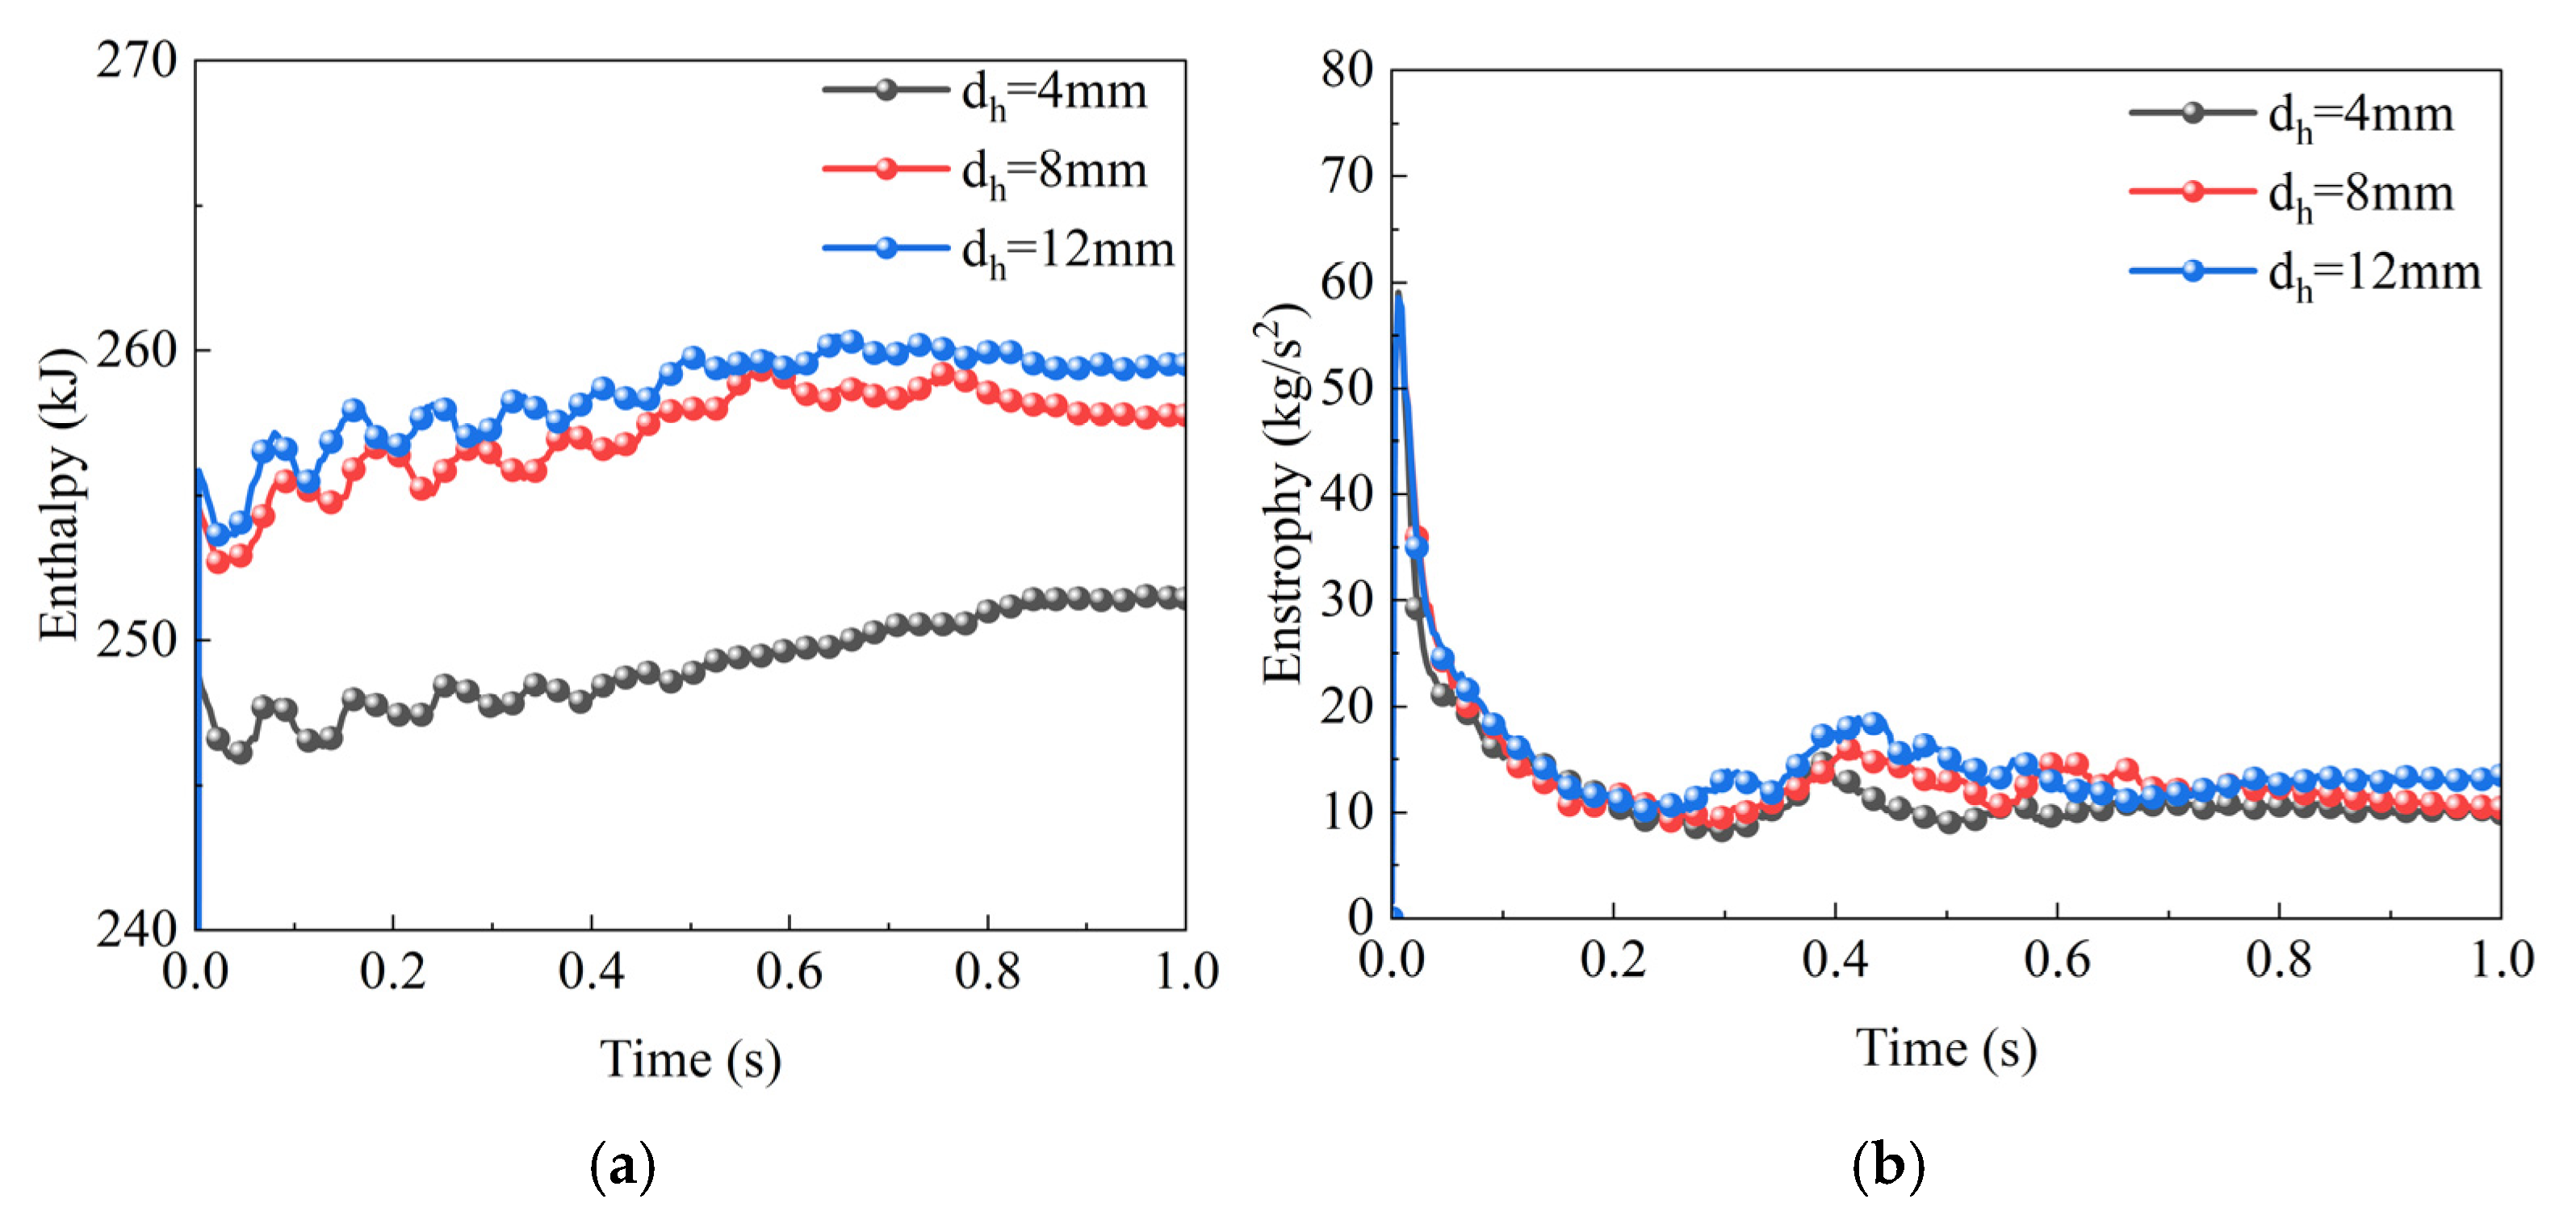
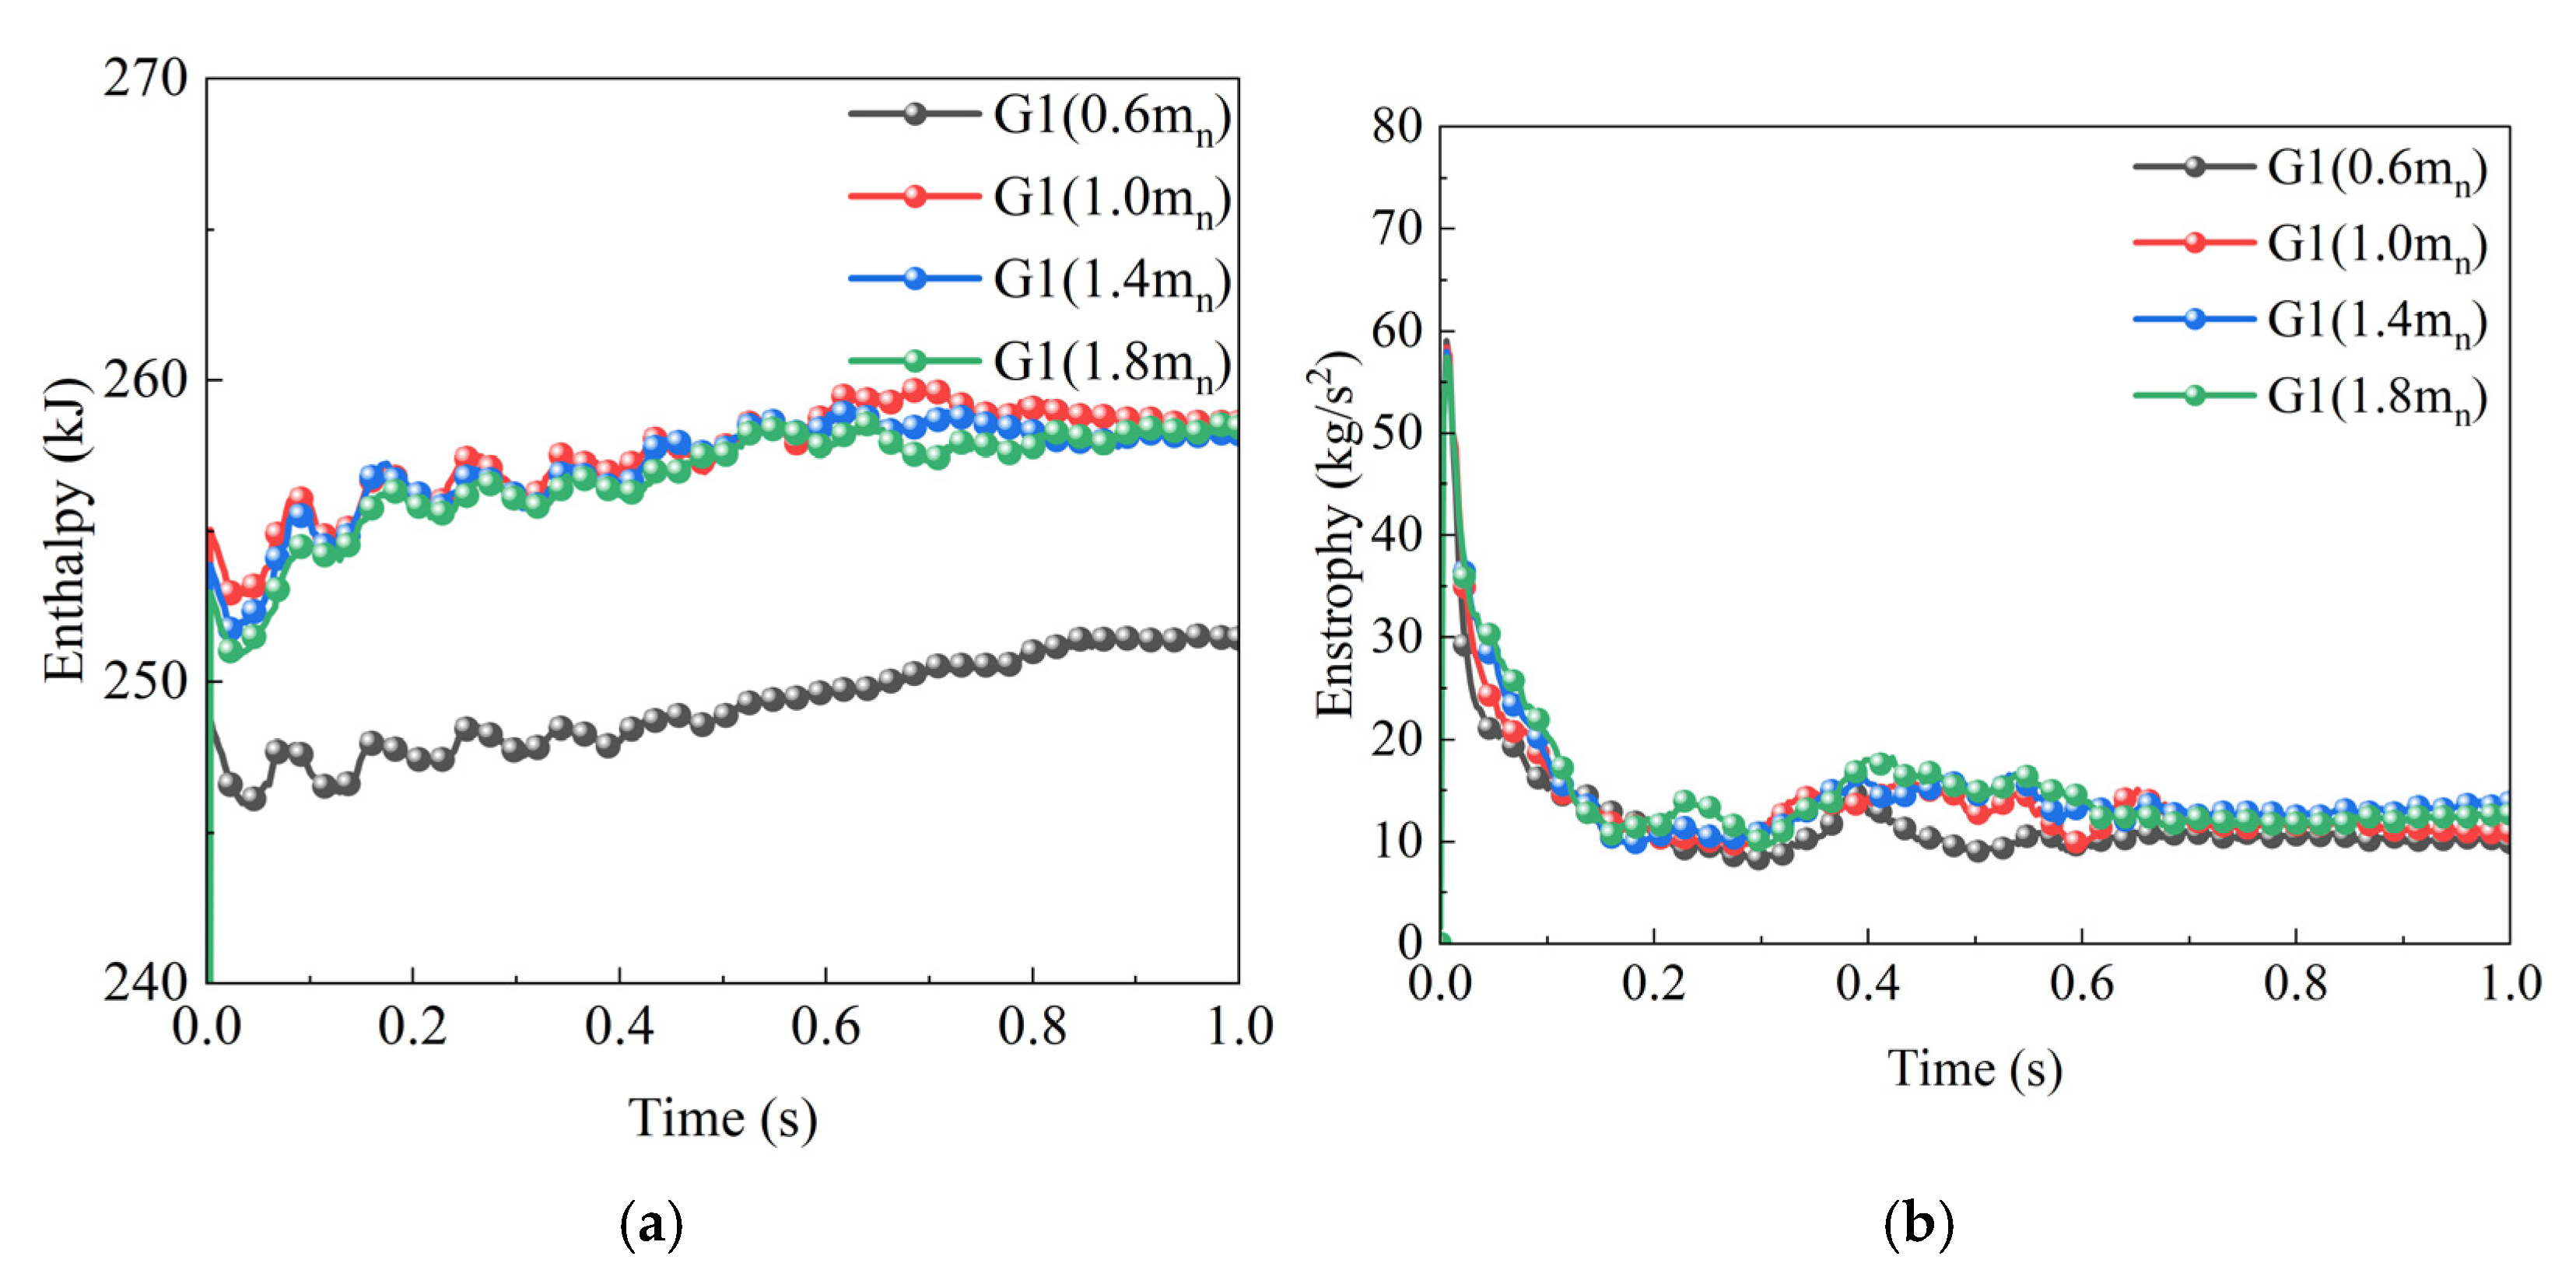
The axial gap and through-hole diameter of the baffle have a significant impact on fluid enthalpy, energy transfer, and thermodynamic performance. A larger axial gap and perforation diameter are beneficial for increasing fluid enthalpy. This, in turn, optimizes energy transfer and thermodynamic performance. However, when the gap becomes too large, the enhancement in performance gradually diminishes. There is an optimal value beyond which further increases in gap size are less effective. In terms of vorticity, smaller axial gaps and perforations increase fluid resistance, promoting energy dissipation. This leads to lower stable values of vorticity. By optimizing the baffle design, the flow and energy dissipation characteristics of the fluid within the gearbox can be controlled. This improves thermal management and lubrication performance, providing strong support for the efficient, stable, and long-term operation of the gear transmission system.

Author Contributions

Y.G.: writing—review and editing, writing—original draft, resources, project administration, methodology, investigation, data curation, and conceptualization. Y.G.: validation, supervision, resources, investigation, and funding acquisition. G.Z. and L.L.: software, methodology, and data curation. All authors have read and agreed to the published version of the manuscript.

Funding

This research received no external funding.

Data Availability Statement

Data will be made available on request.

Conflicts of Interest

The authors declare no conflicts of interest.

References

  1. Liu, Y.; Shao, S.; Zhang, K.; Yao, Y.; Wang, X. Investigation of characteristics of splash lubrication and churning power loss in gear-boxes with a guide plate. Tribol. Int. 2024, 198, 109875. [Google Scholar] [CrossRef]
  2. Shore, J.F.; Kolekar, A.S.; Ren, N.; Kadiric, A. An Investigation Into the Influence of Viscosity on Gear Churning Losses by Considering the Effective Immersion Depth. Tribol. Trans. 2023, 66, 906–919. [Google Scholar] [CrossRef]
  3. LePrince, G.; Changenet, C.; Ville, F.; Velex, P.; Dufau, C.; Jarnias, F. Influence of aerated lubricants on gear churning losses–an engineering model. Tribol. Trans. 2011, 54, 929–938. [Google Scholar] [CrossRef]
  4. Concli, F.; Gorla, C.; Della Torre AMontenegro, G. Experimental investigations to use splash lubrication for high-speed gears. J. Tribol. 2017, 139, 061104. [Google Scholar]
  5. Xu, W.X.; Xu, P.; Yang, Y.; Tan, D.P.; Li, L. The utilization and advancement of laser ultrasound testing in the assessment of aerospace composite characteristics: A review. Chin. J. Aeronaut. 2025; in press. [Google Scholar]
  6. Li, Q.H.; Xu, P.; Li, L.; Xu, W.X.; Tan, D.P. Investigation on the Lubrication Heat Transfer Mechanism of the Multilevel Gearbox by the Lattice Boltzmann Method. Processes 2024, 12, 381. [Google Scholar] [CrossRef]
  7. Wu, J.F.; Xu, P.; Li, L.; Li, Z.; Qi, H.; Wang, C.Y.; Zhang, Y.K.; Xie, Y.S.; Tan, D.P. Multiphase dynamic interfaces and abrasive transport dynamics for abrasive flow machining in shear thickening transition states. Powder Technol. 2024, 446, 120150. [Google Scholar] [CrossRef]
  8. Lin, H.; Ma, M.; Qi, H.; Wang, X.; Xing, Z.; Alowasheeir, A.; Tang, H.; Chan Jun, S.; Yamauchi, Y.; Liu, S. 3D-Printed photocatalysts for revo-lutionizing catalytic conversion of solar to chemical energy. Prog. Mater. Sci. 2025, 151, 101427. [Google Scholar] [CrossRef]
  9. Lin, H.; Shen, Q.; Ma, M.; Ji, R.; Guo, H.; Qi, H.; Xing, W.; Tang, H. 3D Printing of Porous Ceramics for Enhanced Thermal Insulation Properties. Adv. Sci. 2024, 12, 2412554. [Google Scholar]
  10. Terekhov, A.S. Hydraulic losses in gearboxes with oil immersion. Russ. Eng. J. 1975, 55, 7–11. [Google Scholar]
  11. Guo, X.M.; Yang, M.Y.; Li, F.Q.; Zhu, Z.C.; Cui, B.L. Investigation on Cryogenic Cavitation Characteristics of an Inducer Considering Thermodynamic Effects. Energies 2024, 17, 3627. [Google Scholar] [CrossRef]
  12. Li, L.; Xu, P.; Li, Q.H.; Yin, Z.C.; Zheng, R.Y.; Wu, J.F.; Bao, J.J.; Qi, H.; Tan, D.P. Multi-field coupling particle flow dynamic behaviors of the microreactor and ultrasonic control method. Powder Technol. 2025, 454, 120731. [Google Scholar] [CrossRef]
  13. Ge, J.Q.; Lin, Y.H.; Qi, H.; Li, Y.T.; Li, X.L.; Li, C.; Li, Z.A.; Xu, K.Q. The impact of ultrasonic-induced jet morphology on polishing efficiency. Int. J. Mech. Sci. 2024, 284, 109764. [Google Scholar] [CrossRef]
  14. Lin, Q.; Li, Q.H.; Xu, P.; Zheng, R.Y.; Bao, J.J.; Li, L.; Tan, D.P. Transport mechanism and optimization design of the LBM-LES coupling-based two-phase flow in static mixers. J. Mar. Sci. Eng. 2025; in press. [Google Scholar]
  15. Mastrone, M.N.; Hartono, E.A.; Chernoray, V.; Concli, F. Oil distribution and churning losses of gearboxes: Experimental and numerical analysis. Tribol. Int. 2020, 151, 106496. [Google Scholar] [CrossRef]
  16. Xu, P.; Li, Q.H.; Wang, C.Y.; Li, L.; Tan, D.P.; Wu, H.P. Interlayer healing mechanism of multipath deposition 3D printing models and interlayer strength regulation method. J. Manuf. Process. 2025; in press. [Google Scholar] [CrossRef]
  17. Changenet, C.; Philippe, V. A model for the prediction of churning losses in geared transmissions—Preliminary results. J. Mech. Des. 2007, 129, 128–133. [Google Scholar] [CrossRef]
  18. Tan, Y.F.; Ni, Y.S.; Wu, J.F.; Li, L.; Tan, D.P. Machinability evolution of gas–liquid-solid three-phase rotary abrasive flow finishing. Int. J. Adv. Manuf. Technol. 2023, 131, 2145–2164. [Google Scholar] [CrossRef]
  19. Wang, X.; Zhu, B.; Yao, M.Y. Analysis of the optimal lubricating oil amount for electric vehicle decelerators based on the moving particle semi-implicit method (MPS). Mech. Transm. 2020, 44, 112–120. [Google Scholar]
  20. Liu, H.; Jurkschat, T.; Lohner, T. Detailed investigations on the oil flow in dip-lubricated gearboxes by the finite volume CFD method. Lubricants 2018, 6, 47. [Google Scholar] [CrossRef]
  21. Dai, Y.; Ma, F.; Zhu, X. Development of an analytical model to estimate the churningpower losses of a spiral bevel gear. Tribol. Int. 2020, 151, 106536. [Google Scholar] [CrossRef]
  22. Hu, X.; Li, P.; Wu, M. Influence of the dynamic motion of a splash lubricated gearbox on churning power losses. Energies 2019, 12, 3225. [Google Scholar] [CrossRef]
  23. Hill, M.J.; Kunz, R.F.; Medvitz, R.B.; Handschuh, R.F.; Long, L.N.; Noack, R.W.; Morris, P.J. CFD Analysis of gear windage losses: Validation and parametric aerody-namic studies. J. Fluids Eng. 2011, v133, 33–45. [Google Scholar]
  24. Hildebrand, L.; Dangl, F.; Sedlmair, M.; Lohner, T.; Stahl, K. CFD analysis on the oil flow of a gear stage with guide plate. Forsch. Im Inge-Nieurwesen 2022, 86, 395–408. [Google Scholar]
  25. Boness, R.J. Churning losses of discs and gears running partially submerged in oil. In Proceedings of the ASME International Power Transmission and Gearing Conference, Chicago, IL, USA, 25–28 April 1989. [Google Scholar]
  26. Wang, T.; Tan, D.P.; Hou, Y.Q.; Wang, C.Y.; Cheng, J.W.; Song, W.L. Analytical and experimental investigation of vibration response for the cracked fluid-filled thin cylindrical shell under transport condition. Appl. Math. Model. 2025, 142, 115969. [Google Scholar] [CrossRef]
  27. Ji, R.Q.; Shen, Q.T.; Zhang, L.; Zeng, X.; Qi, H. Novel photocatalysis-assisted mechanical polishing of laser cladding cobalt-based alloy using TiO2 nanoparticles. Powder Technol. 2024, 444, 119990. [Google Scholar]
  28. Shao, S.; Zhang, K.; Yao, Y.; Liu, Y.; Yang, J.; Xin, Z.; He, K. A Study on the Lubrication Characteristics and Parameter Influence of a High-Speed Train Herringbone Gearbox. Lubricants 2024, 12, 270. [Google Scholar] [CrossRef]
  29. Li, L.; Xu, P.; Li, Q.H.; Zheng, R.Y.; Xu, X.M.; Wu, J.F.; He, B.Y.; Bao, J.J.; Tan, D.P. A coupled LBM-LES-DEM particle flow modeling for microfluidic chip and ultrasonic-based particle aggregation control method. Appl. Math. Model. 2025, 143, 116025. [Google Scholar]
  30. Reinecke, S.R.; Blahout, S.; Zhang, Z.; Rosemann, T.; Hussong, J.; Kruggel-Emden, H. Effects of particle size, particle density, and Reynolds number on equilibrium streaks forming in a square wave serpentine microchannel: A DEM-LBM simulation study including experimental validation of the numerical framework. Powder Technol. 2023, 427, 118688. [Google Scholar] [CrossRef]
  31. Li, C.; Zhao, Y.; Ai, D.; Wang, Q.; Peng, Z.; Li, Y. Multi-component LBM-LES model of the air and methane flow in tunnels and its validation. Phys. A Stat. Mech. Its Appl. 2020, 555, 124279. [Google Scholar]
  32. Qin, J.; Kolahdouz, E.M.; Griffith, B.E. An immersed interface-lattice Boltzmann method for fluid-structure interaction. J. Comput. Phys. 2021, 428, 109807. [Google Scholar]
  33. Liu, J.; Huang, C.; Chai, Z.; Shi, B. A diffuse-interface lattice Boltzmann method for fluid-particle interaction problems. Comput. Fluids 2022, 233, 105240. [Google Scholar]
  34. Xing, J.T. Theoretical investigations on lattice Boltzmann method: An amended MBD and improved LBM. Acta Mech. Sin. 2021, 37, 1659–1682. [Google Scholar]
  35. Han, M.; Kikumoto, H.; Ooka, R. Numerical investigation of lattice Boltzmann method-based large-eddy simulation in non-isothermal enclosed cavity airflow. Int. Commun. Heat Mass Transf. 2024, 157, 107698. [Google Scholar]
  36. Cui, X.; Wang, Z.; Yao, X.; Liu, M.; Yu, M. A coupled two-relaxation-time lattice Boltzmann-volume penalization method for flows past obstacles. Math. Comput. Simul. 2022, 198, 85–105. [Google Scholar]
  37. Guo, Z.; Zheng, C. Analysis of lattice Boltzmann equation for microscale gas flows: Relaxation times, boundary conditions and the Knudsen layer. Int. J. Comput. Fluid Dynam. 2008, 22, 465–473. [Google Scholar]
  38. Smagorinsky, J. General circulation experiments with the primitive equations: I. The basic experiment. Mon. Weather. Rev. 1963, 91, 99–164. [Google Scholar]
  39. Chen, H.; Liu, W.; Li, S. A fully-resolved LBM-LES-DEM numerical scheme for adhesive and cohesive particle-laden turbulent flows in three dimensions. Powder Technol. 2024, 440, 119800. [Google Scholar]
  40. Aniello, A.; Schuster, D.; Werner, P.; Boussuge, J.F.; Gatti, M.; Mirat, C.; Rude, U. Comparison of a finite volume and two Lattice Boltzmann solvers for swirled confined flows. Comput. Fluids 2022, 241, 105463. [Google Scholar]
  41. Li, Q.; Tang, R.; Wang, S.; Zou, Z. A coupled LES-LBM-IMB-DEM modeling for evaluating pressure drop of a heterogeneous alternating-layer packed bed. Chem. Eng. J. 2022, 433, 133529. [Google Scholar]
  42. Chen, H.; Liu, W.; Chen, Z.; Zheng, Z. A numerical study on the sedimentation of adhesive particles in viscous fluids using LBM-LES-DEM. Powder Technol. 2021, 391, 467–478. [Google Scholar]
  43. Uddin, M.H.; Coronella, C.J. Effects of grid size on predictions of bed expansion in bubbling fluidized beds of Geldart B particles: A generalized rule for a grid-independent solution of TFM simulations. Particuology 2017, 34, 61–69. [Google Scholar]
  44. Li, L.; Xu, P.; Xu, W.X.; Lu, B.; Wang, C.Y.; Tan, D.P. Multi-field coupling vibration patterns of the multiphase sink vortex and distortion recognition method. Mech. Syst. Signal Process. 2024, 219, 111624. [Google Scholar]
  45. De Luca, F.; Mancini, S.; Miranda, S.; Pensa, C. An extended verification and validation study of CFD simulations for planing hulls. J. Ship Res. 2016, 60, 101–118. [Google Scholar]
Figure 1. LBM–LES coupling calculation flowchart.
Lubricants 13 00143 g001
Figure 2. Geometric model of high-speed gearbox.
Lubricants 13 00143 g002
Figure 3. Lattice independence verification.
Lubricants 13 00143 g003
Figure 4. The volume fraction evolution of the lubrication oil within the gearbox: (a) 0.001 s, (b) 0.01 s, (c) 0.15 s, (d) 0.02 s, (e) 0.03 s, (f) 0.05 s, (g) 0.1 s, (h) 0.15 s, (i) 0.75 s.
Lubricants 13 00143 g004
Figure 5. The velocity evolution of the oil within the gearbox: (a) 0.001 s, (b) 0.01 s, (c) 0.15 s, (d) 0.02 s, (e) 0.03 s, (f) 0.05 s, (g) 0.1 s, (h) 0.15 s, (i) 0.75 s.
Lubricants 13 00143 g005
Figure 6. The turbulent kinetic energy evolution of the lubrication oil within the gearbox: (a) 0.001 s, (b) 0.01 s, (c) 0.15 s, (d) 0.02 s, (e) 0.03 s, (f) 0.05 s, (g) 0.1. s, (h) 0.15 s, (i) 0.75 s.
Lubricants 13 00143 g006
Figure 7. The turbulent kinetic energy within the gearbox varies with tangential velocity: (a) 2 m/s, (b) 6 m/s, (c) 8 m/s.
Lubricants 13 00143 g007
Figure 8. The vorticity intensity of gear lubrication varies with tangential velocity: (a) 2 m/s, (b) 6 m/s, (c) 8 m/s.
Lubricants 13 00143 g008
Figure 9. The variation in the average lubrication oil coverage with rotational speed at different oil immersion depths.
Lubricants 13 00143 g009
Figure 10. The variation trend of the average coverage rate under varying axial gaps.
Lubricants 13 00143 g010
Figure 11. Variation trends of fluid characteristics with different baffle through-hole diameters. (a) Fluid enthalpy. (b) Fluid vorticity pseudo-energy.
Lubricants 13 00143 g011
Figure 12. Trends in fluid characteristics at different axial gaps: (a) Fluid enthalpy. (b) Fluid vortical energy.
Lubricants 13 00143 g012
Table 1. Simulation parameters of gearbox.
ParametersValue
Lubricating oil density (kg/m3)880
Lubricating oil dynamic viscosity (Pa·s)0.06
Lubricating oil height (mm)10, 20, 30
Air density (kg/m3)1.225
Air dynamic viscosity (Pa·s)1.7894 × 10⁻⁵
Small gear rotation speed (r·min−1)1200, 3600, 4800
Time step ∆t (s)2 × 10⁻⁵
Disclaimer/Publisher’s Note: The statements, opinions and data contained in all publications are solely those of the individual author(s) and contributor(s) and not of MDPI and/or the editor(s). MDPI and/or the editor(s) disclaim responsibility for any injury to people or property resulting from any ideas, methods, instructions or products referred to in the content.

