Detection of Elemental Composition of Lubricating Grease Using Laser Induced Breakdown Spectroscopy

Abstract
:1. Introduction
2. Theoretical Section
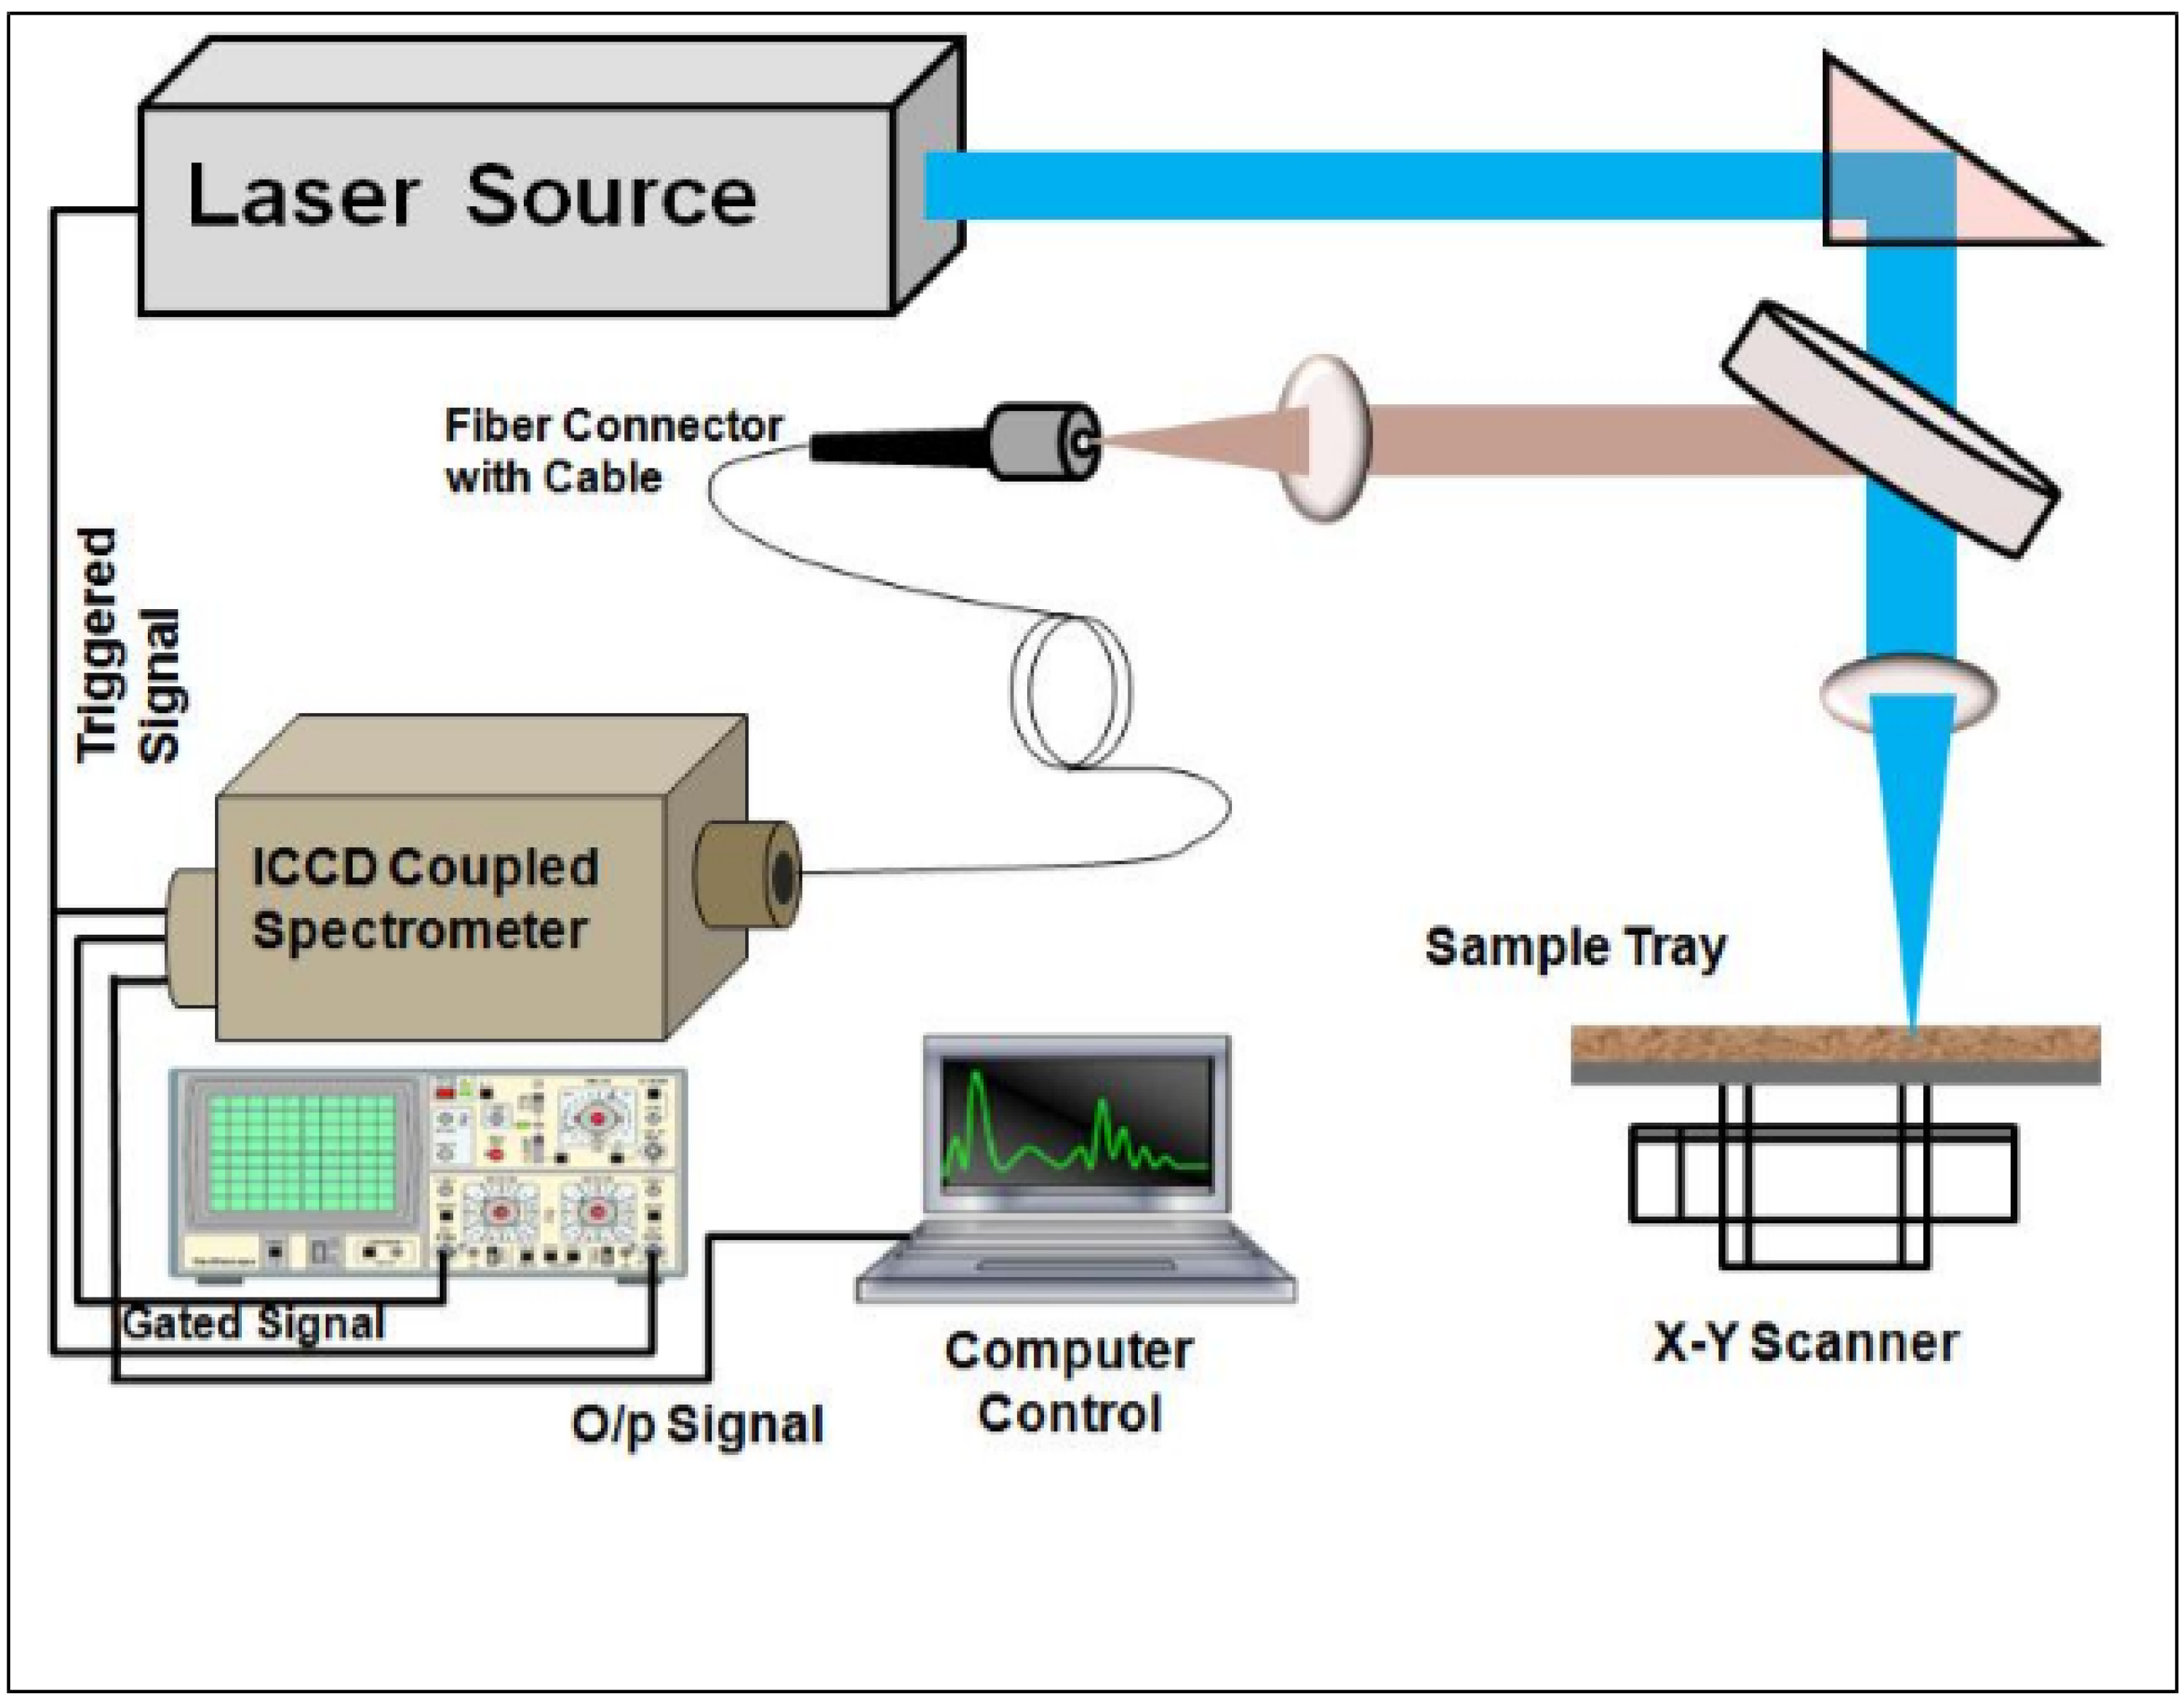
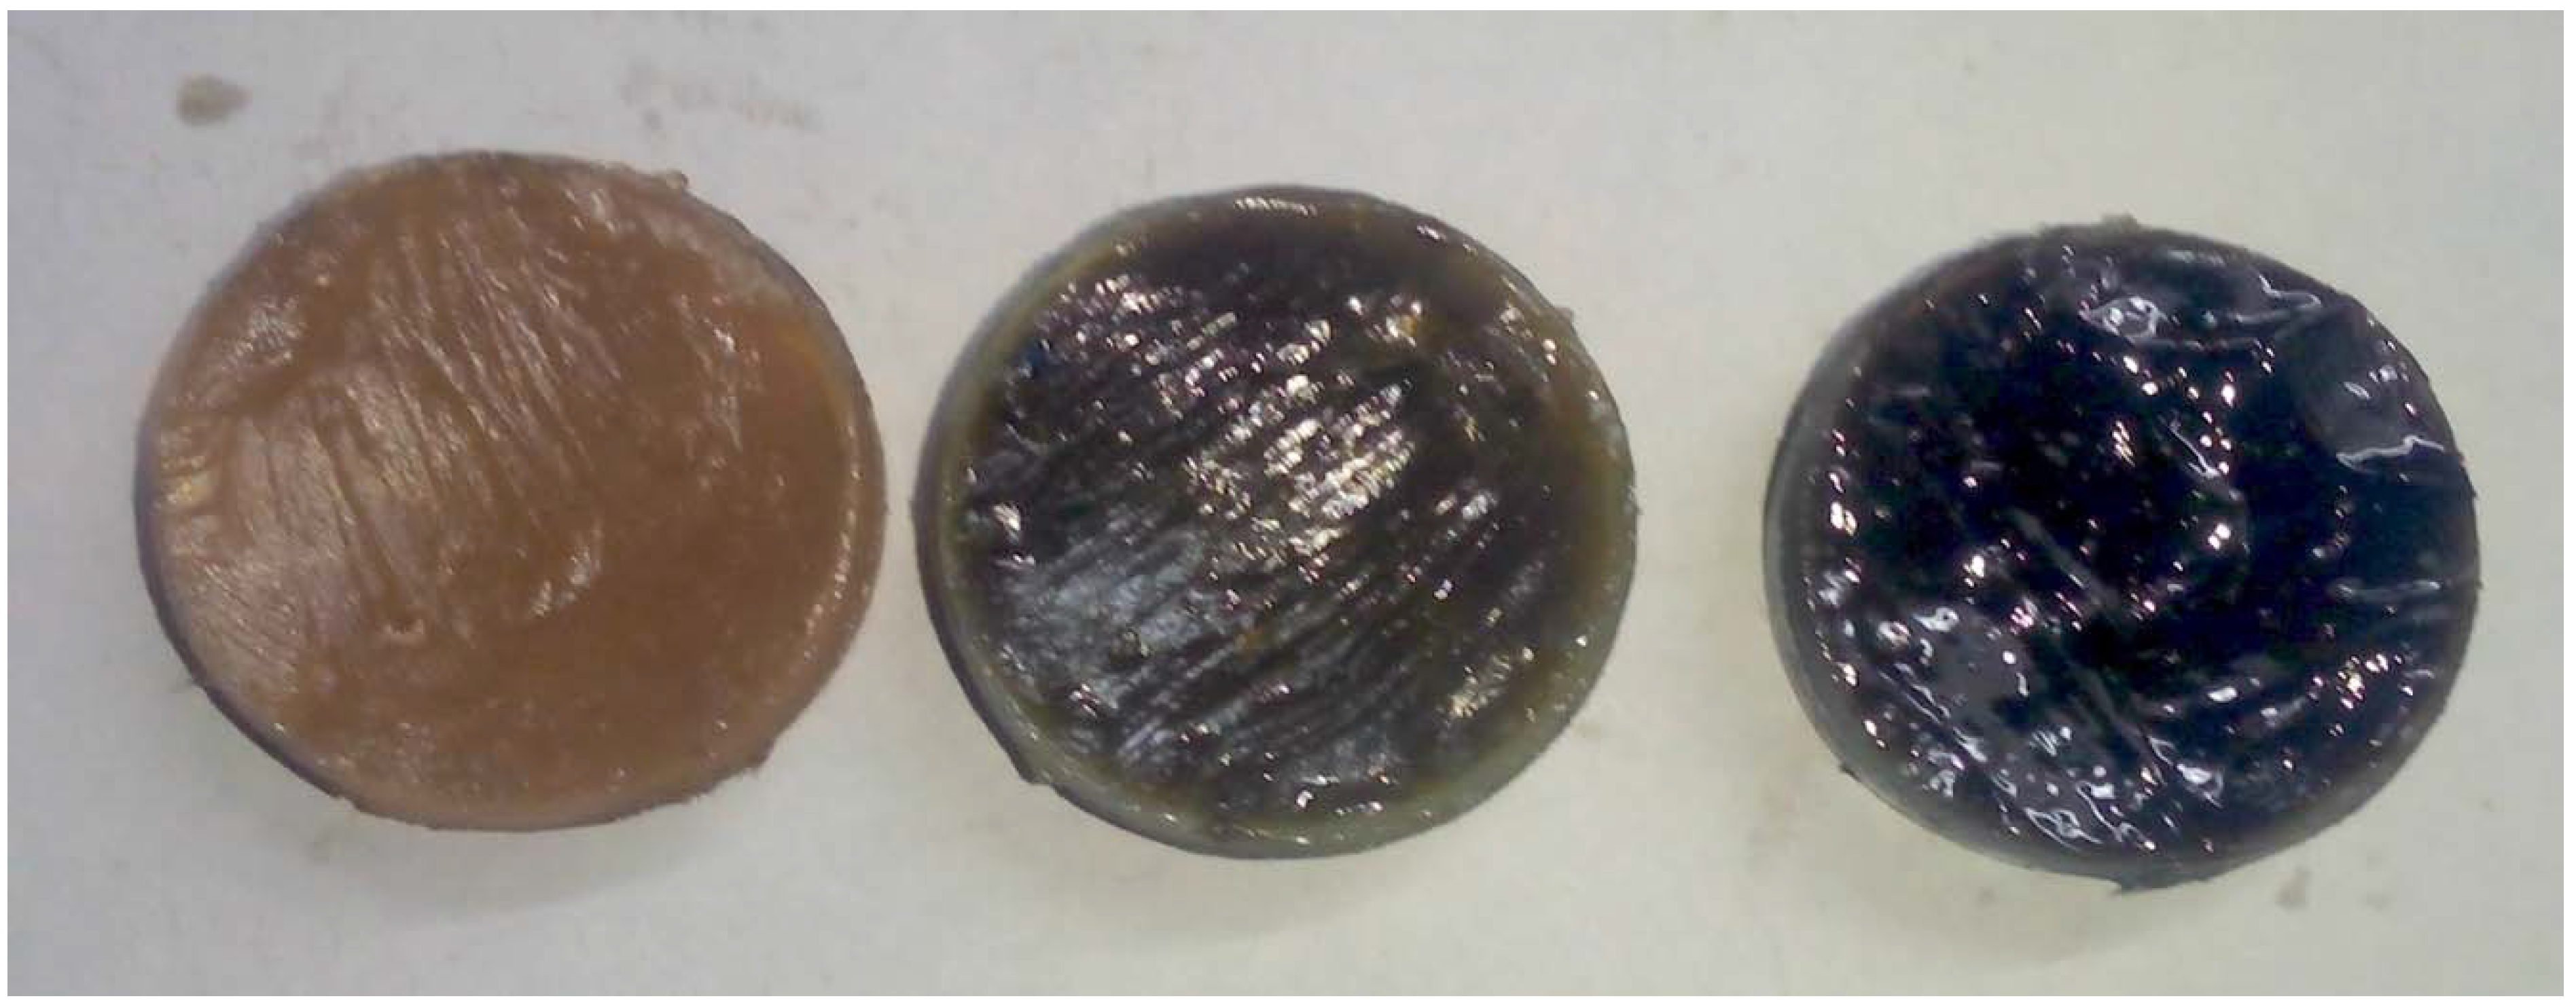
3. Experimental Details
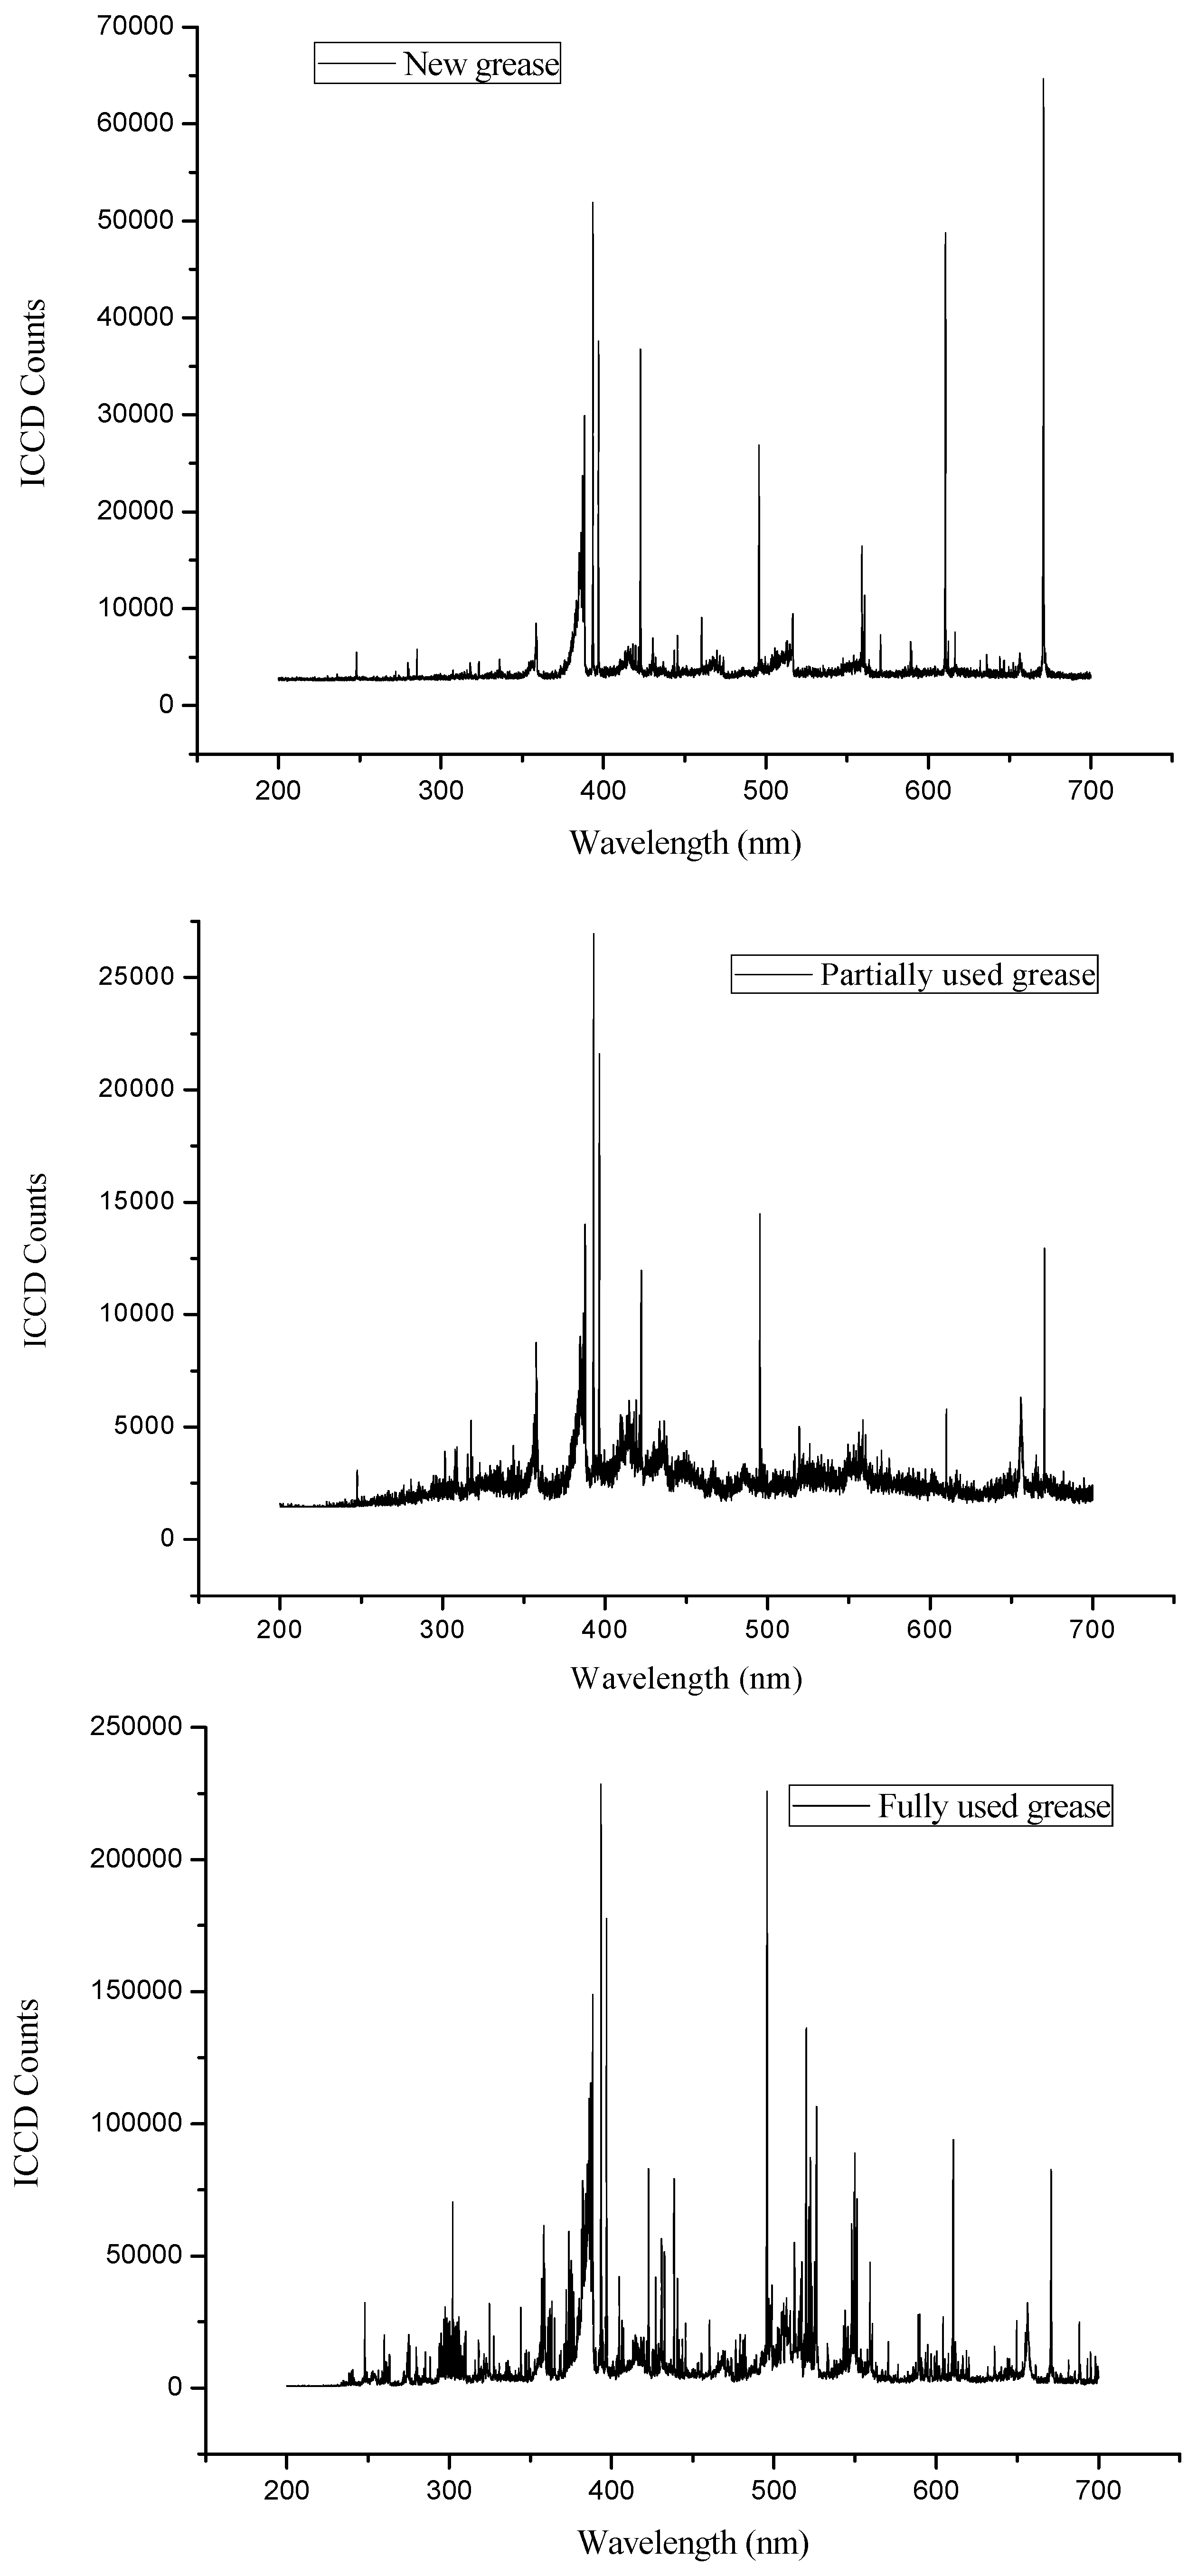
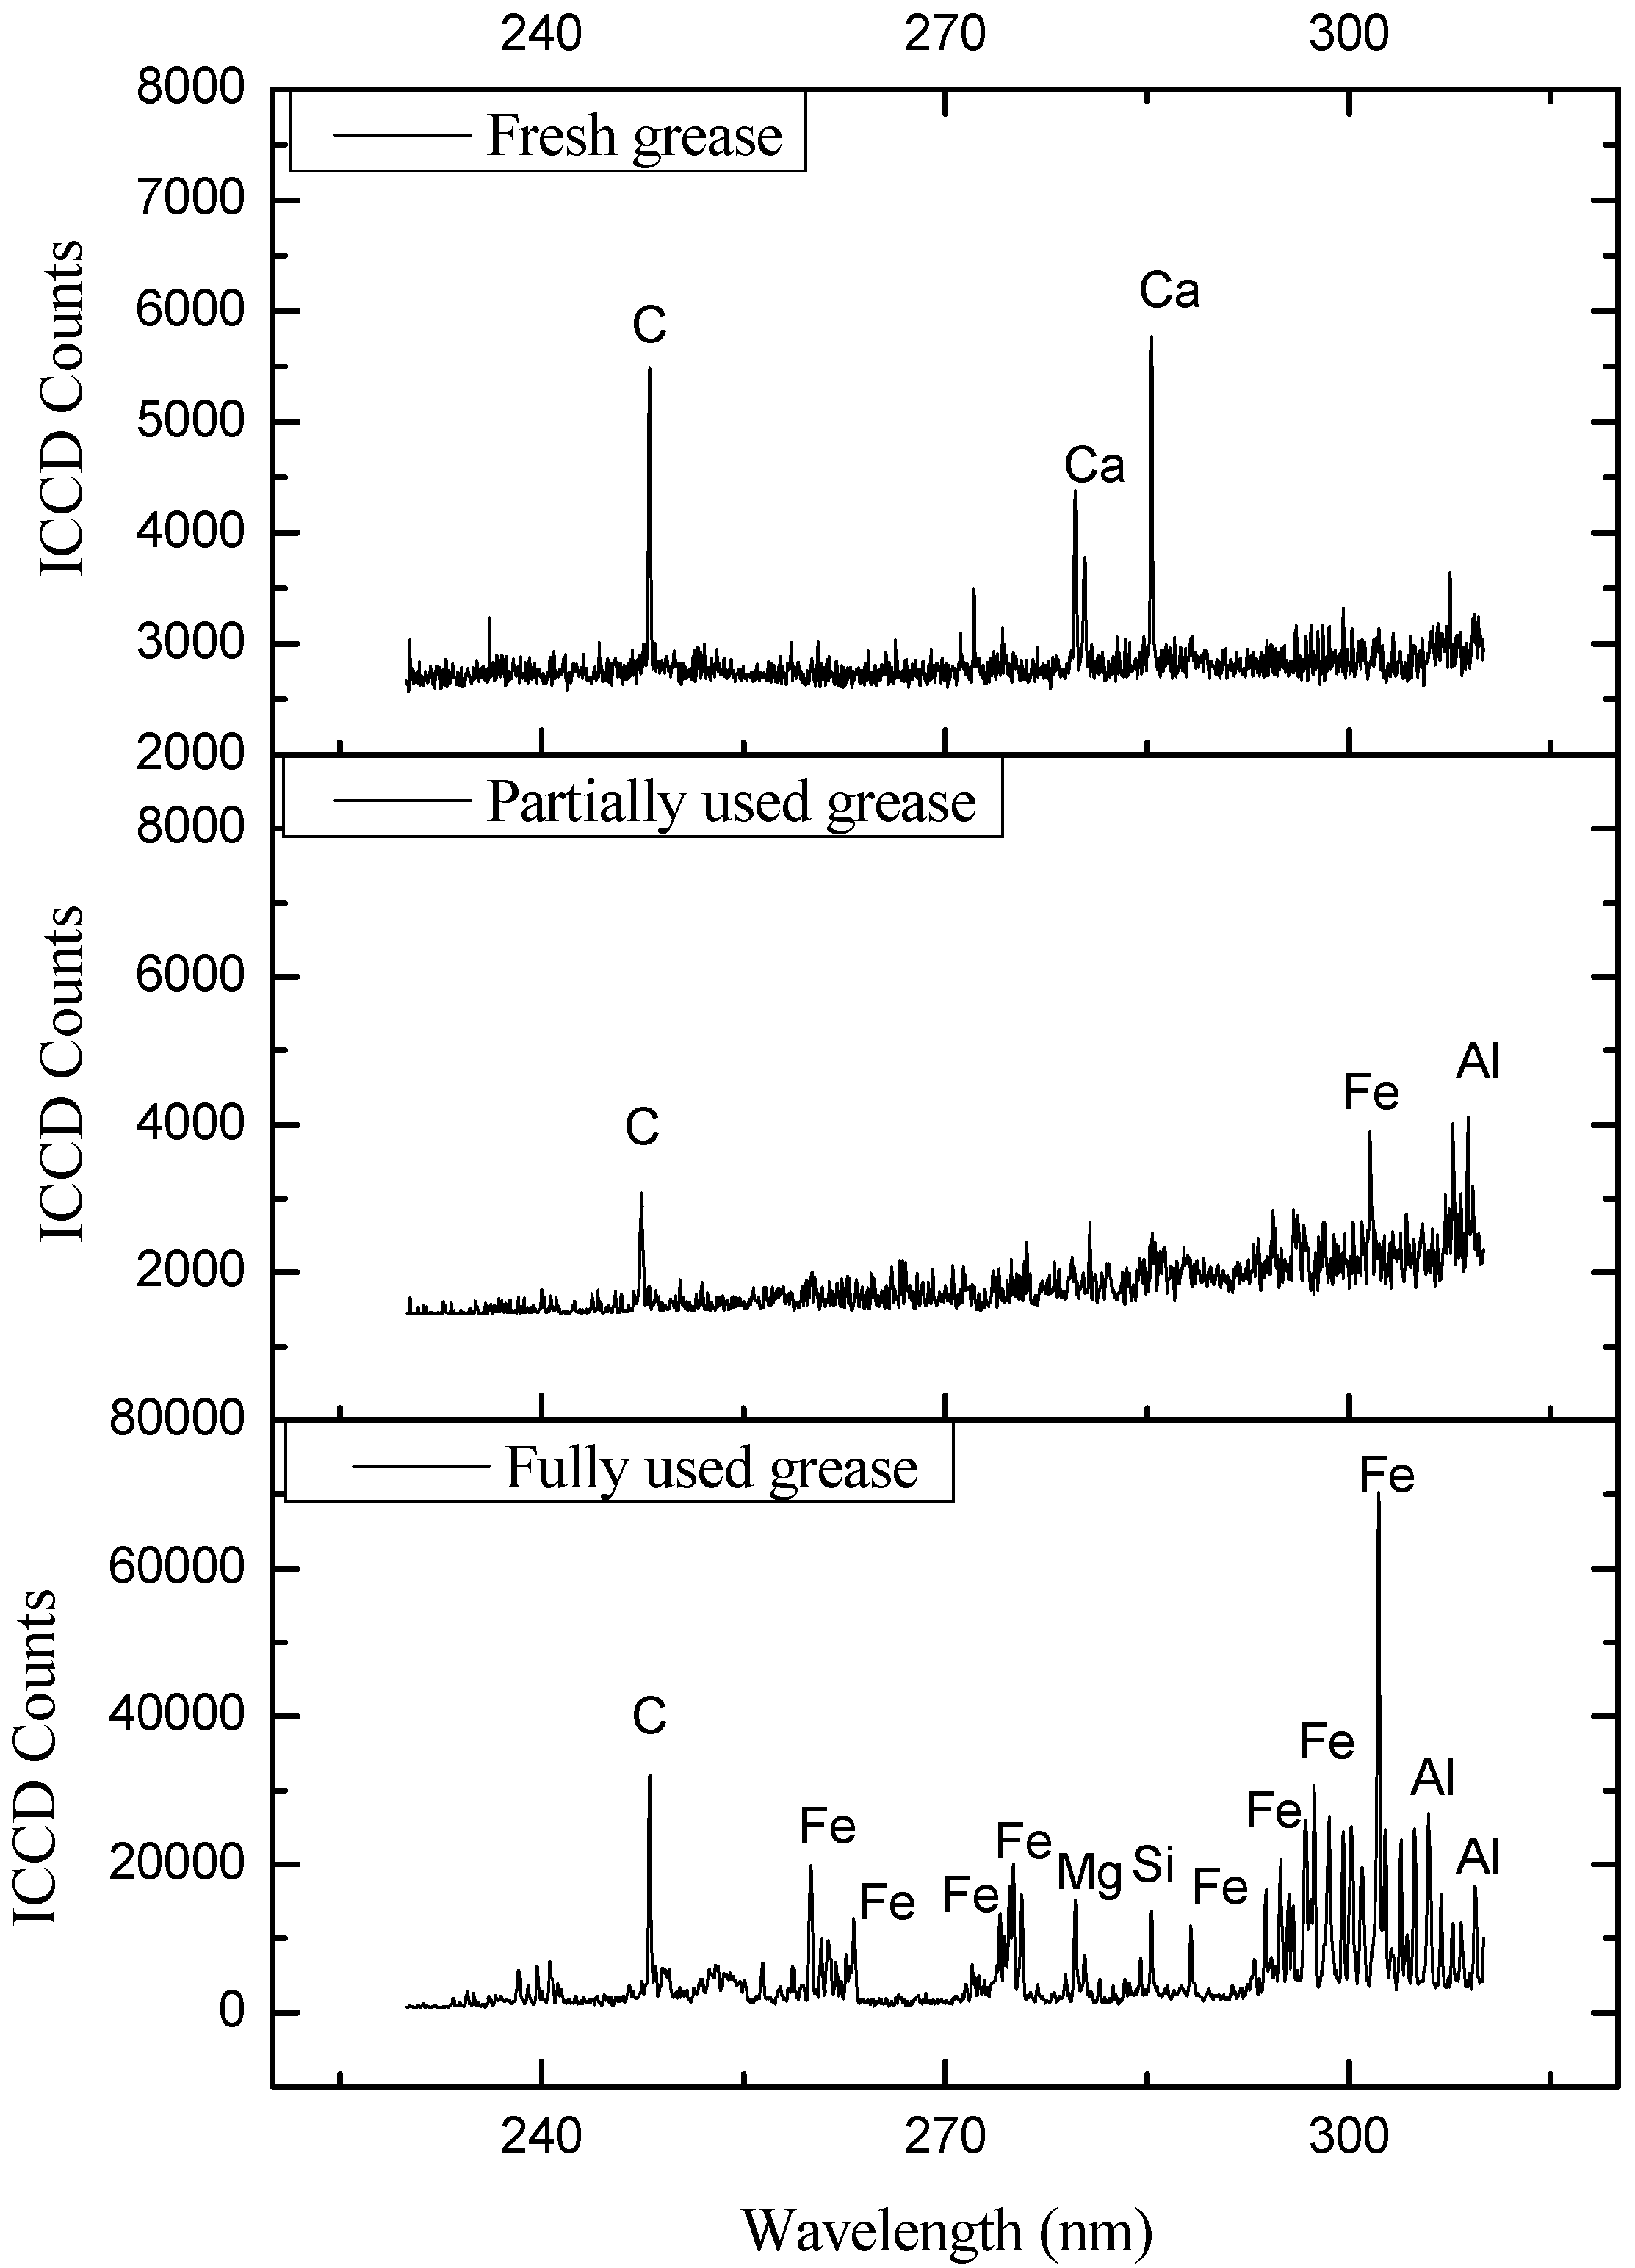
4. Results and Discussions


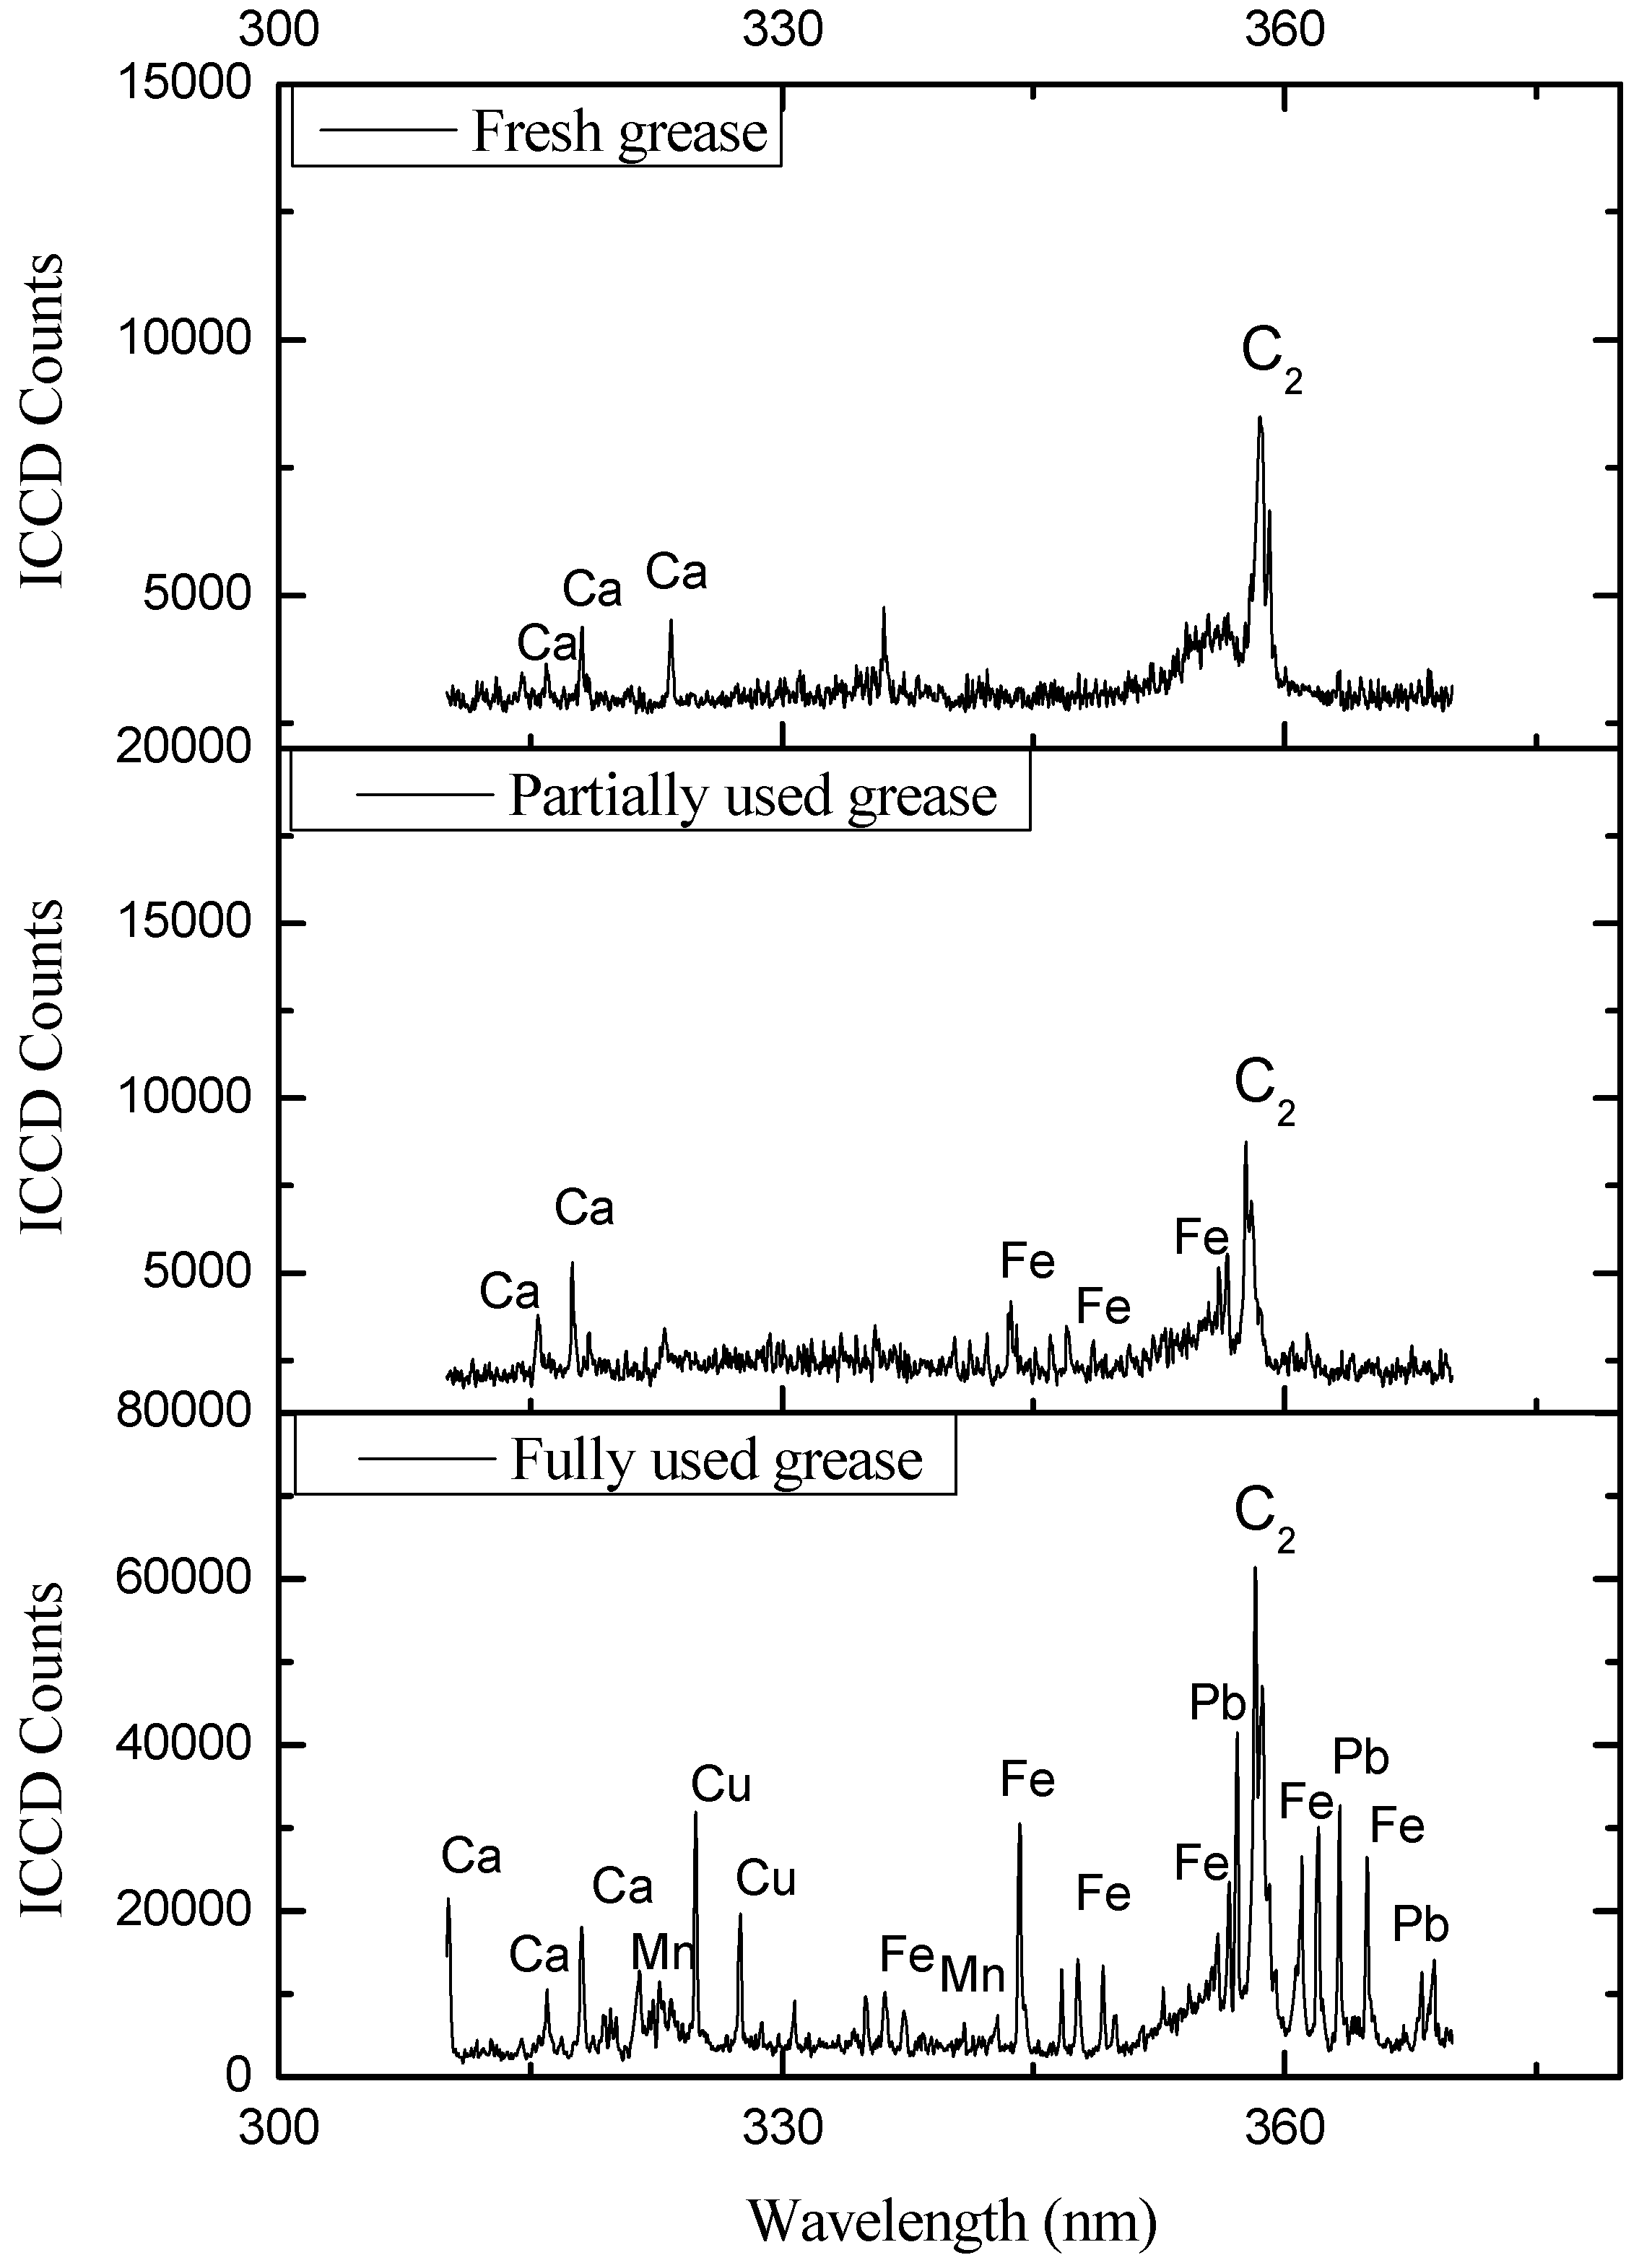
| Elements | Major Identifying Wavelengths Observed at (nm) |
|---|---|
| C | 247.89 |
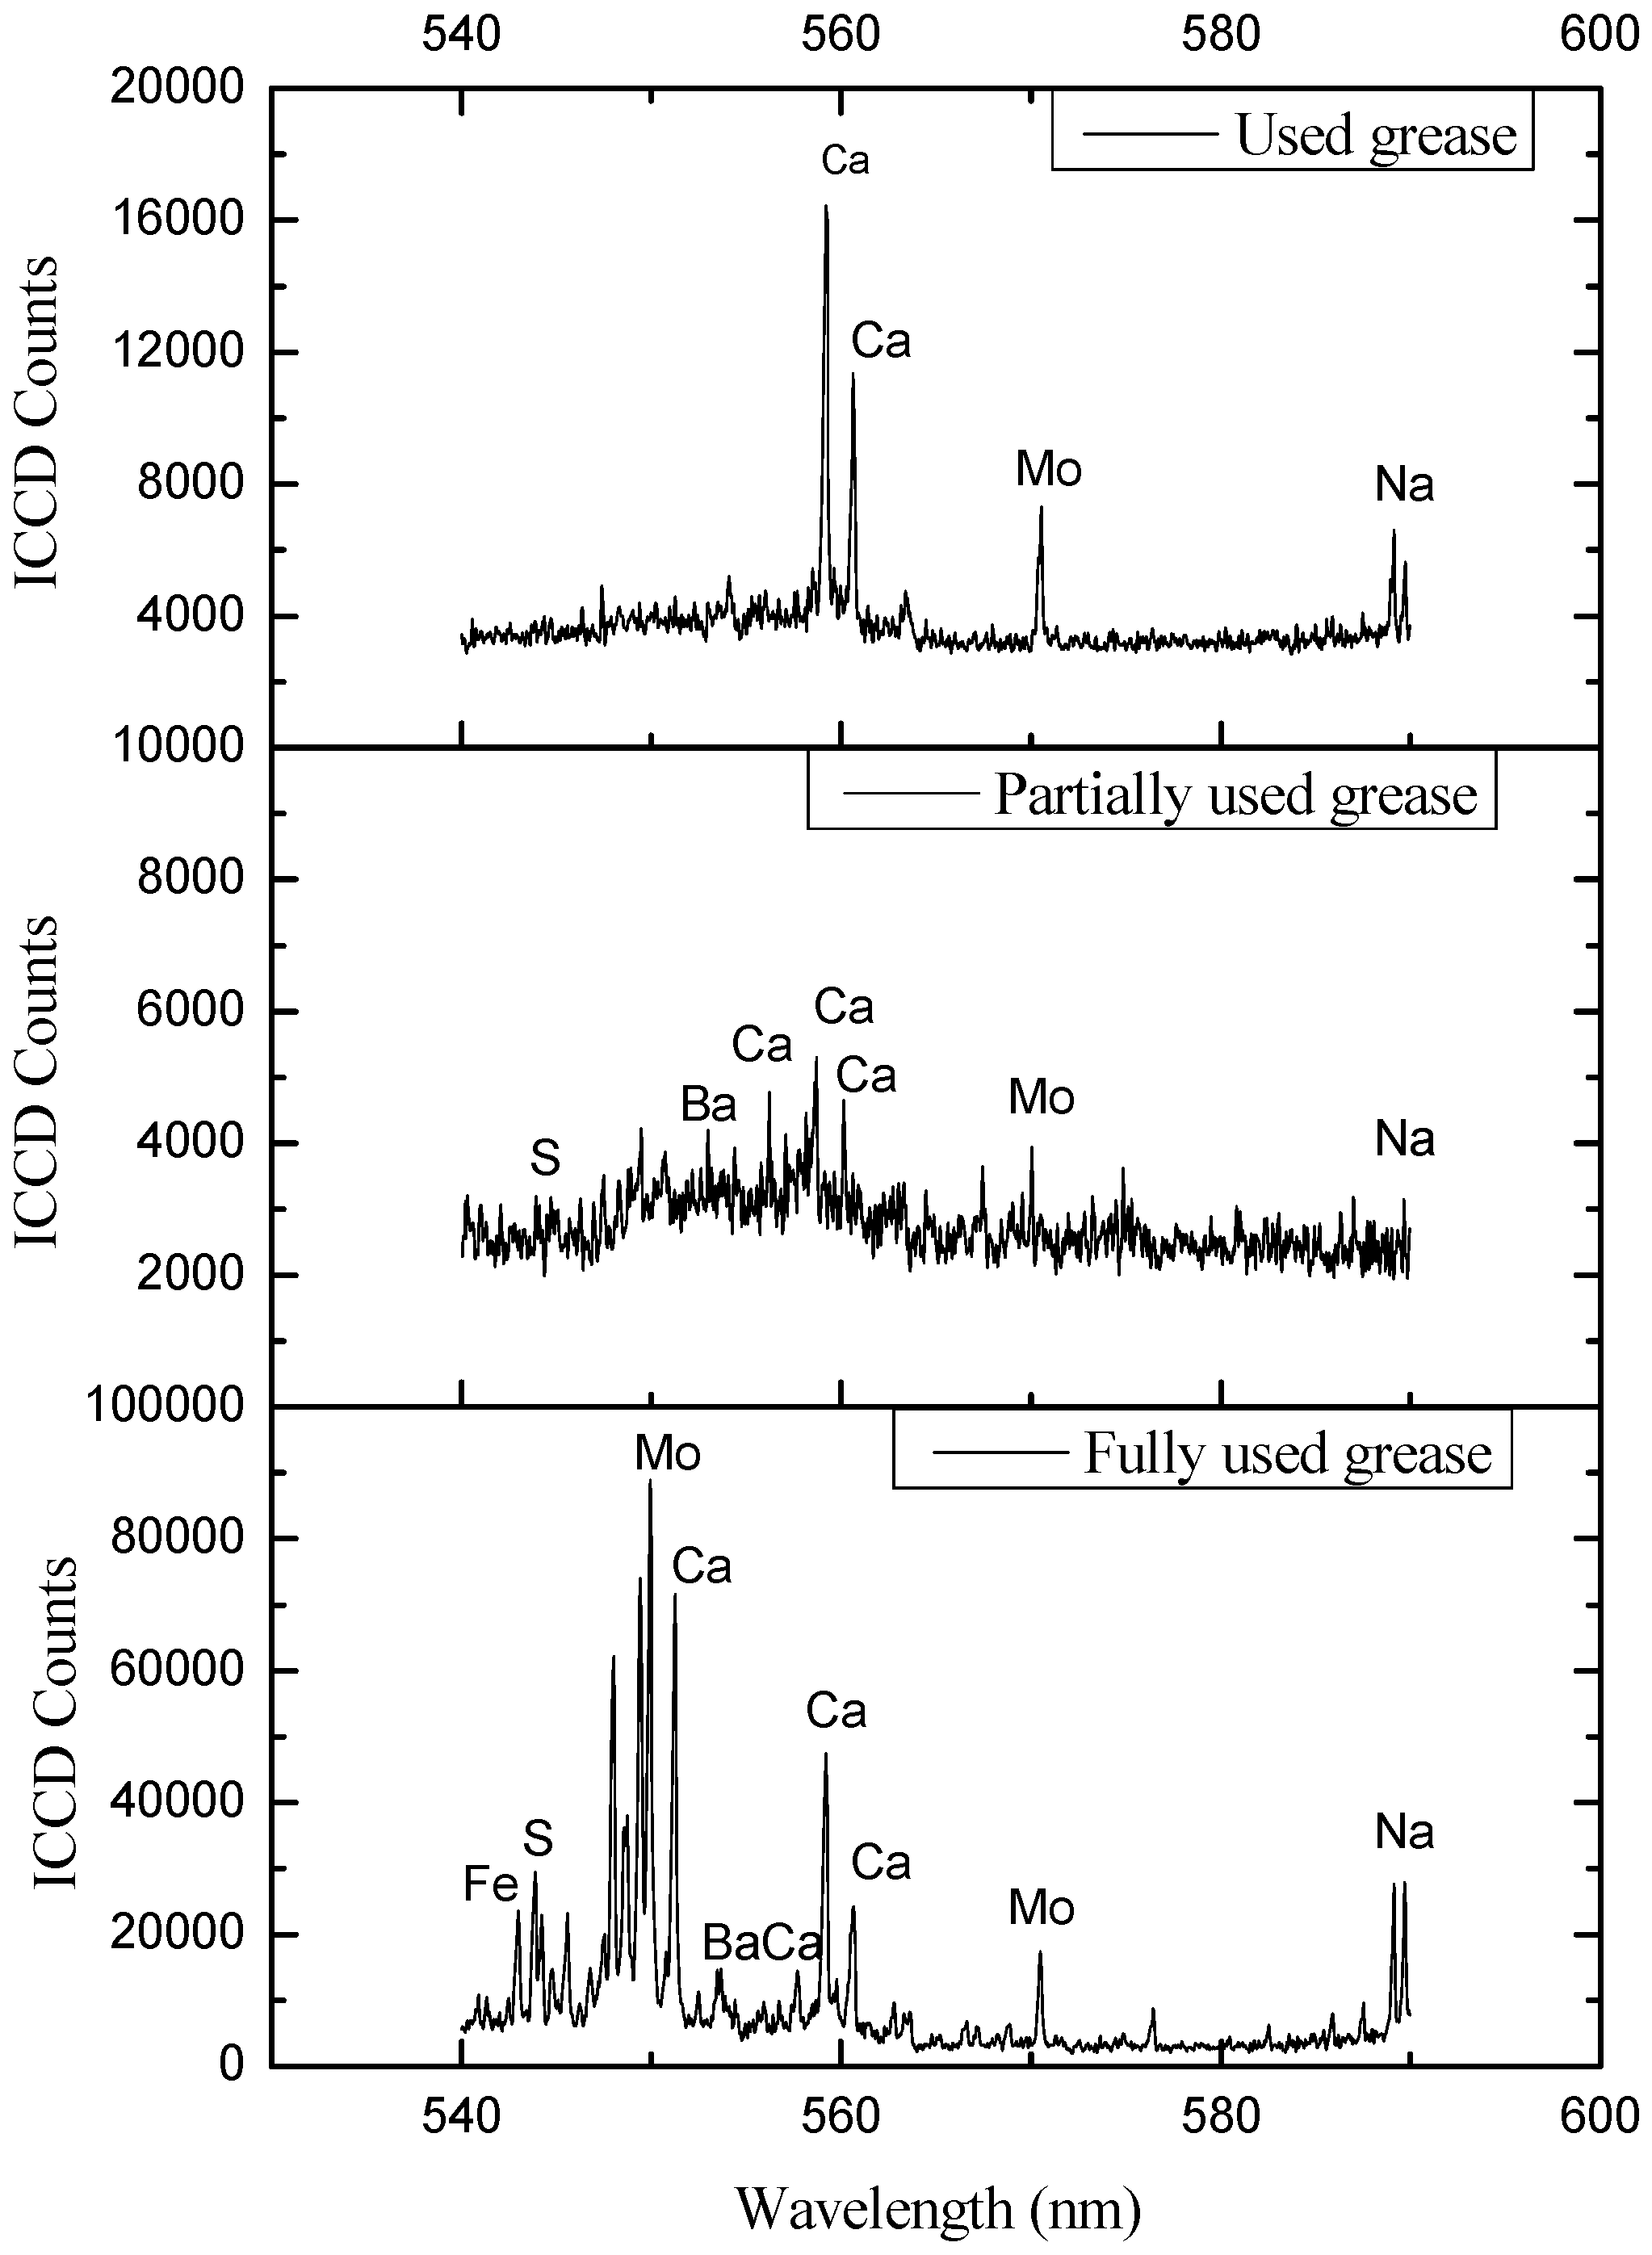
| Na | 279.6, 589.11, 589.734 |
| Al | 336.104 |
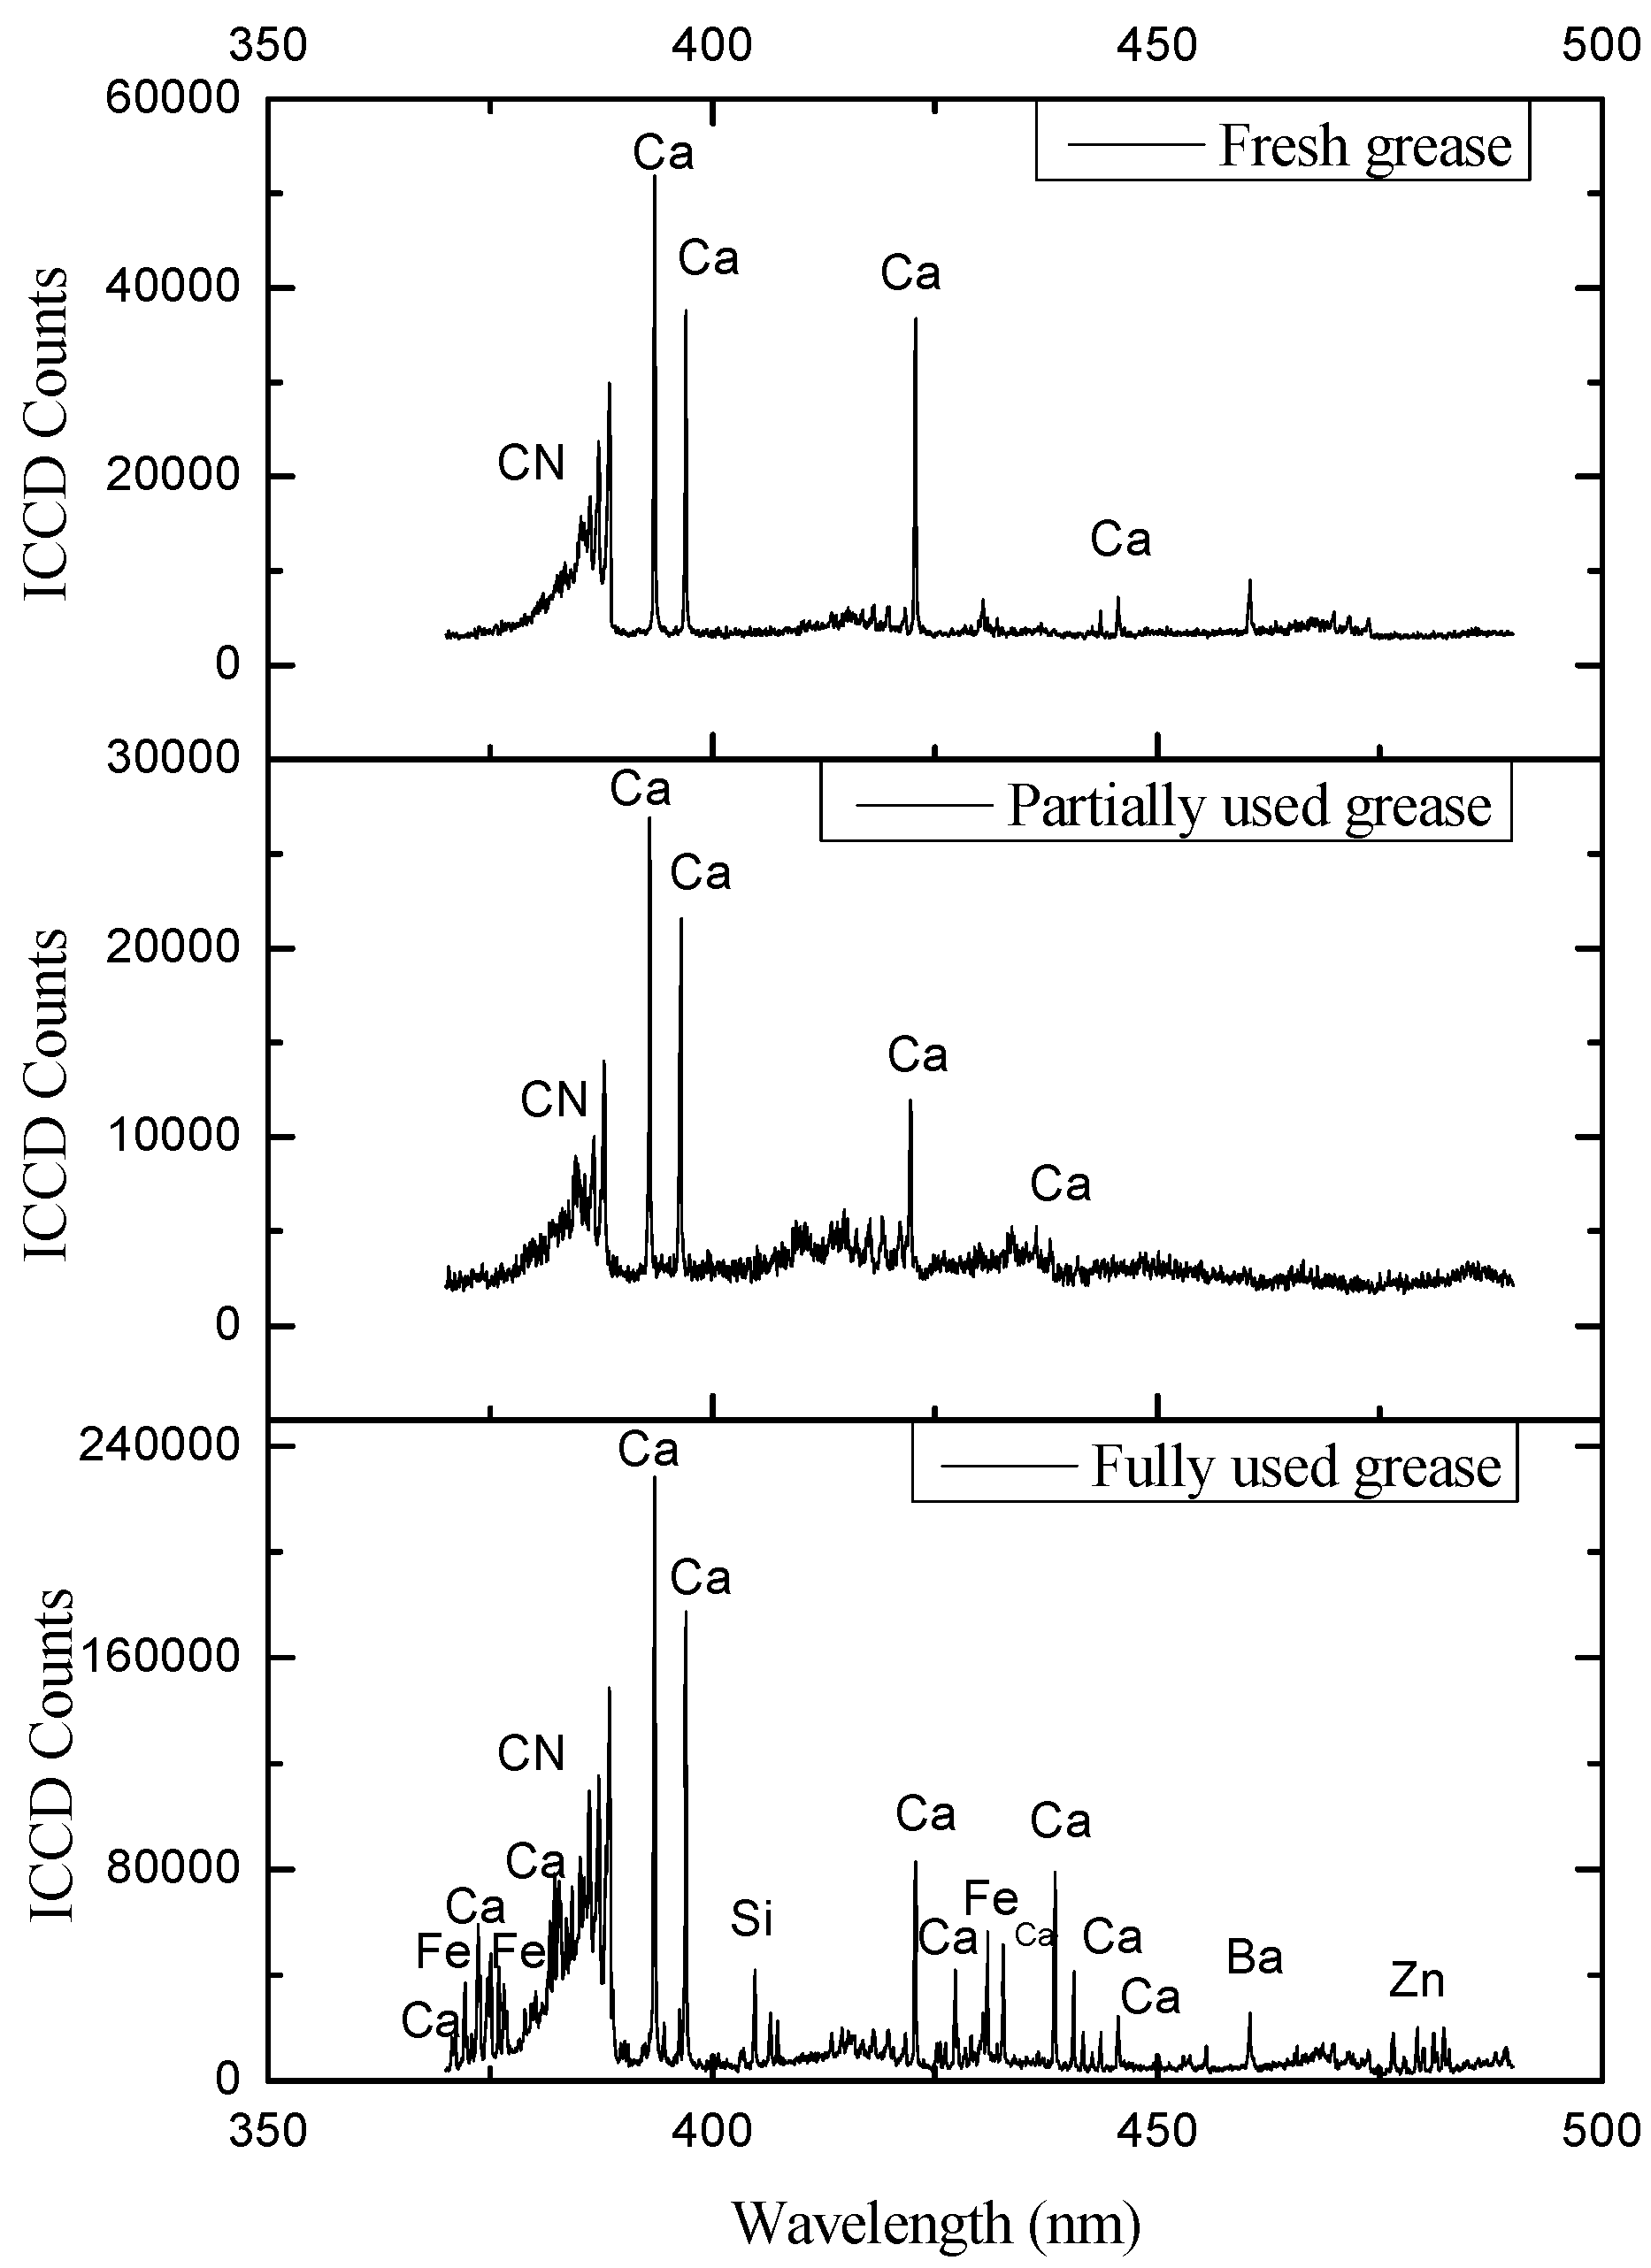
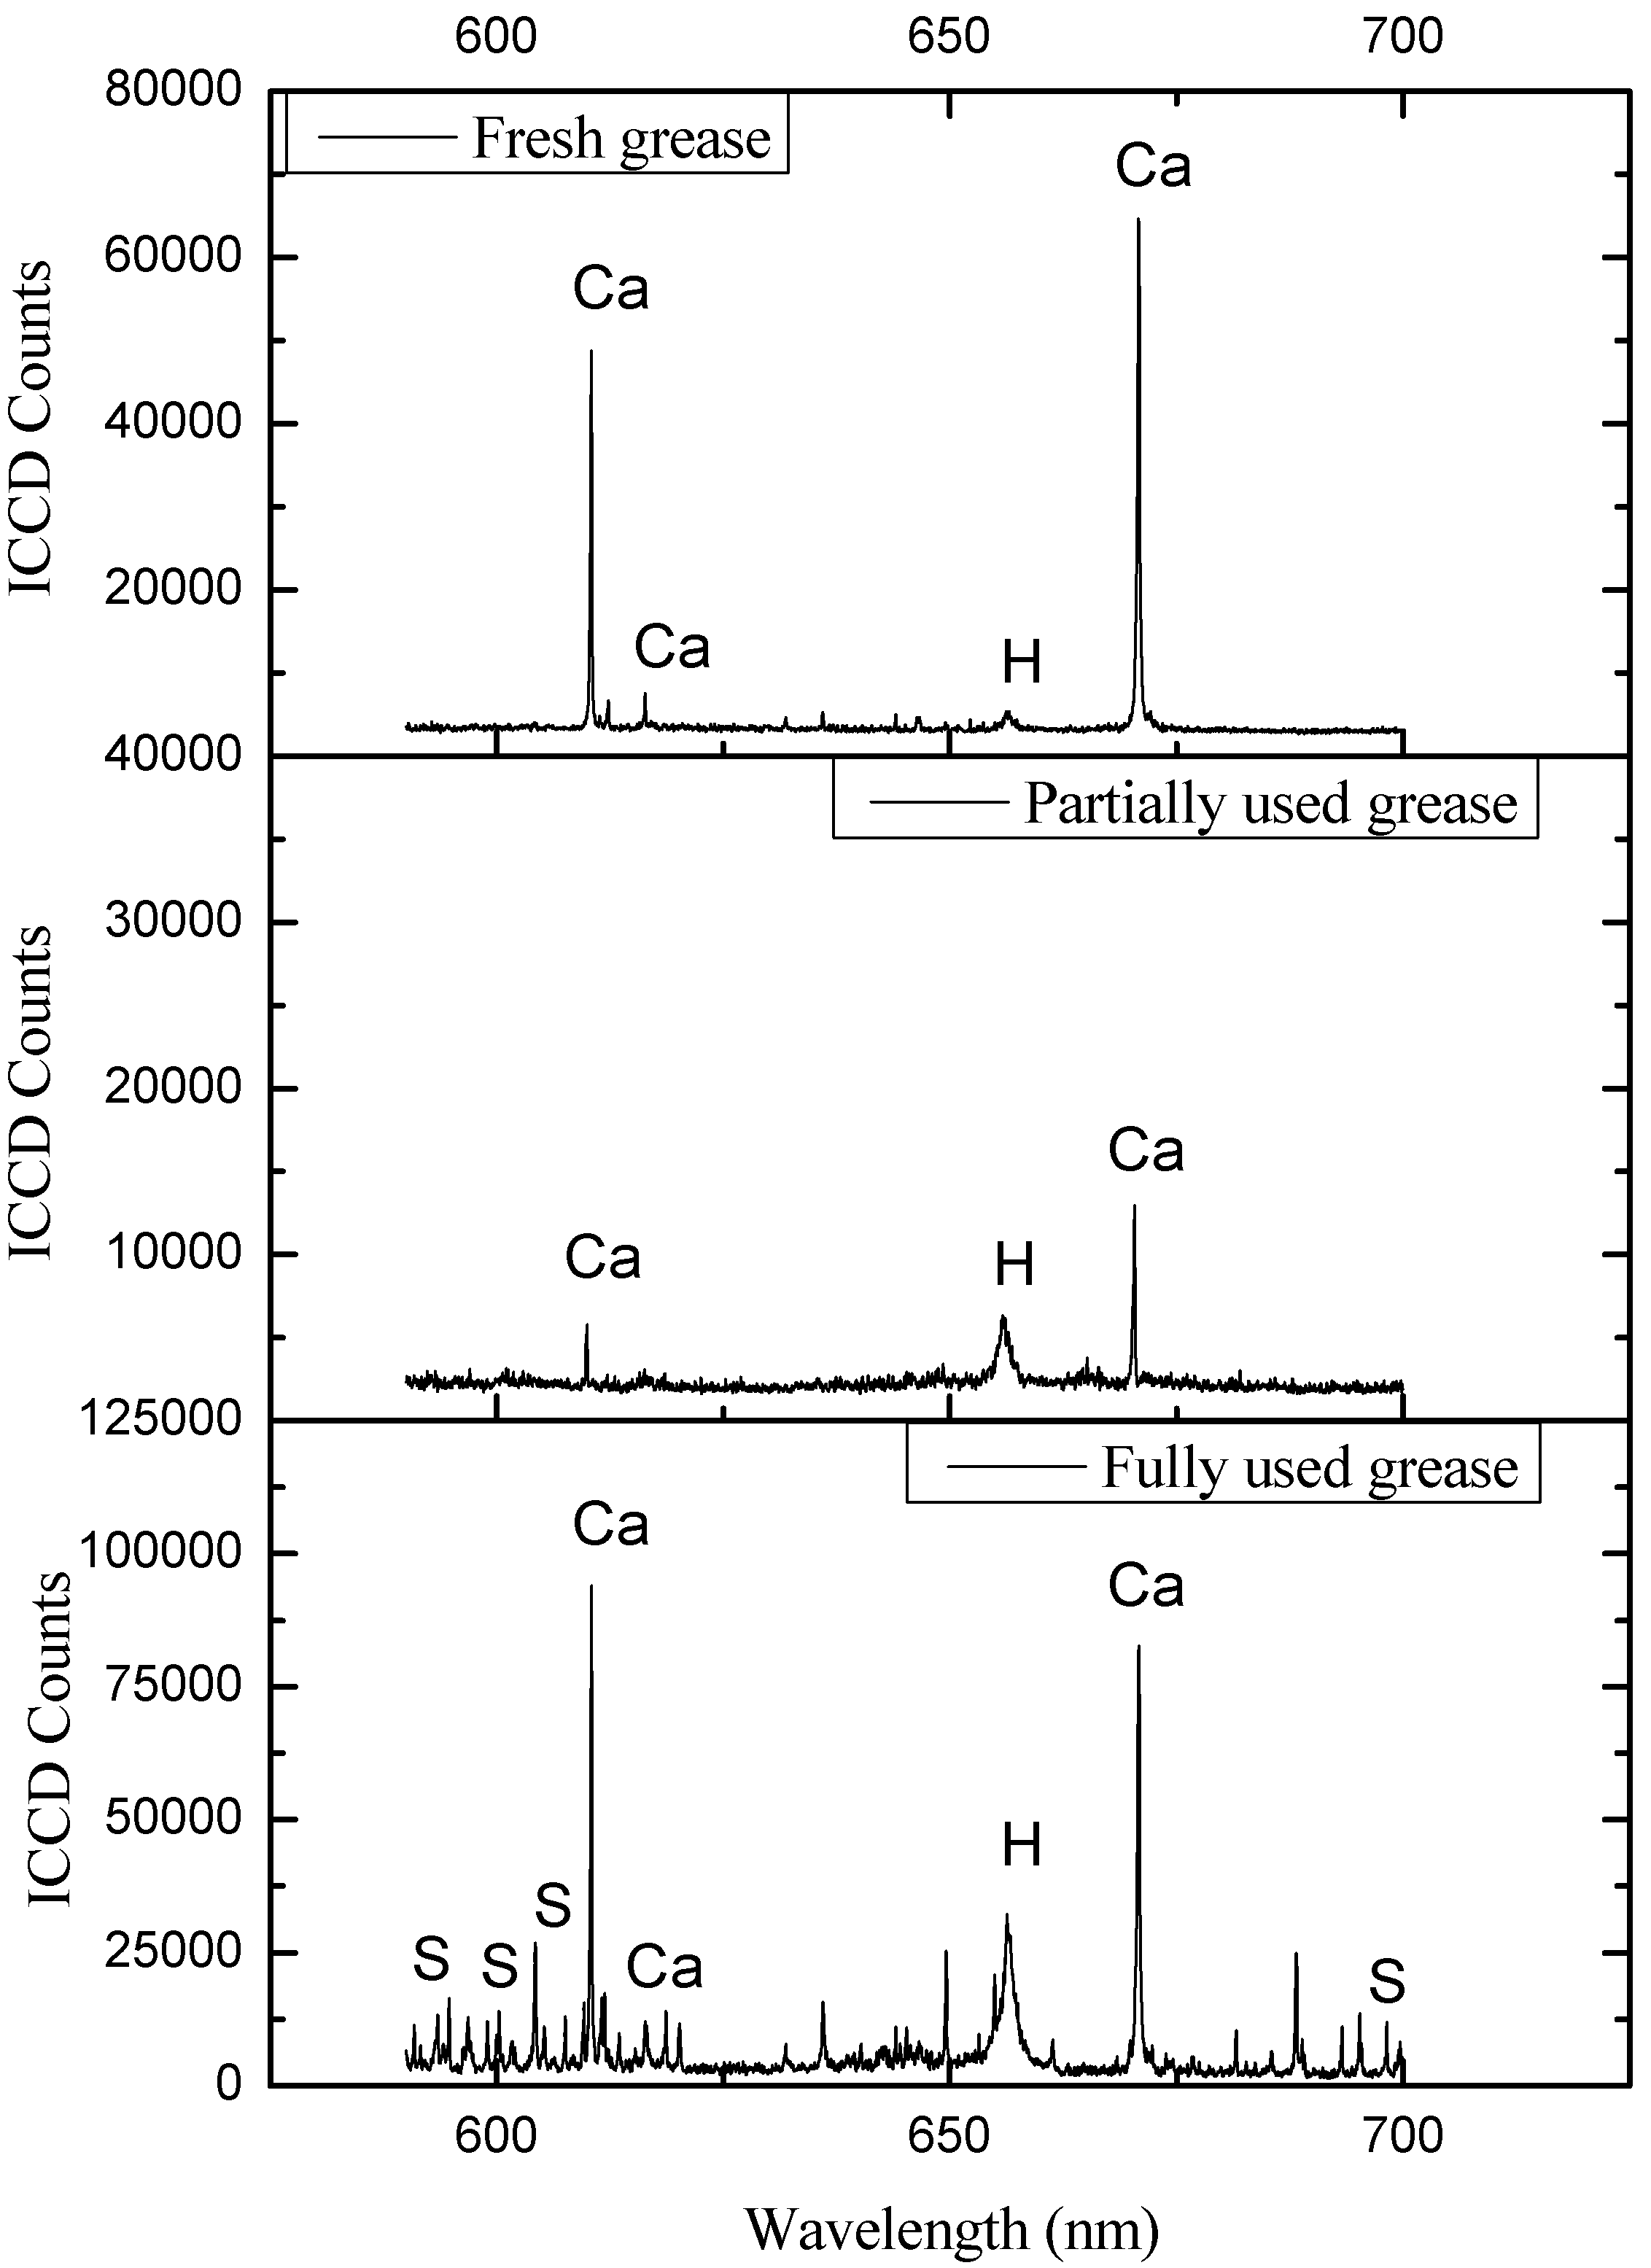
| Ca | 393.496, 397.011, 422.77, 430.419, 432.002, 443.589, 445.46, 480.07, 610.474, 612.367, 616.345, 644.037 |
| C2 | 358.543, 473.714, 516.507 |
| CN | 385.192, 385.54, 386.274, 387.162, 388.398, 418.137, 421.651 |
| S | 594.25 |
| Elements | Major Identifying Elements Lines (nm) |
|---|---|
| Fe | 273.509, 298.136, 300.247, 341.205, 342.292, 343.649, 346.019, 348.611, 356.055, 358.018, 361.98, 367.572, 375.608, 381.089, 383.792, 404.975, 407.049, 412.381, 414.825 |
| Si | 251.882 |
| Mg | 279.361, 516.628, 518.294 |
| Pb | 364.054 |
| Ca | 318.504, 370.349, 392.939, 397.383, 408.493, 409.826, 411.455, 422.269, 424.824, 431.379, 432.675, 436.934, 493.075, 558.696, 560.141, 616.282, 647.056, 649.241, 665.128, 666.424 |
| Al | 309.172 |
| Mo | 427.824, 429.453, 570.028 |
| Ba | 449.562, 467.263 |
| Na | 330.058, 498.222 |
| Cu | 324.244 |
| Elements | Major Identifying | |
|---|---|---|
| Si | 288.251 | |
| Fe | 238.274, 239.665, 248.007, 258.628, 260.01, 274.077, 275.042, 293.851, 299.567, 300.147, 303.854, 306.867, 322.702, 356.689, 358.234, 361.015, 363.294, 364.916, 372.138, 373.644, 375.073, 375.962, 376.541, 381.716, 382.18, 383.57, 385.115, 385.54, 386.158, 387.201, 388.398, 392.453, 404.735, 407.323, 413.386, 414.545 | |
| Mn | 293.851, 294.933, 322.702, 441.658, 443.627, 476.533 | |
| Mg | 279.66, 279.638, 516.584, 517.27, 518.708 | |
| Mo | 414.545, 438.164, 549.954, 570.501 | |
| Ni | 303.854, 305.901, 336.142 | |
| Al | 256.427, 306.867, 308.335, 309.377 | |
| Ca | 315.982, 318.067, 371.057, 422.81, 428.449, 430.28, 430.921, 442.662, 443.627, 445.597, 488.043, 526.317, 527.089, 551.267, 557.713, 559.223, 560.691, 610.474, 613.525, 616.345, 670.879 | |
| Cu | 324.865, 327.53, 509.98, 521.489 | |
| Pb | 357.153, 363.294, 368.16 | |
| Ba | 455.484, 553.661 | |
| S | 501.483, 502.294, 543.89, 545.589, 593.481, 594.755, 604.256 | |
| 605.26, 607.578, 609.663, 695.211, 698.223 | ||
| Zn | 481.091 | |
| Ti | 263.186, 460.428, 498.123, 523.613 | |


5. Conclusions
Acknowledgments
Author Contributions
Conflicts of Interest
References
- Hoglund, E.; Jacobson, B. Experimental Investigation of shear strength of lubricants subjected to high pressure and temperature. J. Tribol. 1986, 108, 571–577. [Google Scholar] [CrossRef]
- Mota, V.; Ferreira, A.L. Influence of grease composition on rolling contact wear. Exp. Study 2009, 42, 569–574. [Google Scholar]
- Westcott, A.L. The lubricating value of cup greases. AMD (Am. Soc. Mech. Eng.) 1913, 35, 1143–1167. [Google Scholar]
- Williamson, P.B. An optical study of grease rheology in an elastohydrodynamic point contact under fully flooded and starvation conditions. J. Eng. Tribol. 1995, 29, 63–74. [Google Scholar]
- Kageyama, H.; Moriuchi, T.; Machidari, W. Grease lubrication in elastohydrodynamic contacts (Part 2). NLGI Spokesman 1985, 49, 348–356. [Google Scholar]
- Cann, P. An analysis of the mechanisms of grease lubrication in rolling element bearings. Lubric. Sci. 1999, 11–13, 228–245. [Google Scholar]
- Wada, S.; Hayashi, H. Hydrodynamic lubrication of journal bearings by pseudo-plastic lubricants—Part 2, Experimental studies. Bull. JSME 1971, 14, 279–286. [Google Scholar] [CrossRef]
- Wada, S.; Hayashi, H. Hydrodynamic Lubrication of Journal Bearings by Pseudo-Plastic Lubricants—Part 3, Applications to Journal Bearings. Bull. JSME 1974, 17, 1182–1191. [Google Scholar] [CrossRef]
- Wada, S.; Kawakami, Y. Hydrodynamic lubrication of Porous Journal Bearings with grease. Bull. JSME 1986, 29, 943–949. [Google Scholar] [CrossRef]
- Hayashi, H.; Wada, S.; Nakari, N. Hydrodynamic lubrication of journal bearings by non-newtonian lubricants. Bull. JSME 1977, 20, 224–231. [Google Scholar] [CrossRef]
- Sukirno, R.F.; Setijo, B.; Mohanmmad, N. Biogrease Based on Palm Oil and Lithium Soap Thichkener Evaluation of Antiwear Property. World Appl. Sci. J. 2009, 6, 401–407. [Google Scholar]
- Lee, H.C.; Lee, W.D.; Choi, Y.J.; Choi, B.S.; Cho, O.W.; Yun, C.H. Tribology Characteristics Modification of Magnetorheological Fluid. J. Tribol. 2011, 133. [Google Scholar] [CrossRef]
- Jahanmir, S.; Beltzer, M. Effect of Additive Molecular Structure on Friction Coefficient and Adsorption. J. Tribol. Trans. ASME 1986, 108, 109–116. [Google Scholar] [CrossRef]
- Hurley, S.; Cann, P.M. Grease composition and film thickness in rolling contacts. NLGI 1999, 63, 14–21. [Google Scholar]
- Negi, S.; Kumar, S. Evaluation of techniques used for parameters estimation: An application to bioremediation of grease waste. Appl. Biochem. Biotechnol. 2012, 167, 1613–1621. [Google Scholar] [CrossRef] [PubMed]
- Aihara, S.; Dowson, D. A study of film thickness in grease lubricated elastohydrodynamic contacts. In Proceedings of the 5th Leeds-Lyon Symposium in Tribology, Leeds, UK, 19–22 September 1978; pp. 104–115.
- Tognoni, E.; Palleschi, V.; Corsi, M.; Cristoforetti, G.; Omnetto, N.; Gornushkin, I.; Smith, W.B.; Winefordner, D.J. From sample to signal in laser-induced breakdown spectroscopy: A complex route to quantitative analysis. In Laser-Induced Breakdown Spectroscopy (LIBS) Fundamentals & Applications; Andrzej, W., Miziolek, V., Schechter, I., Eds.; Cambridge University Press: Cambridge, UK, 2009; pp. 121–170. [Google Scholar]
- Aguilera, A.J.; Aragon, C. Multi element Saha-Boltzmann and Boltzmann plots in laser-induced plasmas. Spectrochim. Acta Part B 2007, 62, 378–385. [Google Scholar] [CrossRef]
- Zhu, W.S.; Neng, Y.T. A theoretical and experimental study of EHL lubricated with grease. ASME Trans. J. Tribol. 1988, 110, 38–43. [Google Scholar] [CrossRef]
- Adhvarya, A.; Sung, C.; Erhan, Z.S. Fatty acids and antioxidant effects on grease microstructures. Ind. Crops Prod. 2005, 21, 285–291. [Google Scholar] [CrossRef]
- Leis, F.; Sdorra, W.; Ko, J.B.; Niemax, K. Basic investigations for laser microanalysis: I. Optical emission spectroscopy of laser-produced sample plumes. Mikrochim. Act II 1989, 185–199. [Google Scholar]
- Wisburn, R.; Schecheter, I.; Niessner, R.; Schroder, H.; Kompa, K. Detector for trace elemental analysis of solid environmental samples by laser plasma spectroscopy. Anal. Chem. 1994, 66, 2964–2975. [Google Scholar] [CrossRef]
- Tognoni, E.; Cristoforetti, G.; Lengnaidi, S.; Palleschi, V.; Salvetti, A.; Mueller, M.; Panne, U.; Gornushkin, I. A numerical study of expected accuracy and precision in Calibration-Free Laser-Induced Breakdown Spectroscopy in the assumption of ideal analytical plasma. Spectrochim. Acta Part B 2007, 62, 1287–1302. [Google Scholar] [CrossRef]
- Gottfried, L.J.; Lucia, C.; de Frank, M.; Chase, A., Jr.; Miziolek, W.A. J. Anal. Atom. Spectrosc. 2008, 23, 205–216. [CrossRef]
- Cavalcanti, H.G.; Teixeria, V.D.; Legnaioli, S.; Lorenzetti, G.; Pardini, L.; Palleschi, V. One point calibration free laser-induced breakdown spectroscopy quantitative analysis. Spectrochim. Acta Part B 2013, 87, 51–56. [Google Scholar] [CrossRef]
- Gaft, M.; Nagli, L.; Fasaki, I.; Kompitsas, M.; Wilsch, G. Laser-induced breakdown spectroscopy for on-line sulphur analysis of minerals in ambient conditions. Specrtrochim. Acta Part B 2009, 64, 1098–1104. [Google Scholar] [CrossRef]
- Angios, D. Laser-Induced Break-down Spectroscopy in Art and Archaelogy. Appl. Spectrosc. 2001, 55, 186A–205A. [Google Scholar] [CrossRef]
- Gilbert, G.S. A Small Dose of Toxicology, the Health Effects of Common Chemicals, 2nd ed.; Healthy World Press: Seattle, WA, USA, 2012. [Google Scholar]
© 2014 by the authors; licensee MDPI, Basel, Switzerland. This article is an open access article distributed under the terms and conditions of the Creative Commons Attribution license (http://creativecommons.org/licenses/by/4.0/).
Share and Cite
Dhiman, C.; Reddy, M.N.; Gulati, K.; Khan, M.S. Detection of Elemental Composition of Lubricating Grease Using Laser Induced Breakdown Spectroscopy. Lubricants 2014, 2, 223-236. https://doi.org/10.3390/lubricants2040223
Dhiman C, Reddy MN, Gulati K, Khan MS. Detection of Elemental Composition of Lubricating Grease Using Laser Induced Breakdown Spectroscopy. Lubricants. 2014; 2(4):223-236. https://doi.org/10.3390/lubricants2040223
Chicago/Turabian StyleDhiman, Cherry, Martha N. Reddy, Kamal Gulati, and Mohd. Shahid Khan. 2014. "Detection of Elemental Composition of Lubricating Grease Using Laser Induced Breakdown Spectroscopy" Lubricants 2, no. 4: 223-236. https://doi.org/10.3390/lubricants2040223