Article

Multiphase Computational Fluid Dynamics Analysis of Hydrodynamic Journal Bearing Under the Combined Influence of Texture and Slip

1
Laboratory for Engineering Design and Tribology, Department of Mechanical Engineering, Diponegoro University, Jl. Prof. Soedharto SH, Tembalang, Semarang 50275, Indonesia
2
Laboratory for Surface Technology and Tribology, Faculty of Engineering Technology, University of Twente, Drienerlolaan 5, Postbus 217, 7500 AE Enschede, The Netherlands
*
Author to whom correspondence should be addressed.
Lubricants 2019, 7(11), 97; https://doi.org/10.3390/lubricants7110097
Submission received: 13 August 2019 / Revised: 24 October 2019 / Accepted: 25 October 2019 / Published: 30 October 2019
(This article belongs to the Special Issue Tribology of Powertrain Systems)

Abstract

:
The drive to maintain the environmental sustainability and save the global energy consumption is urgent, making every powertrain system component a candidate to enhance efficiency. In this work, the combined effects of the slip boundary and textured surface in hydrodynamic journal bearing as one of the critical components in industrial powertrain and engine systems are assessed using a multiphase computational fluid dynamic analysis that allows for phase change in a cavitation process and arbitrary textured geometry. The texture studied consists of regularly spaced rectangular dimples through two-dimensional (infinitely long) journal bearing. The modified Navier–slip model is employed to describe the slip boundary condition. A systematic comparison is made for various textured configurations varying the texture depth and the length of the texturing zone with respect to the performance of a smooth (untextured) bearing for several eccentricity ratios. The effectiveness of the texture with or without slip at enhancing the load support over a corresponding smooth bearing is investigated with the parameters. The detrimental or beneficial effect of surface texturing as well as the slip promotion is explained in terms of the mechanisms of pressure generation for several eccentricity ratios. The results of the present work indicate that journal bearing textured by a proper texturing zone and dimple depth are characterized by substantial load support levels. However, in the range of high eccentricity ratios, the promotion of texturing and slip can significantly degrade the performance of the load support.

Graphical Abstract

1. Introduction

Tribological characteristics have a highly important effect on the resource and energy efficiency of both the manufacture and operation of powertrain components. Components pointing out a high potential for efficiency enhancement include piston rings, cylinder liners, and journal bearing. The advancement of journal bearing design has attracted wide concerns since this specific machine element is widely used in a variety of modern applications, such as the powertrain system, steam/gas turbine, automobile engine, and shipbuilding industry. With growing demand for increased environmental awareness and decreased energy consumption, surface texturing is well-known as an effective approach for enhancing tribological bearing performance quantified in terms of the friction coefficient and the load support in the frame of both experimental and theoretical studies. Numerous publications have shown that surface texturing has a considerable effect on tribological properties. Starting from the pioneering study of Hamilton et al. [1], the positive influences of surface texturing have been highlighted in lubricated contact. Recent experimental results in this area [2,3,4] revealed that significant amelioration in lubrication performance can be obtained by surface texturing. According to Morris et al. [2], promoting the micro-hydrodynamic effect could delay the influence of lubricant rupture and consequently the effective load bearing region could be extended. By introducing the texture pattern on the whole of the bearing shell circumference, substantial friction reduction (approximately 18%) was achieved when compared to the smooth (untextured) reference as reported by Vlădescu et al. [3]. An interesting finding has also been revealed by Galda et al. [4] based on an experimental investigation dealing with the positive effect of surface texturing on journal bearing performance. It was concluded that textured journal bearing, during shut down, remains in hydrodynamic lubrication for longer and then switches to mixed lubrication at a lower velocity in comparison with the classical (smooth) one.
Some interesting studies, strongly discussing on the influence of surface texturing on hydrodynamic lubrication of lubricated sliding contact, were recently reported by Rahmani et al. [5,6]. Based on an analytical approach, they provided a set of local and global optima of design parameters maximizing the load support and minimizing the friction for partially textured sliding surfaces. Dealing with the improvement of journal bearing performance, some numerical attempts have also been performed by some researchers. For example, Tala-Ighil et al. [7] concluded that a well-chosen arrangement of a textured zone on the contact surface leads to improved characteristics. Similarly, Khatri and Sharma [8], based on Reynolds equation, investigated the effect of the length of the texturing zone for journal bearing lubricated by non-Newtonian lubricant on the friction force and bearing stability. They revealed that the textured hybrid journal bearing produces an enhanced stability parameter compared to that of a non-textured journal bearing. Later, Shinde and Mawar [9] carried out multi-objective optimization of texturing parameters, such as groove height, groove location, groove width, number of grooves, and spacing between grooves. Using ANOVA, the optimal condition to enhance the performance of the journal bearing was obtained.
In recent years, with the advancement of computer technology, the application of the commercial CFD (computational fluid dynamics) simulation method, which are based on the full Navier–Stokes equations, has served as the best reference standard to solve complex lubrication problems of textured surfaces. It is worth mentioning the early work of Sahlin et al. [10], who explored the use of CFD to study the macro-texture with respect to the inertia effect. They stated that the groove introduced on the stationary surface of a parallel lubricated slider leads to an additional pressure build-up. Similarly, Caramia et al. [11] studied parallel textured surfaces for a wide variety of geometries, varying their depth, width, and gap in terms of drag force. With a single-phase lubrication analysis, a maximum reduction in drag of about 20% was achieved. Vilhena et al. [12] studied the influence of texturing parameters on the performance of friction based on the CFD approach for different geometries of a textured surface. In terms of hydrodynamic performance, the optimum geometry shapes were discussed. However, in their research, a single-texture configuration was adopted. It should be noted that the previously published results still employed single-phase analysis to capture the cavitation phenomena.
As is known, cavitation has been considered as one of the mechanisms of texture formation of surface lubrication, and thus cavitation should be properly modelled. With a multiphase flow approach, a complete analysis dealing with the effect of surface texture on the lubricated journal bearing performance was conducted by Cupillard et al. [13] using CFD. The design of deep and shallow dimples in providing an enhancement of hydrodynamic performance was investigated at a range of eccentricity ratios. With the aim of improving the performance of the textured cylinder surface, Mao et al. [14] conducted the optimization of cavitation based on multiphase cavitation model. The vapor volume fraction, cavitation situation, pressure distribution, friction, and support force of the textured unit cell model have been discussed in detail. In a recent publication, Lin et al. [15] concluded that the textured surface may improve or impair the load support performance of the journal bearing depending on the texture position in the circumferential direction.
In addition to the surface texturing method, a significant improvement of the bearing performance (i.e., high load support but low friction) can be achieved by the use of a slip surface with the help of microfabrication techniques to modify the contacting surface behaviors, including their wettability and topography. As a remark, it is clear that the use of (super)hydrophobic coating has a significant role in promoting the slip boundary at the bearing surface. Recently, several workers have investigated the characteristics of the sliding contact using the mixed slip surface with respect to the enhancement of the tribological performance of journal bearings [16,17,18,19,20,21,22], in which the slip boundary is engineered to exhibit a partial zone of the bearing surface. Later, a new idea dealing with the combination of slip and texturing in lubricated bearing has received much attention. The design was first introduced by Aurelian et al. [23], who found that in combined partial texturing and mixed slip pattern, a more significant reduction in power loss was noticed when compared to the conventional (no-slip) texturing one. Then, several investigations [24,25,26,27] on the combined influences of texturing and the slip boundary in parallel sliding contacts and journal bearings were performed. In the case of sliding contacts, based on the Reynolds approach, Tauviqirrahman et al. [24,25] found that even in the parallel gap condition, the combined textured/slip pattern, when having a low texture cell aspect ratio, low critical shear stress conditions and a high slip length generates a load support improvement and friction reduction. Similar results were confirmed by Ismail and Sarangi [26]. They showed that compared to the purely textured contact, promotion of the slip around the texture cell could enhance the lubrication performance. Generally speaking, the surface geometry in the form of texturing combined with (super) hydrophobic coating has a considerable effect on the tribological properties, and as a consequence, this kind of pattern may enhance efficiency and lengthen the service life of hydrodynamic bearings of powertrain components.
In their work, however, the non-mass conserving cavitation model based on Reynolds cavitation theory was still adopted. Additionally, by using the Reynolds approach to solve the lubrication problem, the recirculation flow, which may present inside the dimple, could not be predicted. In the case of journal bearings, Lin et al. [27], based on the CFD method, conducted an optimization of the slip/texture design considering cavitation. An enhanced lubrication performance of the bearing could be obtained with a well-designed slip/texture pattern. However, in their results, the growth bubble during the cavitation process was neglected.
A thorough literature review shows that no studies have yet been reported about the effect of textured surfaces with slip conditions on the performance of journal bearings using a multiphase cavitation model. Although numerous studies of textured bearings are found in the literature, most existing studies adopt single-phase flow analysis. Furthermore, the growth and collapse of air bubbles during the cavitation process has not been taken into account. Therefore, the purpose of the present work was to study the combined effect of the texturing and slip boundary by incorporating more real cavitation phenomena as well as an inertia term based on multiphase computational fluid dynamics analysis.
As a first endeavor, the Reynolds-averaged Navier–Stokes (RANS) equation coupled with a single set of density equations for the mixture is presented to simulate the performance of the hydrodynamic lubrication with a textured surface with or without slip boundary conditions considering cavitation. A general geometry corresponding to the two-dimensional textured bearing with a variety of texturing patterns, such as texture, depth, and texturing zone, is constructed. Finally, the influences of eccentricity as well as texturing parameters on the hydrodynamic pressure, load support, slip velocity, and velocity vector of the lubricant are also analyzed and discussed in detail.

2. Theory

2.1. Governing Equations

In the present work, the flow behavior induced by the surface motion is solved by calculating the Navier–Stokes instead of Reynolds theory for incompressible flow. As discussed by Li and Chen [28] and Dobrica and Fillon [29], due to the large texture depth as studied here, high-pressure gradients in the surface’s normal direction may be exhibited, and thus, the prediction of Reynolds theory leads to incorrect results of the pressure distribution. In order to obtain more accurate results, in this study, the Reynolds-averaged Navier–Stokes (RANS) equation coupled with the mass conservation equation are used.
The RANS equation (momentum equation) is:
x i ( ρ u i u j ) = p x i + x j [ μ u i x j ρ u i u j ¯ ]
The mass conservation equation is:
x i ( ρ u i ) = 0
where ρ is the density; ui and uj are the average velocity components for x, y, and z; p is the hydrodynamic pressure; µ is the viscosity; ui′ and uj′ are the fluctuation velocities; ρ u i u j ¯ is the Reynolds stress; and i, j = 1, 2, 3 (x, y, z). Additionally, for all following computations, the turbulence model is employed. Based on the results of Song et al. [30], turbulence has a strong effect on the performance even though the Reynolds number is relatively low, especially when the slip is employed in lubricated contact as studied here. It is noted that in the present study, the Reynolds number of fluid flow inside the journal bearing ranges from 550 to 830 depending on the eccentricity ratio. The standard turbulent kinetic energy, k, and turbulent dissipation rate, e, models [31] are employed to solve the Reynolds stress. To simplify the computational processing, the following assumptions are taken into account:
  • The fluid is incompressible;
  • The Newtonian fluid is considered, and thus the lubricant viscosity is independent of the shear rate;
  • Isothermal lubricant conditions are assumed;
  • The elastic deformation of the contacting surfaces is not taken into account; and
  • The liquid flows under steady-state condition, and thus its components are independent of the time variable.

2.2. Slip Modelling

In practice, the slip condition on the lubricated contacting surface can be induced by modifying the properties of roughness and the wettability of the surface [32]. In this way, the no-slip assumption is no longer valid. The modified Navier-slip model as presented in Equation (3) is employed in this work. This model expresses that if the local shear stress, τ, exceeds a critical value, say τcr, the slip boundary is exhibited and the corresponding slip velocity, Us, can be obtained as follows:
If τ < τcr, U s = 0 :
If   τ     τ cr ,   U s = ( τ τ c r ) b μ ,
where b is the slip length and µ is the viscosity. It should be noted that the slip velocity, Us, imposed at the slip boundary is the difference of the velocity between the wall at the fluid–sloid interface and the lubricant particles. The slip length, b, represents how slippery the surface is when interacting with a specific lubricant. In the present work, in order to achieve the optimal lubrication performance dealing with the slip application, the zero critical shear stress is assumed [24,33], whereas the slip length is set to 100 μm [34].

2.3. Cavitation Modelling

In real practice, cavitation phenomenon in the lubricant domain may occur during the operation of the lubricated journal bearing. In the lubrication problem, cavitation is the main issue that needs to be properly modelled. For all following computations studied here, the cavitation is modelled using a mixture model provided by CFD software. The cavitation results are obtained from the pressure change. Basically, the mixture model represents vapor–liquid two-phase flow by considering that the liquid phase becomes a vapor phase when the lubricant film pressure falls below the vaporization pressure. Additionally, the growth of gas bubbles, which often accompanies the cavitation process, is also predicted. In this study, the multiphase cavitation model of Zwart–Gelber–Belamri is used [31,35].
In cavitation, the liquid–vapor mass transfer (evaporation and condensation) is governed by the vapor transport equation [31,35]:
t ( α v ρ ν ) + . ( α v ρ ν v ) = R g R c ,
where αv refers to the vapor volume fraction and ρv denotes vapor density. Rg and Rc account for the mass transfer between the liquid and vapor phases in cavitation. For the Zwart–Gelber–Belamri model, assuming that all the bubbles have the system size in a system, the final form of the cavitation is as follows [35]:
p p v ,     R g = F e v a p 3 α n u c ( 1 α υ ) ρ υ R B 2 3 P υ P ρ ,
p p v ,     R c = F c o n d 3 α υ ρ υ R B 2 3 P P υ ρ ,
where Fevap = evaporation coefficient = 50, Fcond = condensation coefficient = 0.01, RB = bubble radius = 10−6 m, αnuc = nucleation site volume fraction = 5 × 10⁻⁴, ρ = liquid density, and pv = vapor pressure.

3. Computational Analysis

3.1. Geometric Model

In the frame of both experimental and theoretical studies, recent technological improvements suggest that in order to enhance the tribological performance concerning the load support and friction properties of the journal bearing, partial texturing must be employed. In the present work, textured bearing with a rectangular dimple is of particular interest. The reason for using the rectangular-shaped dimple is that this shape is able to achieve the best performance compared to other shapes based on the work of Vilhena et al. [12]. Additionally, in practice, it is easier to manufacture it. A schematic diagram of smooth (untextured) and textured journal bearings is shown in Figure 1. The film thickness is approximated by a cosine profile as follows [36,37]:
h ( θ ) = c ( 1 + ε cos θ )
where c refers to the radial clearance, ε denotes the eccentricity ratio, and θ expresses the circumferential angle.
For the textured bearing studied here, a texture cell is defined by its dimple depth, D, dimple length, WG, and texture cell length, Wcell, as shown in the inset of Figure 2. For all following simulations studied here, the texture density, ST (the ratio of the dimple length, WG, over the texture cell, Wcell), is assumed to be constant and equal to 0.5. In the present work, more work has been paid to optimizing the texturing parameters with respect to the improvement of the pressure profile and the load support. The length of the texturing zone and the dimple depth for three eccentricity ratios were studied for two surface characteristics (i.e., with and without slip condition). With respect to the effect of dimple depth, a dimensionless parameter, D/hmin, is introduced, which is the ratio of the dimple depth, D, over the minimal film thickness, hmin. The surface texturing employed in the present study is a series of dimples on the bearing (stationary) surface depending on the length of the texturing zone. In terms of the texturing zone, for all following computation, the dimples are introduced from the angular coordinates (i.e., circumferential angle) of θ = 0 ° , with the reference position measured at the hmax as indicated Figure 1. Computations were made by varying the length of the texturing zone, θ G , from 0–30° to 0–180°. It should be noted that for all computations, the dimple length, WG, is equal to 5°. In this way, for each interval of the texturing zone of 30°, there will be six texture cells covering the specified zone.
A comparative performance analysis between the textured geometry with or without slip and the corresponding smooth configuration was then conducted. The parameters studied are the hydrodynamic pressure and the load support. The load support, W, per unit length was obtained from the integration of the hydrodynamic pressure acting on the journal.

3.2. Solution Set Up

To determine the appropriate mesh density for evaluating the lubricant characteristics of the journal bearing accurately, the meshing analysis needs to be performed. In the present study, for the calculation the CFD-based commercial software ANSYS DesignModeler and ANSYS ICEM CFD were employed to produce the computational model and structural mesh, respectively. The computational domain is meshed with the uniform quadrilateral grid, as shown in Figure 3. The number of mesh points in the longitudinal (Nx) and transverse (Nz) direction was varied in order to get mesh independence. In addition, more refinement of the mesh system, particularly around the dimple area, was also conducted to capture the presence of the flow recirculation due to the sudden change in texture geometry. Consequently, the mesh number used was around 200,000 to 400,000 nodes across the film depending on the texturing zone, dimple depth, and eccentricity ratio.
In the present work, as reflected in Figure 4 the boundary condition of the computational domain was set as follows: One side of the location of the maximum film thickness, hmax, is used as an inlet condition and the other as an outlet. The pressure at the inlet (Pin) and outlet (Pout) boundaries is taken as the ambient pressure, i.e., zero pressure. The top wall of the lubricant film is modelled as a stationary surface, whereas the bottom surface is modelled as a moving surface assuming no-slip condition and a rotational velocity equal to that of the shaft. During the calculation in ANSYS FLUENT® software, the regions of cavitation and the hydrodynamic pressure are computed with the MIXTURE model.
In the present numerical study, the pressure-based solver was employed. The SIMPLEC algorithm was used to treat the pressure–velocity coupling. For the momentum equations, the second order upwind discretization scheme was used, whereas the QUICK discretization scheme was employed for the turbulent kinetic energy as well as for the turbulent dissipation rate and the volume fraction equation. In the present work, a convergence tolerance of 1 × 10⁻⁶ was adopted for all residual terms for more accurate computational results.

4. Results and Discussion

4.1. Validation

Prior to simulation, it is necessary to validate the CFD solution set up, the multiphase cavitation model implemented in this simulation, and the author’s code for the slip model for analyzing the tribological performance. The validation of the developed CFD model was conducted by comparing the obtained computational results with those in previously published literature. Here, the validation was conducted for two conditions of journal bearing, i.e., no-slip and slip conditions.

4.1.1. No-slip Condition

In this section, the hydrodynamical pressure result of the conventional (no-slip) smooth bearing, presented by Cupillard et al. [13], is used as reference. Under the same parameters and boundary conditions, the result of the numerical simulation is presented in Figure 5. It should be noted that in [13], the multiphase cavitation model of the Rayleigh–Plesset model was used. In the present work, as mentioned earlier, the multiphase cavitation model of Zwart–Gelber–Belamri [35] was employed here, in which the growth and collapse of air bubbles generated in the cavitation zone were modeled. As seen in Figure 5, the numerical experiment utilizing the developed CFD model exhibits very reasonable agreement with those presented in [13]. It also indicates the validation of the cavitation model used here.

4.1.2. Slip Condition

For further validation, the results about the slip effect on the hydrodynamic pressure in the present study were compared with the numerical data of Wu [38] under the same condition and parameters. In the comparison, the multiphase cavitation model was adopted to model the cavitation phenomena. It should be noted that in ANSYS FLUENT, the Navier–Stokes equations is solved. Therefore, no Reynolds assumption is made. Figure 6 shows the comparison of the predicted pressure between the present CFD method and the literature. Two bearings who have different lengths of slip zones are of particular interest. Their performance was then compared to that of the conventional (no slip) bearing. As seen from Figure 6, the pressure distribution obtained by the present CFD method is basically in reasonable agreement with that in [38], especially in the convergent area. The discrepancy between the variation trends for the hydrodynamic pressure in particular in the divergent area of the bearing obtained by the present method and the work of Wu [38] is mainly due to the fact that the non-mass conserving Reynolds cavitation model was still adopted in [38]. In other words, with respect to the cavitation model, the comparison results of the single phase (Reynolds approach in this case) and multiphase flow approach indicates that hydrodynamic film pressure has similar distribution characteristics in the convergent area but is different in the divergent zone of the bearing. It is interesting to note that although the slip model used is different, the values of the hydrodynamic pressure predicted here are similar with those given in [38]. The results suggest that the validation of the present slip code was achieved. In what follows, all the numerical experiments are performed based on the present code.

4.2. Effect of Texture Depth

In the numerical experiment, the parameters employed are shown in Table 1. These parameters are unchanged until otherwise determined. In order to study the effect of the texture parameter (i.e., texture depth in this section) on the hydrodynamic performance of the lubricated contact either in the case of the purely textured bearing or the case of the slip-textured bearing, the calculations were performed. It will be highlighted that particular care should be conducted in determining the texturing parameters, i.e., the texture depth and the texturing zone of the contact because an inappropriate choice can lead to a decrease in the hydrodynamic pressure. In the present study, computations were performed by comparing the performance of the textured (with/or without slip) bearing over the classical (smooth and no-sip) bearing for three different conditions of D/hmin by varying the length of the texturing zone in terms of the pressure profile. An eccentricity ratio, ε, of 0.5 is employed in this section.
Figure 7 shows the distribution of the hydrodynamic pressure for several values of the dimensionless texture depth (D/hmin) by varying the texturing zone ( θ G ) in the case of the purely textured bearing. These results show that in the case of low D/hmin (i.e., D/hmin = 0.5 in this case) in relation to the hydrodynamic pressure, it is observed that in comparison to the smooth (untextured) case, introducing surface texturing on the lubricated bearing leads to a decrease in the hydrodynamic pressure distribution, particularly in the convergent area, irrespective of the texturing zone. It is therefore evident that the smooth pattern has the highest peak pressure compared to the textured configurations while the textured pattern with the longest texturing zone generates the lowest peak pressure.
Based on Figure 7, it is also highlighted that even though the bearing pattern with a high texturing zone ( θ G = 0–180°) generates a higher-pressure gradient at the ending edge of the texturing zone compared to the smooth pattern, such an increase in the pressure gradient does not provide enough enhancement of the pressure profile. Evidently, a similar trend can also be observed for other texture depths. For example, when the dimensionless texture depth, D/hmin, is increased by a factor of 2, no significant change in the pressure profile is found. Only a little reduction in the peak pressure is observed when the texture depth is increased. Further, by comparing the results shown in Figure 7a–c, it can be revealed that with respect to the prediction of the peak pressure, the effect of the surface texturing becomes severe with the increase in texture depth and texturing zone. In other words, for the case of ε = 0.5, setting the textured pattern with the highest texture depth and texturing zone considered here gives the worst tribological performance.
Regarding the potential application of a slip surface for textured journal bearings, a big question emerges in accordance with the slip effect on the lubrication performance of textured bearings. Therefore, a series of computations were conducted with the slip boundary to find the optimal slip-textured design in terms of hydrodynamic pressure. Figure 8 depicts the hydrodynamic pressure of the slip-textured pattern for several texture depths (D/hmin). The simulation results show that the bearing with the texturing zone covering the convergent area up to 180° ( θ G = 0–180° in this case) is able to produce the highest peak pressure compared to other patterns. It can also be noticed that there is a shift of the location of the pressure peak toward the divergent area. Consequently, it induces a reduction in the length of the cavitation area, which may increase the load support. As clearly indicated in Figure 8, when the slip-texturing zone of 180° ( θ G = 0–180°) is used, the cavitation zone reduces. For example, for the case of D/hmin = 1.5, the cavitation process starts to occur at the circumferential angle θ of 235° and finishes at θ of 325°, while for the other cases (i.e., the smooth bearing and the textured bearing with a lower slip-texturing zone θ G ), the cavitation zone ranges from θ of 215° to 325°. This prevails for all values of D/hmin considered here. On the other words, based on Figure 8, by employing the longest slip-texturing zone (θG = 0–180°), the cavitation zone decreases by around 20% compared to the other patterns. Another interesting result is that in the case of θ G = 0–180°, the peak pressure reduces with the increase in D/hmin. This characteristic is completely different with the case of the purely textured bearing (no-slip). Adding the slip boundary on the textured surface changes the flow characteristics. Definitively, more positive effects can be induced by employing slip in terms of the peak pressure and cavitation region. Generally speaking, comparing Figure 7 and Figure 8 for the eccentricity ratio of 0.5, it can be noticed that constructing the textured surface with the lowest texture depth (D/hmin = 0.5 in this case) leads to an enhanced pressure profile both for the case of pure texturing and slip texturing.
To investigate why the performance of the slip-textured bearing with a low texture depth is more effective in improving the pressure distribution compared to that with a larger textured depth, one needs to understand the main factor contributing to the hydrodynamic pressure. The presence of the slip boundary on the textured area with different texture depths will produce different slip velocity profiles. Figure 9 reflects the distribution of the slip velocity on the interface along the textured surface with θ G = 0–180° for several values of D/hmin in the case of ε = 0.5. Three specific features can be drawn based on Figure 9.
Firstly, it can be noticed that for each case of D/hmin, the difference of the prediction between the slip velocity on the texture peak and that on the texture valley along the texturing zone increases with the increase in texture depth. For example, in the case of D/hmin = 0.5, for the first dimple (i.e., at the leading edge of the contact), such a difference is around 25% while in the case of D/hmin = 1.5, the difference is 50% (or 100% larger compared to the case of D/hmin = 0.5). For the last dimple (i.e., at the ending edge of the textured area), the difference of the prediction between the slip velocity on texture peak and that on the texture valley is 200%, 1300%, and 1600%, respectively, for the case of D/hmin = 0.5, D/hmin = 1.0, and D/hmin = 1.5.
Secondly, at the end of the texturing zone, i.e., at the circumferential angle of around 160 to 180°, the slip velocities both on the edge of the texture valley (denoted by c) and the edge of the texture peak (denoted by a) tend to reduce with the increase in the texture depth. For the case of D/hmin = 1.5, the slip velocities on the interface of the texture valley edge have a negative textured zone. It indicates that there is backflow inside texture cells. This behavior is different with the case of the bearing with lower texture depth, say D/hmin = 0.5 in this case; at the edge of the texture valley along the textured surface, as can be observed in Figure 9a, the sign of the slip velocity changes from negative to positive. Based on the physical point of view, at the beginning, the condition of backflow marked by “negative” slip velocity will slow down the lubricant, especially at the textured zone of 0–120°. Then, the lubricant at the interface of the texture valley edge moves at the higher flow rate due to the presence of the specific value of slip velocity in the range of 0.2 to 0.6 m/s.
Thirdly, based on Figure 9, it is found that increasing the texture depth, D/hmin, reduces the positive effect of the slip velocity profile along the textured zone. For example, for the case of D/hmin = 1.5, at the leading edge of the textured contact where the slip texturing starts to apply, the values of the “negative” slip velocities are around 0.52 m/s or 20% larger compared to that of D/hmin = 0.5. However, at the ending edge of the textured contact, the “positive” slip velocities predicted by the case of D/hmin = 1.5 decrease by up 12%. On the other words, the positive slip effect reduces much more with the increase in D/hmin. Generally speaking, these two coupling actions lead to a higher hydrodynamic pressure, and thus an increased load support.

4.3. Effect of the Length of the Texturing Zone

In this section, the effect of the length of the texturing zone, θG, on tribological performance will be discussed both for the case of the purely textured bearing and the case of the slip-textured one by varying the texture depths, D/hmin, for several values of the eccentricity ratio, ε. The variation of the length of the texturing zone, θG, is of particular interest with respect to the increment in the load support. As is known, the lubrication performance of the bearing is strongly affected by the eccentricity ratio, representing the magnitude of the loading during operation. Thus, in this work, the prediction of the tribological performance is also made for different eccentricity ratios, i.e., ε = 0.2 (light loaded bearing), ε = 0.5 (medium loaded bearing), and ε = 0.8 (heavy loaded bearing).

4.3.1. At Low Loaded Bearing

Figure 10 gives the maximum pressure, Pmax, as a function of the length of the texturing zone, θG, for the case of ε = 0.2 (light loaded bearing). As shown in Figure 10, in the case of the slip-textured bearing, the value of Pmax increases significantly with an increase of the length of the texturing zone, θG, for all values of D/hmin. With respect to the effect of the texture depth, as D/hmin is reduced, the maximum pressure increases. Such an increase becomes clearer when the length of the texturing zone is increased. Therefore, as noticed in Figure 10, the Pmax value for the slip-textured bearing with θG of 180° is far larger than that for the smooth (untextured) bearing. This is expected because as discussed earlier (Figure 9a), the presence of the slip velocities along the textured area accelerates the flow of the lubricant so a higher-pressure gradient and thus a higher peak pressure can be achieved. Based on Figure 10, it is also shown that in the case of the pure textured bearing marked off with the dotted line, extending the length of the textured region, θG, results in the increase-then-decrease behavior of the maximum pressure, indicating that there is an optimal value of θG for the case of the low loaded bearing. In terms of the value of the maximum pressure, it can be highlighted that the optimal texturing zone, θG, for the purely textured pattern is 120°. Comparing the behaviors of the purely textured bearing and the slip-textured one as shown in Figure 10, it seems that the effect of the slip boundary has a larger contribution in enhancing the peak pressure than the texturing effect. For the case of θG = 120° or larger, it can be noted that the slip boundary on the textured area induces more hydrodynamic action of the lubricant.
With respect to the performance of the load support, the effect of the length of the texturing area by varying the texture depths is shown in Figure 11. The simulation results show that increasing the length of the texturing zone, θG, will improve the load support irrespective of the textured depth. It can clearly be seen that a significant improvement can be achieved when the extension of the texturing zone is combined with the application of the slip boundary. For example, in the case of D/hmin = 0.5, in comparison to the smooth (untextured) case, a 900% improvement in load support is obtained when the texturing zone is applied to cover the convergent area (i.e., θG = 180°). For the same pattern (D/hmin = 0.5, θG = 0–180°) without slip, the load support predicted is about 5 kN (or just 150% larger compared to the smooth bearing). It can also be said that when slip is employed on the texturing bearing with θG = 0–180°, for example, the load support can be enhanced by from 450% to 550% depending on the D/hmin value.
To explain why for the case of purely textured bearing, the behavior of maximum pressure (see Figure 10) is slightly different with that of he load support (see Figure 11), especially for the case when an θG of 0–120° or larger is applied, the simulation results of hydrodynamic pressure by varying the texturing zones is given in Figure 12 for the case of D/hmin = 0.5. It can be seen that even though there is a variation of the value of the maximum pressure with increasing θG, at the same time, in the divergent region, the texturing of the bearing surface with larger θG is able to reduce the cavitation region. It seems that the bearing with an θG of 0–180° has the smallest length of the cavitation region. Additionally, the pressure perturbation around the location peak pressure is observed, leading to a higher-pressure gradient. These coupling actions lead to an enhanced load support for the bearings with larger θG. This pressure behavior also prevails for other cases (i.e., D/hmin of 1.0 and 1.5) as reflected in Figure 13. Generally speaking, in order to achieve the optimal bearing performance of the load support, covering the convergent zone with surface texturing, in particular with a low texture depth, is the best choice in the case of a low loaded bearing.
Additionally, to strengthen the possible reasons why combining the slip boundary on the texturing zone leads to better hydrodynamic lubrication performance in comparison with pure texturing, in particular in the case of a low eccentricity ratio, it is necessary to investigate the velocity vector inside the dimple. Figure 14 and Figure 15 give a comparison of the velocity vector inside the dimple between the case of the purely textured pattern and the slip-textured one, respectively, for the first dimple (i.e., the beginning of texturing) and the last dimple (i.e., the end of texturing) for the bearing pattern with D/hmin = 0.5 and the θG = 0–180°.
It can be observed based on Figure 14 that introducing texturing with or without the slip boundary leads to a unique flow characteristic in the dimple, in particular the first dimple; that is, the recirculation zone in the dimple. In the case in which the slip is applied on the texture edges, the disturbance in the flow can be observed more obviously inside the dimple. The slip boundary, as mentioned earlier, accelerates the lubricant movement by generating the vortex generation inside and around the dimple. The same acceleration of the lubricant induced by the slip boundary can also be highlighted inside the dimple located at the end edge of the textured zone. This trend is clearly observed in Figure 15. As is also shown in Figure 9a, no backflow that occurs inside the dimple. For the purely textured pattern or slip-textured pattern, the flow behavior inside and around the dimple is similar; the difference only lies on the magnitude of the flow velocities. Again, based on the physical point of view, the fact that the slip boundary expands the velocity gradient inside the dimples along the textured surface in which the slip is applied may become the main contribution of the tribological performance enhancement.

4.3.2. At Medium and Heavy Loaded Bearings

To justify the conclusion dealing with the effect of the combined slip with texturing in the case of the light loaded bearing, tribological analysis of medium and heavy loaded textured journal bearings was also performed. For this, the eccentricity ratio, ε, was changed to 0.5 and 0.8, respectively, while other input parameters for these computations were the same as ones applied for low loaded bearing analysis. Figure 16 and Figure 17 provide the results of the maximum pressure, Pmax, for the textured bearing with and without slip under medium loading (i.e., ε = 0.5) and heavy loading (i.e., ε = 0.8) conditions, respectively. Two specific features can be underlined based on these figures.
Firstly, in the case of the purely textured bearing, it can be observed that for the medium loading bearing studied here, the extension of the texturing zone, θG, of the contact has a similar effect with that for the heavy loaded bearing in terms of the maximum pressure prediction. Extending the θG results in the decrease-then-increase behavior of the maximum pressure. This trend seems to be very clear in the case of the heavy loaded bearing. For the medium loaded bearing, the decrease in Pmax occurs when the highest θG is used (θG = 0–180° in this case). In other words, there is a shift of the position of maximum pressure. Comparing Figure 10, Figure 16 and Figure 17, it seems that the highest Pmax tends to shift towards the case with a larger texturing zone, θG, with increasing the eccentricity ratio. For example, based on the simulation results, it is shown that the highest Pmax occurs at the case with θG = 0–120°, θG = 0–150°, and θG = 0–180°, respectively, for case of ε = 0.2, ε = 0.5, and ε = 0.8.
Secondly, in the case of the slip-textured configuration, either for ε = 0.5 or ε = 0.8, the maximum pressure profile has a “decrease-then-increase” trend when increasing the length of the texturing zone. It seems that the greater decrease in Pmax becomes severe when increasing the eccentricity ratio. Based on the physical point of view, it indicates that the eccentricity ratio diminishes the positive effect of the slip boundary in terms of maximum pressure. On the other words, introducing slip on the textured surface for a relatively high eccentricity ratio can be a harmful approach if the length of the texturing zone is incorrectly chosen.
To enhance the tribological performance of lubricated pairs, the increment in the load support of lubricant is looked at as a standard by tribological researchers. Therefore, the load support trend as a function of the length of the texturing zone for the case of ε = 0.5 and 0.8 is shown in Figure 18 and Figure 19, respectively. It can be observed that in comparison with the smooth (untextured) bearing, the application of texturing provides a lower load support irrespective of the texture depth. Similar to the profile of Pmax, the “decrease-then-increase” behavior of the load support is also noticed both for ε = 0.5 and 0.8. The highest load support is found only for the textured bearing with the lowest texture depth (i.e., D/hmin = 0.5) and highest texturing zone (i.e., θG = 180°). For such a bearing, the enhancement of the load support is not so high compared to the smooth (untextured) bearing; it is just up to 9% and 6%, respectively, for the case of ε = 0.5 and 0.8. For other textured patterns, the deterioration of the load support is highlighted irrespective of the D/hmin and the θG as can also be seen from Figure 19 for the case of ε = 0.8. This finding is completely different depending on the lowest eccentricity ratio used as illustrated in Figure 11. The combined positive effect of texturing and slip on the load support is clearly seen for the low eccentricity ratio irrespective of the length of the texturing zone and texture depth. These results are comparable with other studies, for example, [33,38], pointing out the superiority of the parallel gap either in the case of the slip smooth (untextured) journal bearing [33,38] or the (textured) slider bearing [25] in terms of load support.

4.4. Effect of Eccentricity Ratio

Finally, it is necessary to investigate the effect of the eccentricity ratio on the tribological performance. The textured bearing with θG = 0–180° and D/hmin = 0.5 was chosen in this analysis with respect to the enhancement of the maximum load support as discussed in the previous section. Figure 20 shows the maximum pressure as a function of the eccentricity ratio for various surface conditions, i.e., smooth (untextured) bearing, purely textured bearing, and slip-textured bearing. As expected, based on Figure 20, in general, increasing the eccentricity ratio will increase the prediction of the maximum pressure for all surface conditions. This result may be explained by the fact that based on the physical point of view, the journal bearing with a high eccentricity ratio, ε, produces more hydrodynamic action in the converging and diverging wedge compared to that with a low eccentricity ratio. It is also evident from Figure 20 that compared to the smooth pattern, the slip promotion on the textured zone is able to increase the maximum pressure up to 150% for low ε. However, when the eccentricity ratio is changed to a high value, i.e., ε = 0.8, the increase in maximum pressure drops only up to 17%. For the purely textured bearing, the deterioration of the maximum pressure induced by texturing is noticed with an increasing eccentricity ratio. It seems that the existence of texturing weakens the positive effect of the eccentricity ratio.
In order to further explore the effect of the existence of the fluid–solid interface slip, for the following computations, the predicted load support will be evaluated for all surface conditions. In Figure 21, the effect of the eccentricity ratio on the load support performance of bearings is presented. For the case of the textured bearing, the pattern of texturing with θG = 0–180° and D/hmin = 0.5 is of particular interest. It can be observed that for each case studied here, the load support is strongly affected by the eccentricity ratio. For the smooth (untextured) bearing, by increasing the eccentricity ratio, the load support increases from 2 kN/m at ε = 0.2 to 22 kN/m at ε = 0.5, and subsequently increases to 59 kN/m at ε = 0.8. A similar behavior is also observed for the case of the purely textured bearing. It should be noted that based on Figure 21, for the low loaded bearing, the application of texturing with the optimal choice of the texturing zone and dimple depth provides a larger enhancement of load support up to 200%. Additionally, a 1200% improvement of the load support is achieved when the slip is combined with a textured surface. Interesting findings are noticed for the cases with a higher eccentricity ratio. For example, in the case of ε = 0.5, texturing with or without slip is not able to provide additional load support. In fact, at ε = 0.8, deterioration of the load support for the slip-textured pattern is in the order of 16% in comparison with the smooth bearing. The decrease in the predicted load support at a large eccentricity ratio as highlighted in this work is directly comparable with other numerical studies demonstrated by Cupillard et al. [13] in the case of the purely textured bearing and Fatu et al. [23] in the case of the slip-textured bearing. According to the work of Cupillard et al. [13], at large eccentricity ratios (i.e., larger than the critical eccentricity ratio of 0.25), the introduction of texturing is no longer able to improve the load support, but on the contrary, texturing reduces it. The load support generated by the textured case is lower than that produced by the smooth pattern at higher eccentricity ratios. Their result matches well with the finding presented in this study (Figure 21). When the surface texturing was combined with the slip effect, in a specific well-chosen pattern, a similar trend was also observed for high eccentricity (high load configuration), i.e., the decreased load support as discussed in [23]. Generally speaking, it seems that a specific well-chosen design of the texturing zone with/without slip as well as the texture depth of the textured journal bearing for one operating condition (i.e., eccentricity ratio) is not necessarily superior to another condition. Therefore, for future work, a range of eccentricities, where an increase of the load support is observed by using the optimal design of texturing parameters proposed here, should be explored in more detail.
The question arises “why does the texturing with or without slip exhibit the reduced hydrodynamic performance at higher eccentricity ratios (in this case, ε = 0.5 and 0.8)?”. The velocity vector as shown in Figure 22 and Figure 23, respectively, for the case of pure texturing and slip texturing, may give us a further understanding of these phenomena. Based on Figure 22, it can be revealed that the presence of backflow becomes evident for the case with higher eccentricity ratios. Backflow in the leading edge of the contact occurs because not all of the fluid can flow through the small gap, and only a small amount gets dragged into the diverging area. Consequently, the hydrodynamic action becomes weak. It can also be observed that the magnitude of this backflow is changed along the textured contact. For all values of ε, at the end edge of the textured zone, the backflow goes off and slip velocity occurs. The observations are similar for the case of the slip-textured bearing. In fact, due to the slip velocity induced by the slip boundary on the textured zone, the backflow becomes larger compared to the purely textured pattern for the same eccentricity ratio, especially at the inlet area. These phenomena may be the reason why the slip-textured bearing for higher ε gives a lower load support compared to that for low ε. As seen in Figure 22 and Figure 23, no backflow occurs for the case of a low eccentricity ratio along the textured zone. Additionally, as shown in Figure 23, in the presence of the slip boundary, the velocities at the interface between the stationary wall and lubricant become larger due to the higher velocity gradient.

5. Conclusions

In the present work, the combined effect of a textured surface and behavior of the slip condition on the performance of a journal bearing was studied. A comparative study between a textured surface, slip-textured surface, and smooth (untextured) surface of journal bearing configurations was investigated. The mass-conserving multiphase cavitation model revising the traditional single-phase model was used through a large number of CFD simulations. On the basis of the numerically simulated results calculated in the present work, the following conclusions are drawn:
  • The numerical analyses revealed that the (partial) texturing on the bearing surface is controversial because in certain eccentricity, it could enhance the load support of the journal bearing, but in others it could decrease the performance. There is also potential to employ the textured surface in order to determine the length of the texturing zone and texture depth that will be optimal for a specific operation.
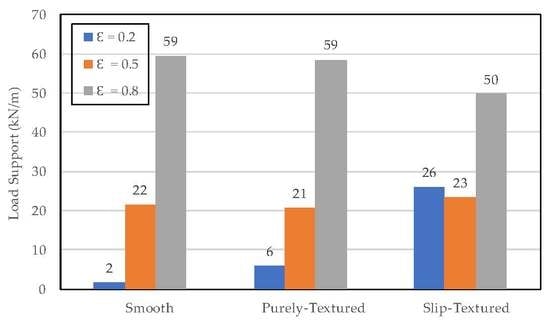
  • In the case of a low eccentricity ratio, an appropriate length of the texturing zone as well as the texture depth enhances the load support significantly compared to the smooth one. When the texturing zone is created on the whole of the convergent zone and a low texture depth is used, the highest performance of the load support can be achieved. Another interest finding is that the positive effect of partial texturing becomes much more significant in enhancing the load support when the slip condition is combined with the textured surface. The simulation results show that the slip-textured pattern is superior to the other patterns (i.e., smooth bearing and purely textured bearing) with respect to the load support.
  • In the case of a medium eccentricity ratio, promoting the texturing as well as the slip boundary gives a similar performance to the smooth (untextured) bearing even when the optimal texturing parameters (i.e., texture depth and length of texturing zone) are used.
  • In the case of a high eccentricity ratio, (partial) texturing leads to a reduction in load support irrespective of the texture depth and texturing arrangement in comparison to the smooth (untextured) bearing. This negative effect becomes more severe when the slip condition is applied on the textured zone.
In general, based on the findings of the present work, the application of surface texturing as well as a (super)hydrophobic coating that induces the slip boundary in specific patterns was proven to increase the tribological performance of hydrodynamic bearings of powertrain components. For future work, in order to explore the potential application of combined slip and texturing in more detail, research will be dedicated to an exploration of the tribological performance in terms of friction.

Author Contributions

Conceptualization, M.T. and M.M.; Data curation, H.M.F.; Funding acquisition, J.J.; Project administration, M.M.; Software, H.M.F.; Supervision, J.J.; Validation, B.S.W.; Visualization, B.S.W.; Writing—review & editing, M.T.

Funding

This research is fully funded by RPI-BT (Research Publication International-High Reputation) Grant, No. 387-05/UN7.P4.3/PP/2018.

Acknowledgments

The authors fully acknowledged Institute for Research and Community Services (LPPM), Diponegoro University for the approved fund which makes this important research viable and effective.

Conflicts of Interest

The authors declare no conflict of interest.

Nomenclature

bSlip length[µm]
cRadial clearance[mm]
DDimple depth[m]
D/hminRatio of dimple depth over minimal film thickness[–]
FevapEvaporation coefficient[–]
FcondCondensation coefficient[–]
hFilm thickness[m]
hminMinimum film thickness[m]
hmaxMaximum film thickness[m]
hp,maxMaximum film thickness including dimple depth [m]
LCircumferential length [m]
pHydrodynamic pressure[kPa]
pvVapor pressure[Pa]
PinInlet pressure[Pa]
PoutOutlet pressure[Pa]
PsatSaturated pressure[Pa]
PmaxMaximum pressure[kPa]
rShaft radius[mm]
RBearing radius[mm]
RBBubble radius[m]
STTexture density[–]
USliding velocity[m/s]
UsSlip velocity[m/s]
WLoad support[kN/m]
WcellLength of texture cell[°]
WlandLength of texture valley (i.e., Wcell - WG)[°]
WGDimple length[°]
αnucNucleation site volume fraction[–]
αvVapor volume fraction[–]
θ Circumferential angle[°]
θ G Length of texturing zone[°]
εEccentricity ratio [–]
µLubricant viscosity[Pa·s]
µvVapor viscosity[Pa·s]
ρLubricant density[kg/m3]
ρvVapor density[kg/m3]
τLocal shear stress[Pa]
τcrCritical shear stress[Pa]
ϕAttitude angle[°]
ωRotational speed[rad/s]

References

  1. Hamilton, D.B.; Walowit, J.A.; Allen, C.M. A theory of lubrication by microirregularities. J. Basic Eng. 1966, 88, 177–185. [Google Scholar] [CrossRef]
  2. Morris, N.J.; Shahmohamadi, H.; Rahmani, R.; Rahnejat, H.; Garner, C.P. Combined experimental and multiphase computational fluid dynamics analysis of surface textured journal bearings in mixed regime of lubrication. Lubr. Sci. 2018, 30, 161–173. [Google Scholar] [CrossRef] [Green Version]
  3. Vlădescu, S.C.; Fowell, M.; Mattsson, L.; Reddyhoff, T. The effects of laser surface texture applied to internal combustion engine journal bearing shells–An experimental study. Tribol. Int. 2019, 134, 317–327. [Google Scholar] [CrossRef]
  4. Galda, L.; Sep, J.; Olszewski, A.; Zochowski, T. Experimental investigation into surface texture effect on journal bearings performance. Tribol. Int. 2019, 136, 372–384. [Google Scholar] [CrossRef]
  5. Rahmani, R.; Mirzaee, I.; Shirvani, A.; Shirvani, H. An analytical approach for analysis and optimisation of slider bearings with infinite width parallel textures. Tribol. Int. 2010, 43, 1551–1565. [Google Scholar] [CrossRef] [Green Version]
  6. Rahmani, R.; Rahnejat, H. Enhanced performance of optimized partially textured load bearing surfaces. Tribol. Int. 2018, 117, 272–282. [Google Scholar] [CrossRef]
  7. Tala-Ighil, N.; Fillon, M.; Maspeyrot, P. Effect of textured area on the performances of a hydrodynamic journal bearing. Tribol. Int. 2011, l44, 211–219. [Google Scholar] [CrossRef]
  8. Khatri, C.B.; Sharma, S.C. Influence of textured surface on the performance of non-recessed hybrid journal bearing operating with non-Newtonian lubricant. Tribol. Int. 2016, 95, 221–235. [Google Scholar] [CrossRef]
  9. Shinde, A.; Pawar, P.M. Multi-objective optimization of surface textured journal bearing by Taguchi based Grey relational analysis. Tribol. Int. 2017, 114, 349–357. [Google Scholar] [CrossRef]
  10. Sahlin, F.; Glavatskih, S.B.; Almqvist, T.; Larsson, R. Two-dimensional CFD-analysis of micro-patterned surfaces in hydrodynamic lubrication. ASME J. Tribol. 2005, 127, 96–102. [Google Scholar] [CrossRef]
  11. Caramia, G.; Carbone, G.; De Palma, P. Hydrodynamic lubrication of micro-textured surfaces: Two dimensional CFD-analysis. Tribol. Int. 2015, 88, 162–169. [Google Scholar] [CrossRef]
  12. Vilhena, L.; Sedlacek, M.; Podgornik, B.; Rek, Z.; Žun, I. CFD Modeling of the effect of different surface texturing geometries on the frictional behavior. Luricant 2018, 6, 15. [Google Scholar] [CrossRef]
  13. Cupillard, S.; Glavatskih, S.; Cervantes, M.J. Computational fluid dynamics analysis of a journal bearing with surface texturing. Proc. Ins. Mech. Eng. Part J. J. Eng. Tribol. 2008, 222, 97–107. [Google Scholar] [CrossRef]
  14. Mao, Y.; Zeng, L.; Lu, Y. Modeling and optimization of cavitation on a textured cylinder surface coupled with the wedge effect. Tribol. Int. 2016, 104, 212–224. [Google Scholar] [CrossRef]
  15. Lin, Q.; Bao, Q.; Li, K.; Khonsari, M.M.; Zhao, H. An Investigation into the transient behavior of journal bearing with surface texture based on fluid-structure interaction approach. Tribol. Int. 2018, 118, 246–255. [Google Scholar] [CrossRef]
  16. Fortier, A.E.; Salant, R.F. Numerical analysis of a journal bearing with a heterogeneous slip/no-slip surface. ASME J. Tribol. 2005, 127, 820–825. [Google Scholar] [CrossRef]
  17. Ma, G.J.; Wu, C.W.; Zhou, P. Wall slip and hydrodynamics of two-dimensional journal bearing. Tribol. Int. 2007, 40, 1056–1066. [Google Scholar] [CrossRef]
  18. Wang, L.L.; Lu, C.H.; Wang, M.; Fu, W.X. The numerical analysis of the radial sleeve bearing with combined surface slip. Tribol. Int. 2012, 47, 100–104. [Google Scholar] [CrossRef]
  19. Lin, Q.Y.; Wei, Z.Y.; Zhang, Y.B.; Wang, N. Effects of the slip surface on the tribological performances of high-speed hybrid journal bearings. Proc. Ins. Mech. Eng. Part J J. Eng. Tribol. 2016, 230, 1149–1156. [Google Scholar] [CrossRef]
  20. Kalavathi, G.K.; Dinesh, P.A.; Gururajan, K. Influence of roughness on porous finite journal bearing with heterogeneous slip/no-slip surface. Tribol. Int. 2016, 102, 174–181. [Google Scholar] [CrossRef]
  21. Rao, T.V.V.L.N.; Rani, A.M.A.; Awang, M.; Hashim, F.M. Stability evaluation of three-layered journal bearing with slip/partial slip. Ind. Lubr. Tribol. 2017, 69, 334–341. [Google Scholar] [CrossRef]
  22. Zhu, B.; Li, Y.P.; Wang, W.G.; Lei, M.K. Boundary slippage modeling and optimization of hydrophobic tilting pad. Tribol. Int. 2019, 136, 299–316. [Google Scholar] [CrossRef]
  23. Aurelian, F.; Patrick, M.; Mohamed, H. Wall slip effects in (elasto) hydrodynamic journal bearings. Tribol. Int. 2011, 44, 868–877. [Google Scholar] [CrossRef]
  24. Tauviqirrahman, M.; Ismail, R.; Jamari, J.; Schipper, D.J. A study of surface texturing and boundary slip on improving the load support of lubricated parallel sliding contacts. Acta Mech. 2013, 224, 365–381. [Google Scholar] [CrossRef]
  25. Tauviqirrahman, M.; Ismail, R.; Jamari, J.; Schipper, D.J. Combined effect of texturing and boundary slippage in lubricated sliding contacts. Tribol. Int. 2013, 66, 274–281. [Google Scholar] [CrossRef] [Green Version]
  26. Ismail, S.; Sarangi, M. Effects of texture shape and fluid-solid interfacial slip on the hydrodynamic lubrication performance of parallel sliding contacts. Proc. Ins. Mech. Eng. Part J J. Eng. Tribol. 2014, 228, 382–396. [Google Scholar] [CrossRef]
  27. Lin, Q.; Wei, Z.; Wang, N.; Chen, W. Effect of large-area texture/slip surface on journal bearing considering cavitation. Ind. Lubr. Tribol. 2015, 67, 216–226. [Google Scholar] [CrossRef]
  28. Li, J.; Chen, H. Evaluation on applicability of Reynolds equation for squared transverse roughness compared to CFD. J. Tribol. 2007, 129, 963–967. [Google Scholar] [CrossRef]
  29. Dobrica, M.B.; Fillon, M. About the validity of Reynolds equation and inertia effects in textured sliders of infinite width. Proc. Ins. Mech. Eng. Part J J. Eng. Tribol. 2009, 223, 69–78. [Google Scholar] [CrossRef]
  30. Song, Z.; Guo, F.; Liu, Y.; Hu, S.; Liu, X.; Wang, Y. Investigation of slip/no-slip surface for two-dimensional large tilting pad thrust bearing. Ind. Lubr. Tribol. 2017, 69, 995–1004. [Google Scholar] [CrossRef]
  31. ANSYS. ANSYS Fluent, Version 16.0: User manual; ANSYS, Inc.: Canonsburg, PA, USA, 2017. [Google Scholar]
  32. Spikes, H.A. The half-wetted bearing: Part 1: Extended Reynolds equation. Proc. Ins. Mech. Eng. Part J J. Eng. Tribol. 2003, 217, 1–14. [Google Scholar] [CrossRef]
  33. Wu, C.W.; Ma, G.J.; Zhou, P. Low friction and high load support capacity of slider bearing with a mixed slip surface. ASME J. Tribol. 2006, 128, 904–907. [Google Scholar] [CrossRef]
  34. Choo, J.H.; Glovnea, R.P.; Forrest, A.K.; Spikes, H.A. A low friction bearing based on liquid slip at the wall. ASME J. Tribol. 2007, 129, 611–620. [Google Scholar] [CrossRef]
  35. Zwart, P.; Gerber, A.G.; Belamri, T. A two-phase flow model for predicting cavitation dynamic. In Proceedings of the fifth international conference on multiphase flow, Yoko-hama, Japan, 30 May 2004. [Google Scholar]
  36. Hamrock, B.J.; Schmid, S.R.; Jacobson, B.O. Fundamentals of Fluid Film Lubrication (Dekker Mechanical Engineering), 2nd ed.; CRC Press: Boca Raton, FL, USA, 2004. [Google Scholar]
  37. Hori, Y. Hydrodynamic Lubrication; Springer: Tokyo, Japan, 2006. [Google Scholar]
  38. Wu, C. Performance of hydrodynamic lubrication journal bearing with a slippage surface. Ind. Lub. Tribol. 2008, 60, 293–298. [Google Scholar] [CrossRef]
Figure 1. Schematic representation of (a) smooth (untextured) journal bearing geometry and (b) textured journal bearing geometry.
Lubricants 07 00097 g001
Figure 2. Schematic representation of the film thickness profile for textured journal bearing. Note: D is the dimple depth, WG is the dimple length, Wcell is the length of the texture cell, Wland is the length of the texture valley (i.e., WcellWG), hmin is the minimum film thickness, hmax = maximum film thickness, hp,max = maximum film thickness including dimple depth (i.e., hmax + D), L is the circumferential length, U is the sliding velocity, θ G is the length of the texturing zone. (Inset: Elementary texture cell).
Lubricants 07 00097 g002
Figure 3. (a) Computational domain of the textured bearing; (b) mesh division in detail.
Lubricants 07 00097 g003
Figure 4. Boundary condition used in the computations.
Lubricants 07 00097 g004
Figure 5. Comparison between hydrodynamic pressures of journal bearings obtained by the present work and by Cupillard et al. [13].
Lubricants 07 00097 g005
Figure 6. The comparison of hydrodynamic pressure profile between the simulation results by the present study and that by Wu [38]. All results were evaluated at at ε = 0.8.
Lubricants 07 00097 g006
Figure 7. Hydrodynamic pressure profiles of the purely textured bearing at different texturing zones for the case: (a) D/hmin = 0.5, (b) D/hmin = 1, (c) D/hmin = 1.5. All results are evaluated at ε = 0.5.
Lubricants 07 00097 g007aLubricants 07 00097 g007b
Figure 8. Hydrodynamic pressure profiles of slip-textured bearing at different texture positions for the case: (a) D/hmin = 0.5, (b) D/hmin = 1, (c) D/hmin = 1.5. All results are evaluated at ε = 0.5.
Lubricants 07 00097 g008aLubricants 07 00097 g008b
Figure 9. Slip velocity profile along the bearing surface for the case: (a) D/hmin = 0.5, (b) D/hmin = 1, (c) D/hmin = 1.5. All results were evaluated at ε = 0.5 and the θG is 0–180°.
Lubricants 07 00097 g009aLubricants 07 00097 g009b
Figure 10. Effect of the length of the texturing zone on the predicted maximum pressure by varying the texture depths (D/hmin) for the case of ε = 0.2.
Lubricants 07 00097 g010
Figure 11. Effect of the length of the texturing zone on the load support by varying the texture depths (D/hmin) for the case of ε = 0.2.
Lubricants 07 00097 g011
Figure 12. Hydrodynamic pressure as a function of the length of the texturing zone (D/hmin = 0.5 and ε = 0.2).
Lubricants 07 00097 g012
Figure 13. Hydrodynamic pressure as a function of the length of the texturing zone (ε = 0.2) in the case of (a) D/hmin = 1.0, (b) D/hmin = 1.5.
Lubricants 07 00097 g013aLubricants 07 00097 g013b
Figure 14. Velocity profile inside the first dimple (i.e., the beginning of the texturing zone) for the case of (a) the purely textured pattern and (b) slip-textured bearing. All results were evaluated at ε = 0.5, D/hmin = 0.5, and θG = 0–180°.
Lubricants 07 00097 g014
Figure 15. Velocity profile inside the last dimple (i.e., the end of texturing zone) for the case of (a) the purely textured pattern and (b) slip-textured bearing. All results are evaluated at ε = 0.5, D/hmin = 0.5, and θG = 0–180°.
Lubricants 07 00097 g015
Figure 16. Effect of the length of the texturing zone on the predicted maximum pressure by varying the texture depths (D/hmin) for the case of the medium loaded bearing (ε = 0.5).
Lubricants 07 00097 g016
Figure 17. Effect of the length of the texturing zone on the predicted maximum pressure by varying the texture depths (D/hmin) for the case of the heavy loaded bearing (ε = 0.8).
Lubricants 07 00097 g017
Figure 18. Effect of the length of the texturing zone on the load support by varying the texture depths (D/hmin) for the case of ε = 0.5.
Lubricants 07 00097 g018
Figure 19. Effect of the texturing zone on the load carrying capacity by varying the texture depths (D/hmin) for the case of ε = 0.8.
Lubricants 07 00097 g019
Figure 20. Effect of the eccentricity ratio on the maximum pressure for various surface conditions. The textured bearing with or without slip is evaluated at θG = 0–180° and D/hmin = 0.5.
Lubricants 07 00097 g020
Figure 21. Effect of the eccentricity ratio, ε, on the load support for various surface conditions. The textured bearing with or without slip was evaluated at θG = 0–180° and D/hmin = 0.5.
Lubricants 07 00097 g021
Figure 22. Velocity vector along textured zone of the purely textured zone for (a) ε = 0.2, (b) ε = 0.5 and (c) ε = 0.8. All results are evaluated at θG = 180° and D/hmin = 0.5.
Lubricants 07 00097 g022aLubricants 07 00097 g022b
Figure 23. Velocity vector along the textured zone of the slip-textured zone for (a) ε = 0.2, (b) ε = 0.5, and (c) ε = 0.8. All results were evaluated at θG = 0–180° and D/hmin = 0.5.
Lubricants 07 00097 g023
Table 1. Parameters of the model.
ParametersValueUnit
Bearing
Shaft radius, r50mm
Radial clearance, c0.145mm
Eccentricity ratio, Ɛ0.2; 0.5; 0.8-
Rotational speed, ω48.1rad/s
Texture
Dimple length, WG5 °
Length of texture cell, Wcell10 °
Texture density, ST0.5-
Ratio of texture depth over minimum film thickness, D/hmin0.5; 1.0; 1.5-
Length of texturing zone, θ G 0–30; 0–60; 0–90; 0–120; 0–150; 0–180 °
Lubricant and Vapor
Lubricant viscosity, µ0.0127 Pa·s
Vapor viscosity, µv2 × 10−5Pa·s
Lubricant density, ρ840 kg/m3
Vapor density, ρv1.2 kg/m3
Saturated pressure, Psat20,000 Pa
Fluid–Solid Interface
Critical shear stress, τcr0Pa
Slip length, b100µm

