Article

Oxidative Damage of a Superalloy in High-Loaded Contacts

by
Matthias Senge
1,*,†,
John Steger
2,†,
Adrian Rienäcker
1 and
Angelika Brückner-Foit
2
1
Institute for Powertrain and Vehicle Engineering Machine Elements and Tribology, University of Kassel, 34125 Kassel, Germany
2
Institute for Materials Engineering Quality and Reliability, University of Kassel, 34125 Kassel, Germany
*
Author to whom correspondence should be addressed.
These authors contributed equally to this work.
Lubricants 2020, 8(1), 4; https://doi.org/10.3390/lubricants8010004
Submission received: 31 October 2019 / Revised: 29 November 2019 / Accepted: 11 December 2019 / Published: 20 December 2019
(This article belongs to the Special Issue Selected Papers from the 60th German Tribology Conference 2019)

Abstract

:
When used as a turbine material, dry contacts of nickel-based superalloy experience stresses via pressure and temperature. As a result, there is a change in material in the form of oxide layer formation and a depletion of alloying elements (e.g., Al) in the base material. The resulting layers have different material properties compared to the base material, which affect the mechanical and contact behavior. Adhesion, friction and wear are among the effects that are of interest. In addition, the operating experience has shown that the contact pressure has a yet unclarified impact on the progression rate of the damage process (oxidation). This paper deals with the development of models that contribute to the understanding of the damage scenario and its prediction. We will see that the changed material properies in the oxid layer lead to high-stress peaks at the interface between the layers. This is the expected location were the accelerated damage occures.

Graphical Abstract

1. Introduction

Materials in the area of low-pressure turbines, which are used as blade material, are exposed to high temperatures during operation, as well as a corrosive atmospheres (due to exhaust gasses). In addition, the blades are preloaded to dampen the vibration behavior and to ensure a constant flow. The resulting contact points thus lead to an additional mechanical load (see Figure 1).
During operation, signs of wear result from the previously mentioned loads. These include the oxidation of the material and the resulting oxide-scales with changed material characteristics. Of further interest is the field of stress in these layers, which changes over time as a result of layer growth. Due to this damage the plasticaly deformed layers themself become more vulnerable for the corrosion attack. Further acceleration of the wear is the outcome of this process.
In the context of this publication, models will be discussed, which can describe the temporal course of layer growth as well as the characterization of the field of stress in the emerging layers. For this purpose, two model theories are used. Decisive for the modeling is to map both, the parabolic nature of the oxidation and the material behavior in the contacting points of the resulting thin films. Wagner deals with the oxidation of alloys as well as modeling with analytical solutions [1,2,3], while Javierre et al. discusses the mathematical solution [4,5]. The basis for solving the contact problem in this work is described by Polonsky et al. [6]. The strategy of this study was to determine the contact pressure by application of the conjugated gradient method (CG). The necessary influence matrices for the multilayer-case were developed based on the work of Cai and Chen [7,8]. These approaches can be summarized as a “semi-analytical method” (SAM). The advantage of the SAM over other methods like the FEM is the high computational efficiency while providing an high resolution of the contact point. This is a mandatory requirement when simulating thin layers.

2. Results

In this section, the necessary equations and the results of the models are discussed. All presented methods were programmed from the ground as Matlab routines. No additional software is used for the computation of the results.

2.1. Diffusion Model

The oxidation of alloys differs from pure metals in the varying affinity of individual alloying elements to oxygen. As a result, a layer depleted of alloying elements forms between the oxide layer and the intact base material [1].
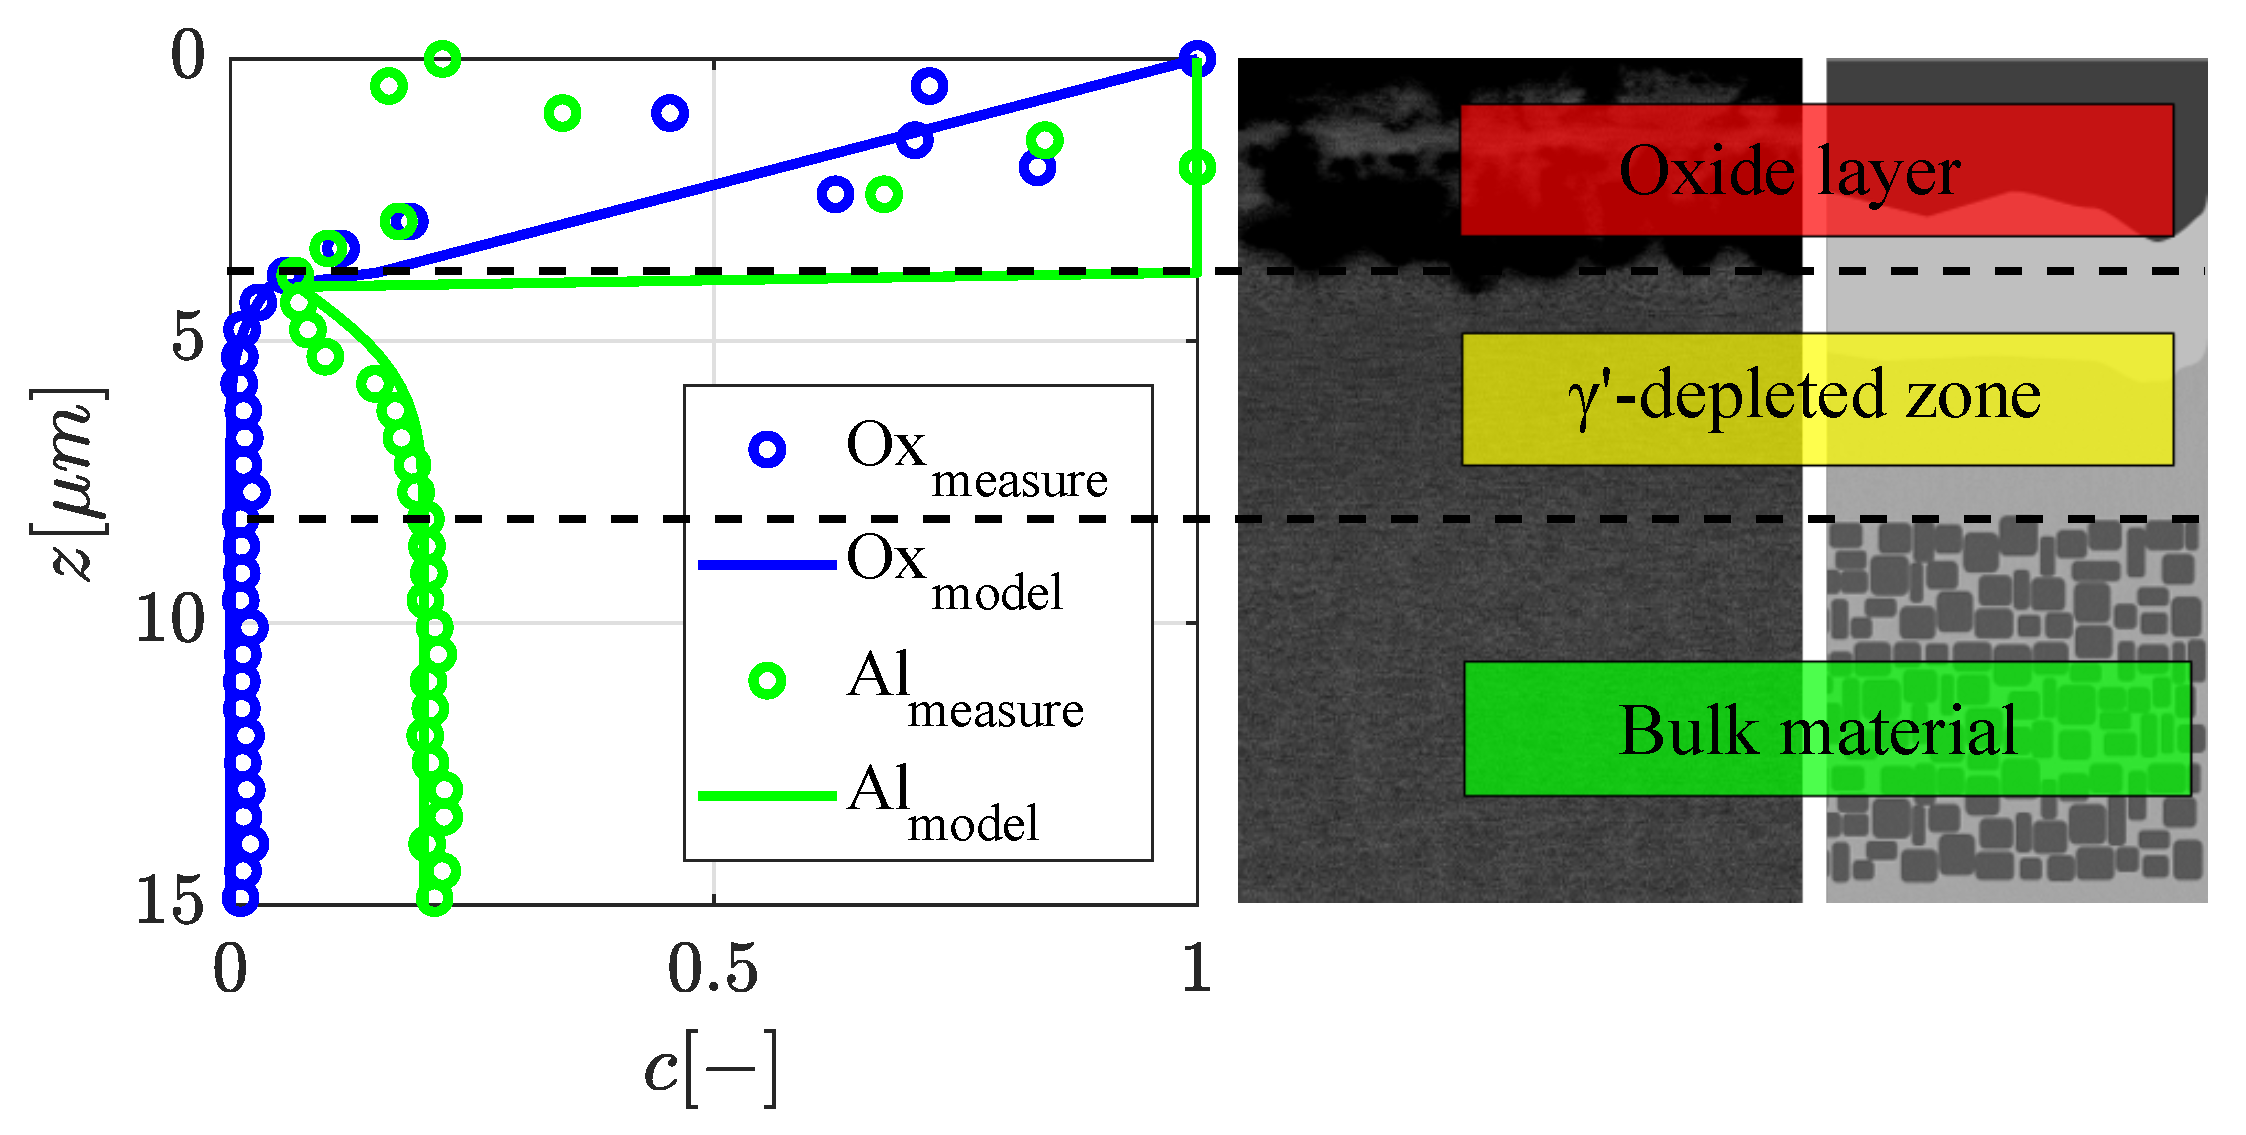
Figure 2 shows quantified oxygen and aluminum data of a γ -hardened nickel alloy. The data is gathered via automated energy dispersive X-ray spectroscopy from cross sections of oxidized samples. Sequential analyses make it possible to quantify layer growth and composition. Which in turn allows to estimate the behavior of the assessed oxide. An in depth description of the applied method can be found in [9]. Depending on the local alloy composition the growth of the oxide layer may be described by Equation (1).
c x , t = c 0 + c r c 0 · x / s t ; 0 < x < s t c x , t = c r c · e r f c x s t / 2 · D · t ; s t > x
Here, β is the temperature-dependent growth coefficient, while the layer thickness can be tracked in the time domain
s t , T = β c , T · t .
Furthermore, β depends on the concentration of the oxygen bound in the oxide and on the alloying elements (e.g., Al) [4]. The nonlineare equation
D s o l π · c s o l e r f c β D s o l · exp β 2 D s o l + D l i q π · c l i q 1 e r f c β D l i q · exp β 2 D l i q = β · c * ,
for the variable β is determined by means of the Newton-Raphson method. To determine its parameters, the model is adapted to the measured data using inverse techniques (see Figure 2). The measurement shows that the oxygen accumulates within the oxide layer. Below the oxide, there is a layer depleted of alloying elements (e.g., aluminum), which is characterized by a decreasing concentration gradient. It is easy to see that the model and the measurement match well and describe the course of the damage accurately. The plastic deformation of the depleted layers increases the diffusion rate D of the alloying elements. In the next section, the model approach for this case will be discussed.

2.2. Contact Model

The basic concept for the determination of the contact stress is the solution of the differential equation for the elastic half space in the frequency domain. For a body with k layers the displacements in normal direction can be described by
u ˜ ξ ξ ( k ) = 1 2 G k i ξ φ ˜ ( k ) + z k ψ 3 ˜ ( k ) + ψ 1 ˜ ( k ) + ξ ψ 1 ˜ ( k ) ξ ( 3 4 ν k ) ψ 1 ˜ ( k ) u ˜ η η ( k ) = 1 2 G k i η φ ˜ ( k ) + z k ψ 3 ˜ ( k ) + η ψ 1 ˜ ( k ) ξ u ˜ z z ( k ) = 1 2 G k φ ˜ ( k ) z k + i 2 ψ 1 ˜ ( k ) z k ξ + z k ψ 3 ˜ ( k ) z k ( 3 4 ν k ) ψ 3 ˜ ( k ) .
For clarity the formulations for the stresses inside the volume and the coupling conditions according to Cai et al. [7] are given in the Appendix A. Additionally, the following normal force boundary conditions
σ x z ( k ) ( x , y , 0 ) = 0 σ y z ( k ) ( x , y , 0 ) = 0 σ z z ( k ) ( x , y , 0 ) = p ( x , y , 0 ) ,
are enforced at the surface ( z = 0 ). Combining the upper expressions with the potential functions
φ ˜ ( k ) = A 1 ( k ) e α z + A 2 ( k ) e α z ψ 1 ˜ ( k ) = B 1 ( k ) e α z + B 2 ( k ) e α z ψ 3 ˜ ( k ) = D 1 ( k ) e α z + D 2 ( k ) e α z
in the frequency domain, leads to a system of linear equations
M · a = p
a = A 1 1 * ; A 2 1 * ; B 1 1 * ; B 2 1 * ; D 1 1 * ; D 2 1 * ; A 1 1 * ; B 1 1 * ; D 1 1 * T ,
with α = ξ 2 + η 2 . Solving Equation (8) with the standard solution process and applying inverse Fourier transformation, the influence coefficient matrices Equation (9) can be formed. These coefficients
σ j u j = l = 1 M C l j σ n · p l l = 1 M C l j u · p l = l = 1 M C l j · p l ,
describe the effects of a point load on the body, as well as the relationship between applied pressure and stress in a layered solid. The influence coefficient Matrix C l j * provides a relationship between the contact pressure p l and the shifts u j , as well as the stresses σ j in the material, depending on the material properties and layer thicknesses [7,10]. By superposition of the solution and the CG method, the contact situation for any geometry can be determined [6,11].

2.3. CG-Verfahren

Polonsky describes in his work a solution method for the determination of the contact displacement. The basic idea is to solve the linear complementary problem
F = a x a y l I g p l
g l = u l h l
g l = 0 p l > 0 , l I g
g l > 0 p l = 0 , l I g
by minimizing the potential total energy. Using a single-loop iteration scheme based on the CG method the system of Equations and inequalities (Equation (10)) are solved for the node pressure p l .
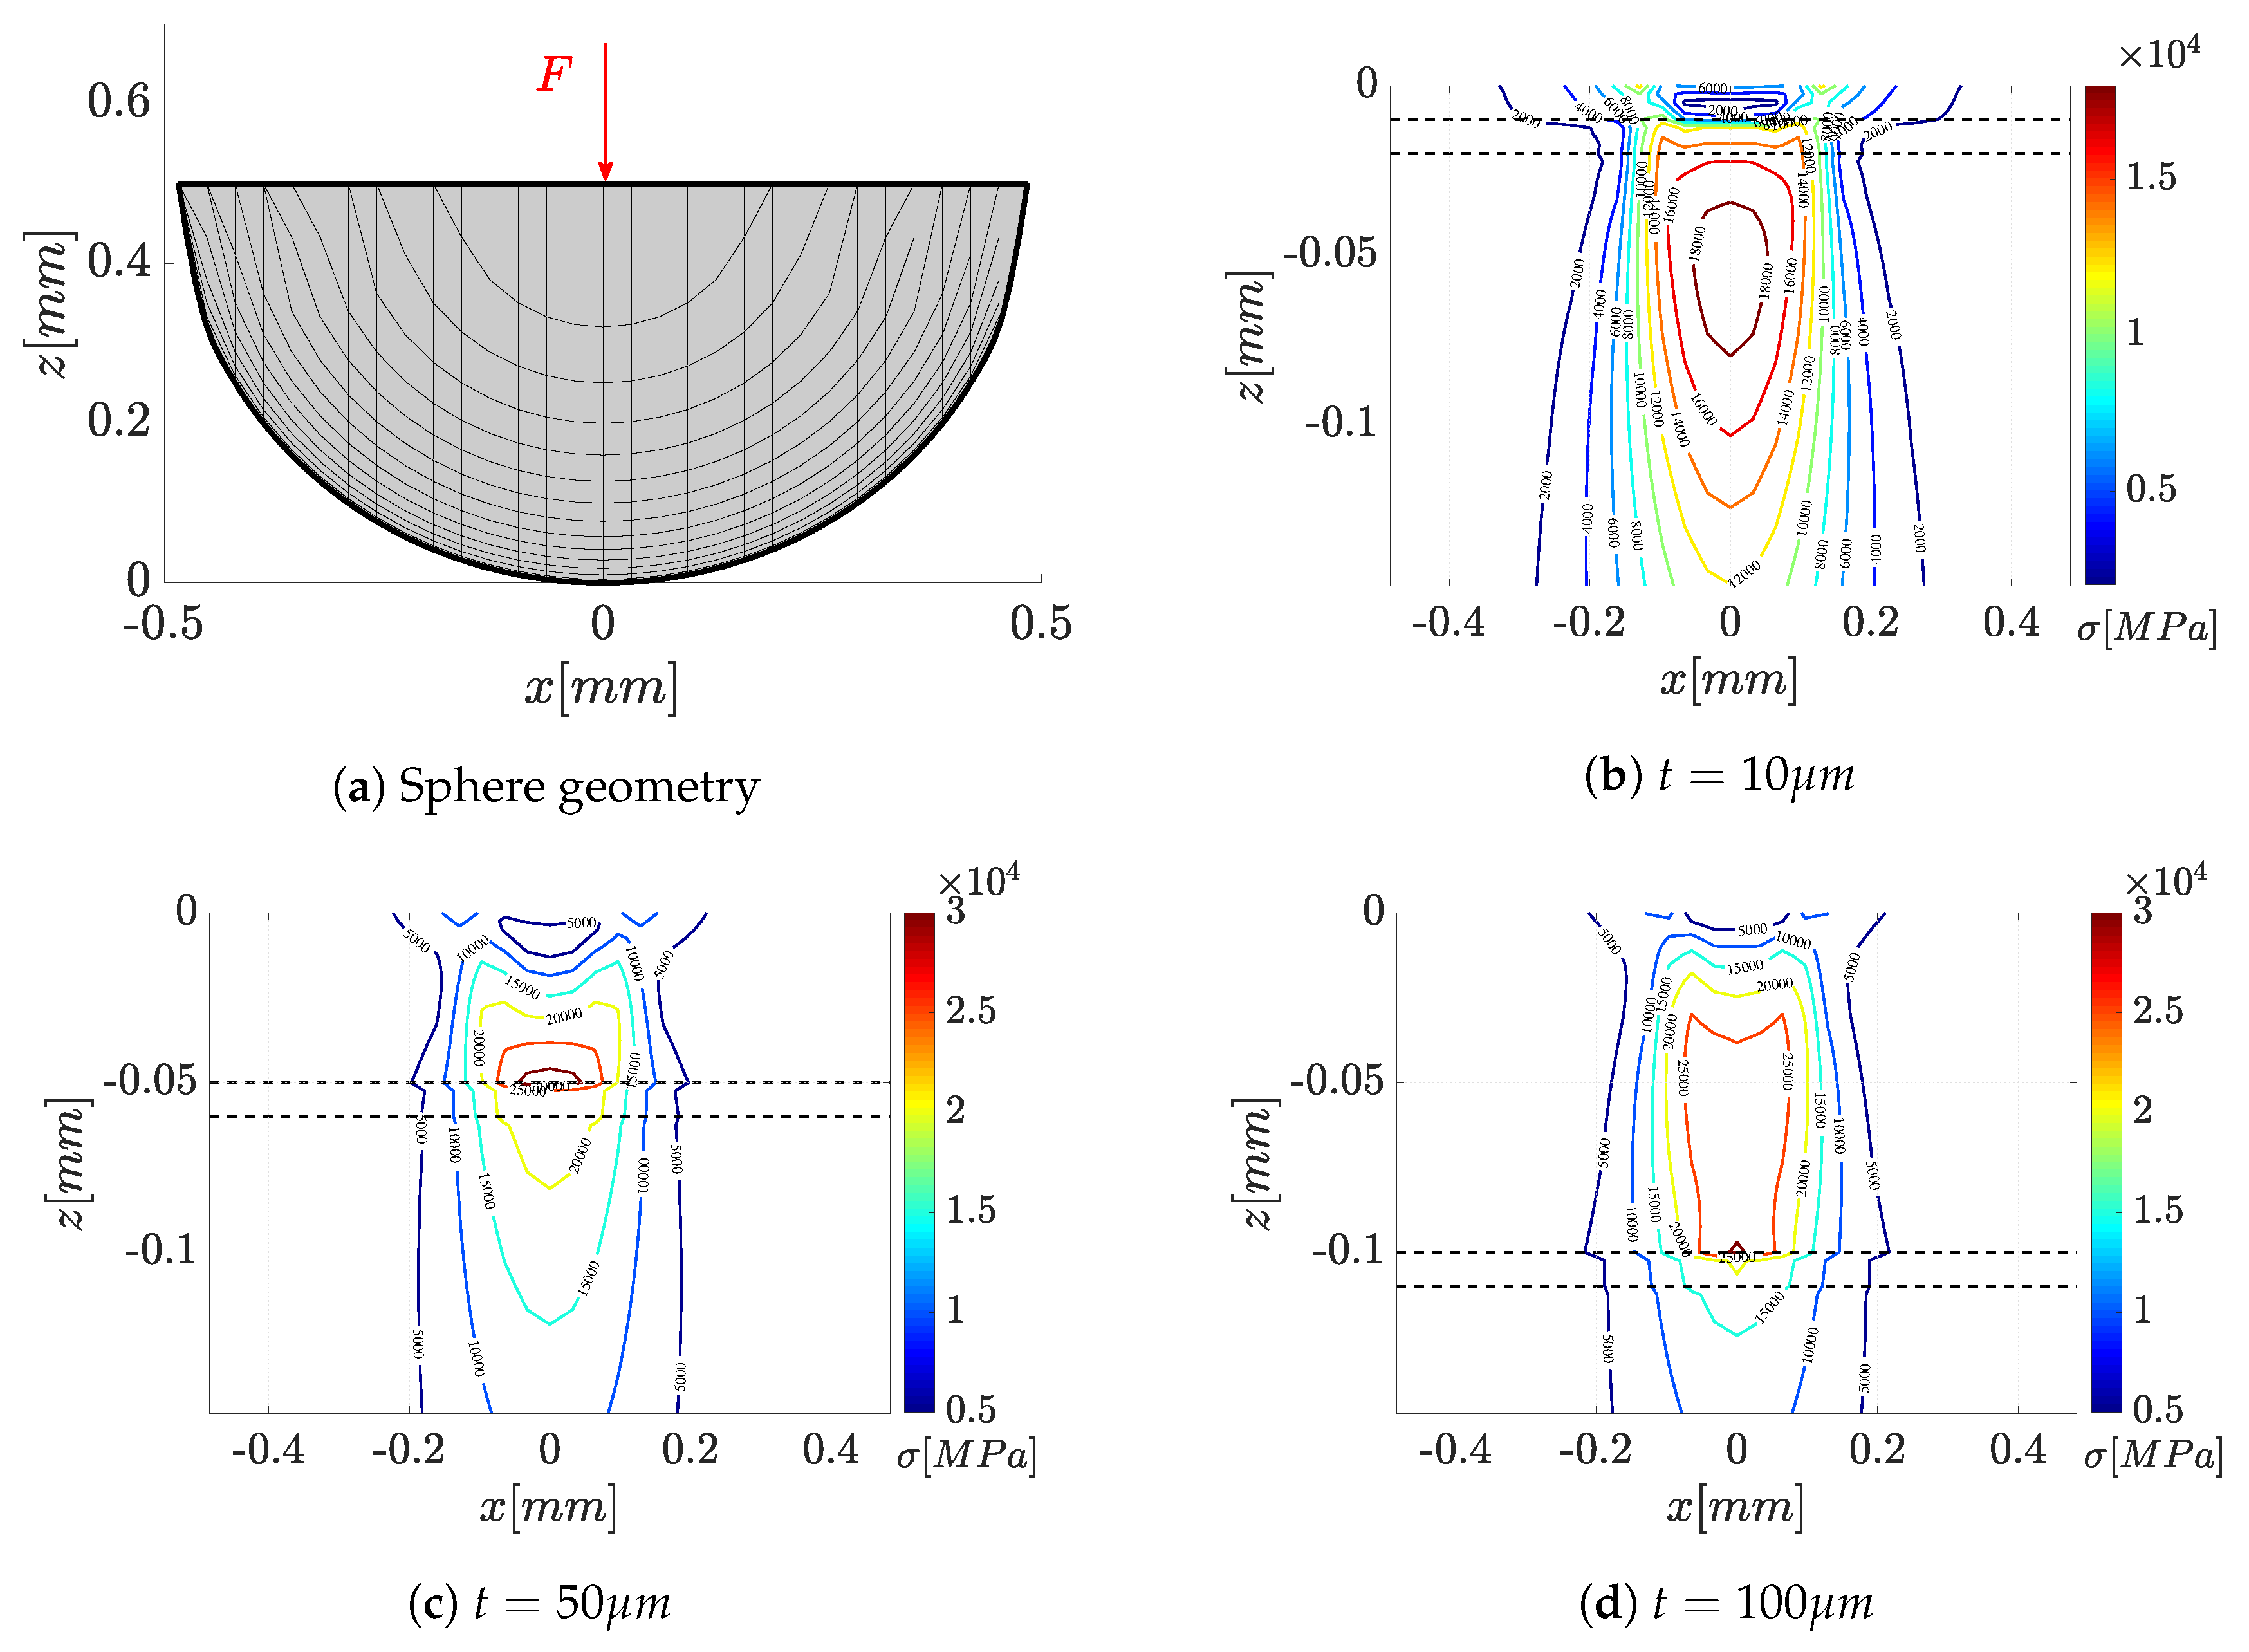
In the course of the iterative solution, the contact area I g is determined simultaneously with pressure distribution p l . In each iteration step, u l is calculated with Equation (9) until the complementary conditions Equation (10) are reached [6,12,13]. The results of a simulation run for a shift system of k = 2 are shown in Figure 3. The layer thickness t was varied for a specific sphere geometry, whereby the modulus of elasticity decreases from the surface towards the base material E o x > E γ > E G . In each case the same load F was applied on top of the sphere. The plotted results are the von Mises stress field inside the material. As expected the influence of the oxide layer leads in general to higher stress values in the volume. Furthermore, the highest stress peaks at the transition from oxide layer to the softer depleted material can be seen. At the phase interface, plastic deformation is to be expected under appropriate load.
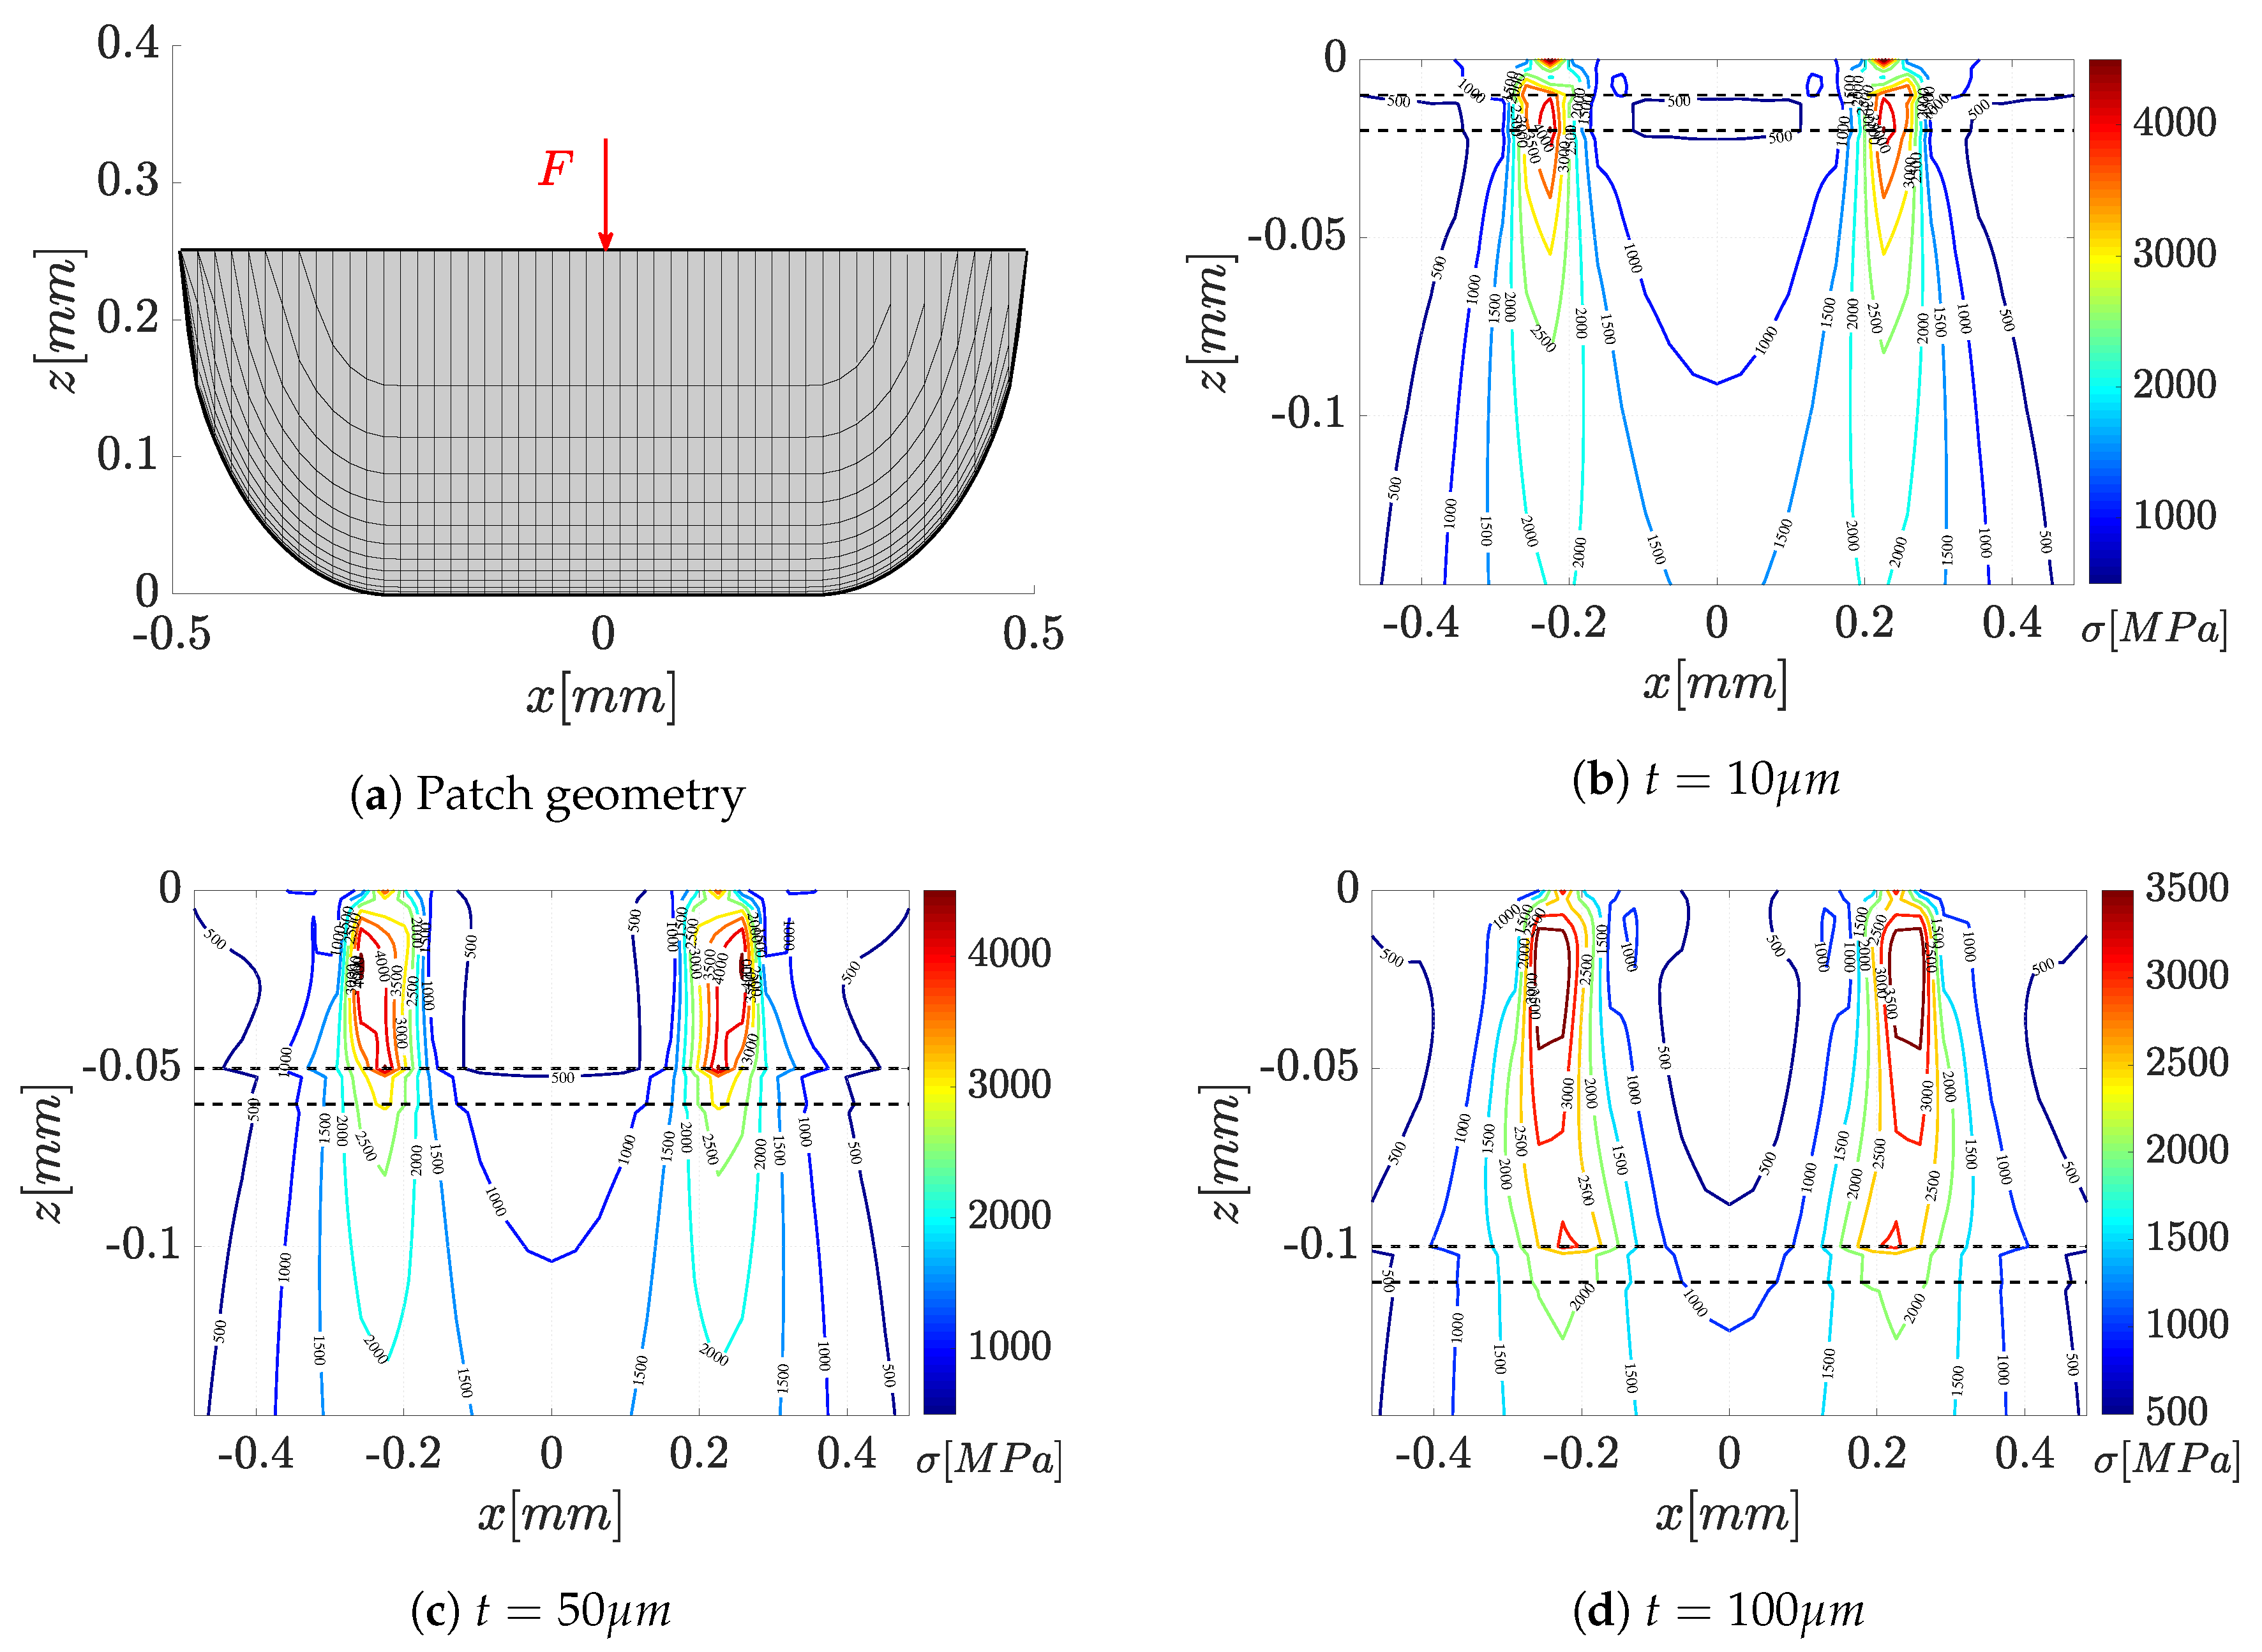
In order to get a better approximation for the contact of the turbine blade, a flattened geometry was modeled in Figure 4. Borders between the layers are highlighted by dashed lines. Overall much lower stresses are reached compaired to the spherical contact case. On the other hand, the maximum stress peaks are relocated due to the edging effect of the geometrie. None the less, stress peaks are still observable at the borders to the softer layers. It seems that higher thicknesses of the oxide layer protect the substructure from deformation and hence from plasticization. With this result, it is to be expected that the influence of the mechanical load will decrease over a longer oxidation time. Figure 5 shows a comparison between the pressure- p and gap-function g for the two reviewed contacting geometries.
It can be seen that the flattening of the sphere geometry in the contact zone leads to a parabolic course of the pressure. A good agreement is reached compared to the classic hertzian approach. On average, the deviation of the model is around 1%.
According to Figure 5b, the patch geometry has less maximum pressure by reason of the larger and flat contact area compaired to the analytical solution for the hertzian approach. The pressure peaks move to the edges of the contact.

3. Conclusions

The modeling approaches presented in this work demonstrate how the oxidative growth of turbine materials can be described at high temperature (see [9]). In addition, the contact simulation of multi-layer materials shows the possibility of generating high-resolution stress maps. This allows to make more accurate statements about the life-cycle of such materials. Regions with plastic deformation can be identified via the von Mises stress criteria. Due to this damage, accelerated oxidation is expected to occur. The result of most interest is the effect of the changed material properies in the oxid layer. High stress peaks can be seen at the interface between the layers as expected earlier.
In future work, the methods presented here will be enhanced to include the influence of rough surfaces. Furthermore, the effect of tangential loads is of interest. In addition, it is desirable to combine the contact algorithm with dynamic methods to perform friction wear calculations based on energetic wear laws.

Author Contributions

The authors contirbuted in the following way to this work: conceptualization, M.S. and J.S.; methodology, J.S.; software, M.S.; validation, M.S.; investigation, J.S.; data curation, J.S.; writing—original draft preparation, M.S.; writing—review and editing, A.B.-F.; visualization, M.S.; supervision, A.R. and A.B.-F. All authors have read and agreed to the published version of the manuscript.

Funding

This research was funded by the German Federal Ministry of Economics and Technology ( BMWi ) and MTU Aero Engines AG under the Ecoflex-Turbo program grant number 03ET7091F.

Acknowledgments

The authors gratefully acknowledge the collaboration in the joint research projects which formed the basis for this work. The authors cordially thank the project partner MTU Aero Engines AG.

Conflicts of Interest

The authors declare that they have no known competing financial interests or personal relationships that could have appeared to influence the work reported in this paper. The authors declare the following financial interests/personal relationships which may be considered as potential competing interests.

Abbreviations

The following abbreviations are used in this manuscript:
MDPIMultidisciplinary Digital Publishing Institute
SAMSemi-analytical Methode
FEMFinite Elemente Methode
CGConjugate Gradient
cconcentration
sphase boundary
DDiffusion coefficient
Ttemperature
ttime
c * jump concentration
x , y , z location coordinates
β growth coefficient
ψ * , φ potential function
~frequency domain
udisplacement
σ body stress
ξ , η frequency domain coordinates
knumber layers
M coefficient Matrix
a coefficient solution vector
p coefficient boundary vector
C i j u displacement influence coefficient matrix
C i j σ n stress influence coefficient matrix
i , j discretization points
E , G modulus of elasticity
tlayer thickness
Fforce
g l gap function
h l geometry
p l pressure
I g Contact area
a x , a y contact length

Appendix A

Formulations for the stresses inside the volume
σ ˜ ξ ξ ( k ) = ξ 2 φ ˜ k 2 ν k ψ 3 ˜ k z + i ξ 2 ψ 1 ˜ k ξ + 2 ν k ξ ψ 1 ˜ k z k ξ 2 ψ 3 ˜ k σ ˜ η η ( k ) = η 2 φ ˜ k 2 ν k ψ 3 ˜ k z + i η 2 ψ 1 ˜ k ξ 2 ν k ξ ψ 1 ˜ k z k η 2 ψ 3 ˜ k σ ˜ z z ( k ) = ( 2 2 ν k ) ψ 3 ˜ k z k + i 3 ψ 1 ˜ k ξ z k 2 + 2 ν k ξ ψ 1 ˜ k + z k 2 ψ 3 ˜ k z k 2 + 2 φ ˜ k z k 2 σ ˜ ξ η ( k ) = ξ η φ ˜ k + i η ξ ψ 1 ˜ k ξ + 2 ν k ψ 1 ˜ k + z k ξ η ψ 3 ˜ k σ ˜ z η ( k ) = η 2 ψ 1 ˜ k ξ z k + i η ( 1 2 ν k ) ψ 3 ˜ k + η z k ψ 3 ˜ k z k + η φ ˜ k z k σ ˜ z ξ ( k ) = 2 ν k ψ 1 ˜ k z k + i ξ ( 1 2 ν k ) ψ 3 ˜ k + ξ z k ψ 3 ˜ k z k + ξ φ ˜ k z k + ξ 2 ψ 1 ˜ k ξ z k .
and coupling conditions
u x x ( k ) ( x , y , t k ) = u x x ( k + 1 ) ( x , y , 0 ) u y y ( k ) ( x , y , t k ) = u y y ( k + 1 ) ( x , y , 0 ) u z z ( k ) ( x , y , t k ) = u z z ( k + 1 ) ( x , y , 0 ) σ x z ( k ) ( x , y , t k ) = σ x z ( k + 1 ) ( x , y , 0 ) σ y z ( k ) ( x , y , t k ) = σ y z ( k + 1 ) ( x , y , 0 ) σ z z ( k ) ( x , y , t k ) = σ z z ( k + 1 ) ( x , y , 0 )
for each layer.

References

  1. Wagner, C. Reaktionstypen bei der Oxydation von Legierungen. Zeitschrift für Elektrochemie Berichte der Bunsengesellschaft für physikalische Chemie 1959, 63, 772–782. [Google Scholar]
  2. Gesmundo, F.; Viani, F. Transition from internal to external oxidation for binary alloys in the presence of an outer scale. Oxid. Met. 1986, 25, 269–282. [Google Scholar] [CrossRef]
  3. Heikinheimo, L.; Baxter, D.; Hack, K.; Spiegel, M.; Hämäläinen, M.; Krupp, U.; Penttilä, K.; Arponen, M. Optimisation of in-service performance of boiler steels by modelling high-temperature corrosion. Mater. Corros. 2006, 57, 230–236. [Google Scholar] [CrossRef]
  4. Javierre, E.; Vuik, C.; Vermolen, F.; van der Zwaag, S. A comparison of numerical models for one-dimensional Stefan problems. J. Comput. Appl. Math. 2006, 192, 445–459. [Google Scholar] [CrossRef] [Green Version]
  5. Lagoudas, D.C.; Entchev, P.; Triharjanto, R. Modeling of oxidation and its effect on crack growth in titanium alloys. Comput. Methods Appl. Mech. Eng. 2000, 183, 35–50. [Google Scholar] [CrossRef]
  6. Polonsky, I.A.; Keer, L.M. A numerical method for solving rough contact problems based on the multi-level multi-summation and conjugate gradient techniques. Wear 1999, 231, 206–219. [Google Scholar] [CrossRef]
  7. Cai, S. 3D Numerical Modeling of Dry/Wet Contact Mechanics for Rough, Multilayered Elastic Plastic Solid Surfaces and Effects of Hydrophilicity/Hydrophobicity during Separation with Applications. Ph.D. Thesis, The Ohio State University, Columbus, OH, USA, 2008. [Google Scholar]
  8. Chen, W.W.; Zhou, K.; Keer, L.M.; Wang, Q.J. Modeling elasto-plastic indentation on layered materials using the equivalent inclusion method. Int. J. Solids Struct. 2010, 47, 2841–2854. [Google Scholar] [CrossRef] [Green Version]
  9. Senge, M.; Steger, J.; Brückner-Foit, A.; Rienäcker, A. Quantitative analysis of diffusion processes associated with γ′-depletion in Ni-base superalloys. Materialia 2018, 3, 41–49. [Google Scholar] [CrossRef]
  10. Özdemir, O.; Ancellotti, S.; Rienacker, A. Tribologische Charakterisierung rauer Oberflächen mit Berücksichtigung von Oberflächenbeschichtungen bei Mischreibung. In Proceedings of the 58th Tribology Conference, Gottingen, Germany, 27 September 2017. [Google Scholar]
  11. Bhushan, B.; Peng, W. Contact mechanics of multilayered rough surfaces. Appl. Mech. Rev. 2002, 55, 435. [Google Scholar] [CrossRef]
  12. Polonsky, I.A.; Keer, L.M. A fast and accurate method for numerical analysis of elastic layered contacts. J. Tribol. 2000, 122, 30–35. [Google Scholar] [CrossRef]
  13. Polonsky, I.A.; Keer, L.M. Stress Analysis of Layered Elastic Solids With Cracks Using the Fast Fourier Transform and Conjugate Gradient Techniques. J. Appl. Mech. 2001, 68, 708. [Google Scholar] [CrossRef]
Figure 1. Schematic representation of the damage scenario.
Lubricants 08 00004 g001
Figure 2. Comparison of layer model with measurement of damaged layers.
Lubricants 08 00004 g002
Figure 3. Results for the stess field of the sphere geometry with variation of the layer thickness t.
Lubricants 08 00004 g003
Figure 4. Results for the stress field of the patch geometry with variation of the layer thickness t.
Lubricants 08 00004 g004
Figure 5. Comparison of pressure p and gap-function g for different contacting geometries.
Lubricants 08 00004 g005