Abstract
Reduction of non-exhaust airborne particulate matter (PM), leading to adverse effects in respiratory system, is an urgent task. In this work, we evaluated the impact of raw materials in friction materials on PM emission due to brake wear for passenger vehicle. Time- and temperature-dependent measurements using dynamometer were made for low-steel friction materials with varied abrasives and lubricant(graphite). The brake emission factor (BEF) for graphite of varied sizes ranged from 6.48 to 7.23 mg/km/vehicle. The number concentration indicates that smaller graphite (10 μm) produces more nano-sized particles than larger size (700 μm) by >50%. Depending on abrasives, BEF was found to be varied as large as by three-times, ranging from 4.37 to 14.41 mg/km/vehicle. As hardness of abrasive increases (SiC > Al2O3 > ZrSiO4), higher BEF was obtained, suggesting that abrasive wear directly contributes to emissions, evidenced by surface topology. Temperature-dependent data imply that particle emission for SiC abrasive is initiated at lower speed in WLTC cycle, where disc temperature (Tdisc) is ~100 °C, than that for ZrSiO4 (Tdisc >120 °C). Analysis of wear debris suggests that larger micron-sized particles include fragmented Fe lumps from disc, whereas smaller particles are, in part, formed by combination of oxidation and aggregation of nano-sized particles into small lumps.
1. Introduction
Particulate matter (PM) denotes solid particles and liquid droplets in the atmosphere, which is a cause of air pollution. The PM is classified as commonly known PM10 and PM2.5, of which diameters are below 10 μm and 2.5 μm, respectively. The airborne particle from vehicles is partly originated from exhaust emission from incomplete combustion and volatilization of organic substances, and non-exhaust emission is also created as a wear product of brake, tire, and road together with their resuspension [1,2]. The aerodynamic radii of particulate matter ranges from nanometer- to micrometer-scale according to braking condition. Traffic-related PM10 emissions was assigned as large as 21% to brake wear [3] and the brake wear emission has been reported to be increased by more than 20% per year in Toronto during 2011–2016 [4]. The proportion of non-exhaust emission is expected to increase up to 80–90% by the end of decade as a result of growth in the number of electric vehicles worldwide and reduced tailpipe emissions [5,6,7]. Brake wear emission factors for light-duty vehicles (LDVs) in on-road tests in driving environments yielded quite a range of values, from 1.0–11.9 mg/km/vehicle (PM10), depending on the site and conditions [1,2]. Direct dynamometric measurements estimated PM emission factors; PM10 ranging of 3.0–8.0 mg/km/vehicle and PM2.5 ranging 2.1–5.5 mg/km/vehicle [1,8,9,10,11,12]. According to previous studies, brake wear produces airborne particles (35−55% of total wear) [8,9,10], and the remaining deposited can be, in part, re-suspended [13]. They may result in chronic effects in the respiratory system of humans [14], and become blood-borne and translocate to liver, kidneys, and brain [15].
The PM emission due to brake wear depends on friction materials (classified as non-steel, low-steel, ceramic composites), disc/drum (grey cast iron) [9,10], assembly structure (disc, drum, caliper) [9], and vehicle driving conditions (speed, deceleration, torque, and temperature) [9,10,11,16]. In order to reduce non-exhaust particle emissions, the impacts of (1) materials, (2) assembly, (3) particle measurement platform should be considered. Recently, the dynamometer test has been prevalently chosen as a measurement platform, in which sampling methods are properly controlled [17,18]. Several drive cycles, such as LACT (Los Angeles City Traffic) [19], WLTC (Worldwide harmonized Light duty driving Test Cycle) [20], and novel cycle [21], are being used. In this work, time- and temperature-dependent dynamometric test on the basis of the WLTC schedule is adopted for PM measurement because the WLTC is categorized as one of realistic, representative cycles. The WLTC was divided into 4 different sub-parts, each one with a different maximum speed (low, medium, high, extra-high). See Figure S10. The driving phases simulate urban, suburban, rural and highway scenarios, respectively, with an equal division between urban and non-urban paths (52% and 48%).
After use of asbestos was prohibited in the production of brake pads due to hazardous effect to human health, non-asbestos organic (NAO) friction materials has been developed, which can be divided into non-steel, low-steel, and semi-metallic friction materials according to composition of their reinforcing agent. Commercial friction materials for passenger vehicles typically consists of several components, including reinforcing fiber, abrasive, lubricant, binder, and friction modifier. The reinforcing fibers provide the mechanical rigidity of the pad, that are usually steel fiber, ceramic (potassium titanate), and aramid fiber. Brake pads are generally classified into two categories, non-steel and low-steel [22] according to the composition of fibers. The coefficient of friction of non-steel pad is quite low, whereas the non-steel pads produce relatively low brake noise, and poor fade. The non-steel pads are usually consumed in the US and Asian markets, whereas the low-steel is prevalent in European market. Low-steel materials contain higher concentrations of reinforcing steel fiber and abrasives. For this reason, low-steel pads have higher friction and good fade against non-steel, however, high wear rates and noise are disadvantages in return. Recently, it has been shown that reinforcing fiber predominantly impacts on PM emission, and thereby low-steel pads generally produce more airborne PM emission than non-steel [23,24]. However, even though it is expected that PM emission is also susceptible to the characteristics of abrasive materials, their effect on the emission has not been studied independently.
The lubricant and friction modifier also affect the frictional properties such as NVH (Noise, vibration, and harshness), squeal of the brake pads. Their effect is closely related to wear mechanisms in disc brakes, and thereby airborne PM emissions [25,26]. We have shown that abrasive wear mechanism is more dominant in low-steel pads than non-steel, and solid lubricating behavior of low-temperature-melting Cu and Sn is critical for reduction of PM emission [24,25]. In general, the lubricants of graphite are also formulated to enhance noise reduction and friction stability. It has been shown that size(lateral) and aspect ratio of lubricating graphite affects NVH characteristics and thermal conductivity since graphite is a good solid lubricating agent and thermal conductor with 2D structure. High aspect ratio of graphite has an influence on damping behavior, while fine size of particles is beneficial to NVH behavior and reduces the occurrence of squeal [27].
In this work, we attempted to elucidate the relationship between abrasive/lubricant of brake pad and the airborne PM emission from brake wear using a dynamometer and time-resolved optical PM measurement. Seven low-steel pad materials, including abrasive and lubricant of varied hardness and sizes, were investigated. The variation of PM emission during the WLTC driving cycle was presented by time- and temperature-dependent measurement. Furthermore, the origin of airborne particle was investigated in relation to wear mechanism by analyzing the microstructure and composition of wear debris.
2. Materials and Methods
2.1. Brake Dynamometer
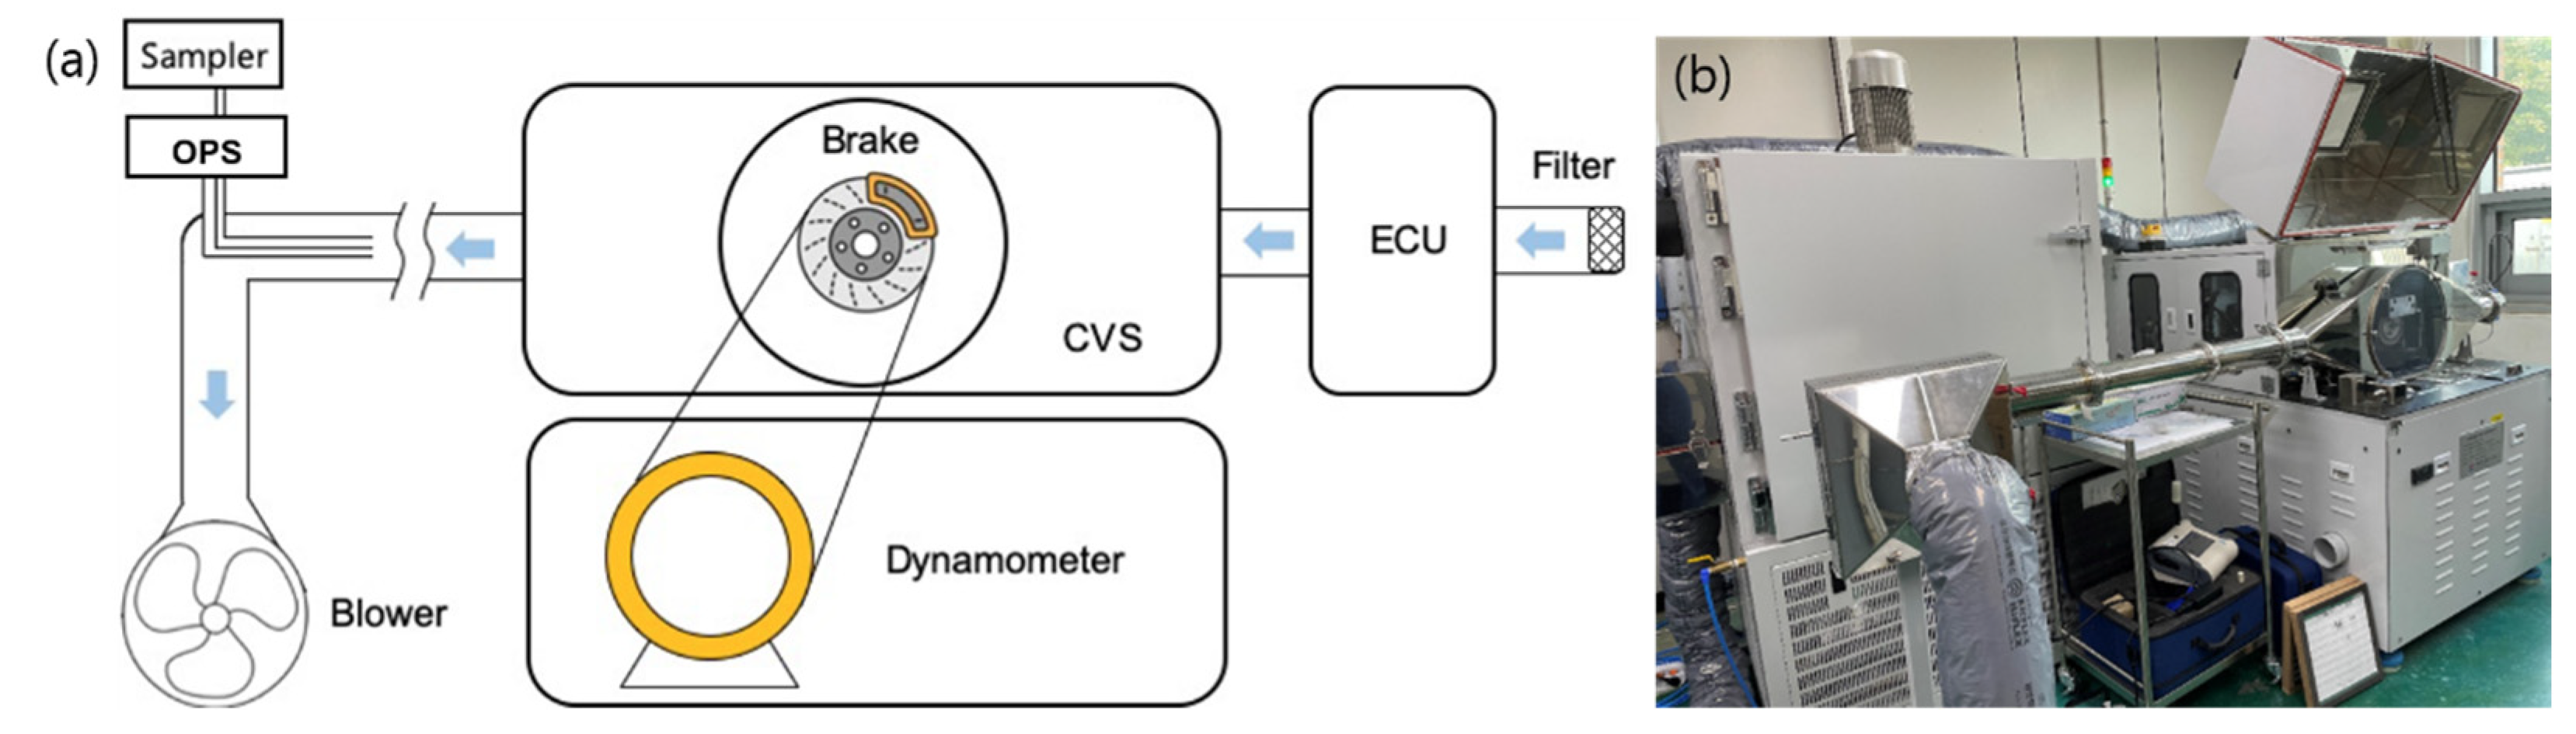
Quantitative measurement of airborne particle was made using a scaled brake dynamometer by 1/5 with enclosed chamber (800 mm × 370 mm × 555 mm, W × D × H). (Figure 1) Constant temperature- and humidity-conditioned air flow (50%, 20 °C) was created by negative pressure of blower into a constant volume sampling (CVS) system [9,11,12]. Air flow was filtered by high-efficiency particulate air (HEPA) filter. The air flow rate was fixed to be 5.2 m3/min, which was measured by air flow meter (TSI 9565-P, TSI inc., Shoreview, MN, USA). Constant air flow rate was maintained by feedback control using personal computer. Sampling was made at the location of >1.0 m from the brake assembly in vertical and isoaxial manners.
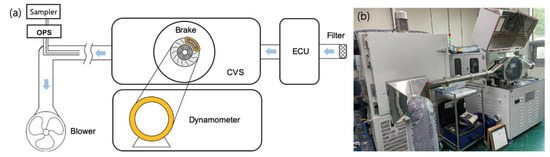
Figure 1.
(a) A schematic of brake dynamometer, connected by PM measurement device. Brake assembly is located in a constant volume sampling system, in which the environment is controlled by environment control unit (ECU). Air-inflow is filtered by HEPA filter system. (b) Image of 1/5 scale dynamometer and optical particle sizer system.
The brake assembly, a disc (grey cast iron) and a pair of pads, was installed in a caliper, which was connected to the drive shaft and a 110-kW DC motor (Sangsin brake Co., Ltd., Daegu, Korea). The size of tested pad specimens is 45 × 18 mm2 with a thickness of 6 mm, which is fixed by clamping system for tribological tests. The drive motor connected to gearbox generates the torque and shaft speed for the brake assembly. Data acquisition and control of system (temperature, friction coefficient, speed, torque, air flow) were carried out using personal computer (Sangsin brake Co., Ltd., Daegu, Korea).
2.2. Particulate Matter Measurements
The particle number concentration was measured by optical particle sizer (OPS, Model-3330, TSI inc., Shoreview, MN, USA) with a time series resolution of 1 s. The particle mass concentration was calculated from the amount of scattered light according to previous work [12,24]. First, particle numbers in separate 16 channels of OPS are collected as a time-series (1–1800 s). Then, particle mass for each channel is calculated from the number values assuming uniform density and spherical shape, volume: 4π/3 × (di/2)3, at each measurement time. The parameter di represent a diameter of particle collected in each channel. Finally, total mass emission factor was calculated from the summation of particle mass for total measurement period. The calculation methods were explained in detail in reference [24]. For the collection of airborne brake wear particles, an air sampler equipped with Teflon membrane filters for PM10 (Microvol 1100, Ecotech Ltd., Knoxfield, VIC, Australia) (PE47S05, 47 mm, Tisch scientific) was used. The drive sequence of the Worldwide harmonized light vehicles test cycles (WLTC) class 3B cycle with Vmax > 120 km/h was employed for dynamometric test. The cycle is divided into 4 parts with different maximum speed (low, medium, high, extra-high). Before a WLTC test, the surface of friction materials was burnished to remove all roughness (initial speed: 80 km/h, deceleration: 0.3 G, temp: <120 °C) [16]. The temperature was measured by thermocouple connected to disc surface. Three successive WLTC cycles were run in our tests without a change of the material (Table 1). After each run, the disc and pads were cooled to room temperature for usually more than 30 min.

Table 1.
Formulation of friction materials.
2.3. Materials
Low-steel pads, formulated with varied lubricant and abrasive, for the front brake assembly of a typical medium-size passenger car was tested. 7 kinds of pad specimens are produced by according to the formulation of main components in Table 1. The friction materials consist of steel fiber, abrasives (SiC, Al2O3, and Zircon), friction modifiers (Fe3O4, MgO, Iron chromite), lubricants, and binder. Minor components of metals and chalcogenides are also included as friction modifier or reinforcing fiber. The disc for the low-steel pads was cast iron (FC170, carbon: 4.3 wt%, hardness of 170 HBW). Three friction materials (PML-2/-3/-4) with graphite of varied sizes, and three materials, (PML-5/-6/-7) with abrasives of varied hardness (SiC, alumina, zircon) were prepared. PML-1 was also prepared with equal proportions of components (3 kinds of abrasive, 3 kinds of lubricant), representing a reference material that exhibits average impact of the respective components. Detailed compositions are listed in Table 1.
2.4. Analysis
Wear debris particles, emitted from brake assembly, were collected by filter in air sampler and studied by chemical and microstructural analysis methods. Chemical analysis was carried out by ICP-MS (NEXION 2000, Perkin Elmer corp., Waltham, MA, USA) and microstructural analysis was carried out by FIB (Helios NANOLAB, FEI corp., Hillsboro, OR, USA). The surface topology of worn pad surface was examined by laser confocal microscope (OLS4100, Olympus corp., Tokyo, Japan), FE-SEM (JSM-7610F+, JEOL Co., Ltd., Japan) and profiler (SJ-410, Mitutoyo Corp., Tokyo, Japan).
3. Results
3.1. Dynamometric Time-Dependent Profile
Table 2 shows friction coefficient (CoF), surface analysis results (roughness), and PM emission factor of the friction materials using dynamometer employing WLTC driving cycle. The PM10 emission factors, expressed as the amount of airborne particulate matter emitted per distance (km) per vehicle, was reported. The formulation of the friction materials is designed to have sequential abrasive character (PML-5 > PML-6 > PML-7) in an order of Mohs’ hardness of abrasive, beta-SiC (9.25–9.5) > Al2O3 (9.0) > Zircon (6.5–7.5), with PML-1 having average abrasive character. The amount of friction modifier was fixed to the same for all the formulations. For PML-2/-3/-4, graphite powder of varied sizes was included to investigate the relationship between PM emission and lubricating agents.
Table 2.
Dynamometric results of friction materials.
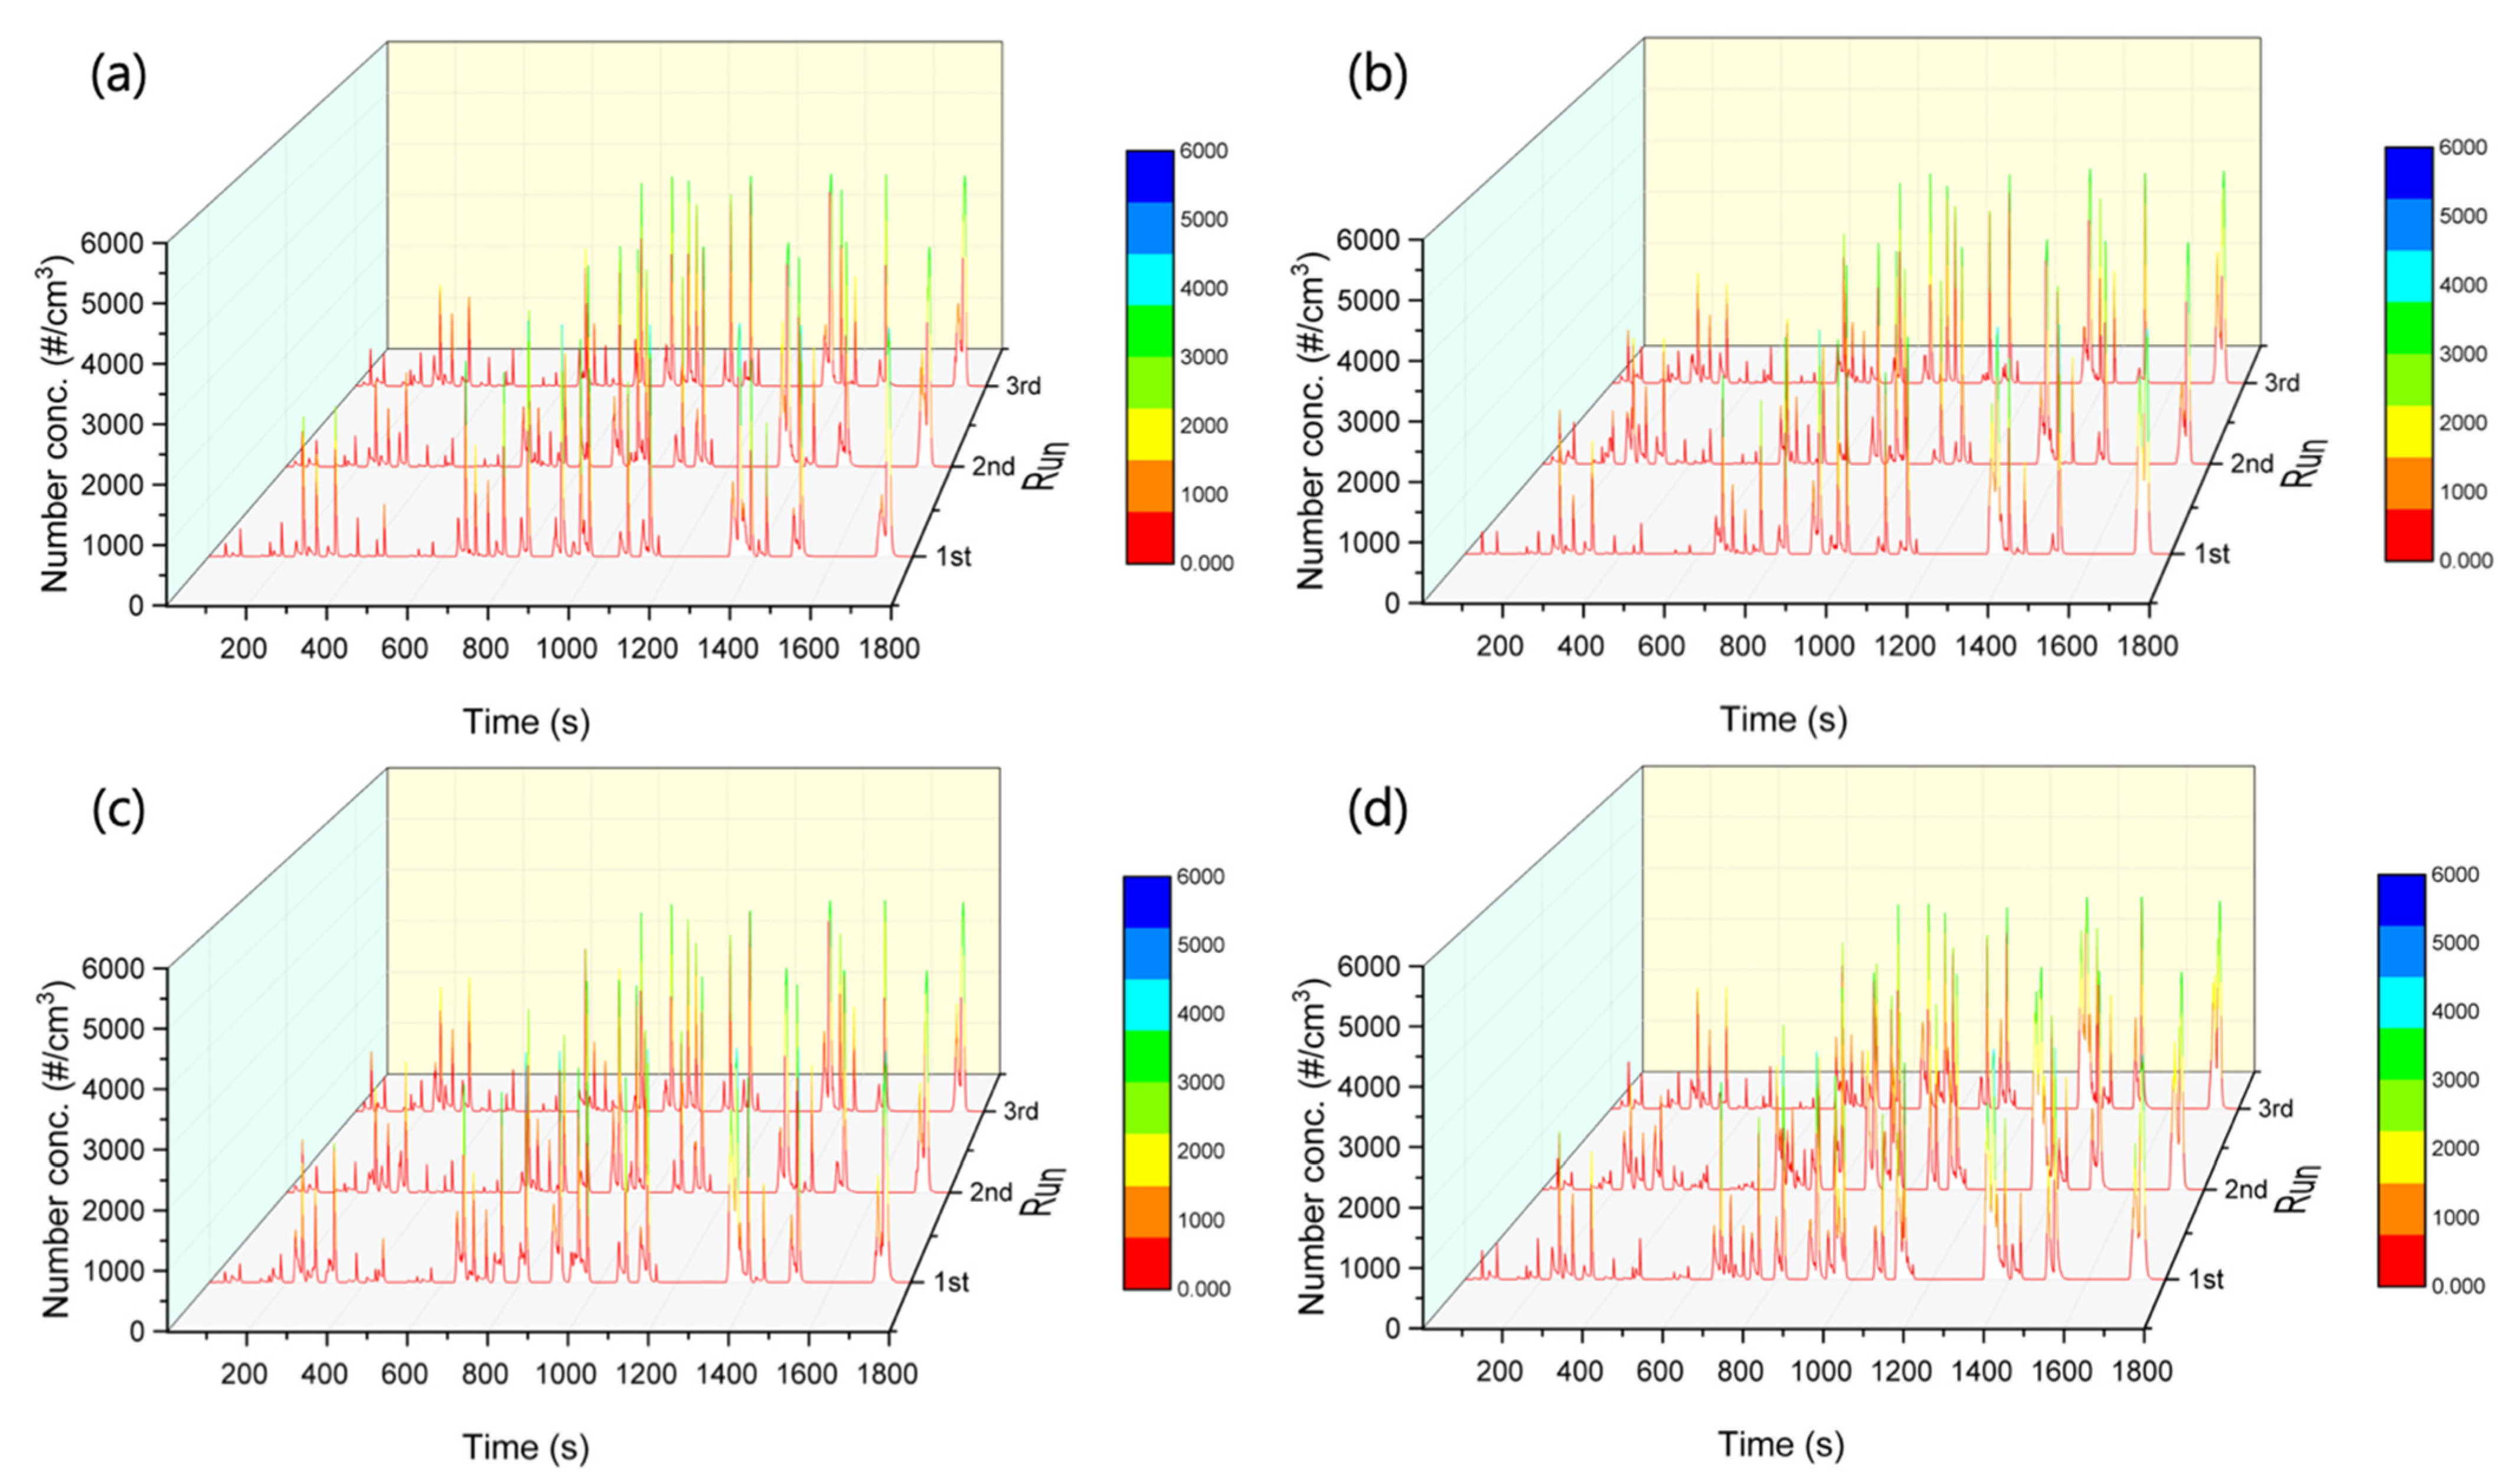
First, time-dependent measurements of the wear particles were carried out with a time resolution of 1 s to study the evolution of PM emission in the driving cycle. Time variations in the number of PM10 emission during WLTC cycles were measured using optical particle sizer (OPS). Figure 2 shows time variation of PM10 number concentration (#/cm3) of PML-1/-2/-3/-4 materials during WLTC 3B cycle (runs #1–3). Runs of #1, #2, #3 for each material, in general, resulted in similar PM emissions.
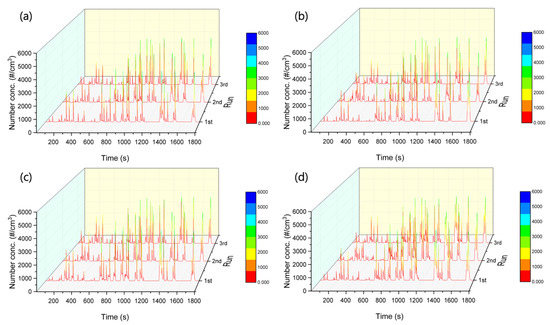
Figure 2.
Time variation of particle number concentration for (a) PML-1, (b) PML-2, (c) PML-3, and (d) PML-4.
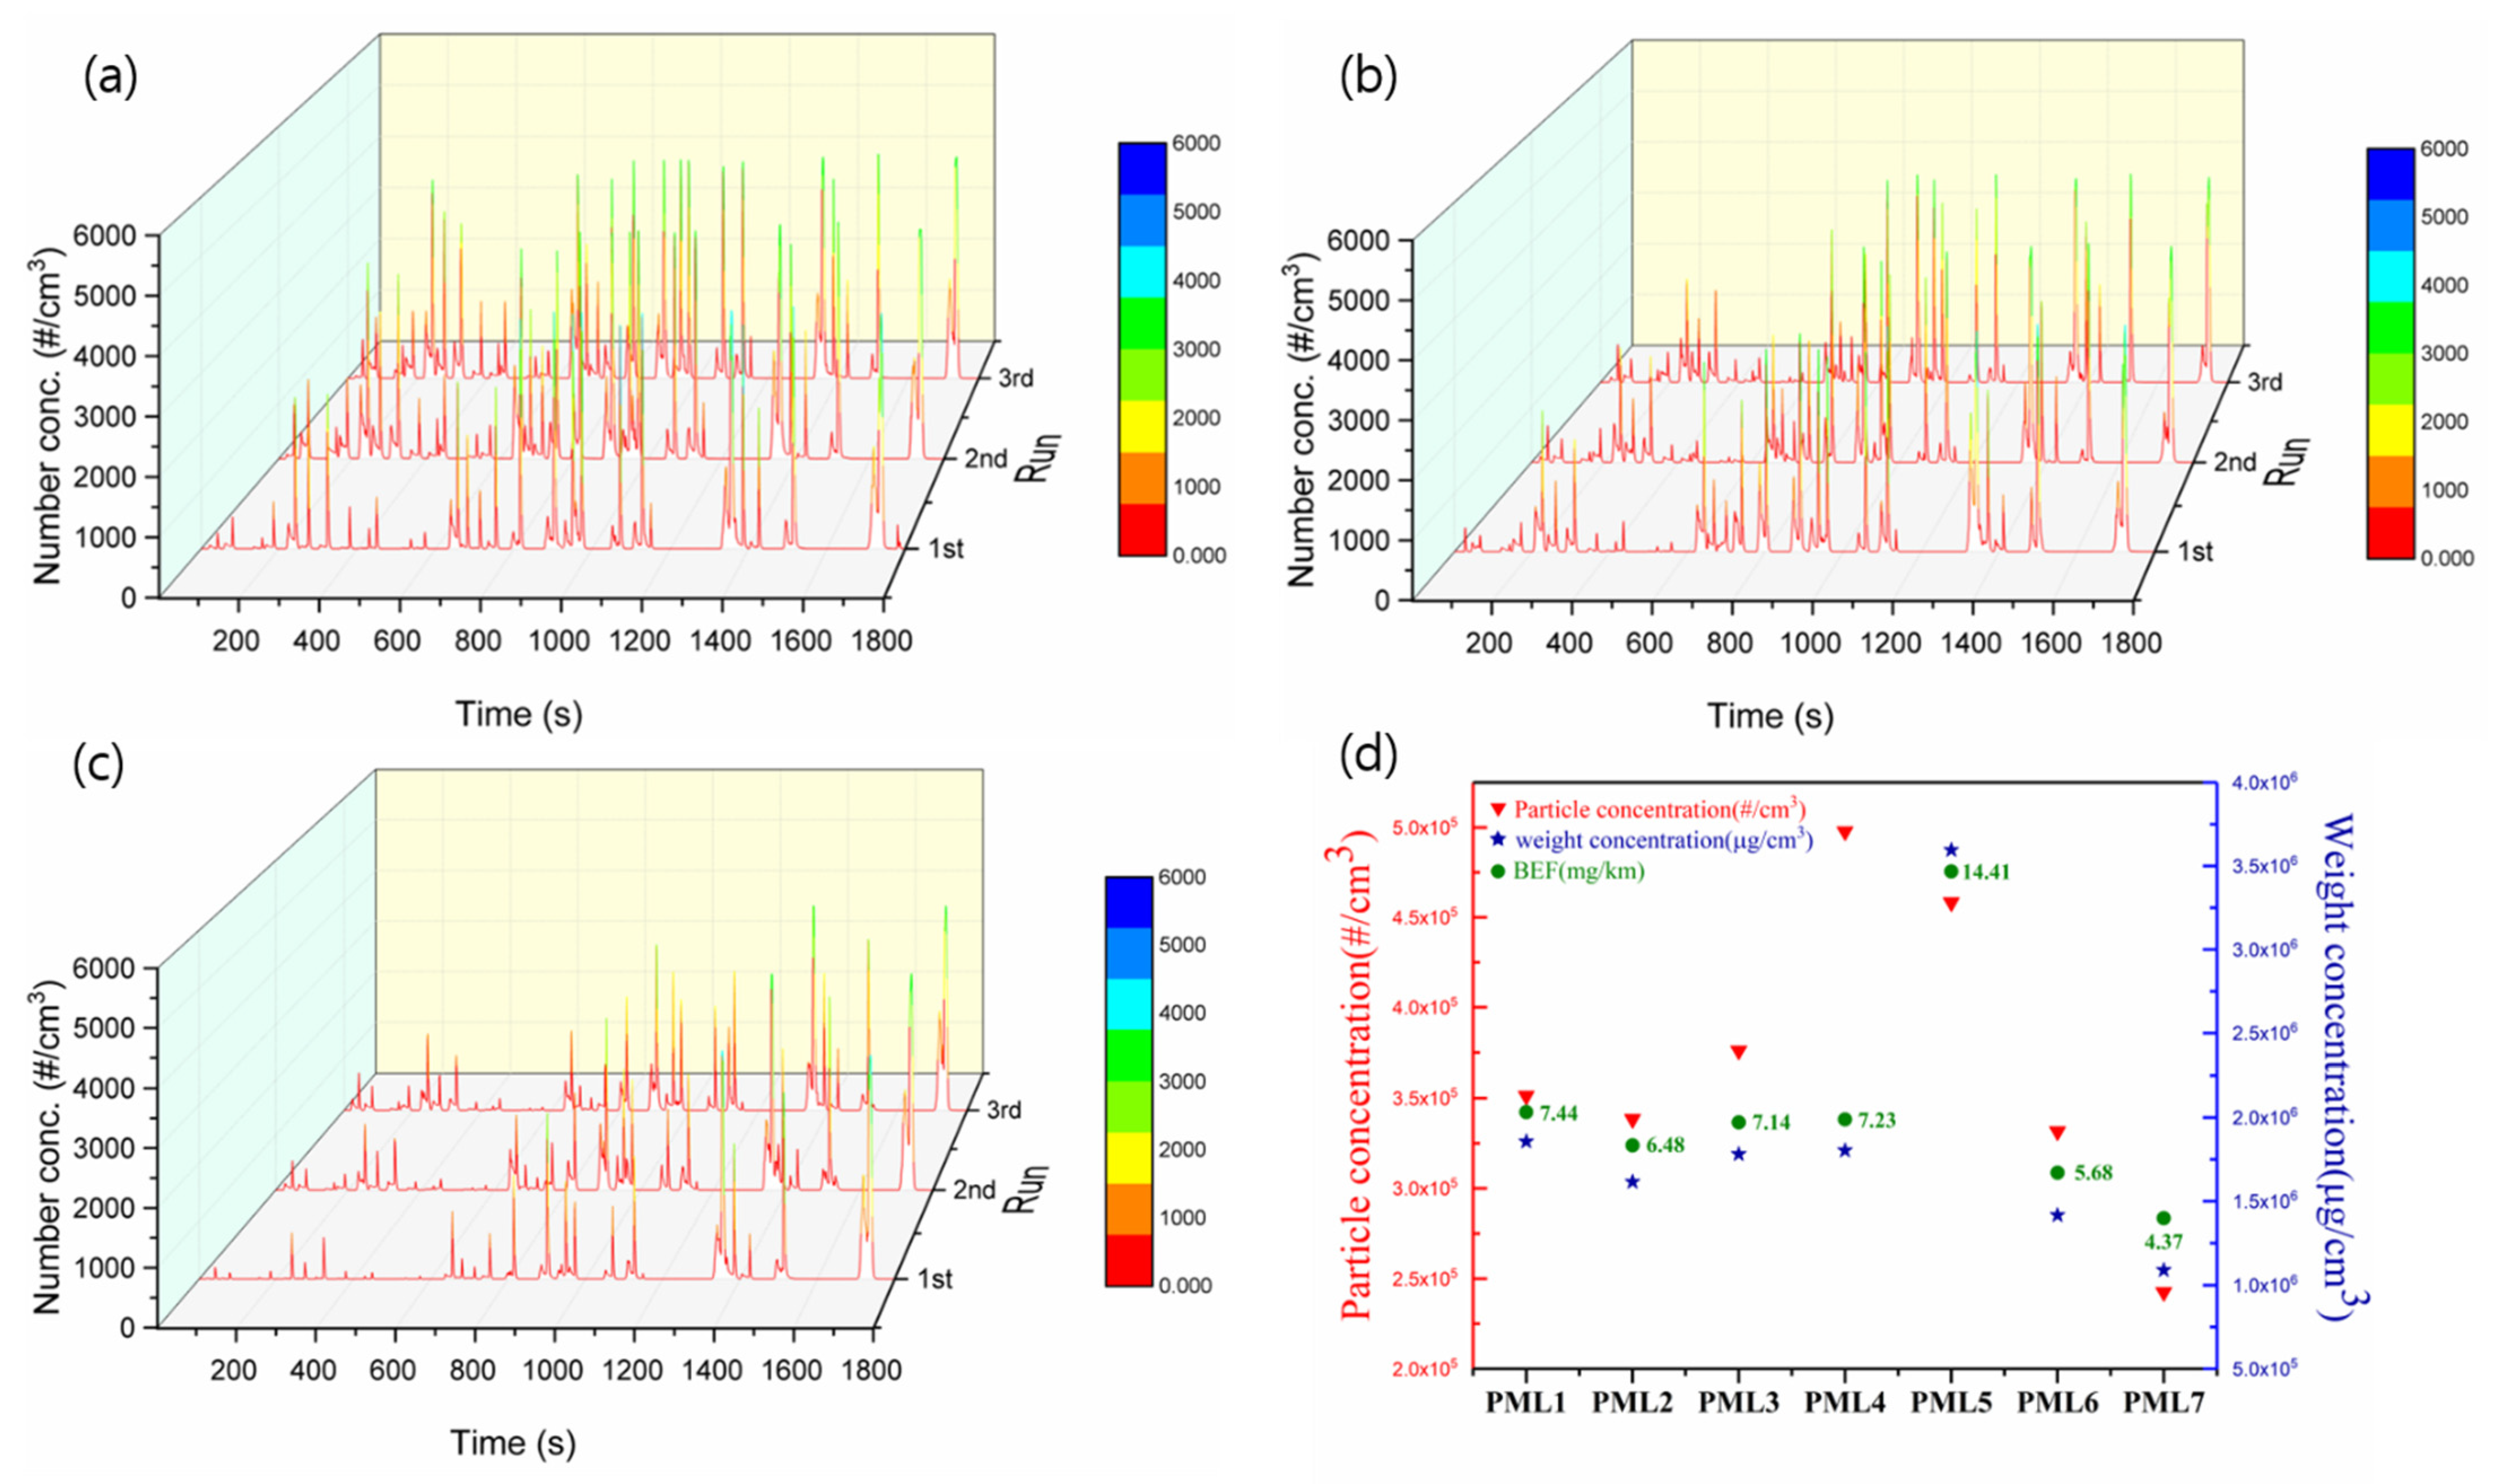
For the PML-5/-6/-7 materials, as shown in Figure 3, significant change of particle number concentration was observed with respect to abrasive materials, especially in the time range of 0~1000 s, corresponding to low- and mid-speed region. More PM10 particles are generated for PML-5 than PML-6 and PML-7, which is well consistent with brake emission factor, BEF, (14.41, 5.68, 4.37 mg/km/vehicle for PML-5/-6/-7, respectively).
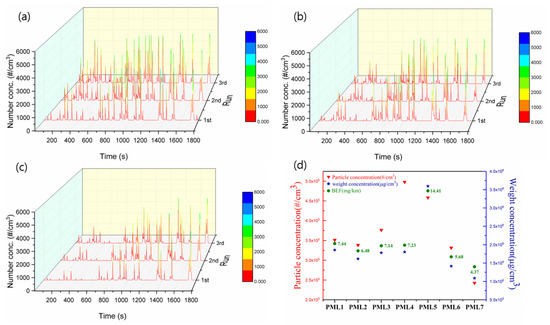
Figure 3.
Time variation of particle number concentration for (a) PML-5, (b) PML-6, and (c) PML-7. (d) Total particle number, mass concentration, and PM emission factor of PML-materials.
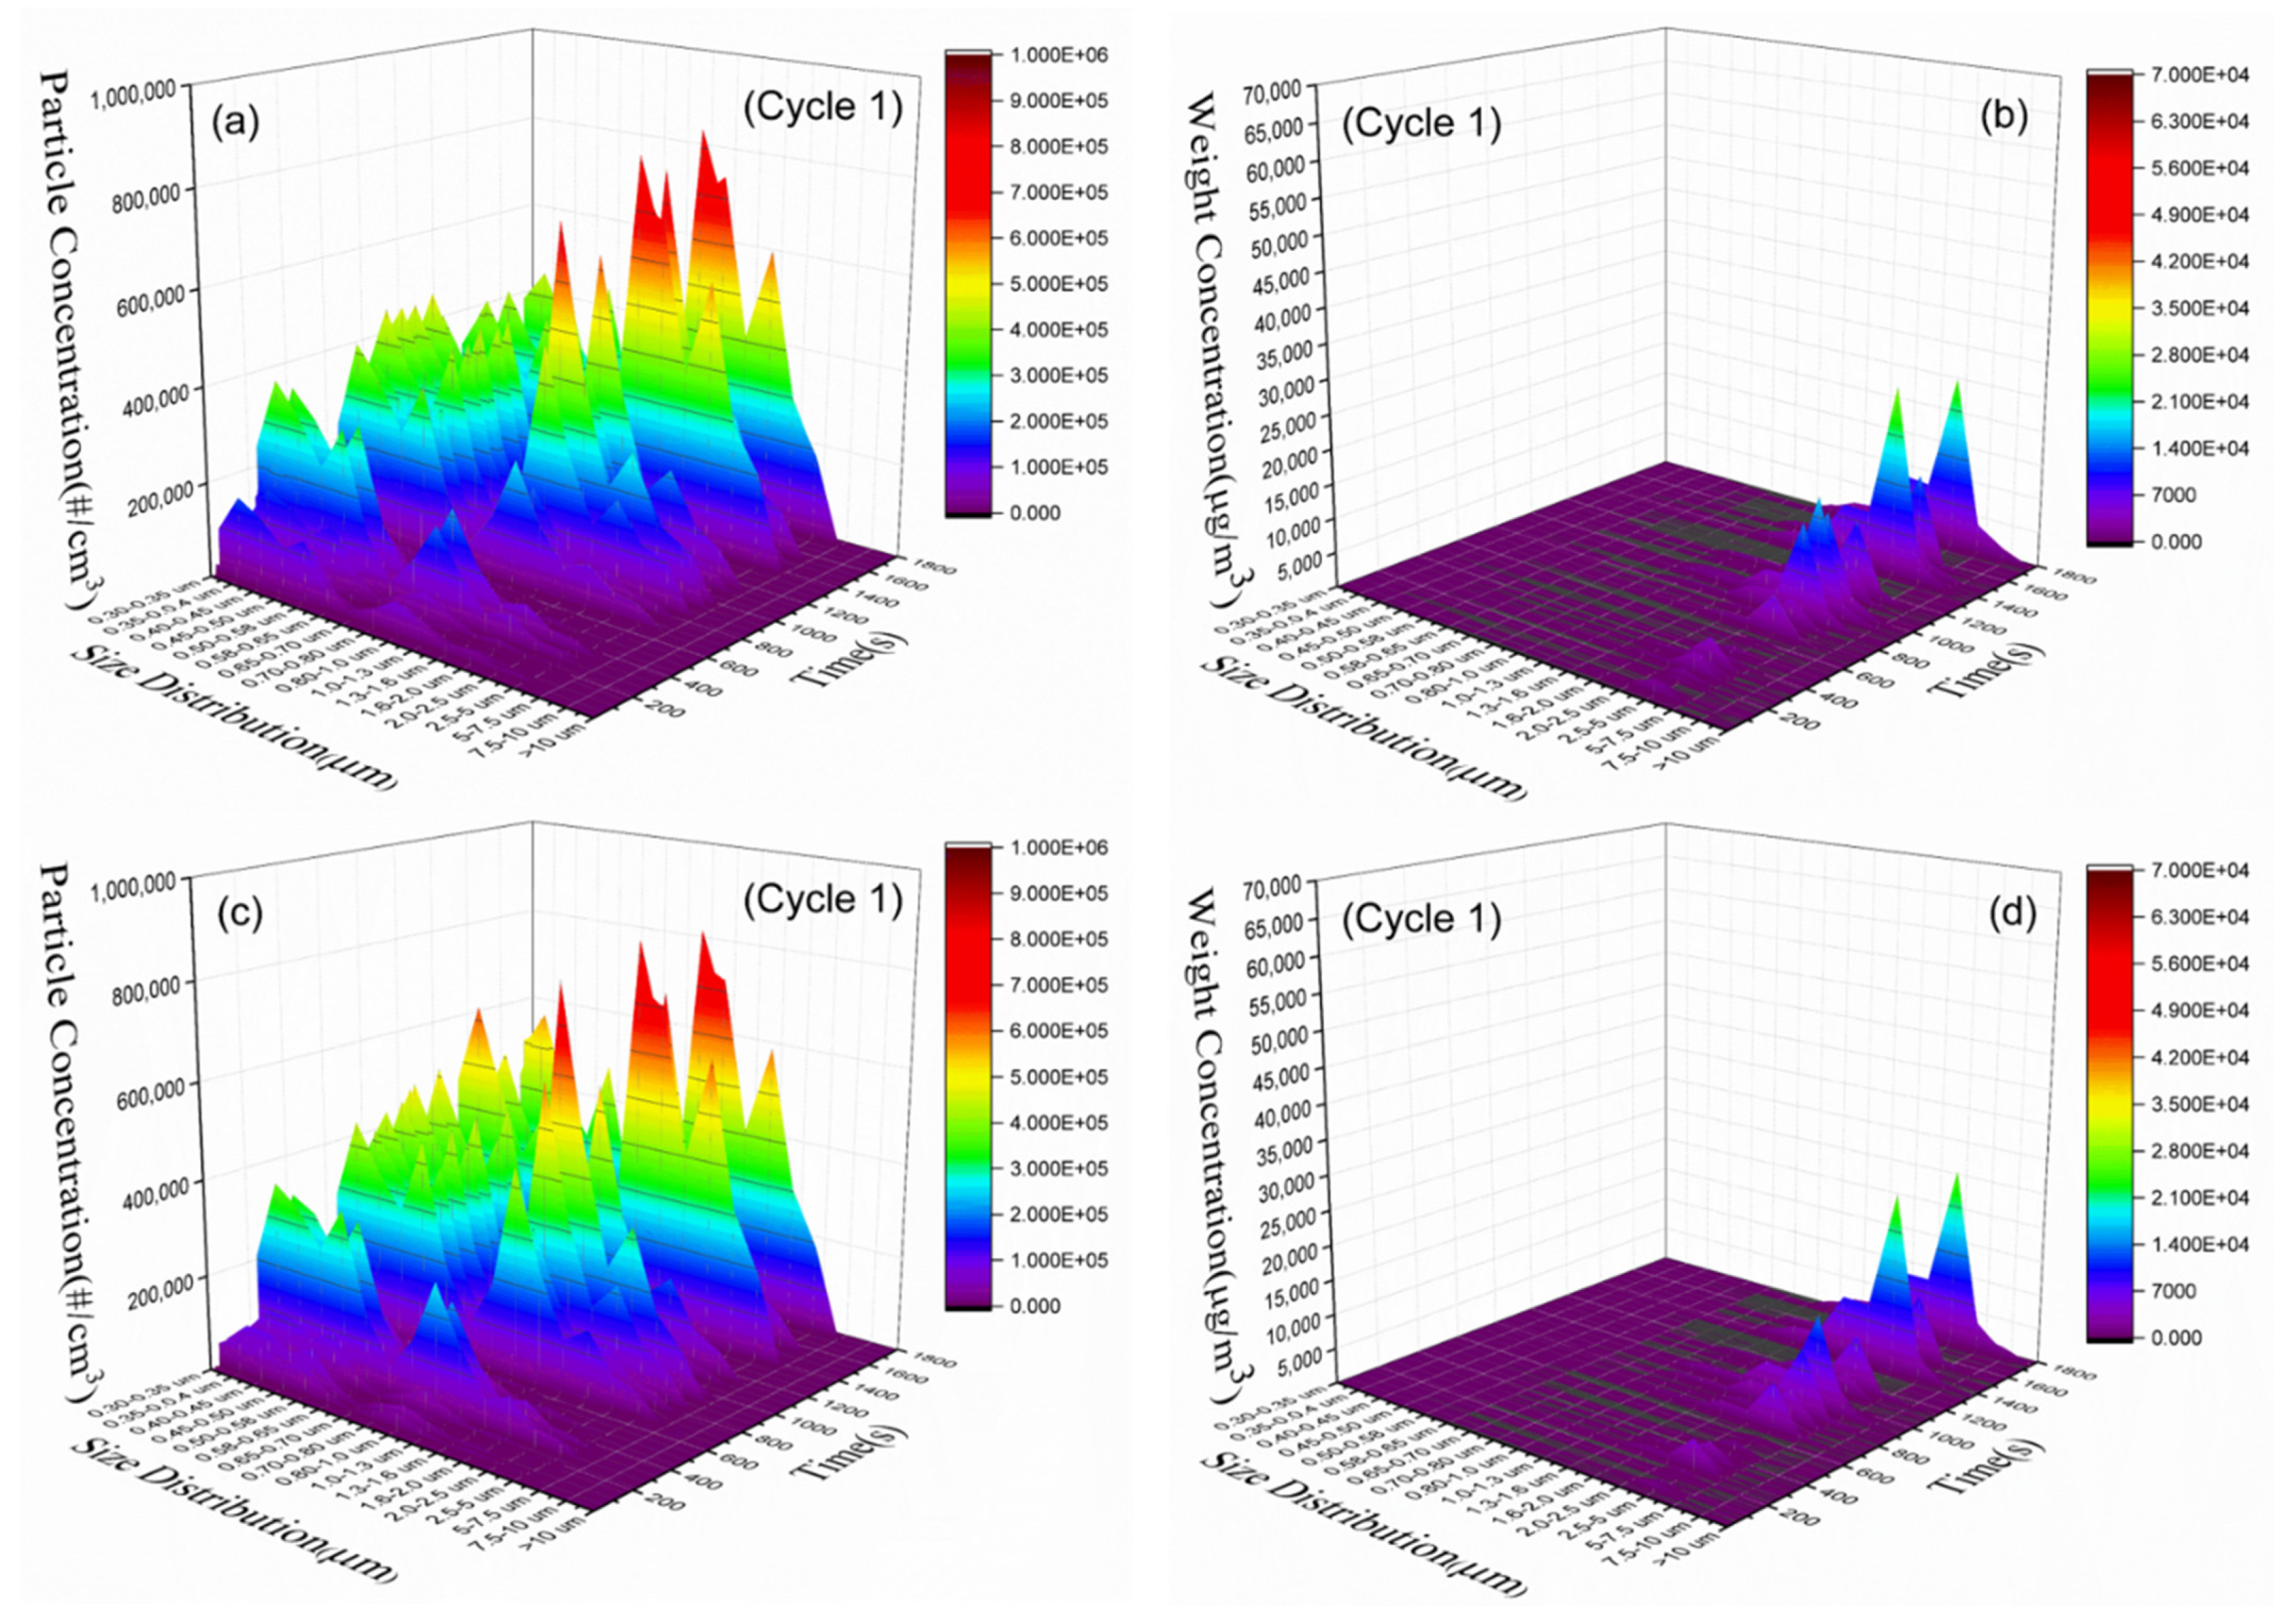
Figure 4 and Figure 5 show the particle number/mass profiles from the PML-2/-4 and PML-5/-6/-7 materials, respectively, from low-speed (1–550 s) to extra-high-speed region (1500–1800 s) under WLTC cycle. The bimodal-shaped mass distributions with a small peak in the sub-micon range (0.3–1.0 μm), and a large peak in the micron range (1.0–10 μm). Fine particle (<1.0 μm) and coarse particle (1.0–10 μm) are majorities in the number and mass patterns, respectively. However, even though the number concentration of fine particle was much higher than that of coarse particle, the mass concentration (μg/cm3) of fine particle should be smaller than that of coarse particle because of smaller volume. See Figures S1–S7 for all the cycles.
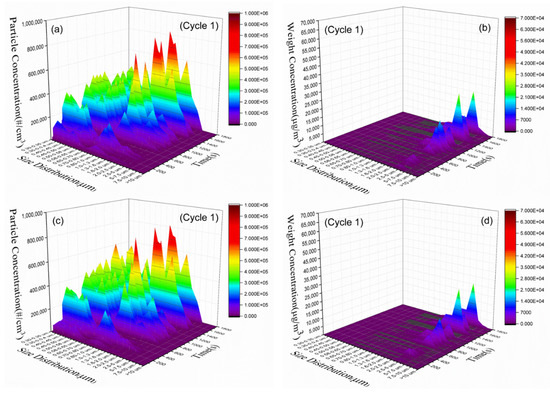
Figure 4.
Time variation of (a) particle number, (b) particle mass concentration profiles for PML-2, (c) particle number, (d) particle mass concentration profiles for PML-4. See Supplementary information for PML-1/-3 materials.
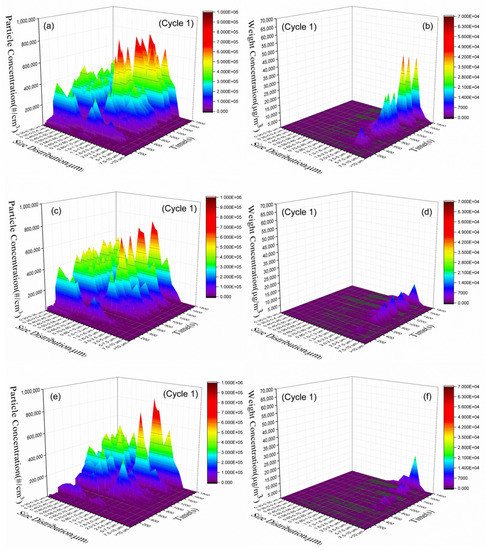
Figure 5.
Time variation of (a) particle number, (b) particle mass concentration profiles for PML-5, (c) particle number, (d) particle mass concentration profiles for PML-6, (e) particle number, (f) particle mass concentration profiles for PML-7.
In Figure 4, the time variation of PM emission for the friction materials, PML-2 and -4, in Table 1 are displayed, in which there is a notable difference in number concentration (in size range of 0.3–1.0 μm) with respect to size of graphite (700, 200, 10 μm). It turns out that, compared with the PML-2, the PML-4 material exhibited higher number concentration curves originating from of nanometer-sized airborne particle (0.3–1.0 μm) as shown in Figure 4c. The increased emission peaks for PML-4 are found in time range of >1000 s, corresponding to high- and extra-high-speed regions. This result indicates that the amount of nanometer-sized particle due to small-sized graphite is increased in high-speed region, which is in accordance with higher number concentration values of PML-4 (~5 × 10⁵/cm3) against PML-2/-3 (3.5–3.7 × 10⁵/cm3) in Figure 3d. As the size of graphite decreases (PML-2 > PML-3 > PML-4), particle number concentration increases. The number concentration of PML-4 was much higher than that of PML-2, however, the mass of fine particles was much smaller than that of coarse particles, thereby weight concentration (1.5–1.7 × 10⁶ μg/cm3) and brake emission factor (BEF, 6.48–7.23 μg/cm3) are almost the same for PML-2/-3/-4 materials, as shown in Figure 3d and Table 2. Figure S11 shows that morphology of graphite of PML-4 is more sheet-like with higher aspect ratio than that of PML-2/-3, which might result in increased nano-sized airborne particles.
The mass concentration of coarse particles (1.0–10 μm) for the PML-5 materials was 2.0–3.0 times that of PML-7 for the high- and extra-high-speed regions as shown in Figure 5b,f. This agrees well with the brake emission factor (BEF) for the PML-5 materials (14.41, 4.37 mg/km/vehicle for PML-5 and PML-7, respectively) as shown Figure 3d. As for particle number, the number concentrations of both fine particle (<1.0 μm) and coarse particle (1.0–10 μm) for the PML-5 materials were larger than that of PML-7, which is more pronounced in the low-speed than extra-high-speed region. This result is also consistent with time-resolved data in Figure 3a showing that PM emission is enhanced in low- and mid-speed regions (1–1000 s) in the case of PML-5. Figure S11 shows that SiC abrasive (PML-5) have sharp edges, whereas particle shape of zircon (PML-7) is round and random, which might also influence airborne PM emission.
Table 2 shows that the PML-5 materials containing SiC exhibited higher PM emission values than those containing Al2O3 and zircon (PML-6/-7). The PML-5 having mechanically hard abrasive shows higher PM emission factor, which is probably a result of wear mechanism. On the other hand, mass-based PM emission factor (BEF) is invariant with respect to the variation of graphite.
3.2. Wear Debris Analysis
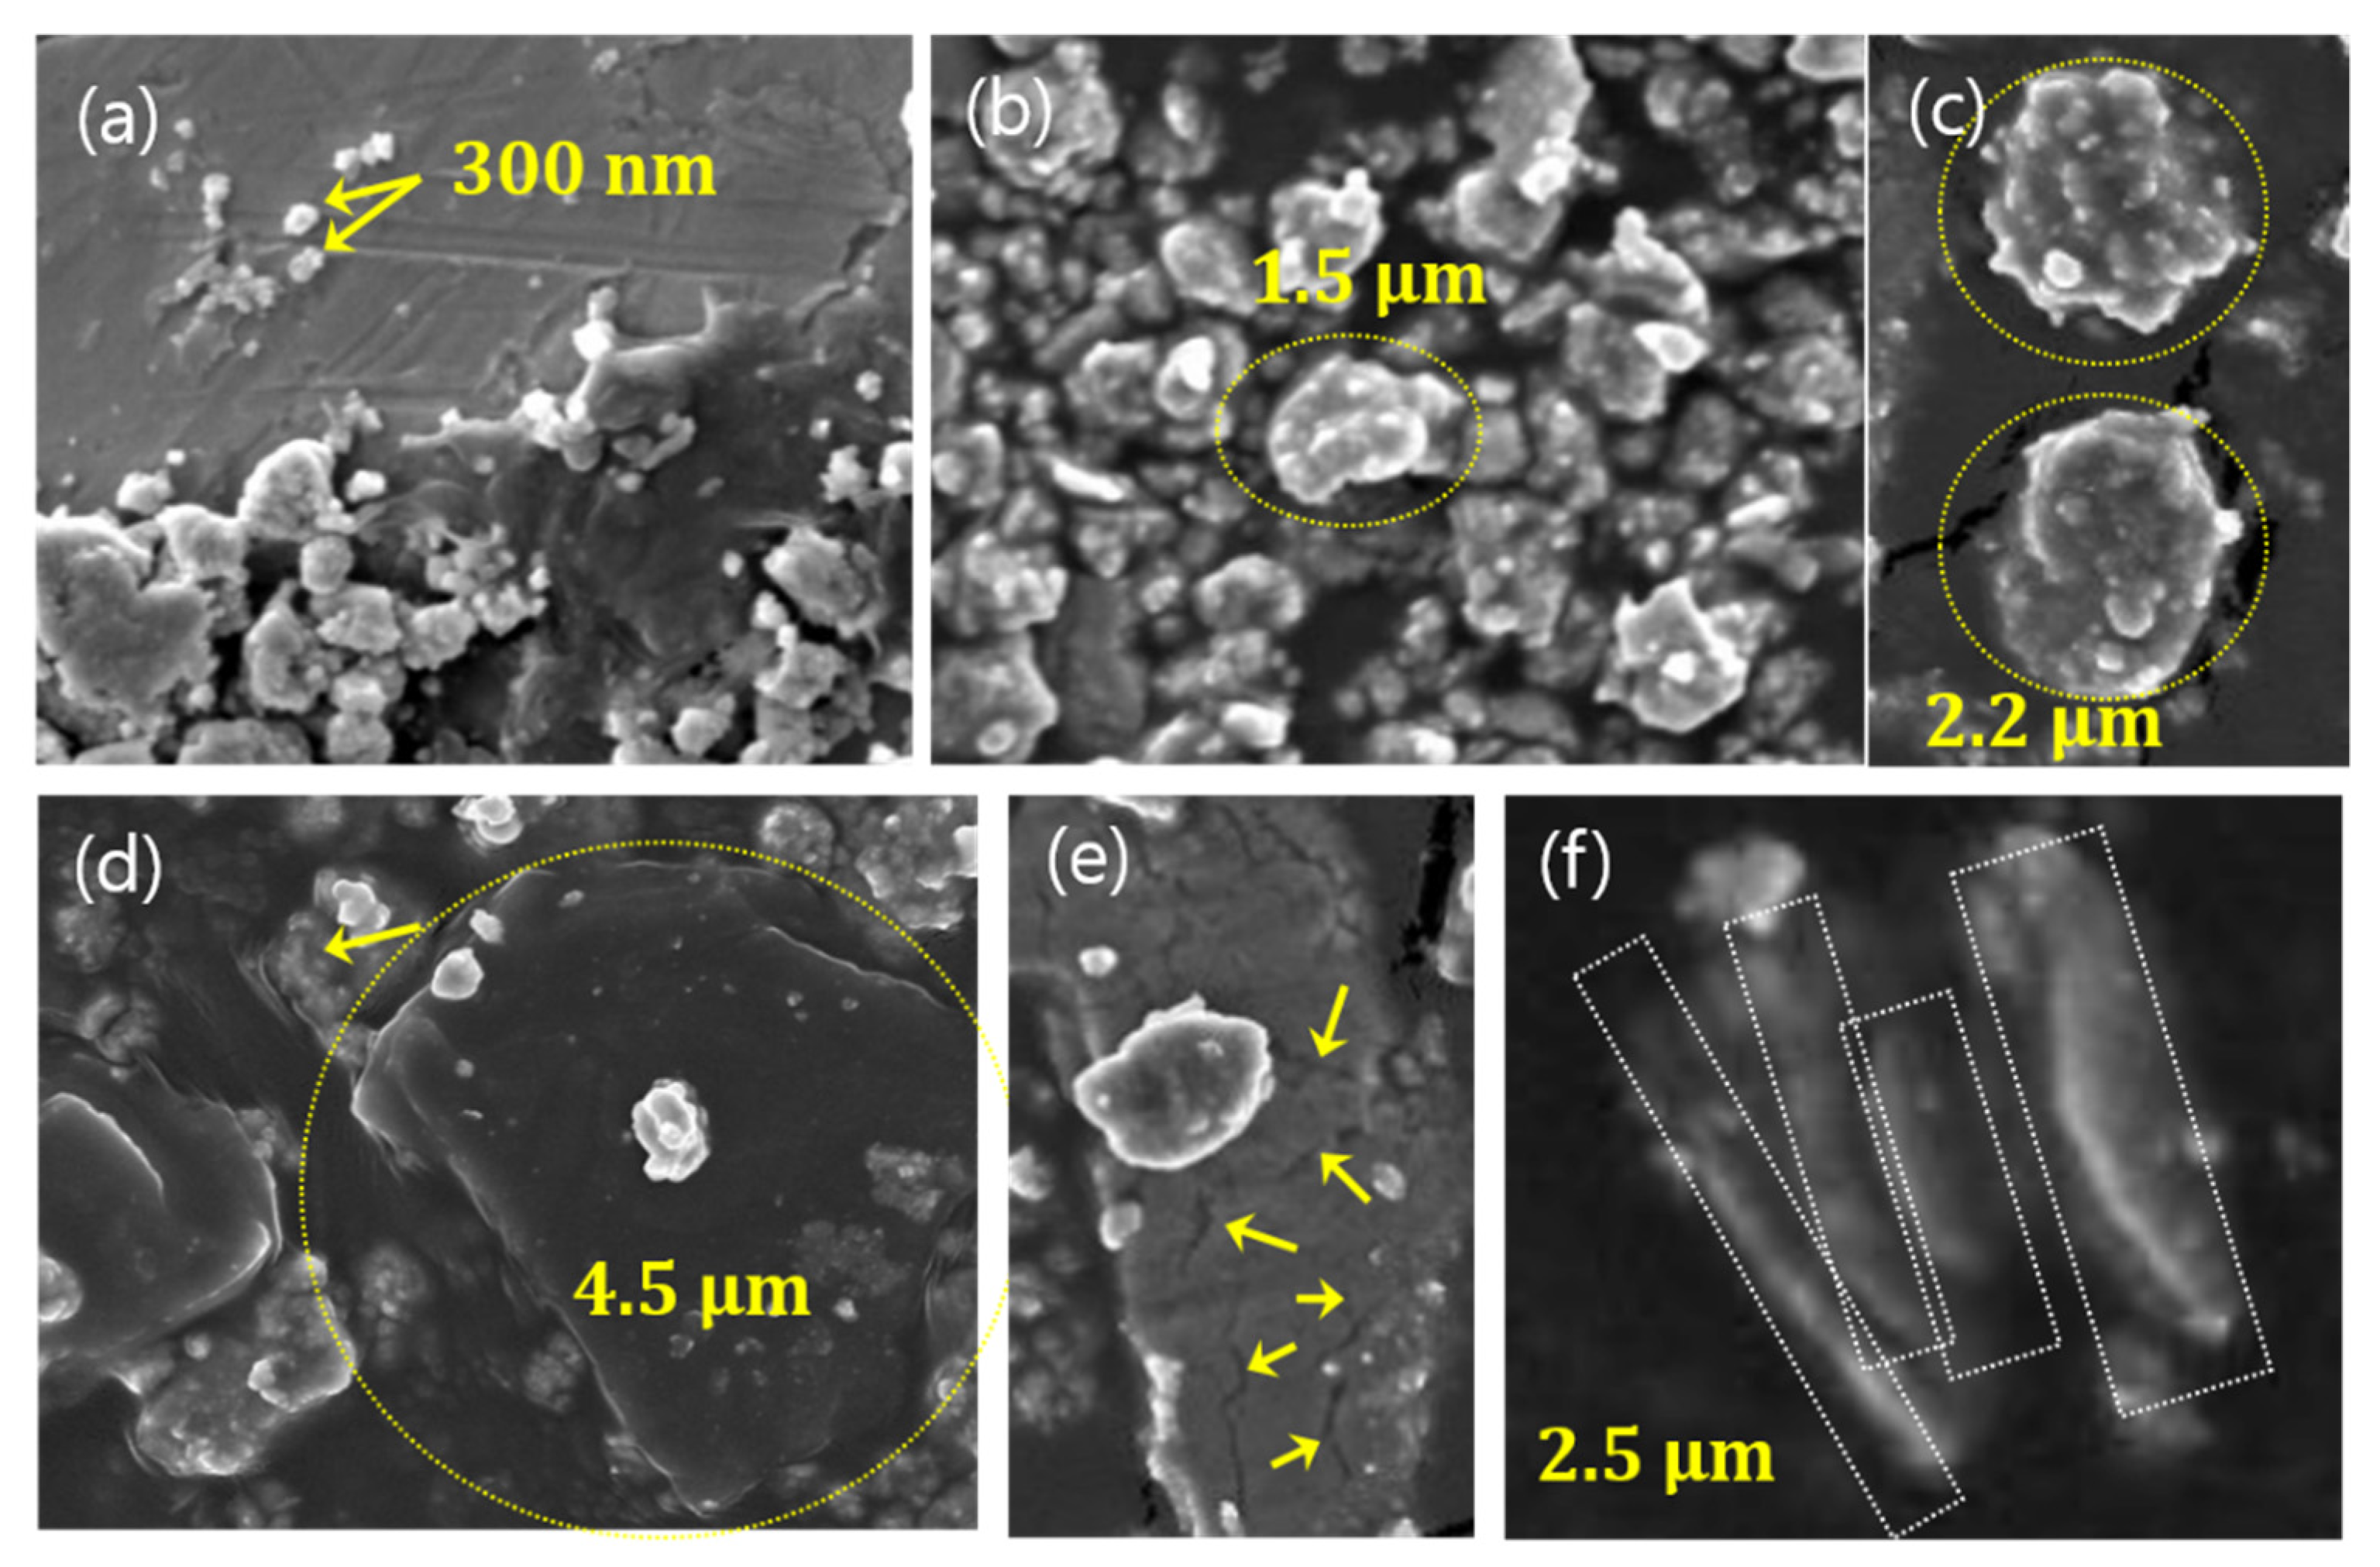
In this work, 5 morphological categories of wear debris were found in FE-SEM images (Figure 6). Secondary granular particles (Figure 6b,c) consist of smaller primary particulate matter (Figure 6a), which tends to aggregate/agglomerate for the purpose of minimization of surface energy. The primary particle size measured from the SEM images in Figure 6a is approximately submicron size (<1 μm), whereas secondary granular particles have a size of micrometers (Figure 6b). See Figure S8 for the EDX result for Figure 6a–c. Large steel lump with irregular shape (Figure 6d) was found to be pure Fe according to EDX analysis (Figure 7a), which is probably separated from grey iron disc by fragmentation without considerable chemical oxidation. The large micron-sized particles, (1) in Figure 7a, are made by mechanical wear, not by oxidative wear [28]. Whereas, submicron particles, (Figure 6a–c) are formed by the evaporation-condensation process and the aggregation of the nano-sized particles. See Figure S9 for the EDX results for Figure 7b.
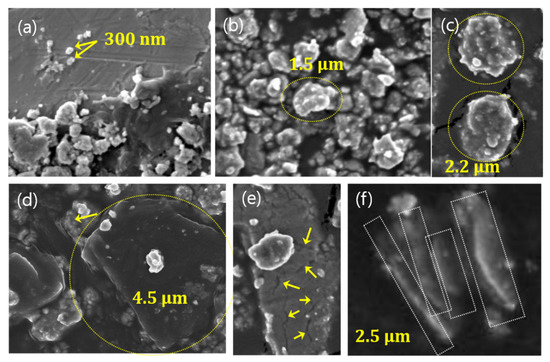
Figure 6.
FE-SEM images of (a) sub-micrometer sized primary particles, (b) secondary particles, aggregated/agglomerated from primary particles, (c) enlarged image of (b), (d) an irregular shaped large Fe lump, (e) a large lump with fine cracks, (f) flat particles by pressure and/or shear stress.
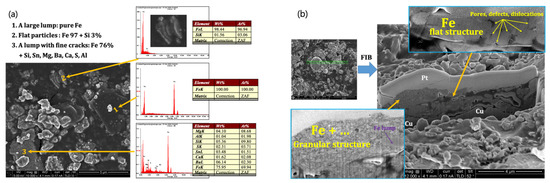
Figure 7.
(a) FE-SEM image of large lumps (1), flat particles (2), a lump with fine cracks (3), showing their constituting elements, (b) microstructure of flat particles (2), showing Fe lumps granules, pores, defects, dislocations.
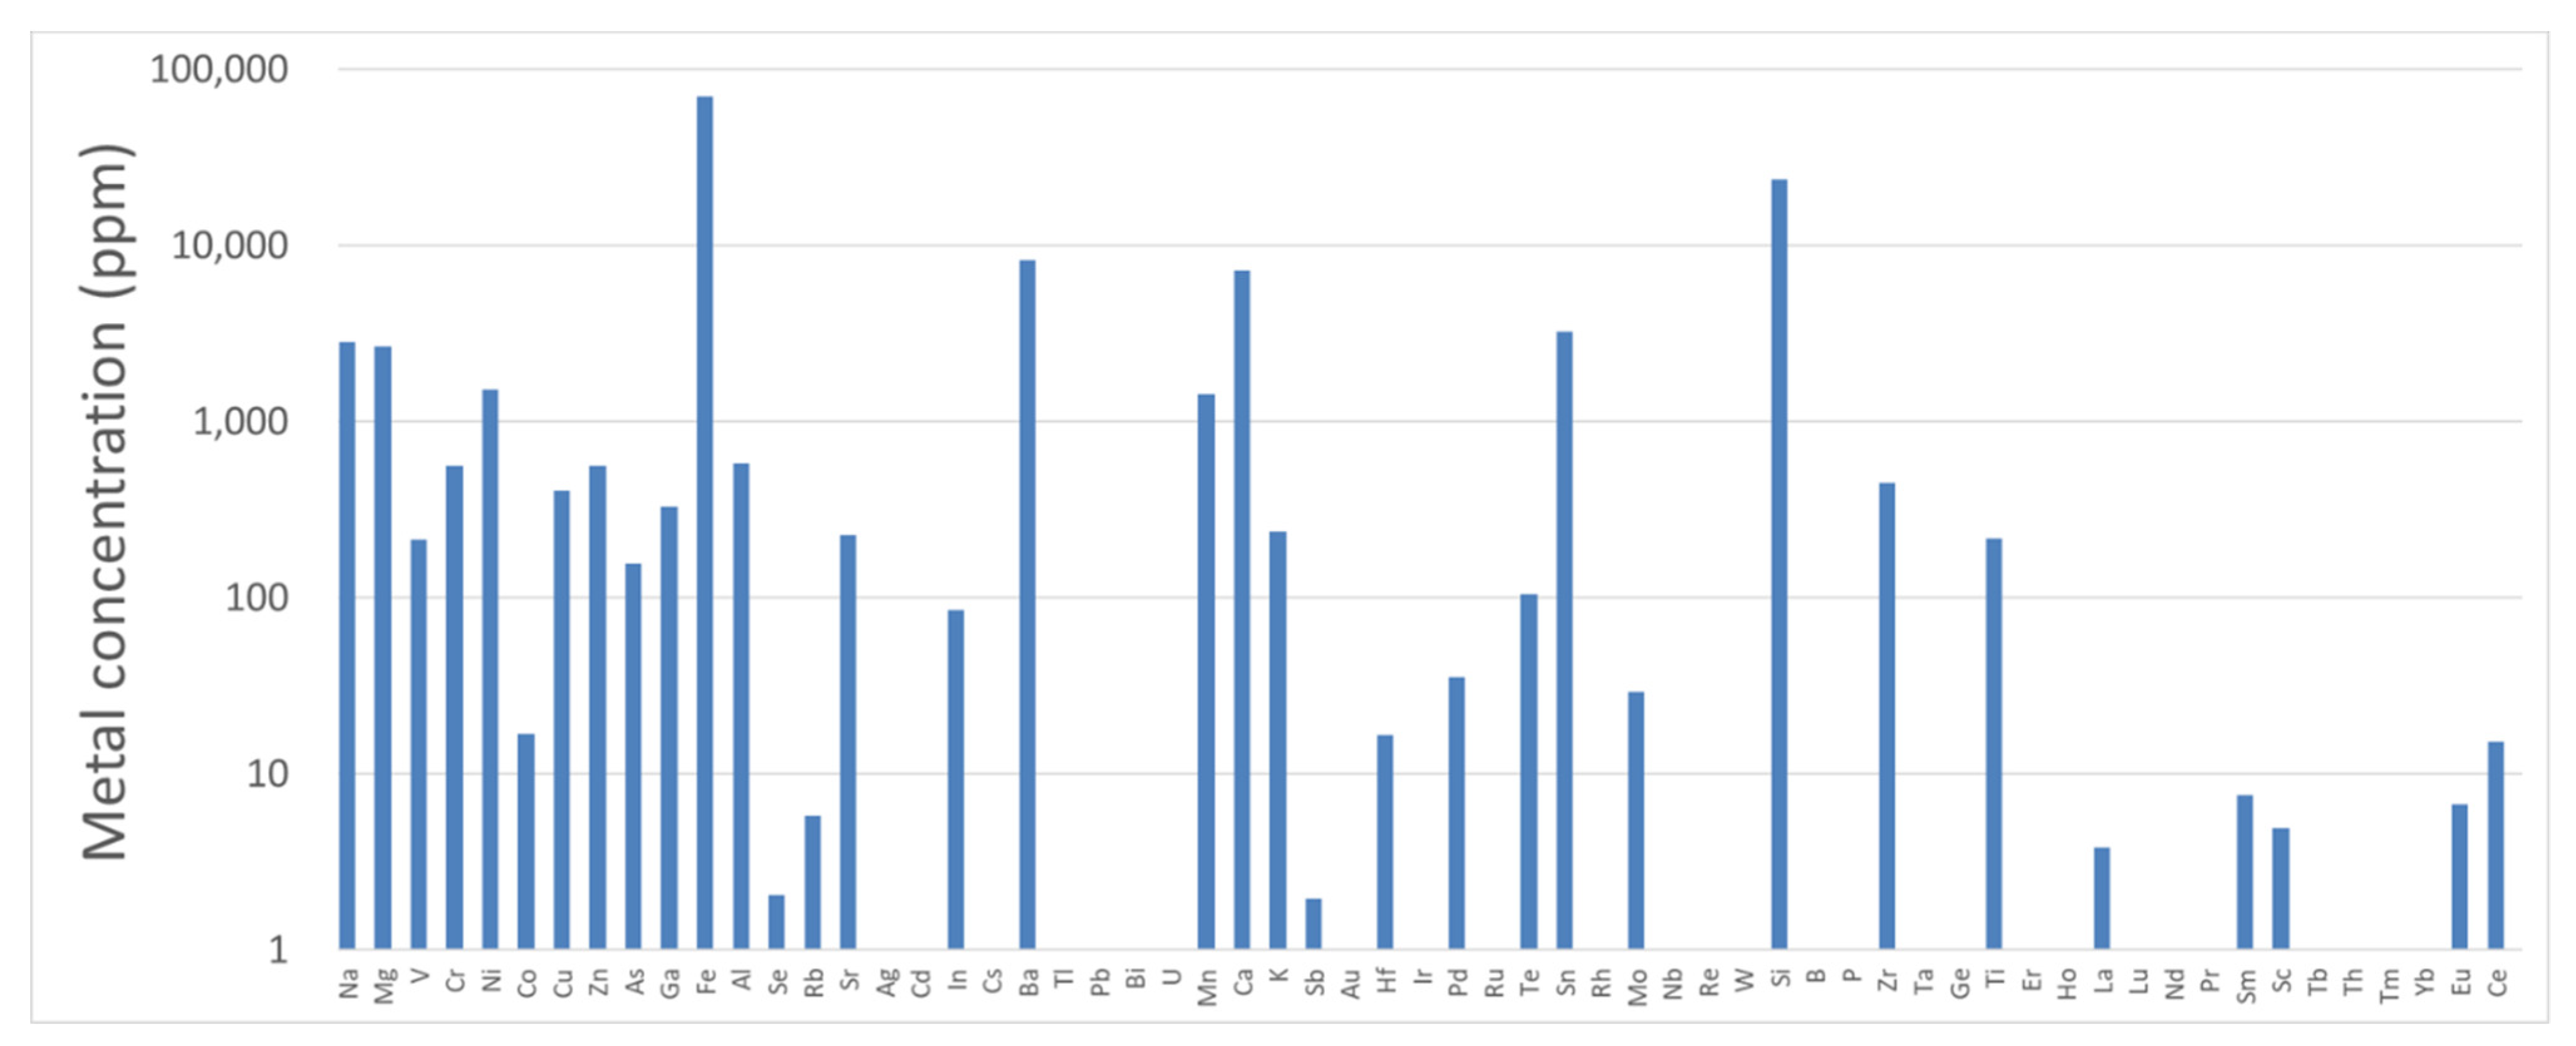
The lumps with fine cracks (Figure 6e/(3) in Figure 7a) and flat particles(Figure 6f/(2) in Figure 7a) might be created by the combination of chemical oxidation/aggregation and abrasive mechanisms between grey iron disc and pads, which can be deduced from EDX and SEM data(Figure 7). In contrast to Fe lump (1), the particles in Figure 6e,f and (2,3) of Figure 7a, include granular particles, of which chemical elements are common in pads, along with small Fe lumps. According to previous work, when organic matters in pads oxidize at high temperature, numerous pitting occurs in the interface between pad and disc, thereby resulting in material removal [28]. The smaller fraction, in this work, appears to be aggregated with Fe lumps, resulting in larger flat (2) and plate-shaped particles (3). Thus, the micron-sized PM, ranging from micrometers to tens of micrometers, seems to be, in part, originated from the aggregates of smaller primary particles with Fe lump as a core. ICP analysis of wear debris sample, randomly collected from filter in the dynamomter, is given in Figure 8. Main element is Fe and detected elements are Na, Mg, Ni, Ba, Ca, Mn, Sn, Si (>1000 ppm); V, Cr, Cu, Zn, As, Ga, Al, Sr, K, Te, Zr, Ti (>100 ppm).

Figure 8.
Chemical analysis results of particulate matter collected by filter in the dynamometer.
4. Discussion
4.1. Surface Profile Analysis
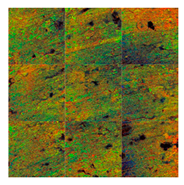
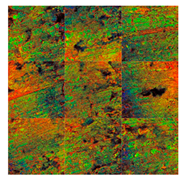
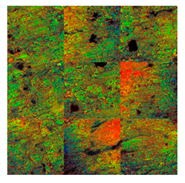
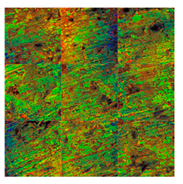
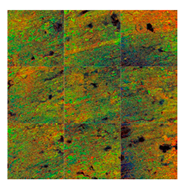
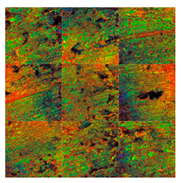
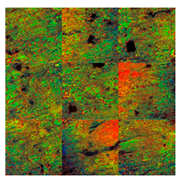
Figure 9a illustrates an example of 3D-surface profile of brake pads worn by dynamometric tests. The surface structure of a tested pads (40 mm × 30 mm) was analyzed for 20 separated sections. In Table 3, a color map of 20 separate sections with respect to relative height was constructed using laser confocal microscope. The red, green, or black areas represent those of high, middle or low heights, respectively. The red area represents that of high height, suggesting the contact plateau. The plateau is well-known to be made by the precipitation of wear debris around reinforcement fiber during braking. On the other hand, the dark area, indicated by black, purple, and blue colors, indicates the lowland, which usually formed by severe abrasion or pull-out. The green area shows the area that undergoes minor abrasion.
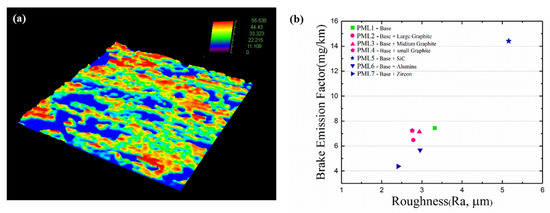
Figure 9.
(a) Typical 3D surface profile in worn surface, (b) relationship between mass-based PM emission factor with respect to surface roughness of worn pad.
Table 3.
Surface analysis results of PML pads.
Figure 9b shows the linear relation between surface roughness and brake emission factor (BEF) of the PML-materials. In this work, area of relative heights does not show a distinctive bearing to emission factor, however, surface roughness shows positively proportional relation to BEF values. According to Park et al. [23], the less aggressive character of non-steel (NS) materials toward grey iron disc, resulting in lower surface roughness in the surface profiles than low-steel. The interpretation also claims that the low emission factor for the NS materials is also related to low surface roughness after driving cycles. In this work, it is shown that rough surface, being direct evidence that abrasion of pads and, probably, disc, is also related to PM emission. Hard abrasive such as SiC induces more abrasive character of wear mechanism than zircon, which generates more resource of airborne particles. Our previous work showed that solid lubricant working at high temperature such as copper and tin reduces the emission [24]. In this work, graphite might replace a role as solid lubricant, however, particle size of graphite does not any variation to surface roughness and PM emission.
4.2. Temperature Effect
In situ time-variation of number- and mass-based particle concentration for each brake stop were plot as a function of disc temperature. The increase in PM emission at elevated temperature in pin-on-disc experiment was reported recently by Alemani et al. [29]. Each of 28 brake stops, separated by intervals between the nearest two stops, in WLTC cycle was selected for temperature measurement. See Figure S10 for WLTC time schedule. The number and mass concentration of particles for each stop were collected using OPS data providing time-dependent data. In Figure 10, the particle number and mass concentration is plot versus average disc temperature (Tdisc). The values for PML-1/-2/-3/-4 increase abruptly above the critical temperature, ~120 °C (#>1.0 × 10⁵ in Figure 10a). The PML-4 material exhibits higher number concentration at high temperature than PML-1/-2/-3 (Figure 10b), which is consistent with time-resolved data, showing nanometer-sized particle emission.
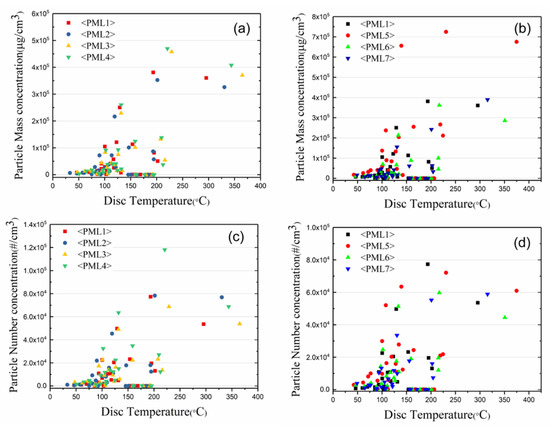
Figure 10.
(a) Particle mass concentration (b) particle number concentration for PML-1/-2/-3/-4, (c) particle mass concentration (d) particle number concentration for PML-1/-5/-6/-7 with respect to disc temperature during dynamometric tests.
Figure 10c,d also show a clear distinction between PM concentration and disc temperature according to the abrasive in the PML-series. The PML-5 and PML-1 (reference) exhibited a distinct difference in particle concentration. The beta-SiC abrasive with sharp facets in PML-5, in particular, induced significant lower critical temperature (~100 °C), beyond which particle emission rises. See Figure S11 for SiC raw material. This result is also well-consistent with time-dependent data in Figure 3a, showing that PM emission of PML-5 is pronounced even in low- and mid-speed regions (1–1000 s). These results confirm the hypothesis that PM emission rises under at severe conditions (high temperature, abrasion wear), which is facilitated by a usage of hard abrasive.
5. Conclusions
In this work, airborne PM emissions, due to brake wear, with respect to various raw materials was investigated under dynamometric analysis. 7 low-steel friction materials, of which constituents (lubricant and abrasive) are varied, were examined by surface topography analysis. Temperature-dependent and time-resolved data show that:
- As for lubricants, particle number concentration is inversely proportional to the size of graphite. Smaller graphite (10 μm) generates more nano-sized particles than that of larger size (700 μm).
- As hardness of abrasive increases (SiC > Al2O3 > ZrSiO4), higher emission factor was obtained, which suggests that abrasive wear directly contributes to emissions, evidenced by surface topology.
- Temperature-dependent data imply that particle emission for SiC abrasive is initiated at lower disc temperature (Tdisc) of ~100 °C, than that for ZrSiO4 (Tdisc >120 °C).
- According to chemical analysis of wear debris, larger micron-sized particle includes fragmented Fe lumps from disc of grey cast iron, whereas smaller particles with various shapes are formed by oxidation and aggregation of nano-sized particles with or without a core of Fe lump.
The PM emission factor in this work should be carefully compared with the other works because the factors is susceptible to particle measurement (optical, electrometer, gravimetric method), collection (impactor, charging/separation, condensation) methods as well as data collection environment (dynamometer, on-road). From the present work, abrasive characteristics of brake pads is crucial to PM emission at high temperature, which exhibits aggressive toward discs of grey cast iron having moderate surface hardness compared to hard coating materials.
Supplementary Materials
The following are available online at https://www.mdpi.com/article/10.3390/lubricants9120118/s1, Figure S1: Time evolution of particle number, mass concentration profiles for PML-1; Figure S2: Time evolution of particle number, mass concentration profiles for PML-2; Figure S3: Time evolution of particle number, mass concentration profiles for PML-3; Figure S4: Time evolution of particle number, mass concentration profiles for PML-4; Figure S5: Time evolution of particle number, mass concentration profiles for PML-5; Figure S6: Time evolution of particle number, mass concentration profiles for PML-6; Figure S7: Time evolution of particle number, mass concentration profiles for PML-7; Figure S8: EDX analysis results of aggregated particles; Figure S9: EDX analysis results of cross-sectioned flat-shaped particles. Figure S10: Time schedule of WLTC driving cycle. Figure S11: Raw materials for brake pads.
Author Contributions
Conceptualization, J.-Y.K. and J.-J.L.; methodology, S.-H.K. and M.H.J.; investigation, S.-H.K., M.H.J., and S.H.H.; writing—original draft preparation, J.K.; writing—review and editing, J.-Y.K., S.-U.K., J.-H.P., and W.S. All authors have read and agreed to the published version of the manuscript.
Funding
This work was financially supported under the program of “Development of the high-performance brake for passenger car and commercial vehicle to reduce particulate matter” (20003598) by Ministry of Trade, Industry, and Energy of Korea.
Institutional Review Board Statement
Not applicable.
Informed Consent Statement
Not applicable.
Data Availability Statement
Not applicable.
Conflicts of Interest
The authors declare no conflict of interest.
References
- Grigoratos, T.; Martini, G. Brake wear particle emissions: A review. Environ. Sci. Pollut. Res. 2015, 22, 2491–2504. [Google Scholar] [CrossRef] [PubMed] [Green Version]
- Hicks, W.; Beevers, S.; Tremper, A.H.; Stewart, G.; Priestman, M.; Kelly, F.J.; Lanoisellé, M.; Lowry, D.; Green, D.C. Quantification of Non-Exhaust Particulate Matter Traffic Emissions and the Impact of COVID-19 Lockdown at London Marylebone Road. Atmosphere 2021, 12, 190. [Google Scholar] [CrossRef]
- Bukowiecki, N.; Lienemann, P.; Hill, M.; Furger, M.; Richard, A.; Amato, F.; Prévôt, A.S.H.; Baltensperger, U.; Buchmann, B.; Gehrig, R. PM10 emission factors for non-exhaust particles generated by road traffic in an urban street canyon and along a freeway in Switzerland. Atmos. Environ. 2010, 44, 2330–2340. [Google Scholar] [CrossRef]
- Jeong, C.-H.; Traub, A.; Huang, A.; Hilker, N.; Wang, J.M.; Herod, D.; Dabek-Zlotorzynska, E.; Celo, V.; Evans, G.J. Long-term analysis of PM2.5 from 2004 to 2017 in Toronto: Composition, sources, and oxidative potential. Environ. Pollut. 2020, 263, 114652. [Google Scholar] [CrossRef]
- Beddows, D.S.C.; Harrison, R.M. PM10 and PM2.5 emission factors for non-exhaust particles from road vehicles: Dependence upon vehicle mass and implications for battery electric vehicles. Atmos. Environ. 2021, 244, 117886. [Google Scholar] [CrossRef]
- Rexeis, M.; Hausberger, S. Trend of vehicle emission levels until 2020—Prognosis based on current vehicle measurements and future emission legislation. Atmos. Environ. 2009, 43, 4689–4698. [Google Scholar] [CrossRef]
- Harrison, R.M.; Allan, J.; Carruthers, D.; Heal, M.R.; Lewis, A.C.; Marner, B.; Murrells, T.; Williams, A. Non-exhaust vehicle emissions of particulate matter and VOC from road traffic: A review. Atmos. Environ. 2021, 262, 118592. [Google Scholar] [CrossRef]
- Harrison, R.M.; Jones, A.M.; Gietl, J.; Yin, J.; Green, D.C. Estimation of the contributions of brake dust, tire wear, and resuspension to nonexhaust traffic particles derived from atmospheric measurements. Environ. Sci. Technol. 2012, 46, 6523–6529. [Google Scholar] [CrossRef]
- Garg, B.D.; Cadle, S.H.; Mulawa, P.A.; Groblicki, P.J.; Laroo, C.; Parr, G.A. Brake Wear Particulate Matter Emissions. Environ. Sci. Technol. 2000, 34, 4463–4469. [Google Scholar] [CrossRef]
- Sanders, P.G.; Xu, N.; Dalka, T.M.; Maricq, M.M. Airborne Brake Wear Debris: Size Distributions, Composition, and a Comparison of Dynamometer and Vehicle Tests. Environ. Sci. Technol. 2003, 37, 4060–4069. [Google Scholar] [CrossRef] [PubMed]
- Kumar, P.; Pirjola, L.; Ketzel, M.; Harrison, R.M. Nanoparticle emissions from 11 non-vehicle exhaust sources—A review. Atmos. Environ. 2013, 67, 252–277. [Google Scholar] [CrossRef] [Green Version]
- Hagino, H.; Oyama, M.; Sasaki, S. Laboratory testing of airborne brake wear particle emissions using a dynamometer system under urban city driving cycles. Atmos. Environ. 2016, 131, 269–278. [Google Scholar] [CrossRef] [Green Version]
- Brunekreef, B.; Forsberg, B. Epidemiological evidence of effects of coarse airborne particles on health. Eur. Respir. J. 2005, 26, 309–318. [Google Scholar] [CrossRef] [PubMed]
- Oberdörster, G.; Oberdörster, E.; Oberdörster, J. Nanotoxicology: An emerging displine evolving from studies of ultrafine particles. Envron. Health Perspect. 2005, 113, 823–839. [Google Scholar] [CrossRef]
- Iijima, A.; Sato, K.; Yano, K.; Kato, M.; Kozawa, K.; Furuta, N. Emission factor for antimony in brake abrasion dust as one of the major atmospheric antimony sources. Environ. Sci. Technol. 2008, 42, 2937–2942. [Google Scholar] [CrossRef] [PubMed]
- Iijima, A.; Sato, K.; Yano, K.; Kato, M.; Tago, H.; Kato, M.; Kimura, H.; Furuta, N. Particle size and composition distribution analysis of automotive brake abrasion dusts for the evaluation of antimony sources of airborne particulate matter. Atmos. Environ. 2007, 41, 4908–4919. [Google Scholar] [CrossRef]
- Baron, P.A.; Willeke, K.; Kulkarni, P. Aerosol Measurement: Principles, Techniques, and Applications, 3rd ed.; Wiley & Sons: New York, NY, USA, 2011; Chapter 2. [Google Scholar]
- Hagino, H.; Oyama, M.; Sasaki, S. Airborne brake wear particle emission due to braking and accelerating. Wear 2015, 334–335, 44–48. [Google Scholar] [CrossRef]
- zum Hagen, F.H.F.; Mathissen, M.; Grabiec, T.; Hennicke, T.; Rettig, M.; Grochowicz, J.; Vogt, R.; Benter, T. Study of Brake Wear Particle Emissions: Impact of Braking and Cruising Conditions. Environ. Sci. Technol. 2019, 53, 5143–5150. [Google Scholar] [CrossRef]
- PMP-Group Particle Measurement Program (PMP) of the United Nations Working Party on Pollution and Energy (UNECE–GRPE). Available online: https://unece.org/transport/documents/2021/02/standards/un-regulation-no-154-worldwide-harmonized-light-vehicles-test (accessed on 1 December 2021).
- Mathissen, M.; Grochowicz, J.; Schmidt, C.; Vogt, R.; Farwick zum Hagen, F.H.; Grabiec, T.; Steven, H.; Grigoratos, T. A novel real-world braking cycle for studying brake wear particle emissions. Wear 2018, 414–415, 219–226. [Google Scholar] [CrossRef]
- Chan, D.; Stachowiak, G.W. Review of automotive brake friction materials. Proc. Inst. Mech. Eng. D J. Automob. Eng. 2004, 218, 953–966. [Google Scholar] [CrossRef]
- Park, J.; Joo, B.; Seo, H.; Song, W.; Lee, J.J.; Lee, W.K.; Jang, H. Analysis of wear induced particle emissions from brake pads during the worldwide harmonized light vehicles test procedure (WLTP). Wear 2021, 466–467, 203539. [Google Scholar] [CrossRef]
- Kim, S.; Shim, W.; Kwon, S.-U.; Lee, J.-J.; Seo, M.-W.; Kim, J.-K.; Pee, J.-H.; Kim, J.-Y. The impact of composition in non-steel and low-steel type friction materials on airborne brake wear particulate emission. Tribol. Lett. 2020, 68, 118. [Google Scholar] [CrossRef]
- Osterle, W.; Prietzel, C.; Kloß, H.; Dmitriev, A.I. On the role of copper in brake friction materials. Tribol. Int. 2010, 43, 2317–2326. [Google Scholar] [CrossRef]
- Cho, M.H.; Ju, J.; Kim, S.J.; Jang, H. Tribological properties of solid lubricants (Graphite, Sb2S3, MoS2) for automotive brake friction materials. Wear 2006, 260, 855–860. [Google Scholar] [CrossRef]
- Gilardi, R.; Alzati, L.; Thiam, M.; Brunel, J.-F.; Desplanques, Y.; Dufrénoy, P.; Sharma, S.; Bijwe, J. Copper Substitution and Noise Reduction in Brake Pads: Graphite Type Selection. Materials 2012, 5, 2258–2269. [Google Scholar] [CrossRef] [Green Version]
- Kukutschová, J.; Moravec, P.; Tomásek, V.; Matejka, V.; Smolík, J.; Schwarz, J. On airborne nano/micro- microsized wear particles released from low-metallic automotive brakes. Environ. Pollut. 2011, 159, 998–1006. [Google Scholar] [CrossRef] [PubMed]
- Alemani, M.; Wahlström, J.; Olofsson, U. On the influence of car brake system parameters on particulate matter emissions. Wear 2018, 396–397, 67–74. [Google Scholar] [CrossRef]


Publisher’s Note: MDPI stays neutral with regard to jurisdictional claims in published maps and institutional affiliations. |
© 2021 by the authors. Licensee MDPI, Basel, Switzerland. This article is an open access article distributed under the terms and conditions of the Creative Commons Attribution (CC BY) license (https://creativecommons.org/licenses/by/4.0/).