Article

A Digital Twin for Friction Prediction in Dynamic Rubber Applications with Surface Textures

by
Valentina Zambrano
1,
Markus Brase
2,
Belén Hernández-Gascón
1,*,
Matthias Wangenheim
2,
Leticia A. Gracia
1,
Ismael Viejo
1,
Salvador Izquierdo
1 and
José Ramón Valdés
1
1
Instituto Tecnológico de Aragón—ITAINNOVA, C/María de Luna 7-8, 50018 Zaragoza, Spain
2
Institut für Dynamik und Schwingungen—IDS, Leibniz Universität Hannover—LUH, An der Universität 1, 30823 Garbsen, Germany
*
Author to whom correspondence should be addressed.
Lubricants 2021, 9(5), 57; https://doi.org/10.3390/lubricants9050057
Submission received: 30 March 2021 / Revised: 15 May 2021 / Accepted: 16 May 2021 / Published: 20 May 2021
(This article belongs to the Special Issue Machine Learning in Tribology)

Abstract

:
Surface texturing is an effective method to reduce friction without the need to change materials. In this study, surface textures were transferred to rubber samples in the form of dimples, using a novel laser surface texturing (LST)—based texturing during moulding (TDM) production process, developed within the European Project MouldTex. The rubber samples were used to experimentally determine texture-induced friction variations, although, due to the complexity of manufacturing, only a limited amount was available. The tribological friction measurements were hence combined with an artificial intelligence (AI) technique, i.e., Reduced Order Modelling (ROM). ROM allows obtaining a virtual representation of reality through a set of numerical strategies for problem simplification. The ROM model was created to predict the friction outcome under different operating conditions and to find optimised dimple parameters, i.e., depth, diameter and distance, for friction reduction. Moreover, the ROM model was used to evaluate the impact on friction when manufacturing deviations on dimple dimensions were observed. These results enable industrial producers to improve the quality of their products by finding optimised textures and controlling nominal surface texture tolerances prior to the rubber components production.

1. Introduction

1.1. Surface Texturing in Tribological Applications

In most dynamic rubber applications, low friction is desired to increase the energy efficiency of the tribological system. Therefore, improved friction behaviour is an important design objective in the development process of components like dynamic seals. Within the industrial and scientific communities, significant improvements in dynamic seal performance have been achieved through a series of technological advances, such as the introduction of low-friction polymers [1]. However, this approach is limited by the operating conditions, such as temperatures or the chemical resistance of the new materials.
Surface texturing is an effective method to modify the friction level without changing materials or the lubricant in the dynamic seal contact. An early method of surface texturing, used to improve the tribological performance of mechanical components, is cylinder honing in internal-combustion engines [2]. Further experimental and theoretical studies revealed a significant reduction in friction due to grooves [3] and, in particular, micro dimples in the reciprocating contact of piston rings and cylinder bores of combustion engines [4,5].
The analysis of laser surface textured (LST) piston rings have been extended to model-based and experimental investigations of mechanical seals, identifying optimised dimple dimensions with lowest friction for specific operating conditions [6,7]. In this context, the dimples are advantageous as they serve as hydrodynamic bearings and exhibit the ability to store lubricant [8]. Moreover, the surface textures reduce the real area of contact and trap wear particles [9,10].
Other authors even highlighted the positive effect of surface textured rubber seals in soft elasto-hydrodynamic lubrication (SEHL), resulting in a significant friction reduction compared to the untextured references [11,12,13]. However, it has also been found that an inappropriate selection of the surface texture dimensions leads to a detrimental increase in friction due to excessive enlargement of cavitation zones in the lubricant, causing a reduced local film thickness and load carrying capacity [14,15]. Furthermore, the influence of the real dimple shape of textured mechanical seals has been identified as an important factor that needs to be considered for valid friction determination [16].

1.2. Reduced Order Modelling

The introduction of extended methods, based on artificial intelligence (AI), which go further than usual tribological measurements, is beneficial for friction predictions. The selected AI technique is based on the digital twin (DT) paradigm, i.e., a virtual representation of reality [17,18,19]. Several techniques belong within the DT paradigm, the most popular being Reduced Order Modelling (ROM) [20,21] and machine learning (ML) [22]. Both techniques are based on mathematical models for real-time simulations. In particular, ROM consists of a set of numerical strategies for multi-variable problem simplification to solve complex numerical systems and it aims to describe and, hence, predict a system’s behaviour through a mathematical approximation, by preserving its main characteristics, as described in [23]. Tensor rank decomposition (TRD) approach is a non-intrusive, i.e., completely data-driven, method that allows to describe a complex system’s behaviour, where its variables influence each other, as a simplified mathematical function that describes each variable’s effect separately. As previously detailed in [23], TRD is based on the assumption that a problem of N, not necessarily independent, variables can be rewritten as the product of N one-dimensional functions, one for each of the variables of the system, as shown in Equation (1):
F ( v 1 , , v N ) = m = 1 M α m n = 1 N f m , n ( v n )
where M is the order of approximation of the ROM model and α m , m = 1 , , M are weighting coefficients. The functions f m , n , in their most simple form, are piecewise linear functions; hence the adjustment parameters are the positions and the values at which the functions change slope. The adjustment of all these parameters is carried out through a least square optimisation.
The first term of the sum in Equation (1) represents a first approximation of the system, being its corresponding coefficient α 1 the largest one, while the following terms would be corrections to it and will generally have lower coefficient values unless the correction only applies to a specific outliers population and does not affect the general trend of data.

1.3. Objectives

Although many experimental and model-based studies have been accomplished on the subject of friction reduction of surface textured components, all investigations require extensive series of experiments or complex contact- or fluid-mechanic simulations. Therefore, this paper aims to introduce a novel approach, in which a limited number of friction measurements of surface textured rubber samples are combined with ROM to identify optimal surface textures as a function of the prevailing operating conditions in real-time. Besides the nominal dimple texture parameters, the real dimple dimensions, defined by diameter, distance, and depth, are taken into account for the friction values computed by the ROM. Therefore, ROM technique is further used to determine nominal surface texture values uncertainties for valid friction prediction.

2. Materials and Methods

The following Sections are dedicated to the description of the experimental studies and the used software, data analysis (dataset publicly available under [24]), and statistical tools.

2.1. Rubber Specimen Geometry and Surface Texture Parameters

The objective of the experimental testing procedure is to measure the friction between surface textured rubber specimens and a rotating counter surface by utilising a pin-on-disc tribometer. The grinded steel counter surface exhibits a surface roughness of R a = 0.50 μ m, but no further texturing. Due to the variety of seal geometries available on the market, a simplified rubber sample geometry was chosen for the experiments, in order to test the surface texture-induced friction variation independent of a specific seal geometry. The corresponding geometry of the rubber samples is shown in Figure 1a.
A 2 mm thick layer of a fluorelastomer with a shore hardness of 80A (FKM 80A) is vulcanised onto a blue anodised aluminium specimen holder. Furthermore, the contact zone of the 30 mm diameter rubber sample has a spherical shape to avoid edge effects in the dynamic contact.
The surface textures are applied to the contact areas of the rubber samples in the form of deterministic positioned dimples, see Figure 1b. The geometry of the circular dimples is defined by the diameter, the distance and the depth. The corresponding parameters and the alignment of the dimples are shown in Figure 1c. During the test procedure, the positioning of the dimples, within a squared area, was rotated by an angle of ϕ = 45 , since preliminary experiments showed about 20% greater friction reduction in this arrangement compared to ϕ = 0 . The reason for this is the avoidance of continuous flow channels without dimples in the direction of relative motion for ϕ = 45 . The angle ϕ between the square shaped texture arrangement and the relative velocity vector is visualised in Figure 1c.
In order to perform the experiments, test specimens with eight different surface textures were manufactured by texturing during moulding (TDM). The associated sample number i and the nominal texture parameters are listed in Table 1.
The parameter range of the dimple dimensions was selected to ensure a transferability of the textures to dynamic seal applications. For example, if the diameter of a dimple is larger than the contact width of a seal, the system would leak. Since the contact width of many lip seals is only 0.80 mm or less [25], the maximum size of the dimple diameter and distance was set to 300 μ m. In contrast, e.g., the lower limit of the dimple diameter of 100 µm was determined by the accuracy of the LST process of the TDM manufacturing method. Based on the texturing results of the rubber samples, the transfer of the textures to real seals has already been successfully realised, but will not be discussed within the scope of this work.
The design of experiment (DoE) on the variation of the surface texture parameters is chosen according to the requirements of the ROM, described in Section 2.4. While seven specimens exhibit a dimple texture, one specimen was produced without dimples to serve as a reference for the dimple-induced friction variation of the other textures. The surface roughness of all eight samples was adjusted to an identical value of R a = 0.50 μ m by laser surface processing of the mould. Therefore, the influence of dimple textures on friction is investigated independently of different surface roughnesses.

2.2. Test Rig Setup and Experimental Procedure for Determining the Coefficient of Friction

A pin-on-disc tribometer is utilised to measure the friction forces between the rubber specimens and the rotating steel counter surface. The design of the test rig is shown in Figure 2a.
The rotation of the counter surface is realised by a servomotor. The force sensors measure both the force F N in the normal direction of the sample, as well as the friction force F F in the circumferential direction of the rotating counter surface, compare Figure 2c. The rotational speed n of the counter surface and the normal force F N are kept constant during each measurement, in order to measure quasi-stationary friction values under steady operating conditions. Each relative velocity v r , specified in Table 2a, is tested at each of the 3 different contact pressure levels p c , m a x , given in Table 2b.
The relative velocity v r between the rubber specimen and the counter surface is equal to the circumferential velocity v c at the point of contact: v r = v c . The velocity v r is calculated from the rotational speed n of the counter surface and the distance r = 100 mm between the shaft centre and the contact point, see Figure 2c, as defined in Equation (2).
v r = ω r = 2 π n r
The focus of this paper is on dynamic friction, so static friction is not investigated. Thus, the rotational speed n of the servomotor was varied between 0.6 and 24.0 min 1 , resulting in relative velocities v r of 6 to 251 mm/s.
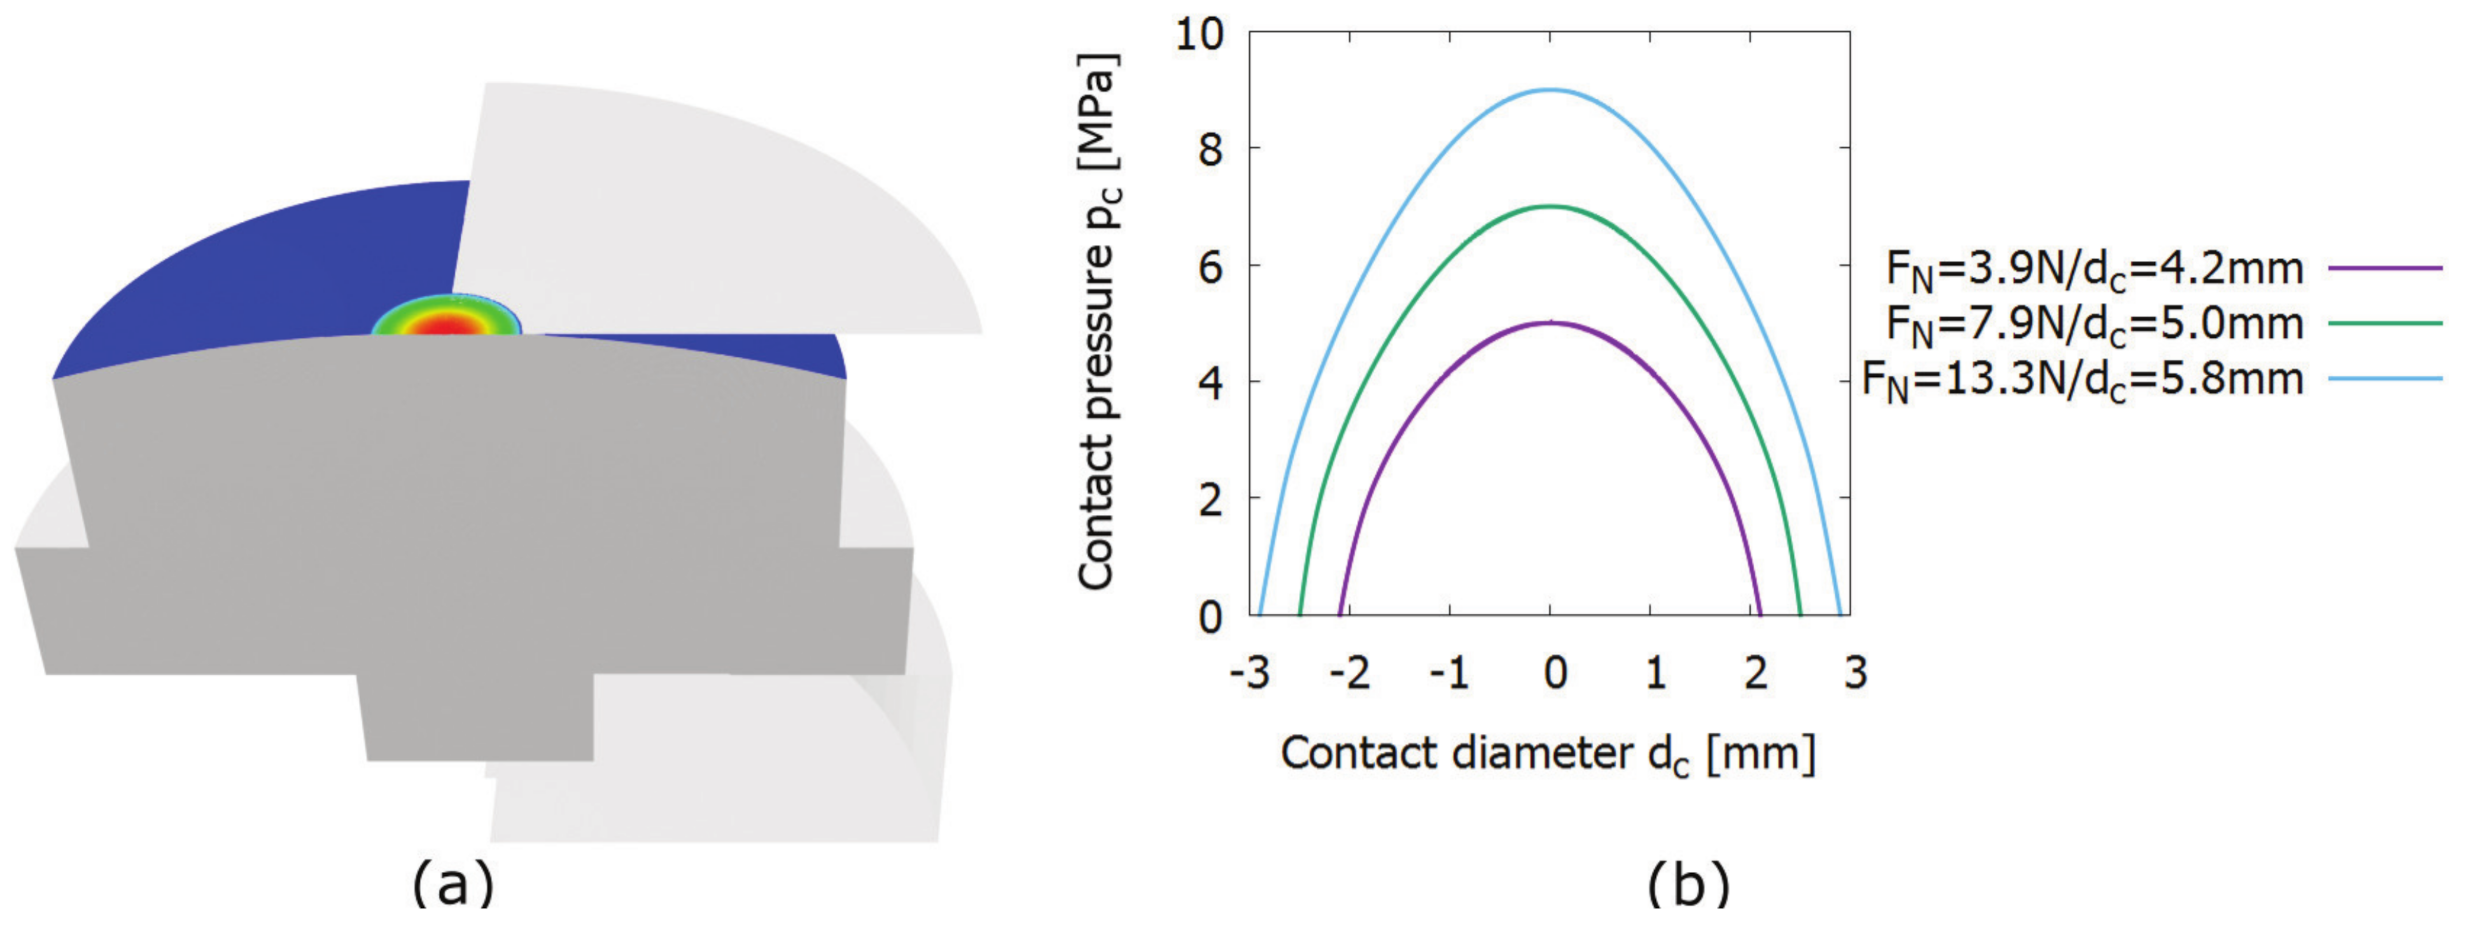
The normal forces F N were selected to achieve maximum contact pressures p c , m a x of 0.5, 0.7, and 0.9 MPa, which are typical values in pneumatic seal applications [26]. Because of the spherical shape of the rubber specimen, the variation of the normal force F N influences not only the magnitude of the parabolic contact pressure distribution p c , but also the dimensions of the nominal contact area between the rubber sample and counter surface, see Figure 3b. Therefore, not only the maximum of the contact pressure distribution p c , m a x is specified in Table 2b, but also the corresponding contact diameter d c and the respective circular nominal contact area A n o m i n a l . The contact pressure distribution p c and the contact diameter d c are computed by finite element analyses, taking into account the rubber thickness of 2 mm. Within the static simulations, the rubber sample is pressed against the counter surface with the defined normal force F N , see Figure 3a. At this, the coloured spherical contact area of the rubber specimen is brought into contact with the grey flat counter surface, resulting in the specified contact area and contact pressure p c .
All components are modelled as 2D axisymmetric parts. A hyper elastic Mooney-Rivlin material behaviour is assigned to the 2 mm layer of the FKM80A rubber material, which is specified by the temperature-dependent material parameters C 10 = 1,442,425.12, C 01 = 208,308.34, D = 6.059933161 × 10 10 , considering a Poisson’s Ratio of 0.4995. For both measurements and simulations, the temperature is equal to 20 C. The material of the anodised aluminium sample holder is modelled as pure elastic part with a Young’s modulus of 70 GPa and a Poisson’s Ratio of 0.34. The counter surface is defined as rigid part.
All experiments are performed with an adherent silicone grease OKS 1155 in the dynamic contact, which exhibits a base oil viscosity of 100 mm 2 /s at 25 C [27]. The same lubrication and conditioning procedure was applied to every rubber specimen before the actual friction measurements to ensure comparability between the results. Every single measurement lasts for 5 s and each measurement was repeated 5 times to ensure a statistical certainty. In order to generate the quasi-stationary friction values μ u n t e x t for rubber specimen 8 and μ t e x t , i for rubber samples i = 1–7, the mean value of each measurement is calculated over the entire measuring period of 5 s. The friction coefficients μ u n t e x t and μ t e x t , i are evaluated to identify dimple textures with the highest friction reduction potential. In addition, the results are further processed to generate the ROM model.

2.3. Method of Measurement for Real Dimple Dimensions

An additional important aspect for the determination of the influence of the dimple textures on friction are the real dimensions of the dimples. While the nominal values of the investigated textures are given in Table 1, the real values of diameter, distance and depth vary due to imperfections in the innovative industrialised TDM production process of the rubber specimens. During this process, the negative of the desired texture is applied to a mould by LST ablation. A 5-axis 100 W pico-second laser is utilised for this purpose. During the injection moulding and vulcanisation procedure, the texture is directly transferred from the mould to the rubber surface. Protrusions in the mould become dimples in the elastomer. Due to imperfections in the laser machining of the mould, both a deviation from the nominal dimple parameters and ring-shaped cavities in the peripheral areas of the dimple valleys are identifiable, see Figure 4b. These deviations mainly result from re-solidifying metal vapours on the surface of the metallic vulcanisation mould.
In order to measure and visualise the actual dimple texture dimensions, a 3D optical microscope, based on focus-variation, is used. Figure 4a shows an exemplary 4 × 4 mm surface scan of rubber specimen 6 with a nominal dimple diameter of 300 μ m, a distance of 200 μ m and a depth of 30 μ m.
Figure 4b shows the corresponding line scan as height profile h over the measuring length l, which is measured through the centre of four adjacent dimples. The positions that are measured to determine the real dimple dimensions of diameter, distance, and depth are marked in the height profile. To ensure accurate measurement results of the dimple dimensions, the curvature of the contact surface of the rubber samples was subtracted, resulting in the flat surface scan depicted. Beyond this, no corrections were made to the surface scans. The dimple dimensions were measured at 16 different positions of the textured area of each rubber sample. The mean values of the 16 measurements and the corresponding dimensionless texture parameters are listed in Table 3.

2.4. Software Development for Reduced Order Modelling

The software library (Twinkle), implemented and used to compute the ROM models, is available on GitHub platform [28] and described in [23], where its basic concept, structure and environmental dependencies are detailed.
Within this study, two separate ROM models were computed: one for untextured and one for textured tribometer samples data, consisting of 24 and 168 data points, respectively. The reliability of the two obtained ROM models was then validated using Python Scikit-learn [29] (version 0.22.1) k-fold cross validation technique, where a train-test procedure is performed k-times, randomly extracting a k-fraction sub-dataset for testing [30]. For the validation, the parameter k was set to 10, so that 10 different train-test validations were performed, randomly selecting the corresponding 90%–10% data fractions each time a new validation was performed.
Moreover, minimum values of the ROM function, i.e., Equation (1), were obtained using the ALGLIB Free Edition library [31], version 3.14.0, to find the surface texture dimensions that allow minimising friction, as described in Section 3.5.
Twinkle library can be described through the supervised learning algorithm concept in ML [32,33]. The input values used for ROM construction were the dimple dimensions, i.e., depth, diameter and distance, when available, together with pressure and velocity (please refer to Table 1 and Table 2 or the available dataset under [24]), the output being the experimentally measured friction coefficient. Within the scope of this paper Equation (1) would represent the friction coefficient, expressed as the sum of 2 or 17 terms (in case of untextured or textured surface data, respectively). Each term being the product of one-dimensional functions, i.e., one function for each input separately, as shown for simplicity in Equation (3) for the untextured case.
μ ( p r e s s u r e , v e l o c i t y ) = α 1 [ f 1 ( p r e s s u r e ) f 1 ( v e l o c i t y ) ] + α 2 [ f 2 ( p r e s s u r e ) f 2 ( v e l o c i t y ) ]
where α 1 and α 2 are the weighting coefficients of each computed term. The functions f 1 and f 2 are one-dimensional piecewise linear functions that describe the impact, on the friction outcome, of each input separately.

2.5. Reduced Order Modelling Data Pre-Processing for Friction Reduction

The friction variations (in%) obtained with the introduction of a dimple texture on the rubber surface are evaluated using Equation (4) in order to quantify the surface texture-induced friction variations.
Δ μ = 100 μ u n t e x t μ t e x t , i μ u n t e x t %
In Equation (4) textured cases are compared to their corresponding untextured result, so that a negative value suggests a friction increase and a positive one reveals a friction reduction.
The final Δ μ prediction was obtained using Equation (4), where the μ u n t e x t and the μ t e x t , i values, predicted by the ROM models, were used, instead of using the experimentally measured results.
The two datasets, prepared and used in the statistical analysis, were created from two data samples of 48 data points each, using Python NumPy version 1.18.1 [34] and SciPy version 1.4.1 [35] libraries, as described in Section 2.6 and Section 3.3.

2.6. Statistical Analysis of Real Dimple Dimensions

Due to manufacturing tolerances, the real dimple dimensions are not equal to the nominal ones. Experimental data were used to extract statistical information from 16 measurements of geometrical parameters of the textured surface, i.e., mean values and standard deviations for the three geometrical parameters were identified: dimple depth, diameter, and distance. The measuring procedure and mean values are described in Section 2.3 and Section 3.1, respectively. By comparing the results to a foreseen normal distribution centred on the nominal value, having as standard deviation the value obtained from the different repetitions, it was possible to infer the type of probability density function (PDF) of each of the studied parameters.
Once the PDFs were known, the dimple depth was varied separately, while diameter and distance were varied together, as their variations are not independent and occur in the same plane, as defined by the textured area (Section 3.1). To do that, not all data were taken into account, but only those dimple parameters whose variations fell within the ROM’s definition limits, minimum and maximum values in Table 1 and Table 2, which resulted in 48 data points for both datasets, that were obtained when vertical, i.e., depth, and horizontal, i.e., diameter and distance, variations were applied.
The PDFs were hence created by means of a Python script and were used to generate the above mentioned datasets of 48 data points each, as it follows. Each original point was replicated 100 times where the nominal values were changed accordingly to their evaluated PDFs and a final amount of 4800 points were obtained. As mentioned before, the described approach was performed two times: one repeating depth values only and a second time replicating diameter and distance values together. Since dimple diameter and distance are dependent magnitudes, these were made to vary accordingly to one another as follows: at first a new diameter value was randomly generated through the known PDF, then the cumulative density function (CDF) was obtained for the specific diameter value and the corresponding distance value was calculated as the value holding the complement of the CDF in the distance PDF.
The new obtained dataset contains input parameters statistical fluctuations and was used to perform ROM predictions on the enlarged sets of points, where the dimple values experimental variations on dimple dimensions’ nominal values are taken into account. The effects on friction due to the experimental texturing deviations were then analysed and a t-Student test was used for a statistical comparison of the obtained results to an ideal PDF around nominal surface texture values, as described in Section 3.4.

3. Results

In the following subsections the results obtained from the experimental tribotests and dimple dimensions nominal values assessment, the data pre-processing and the statistical analysis of textures dimensions are detailed.

3.1. Measurement Results of the Real Dimple Dimensions and Definition of Dimensionless Dimple Parameters

The aim of the real dimple dimensions measurement procedure, which has been previously described in Section 2.3, is the identification of the effective texture geometry. While the real dimple diameter and depth reveal larger values compared to the nominal dimensions, the dimple distances are smaller than the nominally specified values, compare Table 1 and Table 3.
In addition to the diameter, distance, and depth dimple parameters, the dimensionless aspect ratio and textured area (equal to area density), which are often referred in literature [36,37,38], are further specified in Table 3. The aspect ratio is the quotient of the dimple depth and the dimple diameter and varies between 0.04 and 0.11 for the analysed textures. The area density is equal to textured area percentage. It is calculated by the quotient of the textured area A t e x t u r e d and the nominal circular contact area A n o m i n a l , which are both visualised in Figure 5.
The area density of the studied textures varies between 9% and 55%. Despite the fact that the three different normal forces F N analysed result in three different nominal contact areas A n o m i n a l , the percentage textured area is independent of the nominal contact area A n o m i n a l , since more dimples come into contact with increasing normal force F N , compare also Table 2b.

3.2. Reduced Order Modelling on Friction Coefficient Data

The two ROM functions (please refer to Equations (1) and (3)), obtained for untextured and textured friction coefficient datasets, converged to a stable solution, using only 2 and 17 terms, respectively. In order to assess the correctness and precision of the ROM results, the predicted value is compared to the corresponding experimental one, as ideally, both should be the same. The prediction lines are plotted, for both untextured and textured ROM models, in Figure 6a,b.
From Figure 6a,b it is possible to conclude that the ROM prediction is extremely accurate, being the obtained ROM models’ standard deviations σ u n t e x t = 0.0014 and σ t e x t = 0.0012 for untextured and textured data, respectively, and both regression lines (dashed black) match the goal prediction line (solid red).
Both ROM models were validated using the k-fold cross validation technique (see Section 2.4). The results obtained for the R 2 are shown in Table 4a,b for untextured and textured data, respectively.
Table 4a,b show that for both ROM models the results of the validation are very precise and that there is always an excellent correlation between the input data, i.e., untextured or textured friction coefficient data (available under [24]), and the ROM prediction.

3.3. Reduced Order Modelling on Pre-Processed Data for Friction Variations

As described in Section 2.5, the friction variations were computed according to Equation (4), both for experimental and ROM predicted data. Similarly to Section 3.2, a prediction line was obtained to assess the accuracy of the results, obtained as the combination of the two (untextured and textured) ROM models. The results are shown in Figure 7.
From Figure 7 it is observed that the ROM prediction is highly accurate, since the regression line (dashed black) is highly comparable to the goal prediction (solid red).
Moreover, an error propagation was performed on the friction percent variation variable (Equation (4)), in order to assess the maximum error assumed by the predictive model. For this purpose, experimental deviations on friction measurements were not included, since these are not considered intrinsic properties of the prediction accuracy, but depend on the a-priori goodness of the dataset solely. The results obtained when taking into account both the error propagation on Δ μ and the standard deviation obtained for the 2-ROM prediction, i.e., σ = 1.4412 as shown in Figure 7, show values between 2% and 9%, with a mean value of 3% and 95% of data with a prediction deviation below 5%. Moreover, a study was performed to check the impact that each input parameter has on the measured friction, according to Equations (1) and (3), as shown in Figure 8 for textured ROM.
The one-dimensional functions (specified in Equation (1)) for the textured ROM, shown in Figure 8, represent the impact of each input on the friction variation. The textured ROM shows α 1 = 46.0479 for the first term (see Equations (1) and (3)), being its weighting factor one or two orders of magnitude higher than the remaining terms. The first term of the ROM series expansion can be, hence, considered a fair approximation of the system, where other terms are corrections to it, as described in Section 1.2. From Figure 8 one can see that bigger friction variations occur at extreme surface texturing parameters, e.g., smaller dimple depth and bigger diameter values.

3.4. Statistical Analysis Results of Real Dimple Dimensions

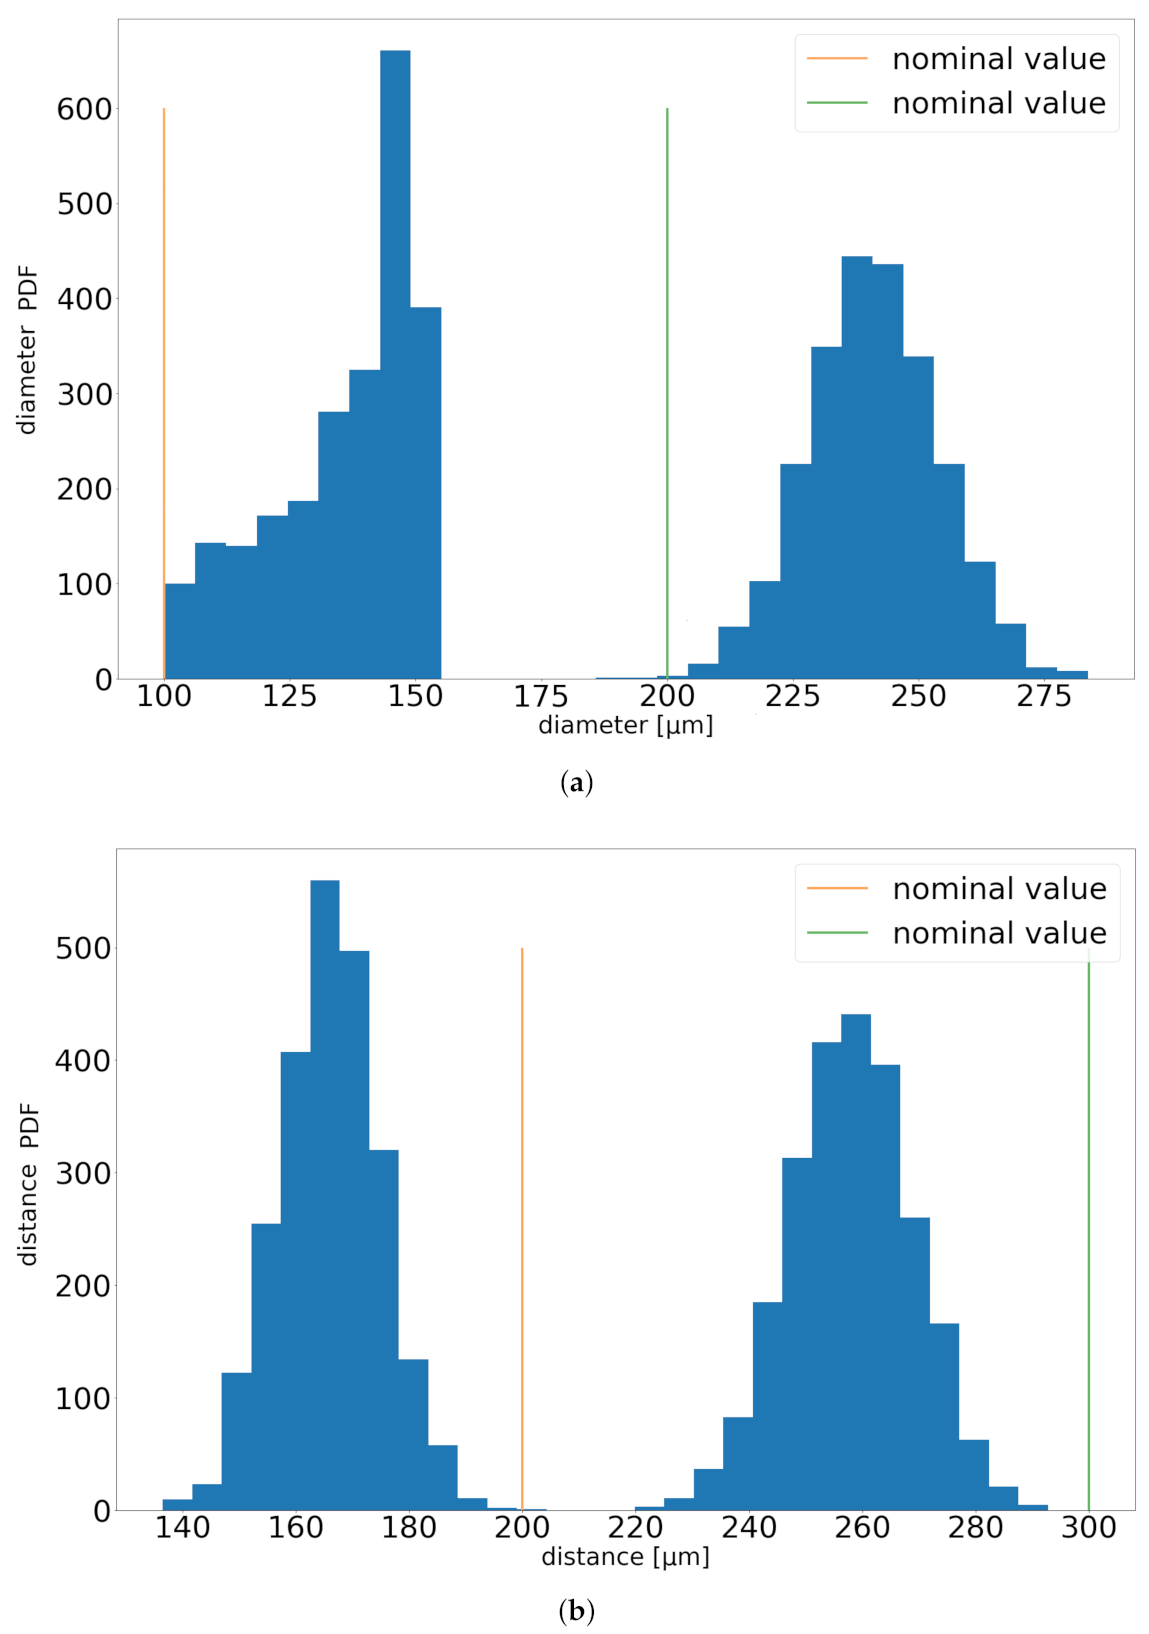
As described in Section 2.6, PDFs were extrapolated for all texture parameters and were used to assess the measured differences from the desired nominal dimple values. The observed variations from the nominal dimple dimensions, described in Section 2.3, were introduced into the datasets in order to predict the corresponding friction variation using the previously computed ROM. The observed PDFs were normal distributions for both dimple depth and distance, while for diameter a skewed normal distribution was observed. dimple depth PDF showed a right shift of the mean equal to 3 μ m and a standard deviation equal to 1.5 μ m. Concerning the distance, the right shift of the mean was equal to 41 μ m and 37 μ m for corresponding nominal values of 200 μ m and 300 μ m, with a standard deviation of 13 μ m and 9 μ m, respectively. These findings led to significant differences in observed friction values, which means that deviations from nominal texture values, shown in Figure 9 and Figure 10a,b, do actually affect friction as observed in Figure 11a,b.
A ROM model allows verifying that the introduction of a statistical noise on nominal surface texture values affects friction, as shown in Figure 11a,b. From these Figures it is possible to observe significant variations in friction PDFs distributions when depth or diameter and distances, respectively, vary from nominal values, and to compare the obtained friction distribution to a normal PDF with zero mean and σ = 0.01.
A two-tailed t-Student test was performed to check the compatibility of the two PDFs, i.e., the noisy nominal values friction distribution (orange) and the ideal friction distribution (green), shown in Figure 11a,b. The test result showed a statistically significant difference between the noisy and the ideal PDF in case of dimple diameter-distance variations, according to what can be expected from Figure 9 and Figure 10a,b.
As previously described in Section 2.5, two expanded datasets were generated introducing statistical noise to the textured data sample by varying the nominal dimple parameters (i.e., depth, diameter, and distance) according to the obtained PDFs. When depth was made to vary, only values equal to 20 μ m could be used; in fact, nominal depth values of 10 μ m and 30 μ m would cause friction values to fall outside the ROM domain if a PDF was applied to generate data around these values. In this case the corresponding ranges for dimple diameter and distance were 200 μ m and 200–300 μ m, respectively. For the second dataset, given the ROM definition domain, feasible dimple diameter and distance ranges resulted in 100–200 μ m and 200–300 μ m, respectively, corresponding to depth values of 10 μ m only. It is important to remark that, in this case, given the geometrical definition of the dimples, diameter and distance are inversely correlated and that the two PDFs are very different, being the first one a skewed distribution and the second a normal one (please refer to Section 2.5 for method details).
Figure 12a,b show the findings for the friction prediction when the geometrical parameters of the seals deviate from nominal values.
According to the results shown in Figure 12a,b, when the textured ROM was evaluated on the expanded noisy dataset, friction prediction turned out to be completely affected by the statistical nominal texture values deviations. Once again one can observe that when diameter and distance were made to vary, these variations produced big uncertainties on the predicted friction values and statistically significant differences on mean values, which was corrected when an ideal PDF was used for texture parameters. In order to prove this, friction prediction was repeated using the green distribution in Figure 11a,b, where the texture parameters are centred in their nominal value, with a standard deviation of σ = 0.01. The obtained results are shown in Figure 13a,b.

3.5. Experimental Friction Measurement Results and ROM Friction Prediction Outcome

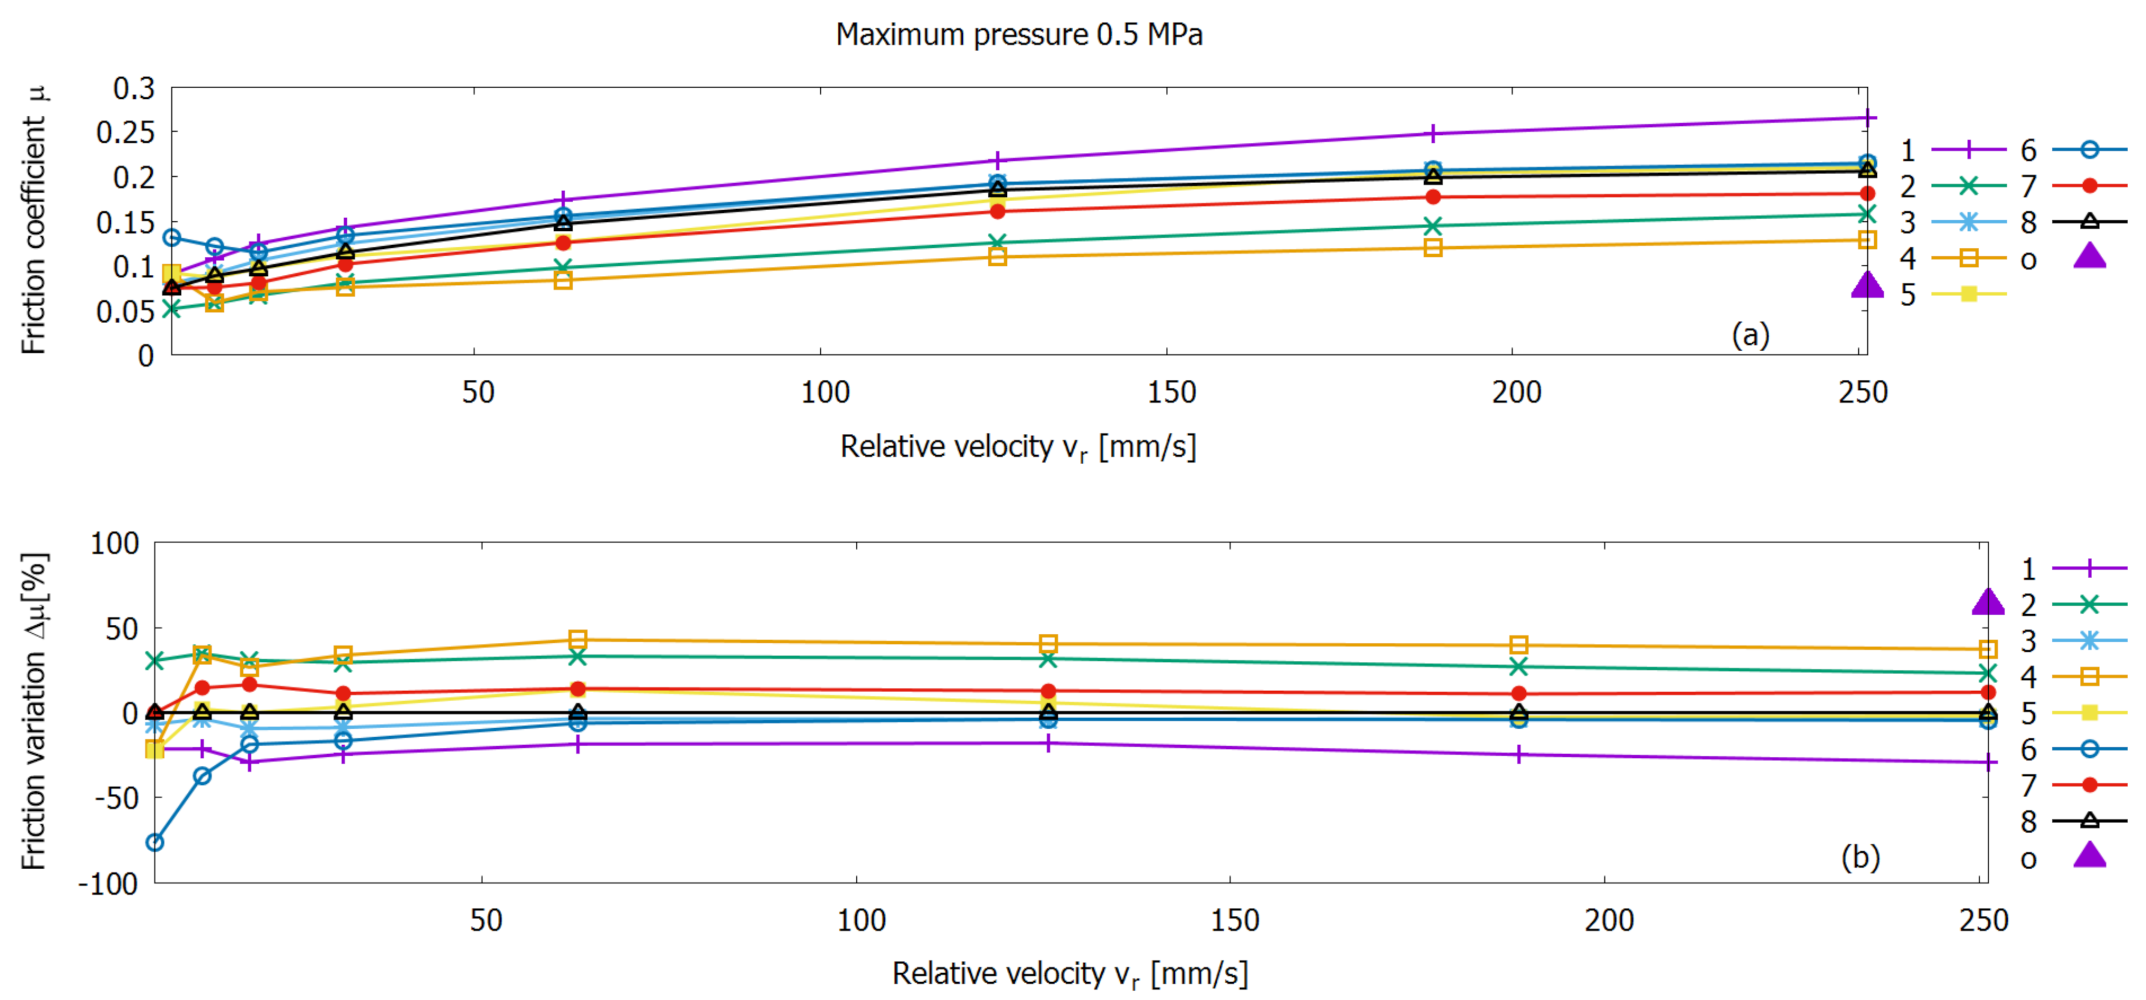
The objective of the experimental testing procedure is to identify specific surface textures, which exhibit the lowest friction as a function of the relative velocity v r and the contact pressure p c . In Figure 14, Figure 15 and Figure 16 the quasi-stationary friction coefficients μ of the 8 rubber specimens with different textures are shown as function of the relative velocity v r . Data points depicted in Figure 14, Figure 15 and Figure 16 are based on 5 measurements, whose mean values are shown. Error bars are not provided in the figures due to better visibility, although sigma ranges for the whole pool of data varied between σ m i n = 0.004 and σ m a x = 0.196 with a mean value of σ m e a n = 0.005.
Each figure visualises the measurement results for one of the three different contact pressures levels p c considered. In addition, the friction variations of the different rubber samples are presented in relation to the untextured reference rubber specimen 8. Under all operating conditions, friction-reducing, as well as friction-increasing textures, can be identified. Positive values of friction variation indicate a texture-related reduction of friction, while negative friction variation values describe a friction increase compared to the untextured reference sample 8, see also Equation (4). Besides a texture related vertical shift of the friction characteristic, a horizontal shift of the minimum can be observed as well. Hence, surface texturing modifies friction in all regimes, which will be discussed in another publication.
In the following, the textures with the highest and lowest friction are discussed for each contact pressure level p c , m a x . For p c , m a x = 0.5 MPa rubber specimens 2 and 4 exhibit the lowest friction when considering the entire velocity range, while sample 1 reveals the highest friction level. Samples 2 and 4 have the highest area densities of 39% and 55%, respectively, while sample 1 has the lowest area density of 9% within all textures examined. Therefore, a clear trend is evident for p c , m a x = 0.5 MPa, where the largest area densities analysed lead to the lowest friction levels, while the lowest area density leads to the highest friction level. The aspect ratio does not appear to have a major influence in this pressure condition as it fluctuates for samples 1, 2, and 4 between 0.11, 0.05, and 0.10, so that no clear trend is apparent.
For p c , m a x = 0.7 MPa and p c , m a x = 0.9 MPa rubber sample 1 and 3 exhibit the lowest friction level over the entire range of velocities. In contrast, specimen 7 shows the highest friction. Despite this agreement for both pressure levels, no clear trend can be derived in terms of dimple dimensions, area density, or aspect ratio. For example, sample 3 and 7 have similar area density values of 28% and 25%, respectively, as well as aspect ratios of 0.04 and 0.06. However, as mentioned above, the measured friction results of both textures differ greatly from each other.
Since there is no clear trend for dimple texture, it is concluded that the texture needs to be individually adapted to the existing operating conditions to minimize friction. For this purpose, ROM is an extremely efficient tool. In order to demonstrate the benefits of the ROM in vivid examples, four exemplary use cases were defined. The first theoretical use case is a friction contact intended to operate at the lowest contact pressure level p c , m a x = 0.5 MPa and the highest velocity v r = 251 mm/s within the operational conditions experimentally analysed. During the friction measurement procedure, a maximum friction reduction of 37% was already achieved with sample 4. However, the theoretical customer requires a further enhanced friction reduction of at least 60%. By using the ROM, a friction reduction of 63% can be predicted with the texture parameters given in row 1 of Table 5.
The second use case is an application that operates at a contact pressure p c , m a x = 0.7 MPa and a velocity of v r = 31 mm/s. Friction measurements reveal a maximum friction reduction of 63% for sample 1. Again, the friction can be further reduced by a suitable texture, which is predicted by the ROM. The ROM indicates a friction reduction of 81% compared to reference seal 8 for the values specified in row 2 of Table 5.
The third use case is an imaginary technical requirement for a seal, which operates under the highest contact pressure level of p c , m a x = 0.9 MPa and the lowest velocity of v r = 6 mm/s within the considered conditions. The experimental friction results show a maximum friction reduction of 48% for seal sample 1. With the use of the ROM, a reduced friction of 72% can be predicted in relation to the untextured case with the values given in row 3 of Table 5.
Based on the ROM results, one additional data point, indicated by a triangle, is added to each of the three plots of Figure 14, Figure 15 and Figure 16.
In addition to friction predictions, considering the experimentally analysed operating conditions, one of the major advantage of the ROM is the ability to freely interpolate within the parameter space of the operating conditions. This is why the fourth use case shows the ROM prediction for experimentally untested working conditions, i.e., p c = 0.6 MPa and velocity of v r = 100 mm/s, where the friction reduction is about 79%, for the texture parameters shown in row 4 of Table 5.
The resulting aspect ratio for all four use case textures is equal to 0.04, while the textured area ranges from 30% to 42%. Compared to the experimentally analysed dimple textures given in Table 3, the dimple diameters are rather at the upper edge of the investigated texture dimensions, while the dimple distances and the depths are found in the lower range of the dimple dimensions. However, the dimple values are not similar. Thus, again it is obvious that a surface texture has always to be determined as a function of the operating conditions in order to achieve a maximum friction reduction. For each distinct application and individual technical requirement, textures have to be identified which result in an optimum friction with respect to a defined reference. These ROM results are not experimentally confirmed within the scope of this paper, as it would be necessary to re-produce rubber samples with appropriate textures, which was not part of MouldTex project [39].

4. Discussion

As can be concluded from Section 3.5, large texture-induced friction reductions, of up to 70%, could already be found experimentally inside the investigated parameter range of textures, velocities, and contact pressures. However, within the physical available samples, it is not always possible to identify clear trends for dimple dimensions that explain a high friction reduction compared to the untextured reference. Based on this finding, it is inferred that the surface texture dimensions need to be individually adapted to the given operating condition, in order to ensure a low friction level.
One possibility to identify optimal surface textures is the examination of a great number of dimple textures, which is significantly larger than the experimentally analysed set. However, this approach would be time-consuming and expensive due to TDM production requirements. The use of additional methods based on AI, such as ROM, are therefore advantageous. In this context, ROM is an effective method for finding the most suitable textures for specific operating conditions, as shown in Section 3.5, where the ROM is used to predict friction reduction values for both experimentally tested and untested working conditions, see Table 5 rows 1–3 and 4, respectively. Within this paper, ROM models have been used to predict and explore friction behaviour of surface textured rubber specimens by training the model on the experimental friction measurement results. Moreover, the model is able to quantify the measured friction variations that occur when deviations from nominal surface texture values are observed (Figure 9, Figure 10a,b, Figure 11a,b and Figure 12a,b). ROM is extremely useful for simulating and predicting a system behaviour, especially when the physics behind its phenomenology are completely unknown or difficult to solve. Thanks to the ROM algorithms, users can predict the behaviour of their system in real-time, and specifically seal manufacturers can assess the parametric conditions that show the desired optimised results and select them before the rubber seal production. The efficiency of a data-driven ROM, as it is for Twinkle [23], is particularly dependent on the collected data, i.e., their associated error and their resulting manifold coverage.
With a thoroughly planned DoE it is possible to achieve an optimal space coverage, which leads to a reliable ROM’s prediction result. The promising results, presented in Section 3.3 for the 2-ROM error propagation (Figure 7) strongly support ROM’s accuracy on the given dataset. Nevertheless, if larger amounts of data were available, the computed ROM could be even more reliable in those space regions where less information was collected and, hence, confidently retrieve the best texture that allow minimising friction, according to friction variations computed in Equation (4). Moreover, if a ROM model was computed using simulation data, a higher sample space coverage and hence better reliability in the results could be achieved.
In addition, a ROM model allows verifying that the introduction of a statistical noise on nominal surface texture values affects friction, as shown in Figure 11a,b, where the two-tailed t-Student test showed a statistically significant difference between the experimental friction distribution (orange) and the ideal one (green) for dimple diameter-distance variations, see Figure 12a,b, were the difference on friction measurement are linked to manufacturing deviations in the nominal values of dimple textures. These variations were later compared to the effects obtained from an ideal PDF for dimple values experimental variations, i.e., mean value centred on nominal surface texture values and standard deviation σ = 0.01, as shown in Figure 13a,b, opening the way to potential surface texture manufacturing quality and tolerance investigations.

5. Conclusions

Within the scope of this paper, a pin-on-disc tribometer was used to measure dynamic friction in the contact of surface textured rubber specimens that were manufactured by texturing during moulding (TDM). The operating conditions, defined by relative velocity ( v r ranging from 6 to 251 mm/s) and contact pressure level ( p c , m a x ranging from 0.5 to 0.9 MPa), were chosen to correspond to the operating conditions of pneumatic seals. Based on the different experimentally tested texture dimensions, a maximum friction reduction of 70% was determined compared to the untextured reference, with a dimple diameter of 100 μ m, a dimple depth of 10 μ m and an area density of 9%.
However, since no global surface texture optimum could be found experimentally that exhibits the lowest friction under all operating conditions, it is concluded that a surface texture needs always to be determined individually, based on the prevailing operating conditions, in order to achieve maximum friction reduction. For this purpose, a novel methodology was applied, combining friction measurements with Reduced Order Modelling (ROM). The objective of the ROM was the computation of optimal surface texture parameters that provide the highest friction reduction within the given parameter space of textures and operating conditions. By feeding the ROM with microscope-based texture measurements, it also takes into account deviations of the real dimple dimensions from the nominal dimple values for the output friction value. In summary, friction measurements are suitable as input parameters for the ROM so that the use of ROM for friction prediction has been proven successful. For demonstration, exemplary use cases were defined, from which it can be concluded that ROM enables the identification of optimal surface texture parameters that were not available for experiments, obtaining friction reductions from 63% to 81%, which are significantly higher than the experimentally tested surface textures for the same operating conditions. In addition, the value of ROM was further highlighted, as it is also able to freely interpolate between tested operating conditions to determine optimal textures for each operating condition within the range considered, resulting in a predicted friction reduction of 79%.
Moreover, ROM applicability has been extended further, showing that the method can be also used for statistical analysis, to evaluate the impact of manufacturing uncertainties, observed on surface texture nominal values, on friction measurements. Thus, ROM is not only an extremely powerful technique for scientific users to compute the friction reduction of surface textured components but also for industrial manufacturers of rubber components, to design rubber surfaces and evaluate the impact of manufacturing deviations on dynamic friction.

Author Contributions

Conceptualization, B.H.-G., M.B. and V.Z.; methodology, B.H.-G. and V.Z.; software, V.Z.; validation, B.H.-G., J.R.V., L.A.G., M.B., M.W. and V.Z.; formal analysis, M.B. and V.Z.; investigation, M.B. and V.Z.; resources, I.V., L.A.G., M.W. and S.I.; data curation, M.B. and V.Z.; writing—original draft preparation, M.B. and V.Z.; writing—review and editing, B.H.-G., J.R.V., L.A.G., M.B., M.W., S.I. and V.Z.; visualization, B.H.-G., J.R.V., L.A.G., M.B., M.W., S.I. and V.Z.; supervision, L.A.G., M.W. and S.I.; project administration, B.H.-G., J.R.V. and L.A.G.; funding acquisition, J.R.V. All authors have read and agreed to the published version of the manuscript.

Funding

This work has been funded by the European Union’s research program Horizon2020, under grant agreement No. 768705.

Institutional Review Board Statement

Not applicable.

Informed Consent Statement

Not applicable.

Data Availability Statement

Publicly available datasets were analysed in this study. This data can be found here: http://devex.ita.es/mouldtex/optimizer/Data.zip (accessed on 22 March 2021).

Acknowledgments

We would like to thank ORP Stampi srl and SKM Aeronautics Ltd for providing the rubber specimens and ML Engraving srl for the surface texturing. We would also like to thank Carmen Alfaro, Rafael Rodríguez, and Susana Calvo for useful discussions.

Conflicts of Interest

The authors declare no conflict of interest.

Abbreviations

The following abbreviations are used in this manuscript:
AIArtificial Intelligence
CFDCumulative Density Function
DoEDesign of Experiment
DTDigital Twin
FEMFinite Element Method
LSTLaser Surface Texturing
MLMachine Learning
PDFProbability Density Function
PGDProper Generalized Decomposition
PODProper Orthogonal Decomposition
ROMReduced Order Modelling
SEHLSoft Elasto-Hydrodynamic Lubrication
SVDSingular Value Decomposition
TDMTexturing During Moulding
TRDTensor Rank Decomposition

References

  1. Korane, K. Low-Friction Seals Give High Fluid-Power Efficiency. Available online: https://www.machinedesign.com/news/article/21829567/lowfriction-seals-give-high-fluidpower-efficiency (accessed on 22 March 2021).
  2. Jeng, Y.R. Impact of plateaued surfaces on tribological performance. Tribol. Trans. 1996, 39, 354–361. [Google Scholar] [CrossRef]
  3. Wróblewski, P.; Iskra, A. Geometry of shape of profiles of the sliding surface of ring seals in the aspect of friction losses and oil film parameters. Combust. Engines 2016, 55. [Google Scholar] [CrossRef]
  4. Ryk, G.; Kligerman, Y.; Etsion, I. Experimental Investigation of Laser Surface Texturing for Reciprocating Automotive Components. Tribol. Trans. 2002, 45, 444–449. [Google Scholar] [CrossRef]
  5. Tomanik, E.; Profito, F.J.; Zachariadis, D.C. Modelling the hydrodynamic support of cylinder bore and piston rings with laser textured surfaces. Tribol. Int. 2013, 59, 90–96. [Google Scholar] [CrossRef]
  6. Etsion, I.; Burstein, L. A Model for Mechanical Seals with Regular Microsurface Structure. Tribol. Trans. 1996, 39, 677–683. [Google Scholar] [CrossRef]
  7. Etsion, I.; Kligerman, Y.; Halperin, G. Analytical and experimental investigation of laser-textured mechanical seal faces. Tribol. Trans. 1999, 42, 511–516. [Google Scholar] [CrossRef]
  8. Etsion, I. Improving Tribological Performance of Mechanical Components by Laser Surface Texturing. Tribol. Lett. 2004, 17, 733–737. [Google Scholar] [CrossRef]
  9. Pettersson, U.; Jacobson, S. Influence of surface texture on boundary lubricated sliding contacts. Tribol. Int. 2003, 36, 857–864. [Google Scholar] [CrossRef]
  10. Grützmacher, P.G.; Profito, F.J.; Rosenkranz, A. Multi-Scale Surface Texturing in Tribology—Current Knowledge and Future Perspectives. Lubricants 2019, 7, 95. [Google Scholar] [CrossRef] [Green Version]
  11. Shinkarenko, A.; Kligerman, Y.; Etsion, I. The effect of surface texturing in soft elasto-hydrodynamic lubrication. Tribol. Int. 2009, 42, 284–292. [Google Scholar] [CrossRef]
  12. Etsion, I. Modeling of surface texturing in hydrodynamic lubrication. Friction 2013, 1. [Google Scholar] [CrossRef] [Green Version]
  13. Zimmermann, M.; Wangenheim, M. Friction behaviour of surface textured elastomeric seals in pneumatic actuators. In Proceedings of the 23rd International Conference on Fluid Sealing, Manchester, UK, 2–3 March 2016; BHR Group: Cranfield, UK, 2016; p. 97. [Google Scholar]
  14. Dobrica, M.B.; Fillon, M.; Pascovici, M.D.; Cicone, T. Optimizing surface texture for hydrodynamic lubricated contacts using a mass-conserving numerical approach. Proc. Inst. Mech. Eng. Part J J. Eng. Tribol. 2010, 224, 737–750. [Google Scholar] [CrossRef]
  15. Vlădescu, S.; Olver, A.; Pegg, I.; Reddyhoff, T. Combined friction and wear reduction in a reciprocating contact through laser surface texturing. Wear 2016, 358–359, 51–61. [Google Scholar] [CrossRef] [Green Version]
  16. Adjemout, M.; Aurore, A.; Bouyer, J.; Brunetière, N.; Marcos, G.; Czerwiec, T. Influence of the real dimple shape on the performance of a surface textured mechanical seal. Tribol. Int. 2014, 115, 409–416. [Google Scholar] [CrossRef]
  17. Tao, F.; Qi, Q.; Wang, L.; Nee, A. Digital Twins and Cyber-Physical Systems toward Smart Manufacturing and Industry 4.0: Correlation and Comparison. Engineering 2019, 5, 653–661. [Google Scholar] [CrossRef]
  18. Tao, F.; Zhang, H.; Liu, A.; Nee, A.Y. Digital twin in industry: State-of-the-art. IEEE Trans. Ind. Inform. 2018, 15, 2405–2415. [Google Scholar] [CrossRef]
  19. Chinesta, F.; Cueto, E.; Abisset-Chavanne, E.; Duval, J.; Khaldi, F. Virtual, Digital and Hybrid Twins: A New Paradigm in Data-Based Engineering and Engineered Data. Arch. Comput. Methods Eng. 2018. [Google Scholar] [CrossRef] [Green Version]
  20. Le Clainche, S.; Vega, J.M. A Review on Reduced Order Modeling using DMD-Based Methods. In Proceedings of the IUTAM Symposium on Model Order Reduction of Coupled Systems, Stuttgart, Germany, 22–25 May 2018; Springer: Berlin/Heidelberg, Germany, 2020; pp. 55–66. [Google Scholar]
  21. Mignolet, M.P.; Przekop, A.; Rizzi, S.A.; Spottswood, S.M. A review of indirect/non-intrusive reduced order modeling of nonlinear geometric structures. J. Sound Vib. 2013, 332, 2437–2460. [Google Scholar] [CrossRef]
  22. Wuest, T.; Weimer, D.; Irgens, C.; Thoben, K.D. Machine learning in manufacturing: Advantages, challenges, and applications. Prod. Manuf. Res. 2016, 4, 23–45. [Google Scholar] [CrossRef] [Green Version]
  23. Zambrano, V.; Rodríguez-Barrachina, R.; Calvo, S.; Izquierdo, S. TWINKLE: A digital-twin-building kernel for real-time computer-aided engineering. SoftX 2020, 11, 100419. [Google Scholar] [CrossRef]
  24. Dataset Generated and Used Within This Publication. Available online: http://devex.ita.es/mouldtex/optimizer/Data.zip (accessed on 22 March 2021).
  25. Lee, C.Y.; Lin, C.S.; Jian, R.Q.; Wen, C.Y. Simulation and experimentation on the contact width and pressure distribution of lip seals. Tribol. Int. 2006, 39, 915–920. [Google Scholar] [CrossRef]
  26. Parker Pneumatic Seals Catalogue. Available online: https://www.parker.com/Literature/Praedifa/Catalogs/Catalog_PneuSeals_PTD3351-EN.pdf (accessed on 22 March 2021).
  27. OKS Adherent Silicone Grease Lubricant Specification. Available online: https://www.oks-germany.com/en/products/oks-1155-adherent-silicone-grease/ (accessed on 22 March 2021).
  28. TWINKLE: A Digital-Twin-Building Kernel for Real-Time Computer-Aided Engineering. Available online: https://github.com/caeliaITAINNOVA/Twinkle (accessed on 22 March 2021).
  29. Pedregosa, F.; Varoquaux, G.; Gramfort, A.; Michel, V.; Thirion, B.; Grisel, O.; Blondel, M.; Prettenhofer, P.; Weiss, R.; Dubourg, V.; et al. Scikit-learn: Machine Learning in Python. J. Mach. Learn. Res. 2011, 12, 2825–2830. [Google Scholar]
  30. Langford, J. The cross validation problem. In Proceedings of the International Conference on Computational Learning Theory, Bertinoro, Italy, 27–30 June 2005; Springer: Berlin/Heidelberg, Germany, 2005; pp. 687–688. [Google Scholar]
  31. Bochkanov, S. ALGLIB. Available online: www.alglib.net (accessed on 22 March 2021).
  32. Ayodele, T.O. Types of machine learning algorithms. New Adv. Mach. Learn. 2010, 3, 19–48. [Google Scholar]
  33. Berry, M.W.; Mohamed, A.; Yap, B.W. Supervised and Unsupervised Learning for Data Science; Springer: Berlin/Heidelberg, Germany, 2019. [Google Scholar]
  34. Harris, C.R.; Millman, K.J.; van der Walt, S.J.; Gommers, R.; Virtanen, P.; Cournapeau, D.; Wieser, E.; Taylor, J.; Berg, S.; Smith, N.J.; et al. Array programming with NumPy. Nature 2020, 585, 357–362. [Google Scholar] [CrossRef]
  35. Virtanen, P.; Gommers, R.; Oliphant, T.E.; Haberland, M.; Reddy, T.; Cournapeau, D.; Burovski, E.; Peterson, P.; Weckesser, W.; Bright, J.; et al. SciPy 1.0: Fundamental Algorithms for Scientific Computing in Python. Nat. Methods 2020, 17, 261–272. [Google Scholar] [CrossRef] [Green Version]
  36. Shinkarenko, A.; Kligerman, Y.; Etsion, I. The Validity of Linear Elasticity in Analyzing Surface Texturing Effect for Elastohydrodynamic Lubrication. Trans. ASME J. Tribol. 2009, 131. [Google Scholar] [CrossRef]
  37. Wang, X.; Kato, K.; Adachi, K.; Aizawa, K. The effect of laser texturing of SiC surface on the critical load for the transition of water lubrication mode from hydrodynamic to mixed. Tribol. Int. 2001, 34, 703–711. [Google Scholar] [CrossRef]
  38. Schneider, J.; Braun, D.; Greiner, C. Laser Textured Surfaces for Mixed Lubrication: Influence of Aspect Ratio, Textured Area and Dimple Arrangement. Lubricants 2017, 5, 32. [Google Scholar] [CrossRef] [Green Version]
  39. Mouldtex Project. Available online: http://www.mouldtex-project.eu/ (accessed on 22 March 2021).
Figure 1. (a) Geometry of the rubber specimens including the most relevant dimensions, (b) picture of the rubber specimen with focus on the dimple texture and (c) positioning of the dimples in relation to the relative velocity vector.
Lubricants 09 00057 g001
Figure 2. (a) Pin-on-disc tribometer design, (b) picture of the tribometer with focus on the rubber specimen and the rotating counter surface, and (c) contact conditions between the rubber sample and the counter surface.
Lubricants 09 00057 g002
Figure 3. (a) Assembly of the finite element method (FEM). The coloured spherical contact area of the rubber specimen is brought into contact with the grey flat counter surface. (b) Parabolic contact pressure distribution p c as a function of the contact diameter d c .
Lubricants 09 00057 g003
Figure 4. (a) Microscope image of rubber specimen 6, considering a measured area of 4 × 4 mm and (b) related height profile h as function of the measuring length l, considering the indicated line scan trough four adjacent dimples.
Lubricants 09 00057 g004
Figure 5. (a) Red marked nominal circular contact area A n o m i n a l between an untextured rubber specimen and the counter surface and (b) contact area of a textured sample. The textured area A t e x t u r e d is indicated by the black circular dimples, the untextured area that is in direct contact with the counter surface is coloured in blue.
Lubricants 09 00057 g005
Figure 6. ROM prediction for (a) untextured and (b) textured friction coefficient data. The blue dots are obtained by evaluating the ROM with the experimental data, the dashed black line is the linear regression that fits the data, while the solid red line represents the ideal ROM result, where the ROM evaluation on each experimental friction value returns the same value.
Lubricants 09 00057 g006
Figure 7. 2-ROM-models prediction for combined untextured and textured friction data, according to Equation (4). The blue dots are obtained by evaluating the combined 2-ROM predictions with the combined experimental data (Equation (4)), the dashed black line is the linear regression that fits the data, while the solid red line represents the ideal prediction result, where the predicted values perfectly match the experimental ones.
Lubricants 09 00057 g007
Figure 8. Textured data ROM’s first term. The one-dimensional functions, for each variable are shown separately in the plots, according to Equation (1), labelled with letters from (ae).
Lubricants 09 00057 g008
Figure 9. Dimple depth specific PDF and corresponding nominal value.
Lubricants 09 00057 g009
Figure 10. (a) Dimple diameter and (b) distance specific PDFs and respective nominal values.
Lubricants 09 00057 g010
Figure 11. Friction coefficient distribution (orange) when (a) dimple depth or (b) diameter and distance are varried according to their specific PDFs (Figure 9 and Figure 10a,b, respectively), centred and compared to a normal distribution (green) with zero mean and σ = 0.01.
Lubricants 09 00057 g011
Figure 12. (a) ROM prediction with statistical noise introduction on depth and (b) on diameter and distance. The blue dots are obtained by evaluating the ROM on the statistically expanded dataset, the solid red line represents the ideal ROM result and the error bars show the friction variations linked to (a) depth or (b) diameter and distance deviations from nominal values.
Lubricants 09 00057 g012
Figure 13. (a) ROM prediction with statistical noise introduction on depth and (b) on diameter and distance, with centred mean on nominal value and σ = 0.01. The blue dots are obtained by evaluating the ROM on the statistically expanded dataset, the solid red line represents the ideal ROM result and the error bars show the friction variations linked to (a) depth or (b) diameter and distance deviations from nominal values.
Lubricants 09 00057 g013
Figure 14. (a) Friction coefficient μ as function of the relative velocity v r for the eight different rubber specimens and (b) the corresponding friction variation Δ μ in relation to the untextured rubber sample 8, for contact pressures of p c , m a x = 0.5 MPa.
Lubricants 09 00057 g014
Figure 15. (a) Friction coefficient μ as function of the relative velocity v r for the eight different rubber specimens and (b) the corresponding friction variation Δ μ in relation to the untextured rubber sample 8, for contact pressures of p c , m a x = 0.7 MPa.
Lubricants 09 00057 g015
Figure 16. (a) Friction coefficient μ as function of the relative velocity v r for the eight different rubber specimens and (b) the corresponding friction variation Δ μ in relation to the untextured rubber sample 8, for contact pressures of p c , m a x = 0.9 MPa.
Lubricants 09 00057 g016
Table 1. Nominal dimple texture parameters defined by diameter, distance and depth.
Sample iDimple Diameter
[ μ m]
Dimple Distance
[ μ m]
Dimple Depth
[ μ m]
110030010
220010010
320020010
430010030
530020020
630020030
730030020
8---
Table 2. Operating parameters that are examined during the test procedure. (a) Rotational speeds n of the servomotor and corresponding relative velocities v r between the rubber sample and the counter surface (Table 2), (b) together with the normal force F N , the related maximum contact pressure p c , m a x , the contact diameter d c between the rubber sample and the counter surface, as well as the nominal contact area A n o m i n a l (Table 2).
a
Rotational Speed
n[min 1 ]
Relative Velocity
v r [mm/s]
0.66
1.212
1.819
3.031
6.063
12.0126
18.0188
24.0251
b
Normal Force
F N [N]
Max Contact Pressure
p c , max [MPa]
Contact Diameter
d c [mm]
Nominal Contact Area
A nominal [mm 2 ]
3.90.54.213.8
7.90.75.019.6
13.30.95.826.4
Table 3. Real dimple dimensions, indicated by diameter, distance, and depth. The aspect ratio is the quotient of dimple depth and diameter. The textured area percentage is determined from the quotient of the textured area A t e x t u r e d and the nominal contact area A n o m i n a l .
Sample iDimple Diameter
[ μ m]
Dimple Distance
[ μ m]
Dimple Depth
[ μ m]
Aspect RatioTextured Area
[%]
1135258160.119
2242100110.0539
3241165100.0428
433766350.1055
5330170220.0634
6346153350.1037
7336252200.0625
8-----
Table 4. (a) Untextured and (b) Textured ROM R 2 for Train and Test datasets when the k-fold cross validation method is applied.
ab
Untextured ROM R 2 Textured ROM R 2
TrainTest TrainTest
11.0000.89511.0000.914
21.0000.96821.0000.872
31.0000.98831.0000.882
41.0000.97441.0000.943
51.0000.98851.0000.923
61.0000.90361.0000.896
71.0000.87171.0000.963
81.0000.99481.0000.912
91.0000.91591.0000.953
101.0000.982101.0000.938
avg1.0000.948avg1.0000.919
Table 5. Dimple dimensions predicted by the ROM, which further reduce friction based on the use cases.
Use Case Num.Relative Velocity
v r [mm/s]
Max Contact Pressure
p c , max [MPa]
Dimple Diameter
[ μ m]
Dimple Distance
[ μ m]
Dimple Depth
[ μ m]
Aspect RatioTextured Area
[%]
Predicted Friction Reduction
[%]
12510.5270100100.044263
2310.7300186110.043081
360.9274111110.043972
41000.6300140110.043679
Publisher’s Note: MDPI stays neutral with regard to jurisdictional claims in published maps and institutional affiliations.