

Unveiling the Complex Facets of Poverty: Unidimensional and Multidimensional Insights from Rural Areas of Suri Sadar Sub-Division, Birbhum District, Eastern India


Abstract
:1. Introduction
2. Materials and Methods
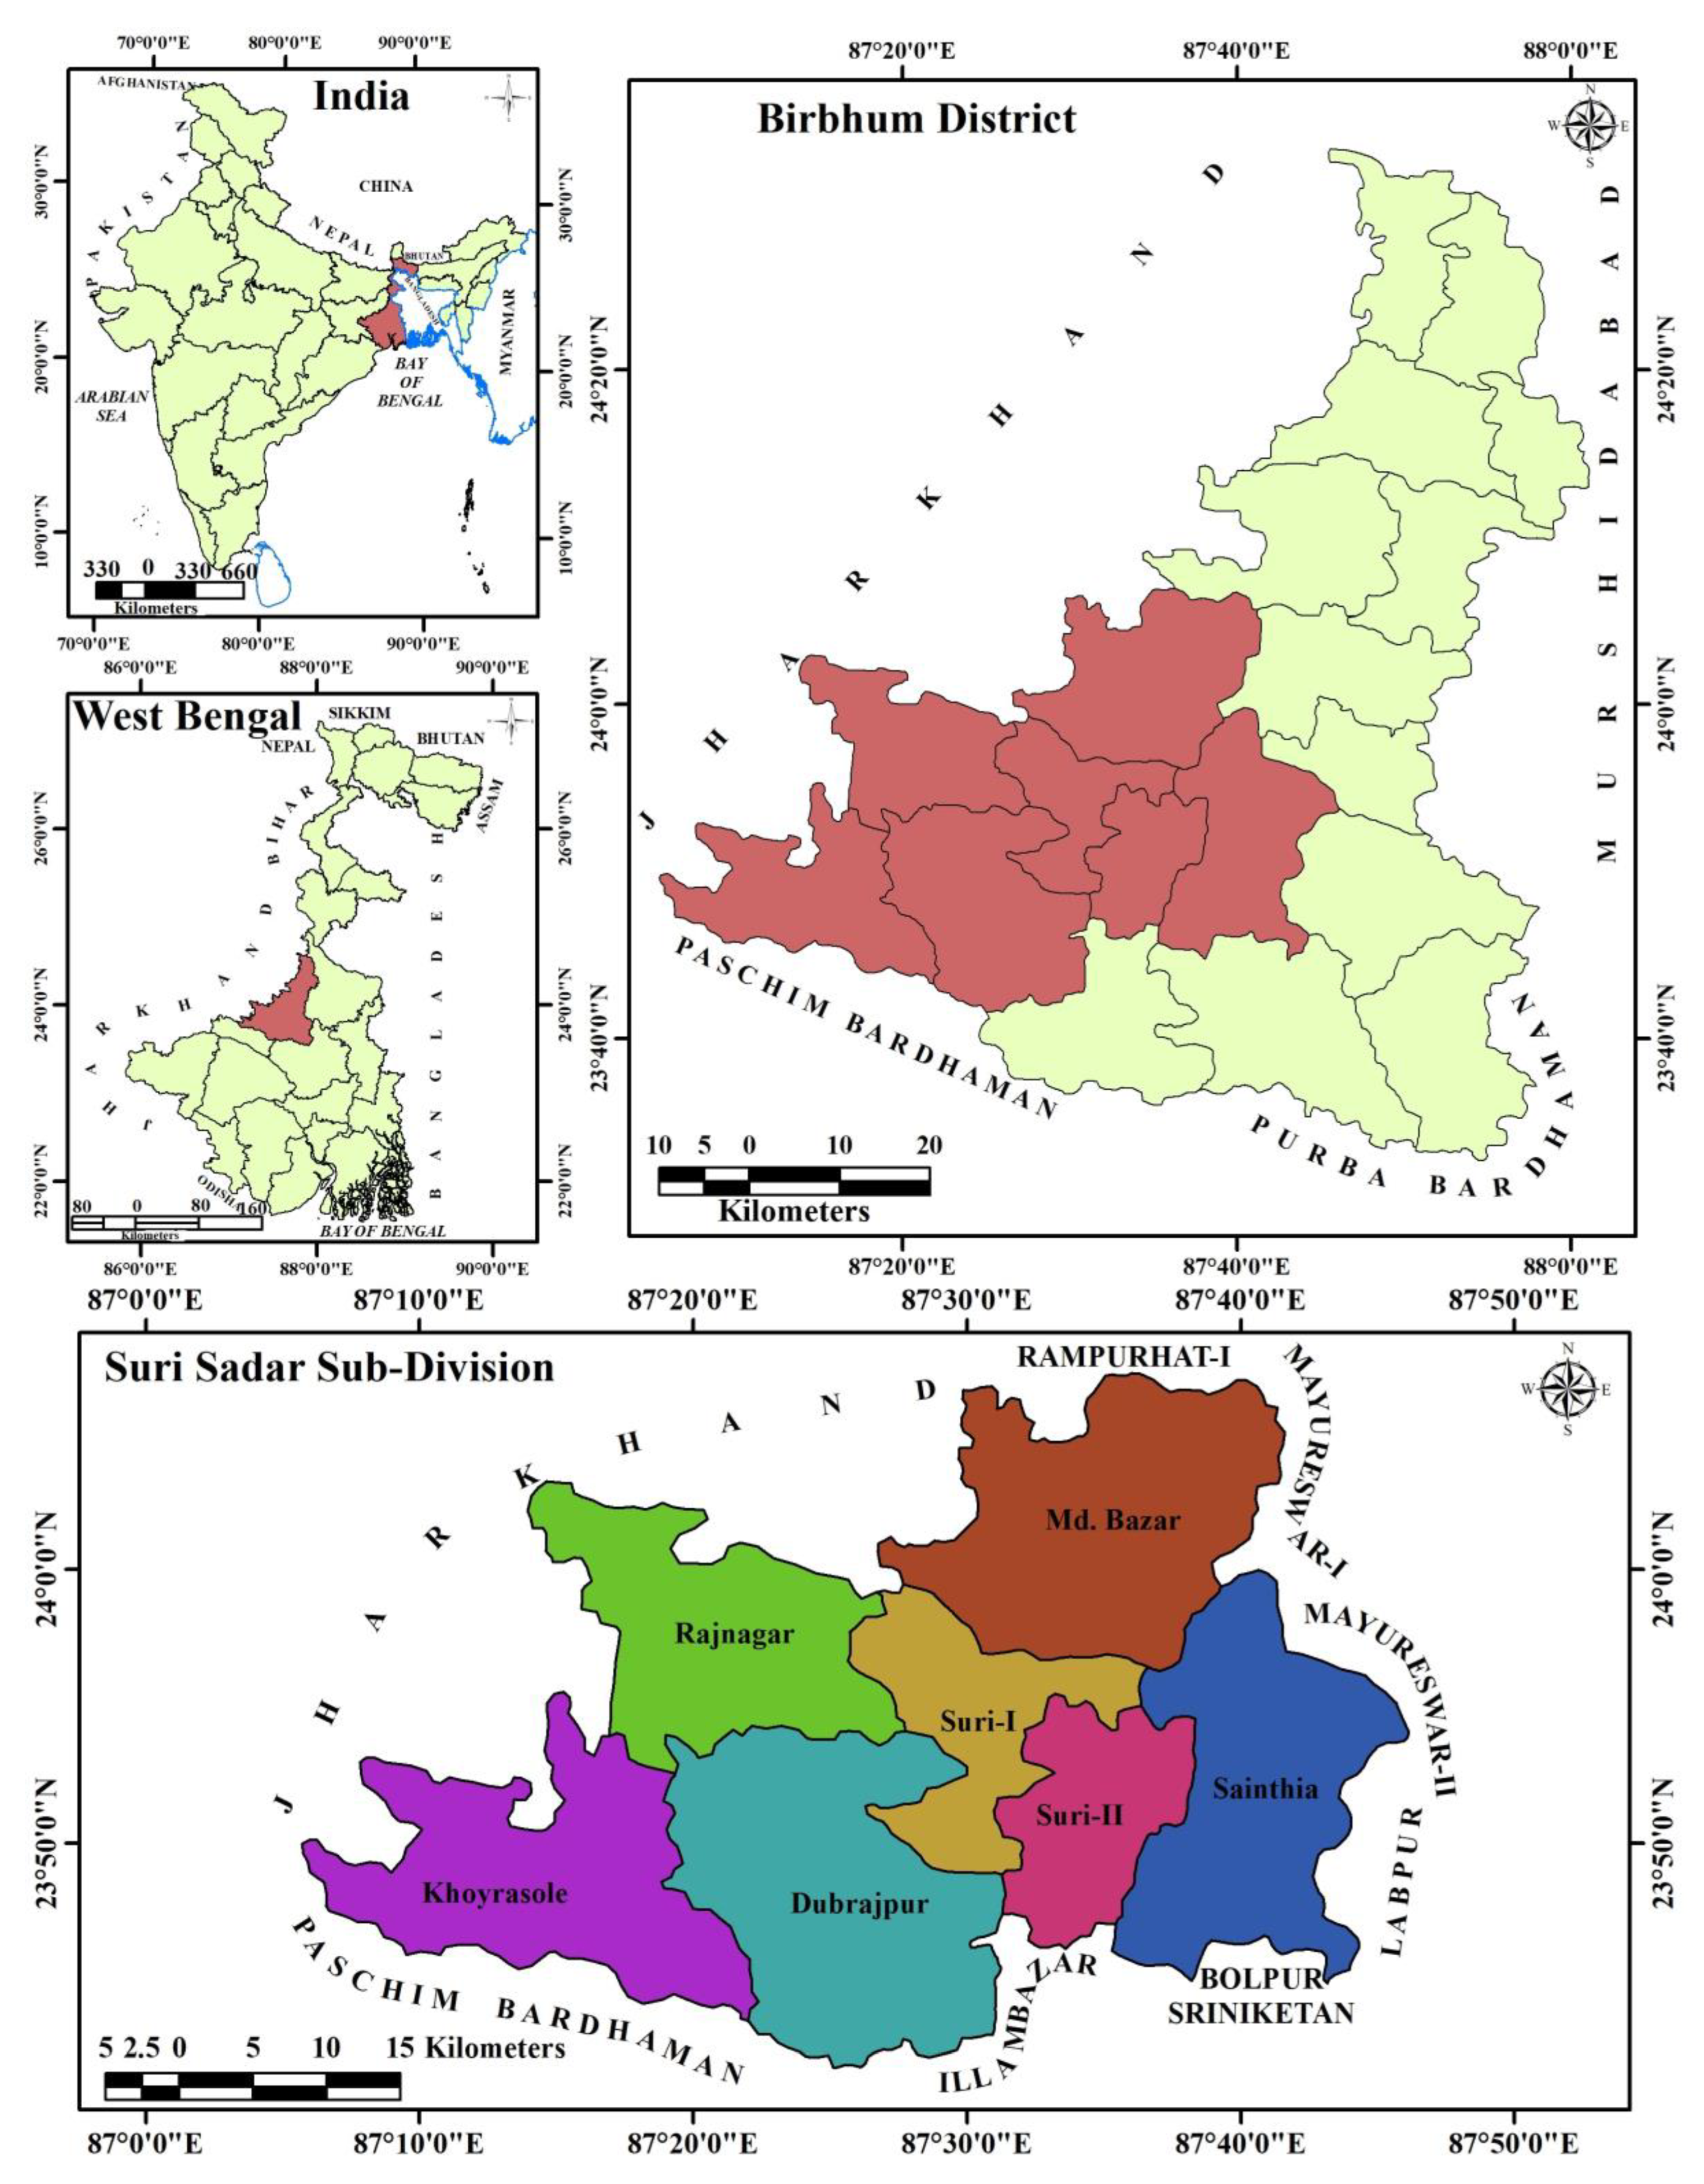
2.1. Study Area
2.2. Data Source
2.3. Methodology
2.3.1. Methodology Regarding Unidimensional Measures of Poverty
2.3.2. Poverty Headcount Index/Headcount Ratio (P0)
2.3.3. Poverty Gap Index (P1)
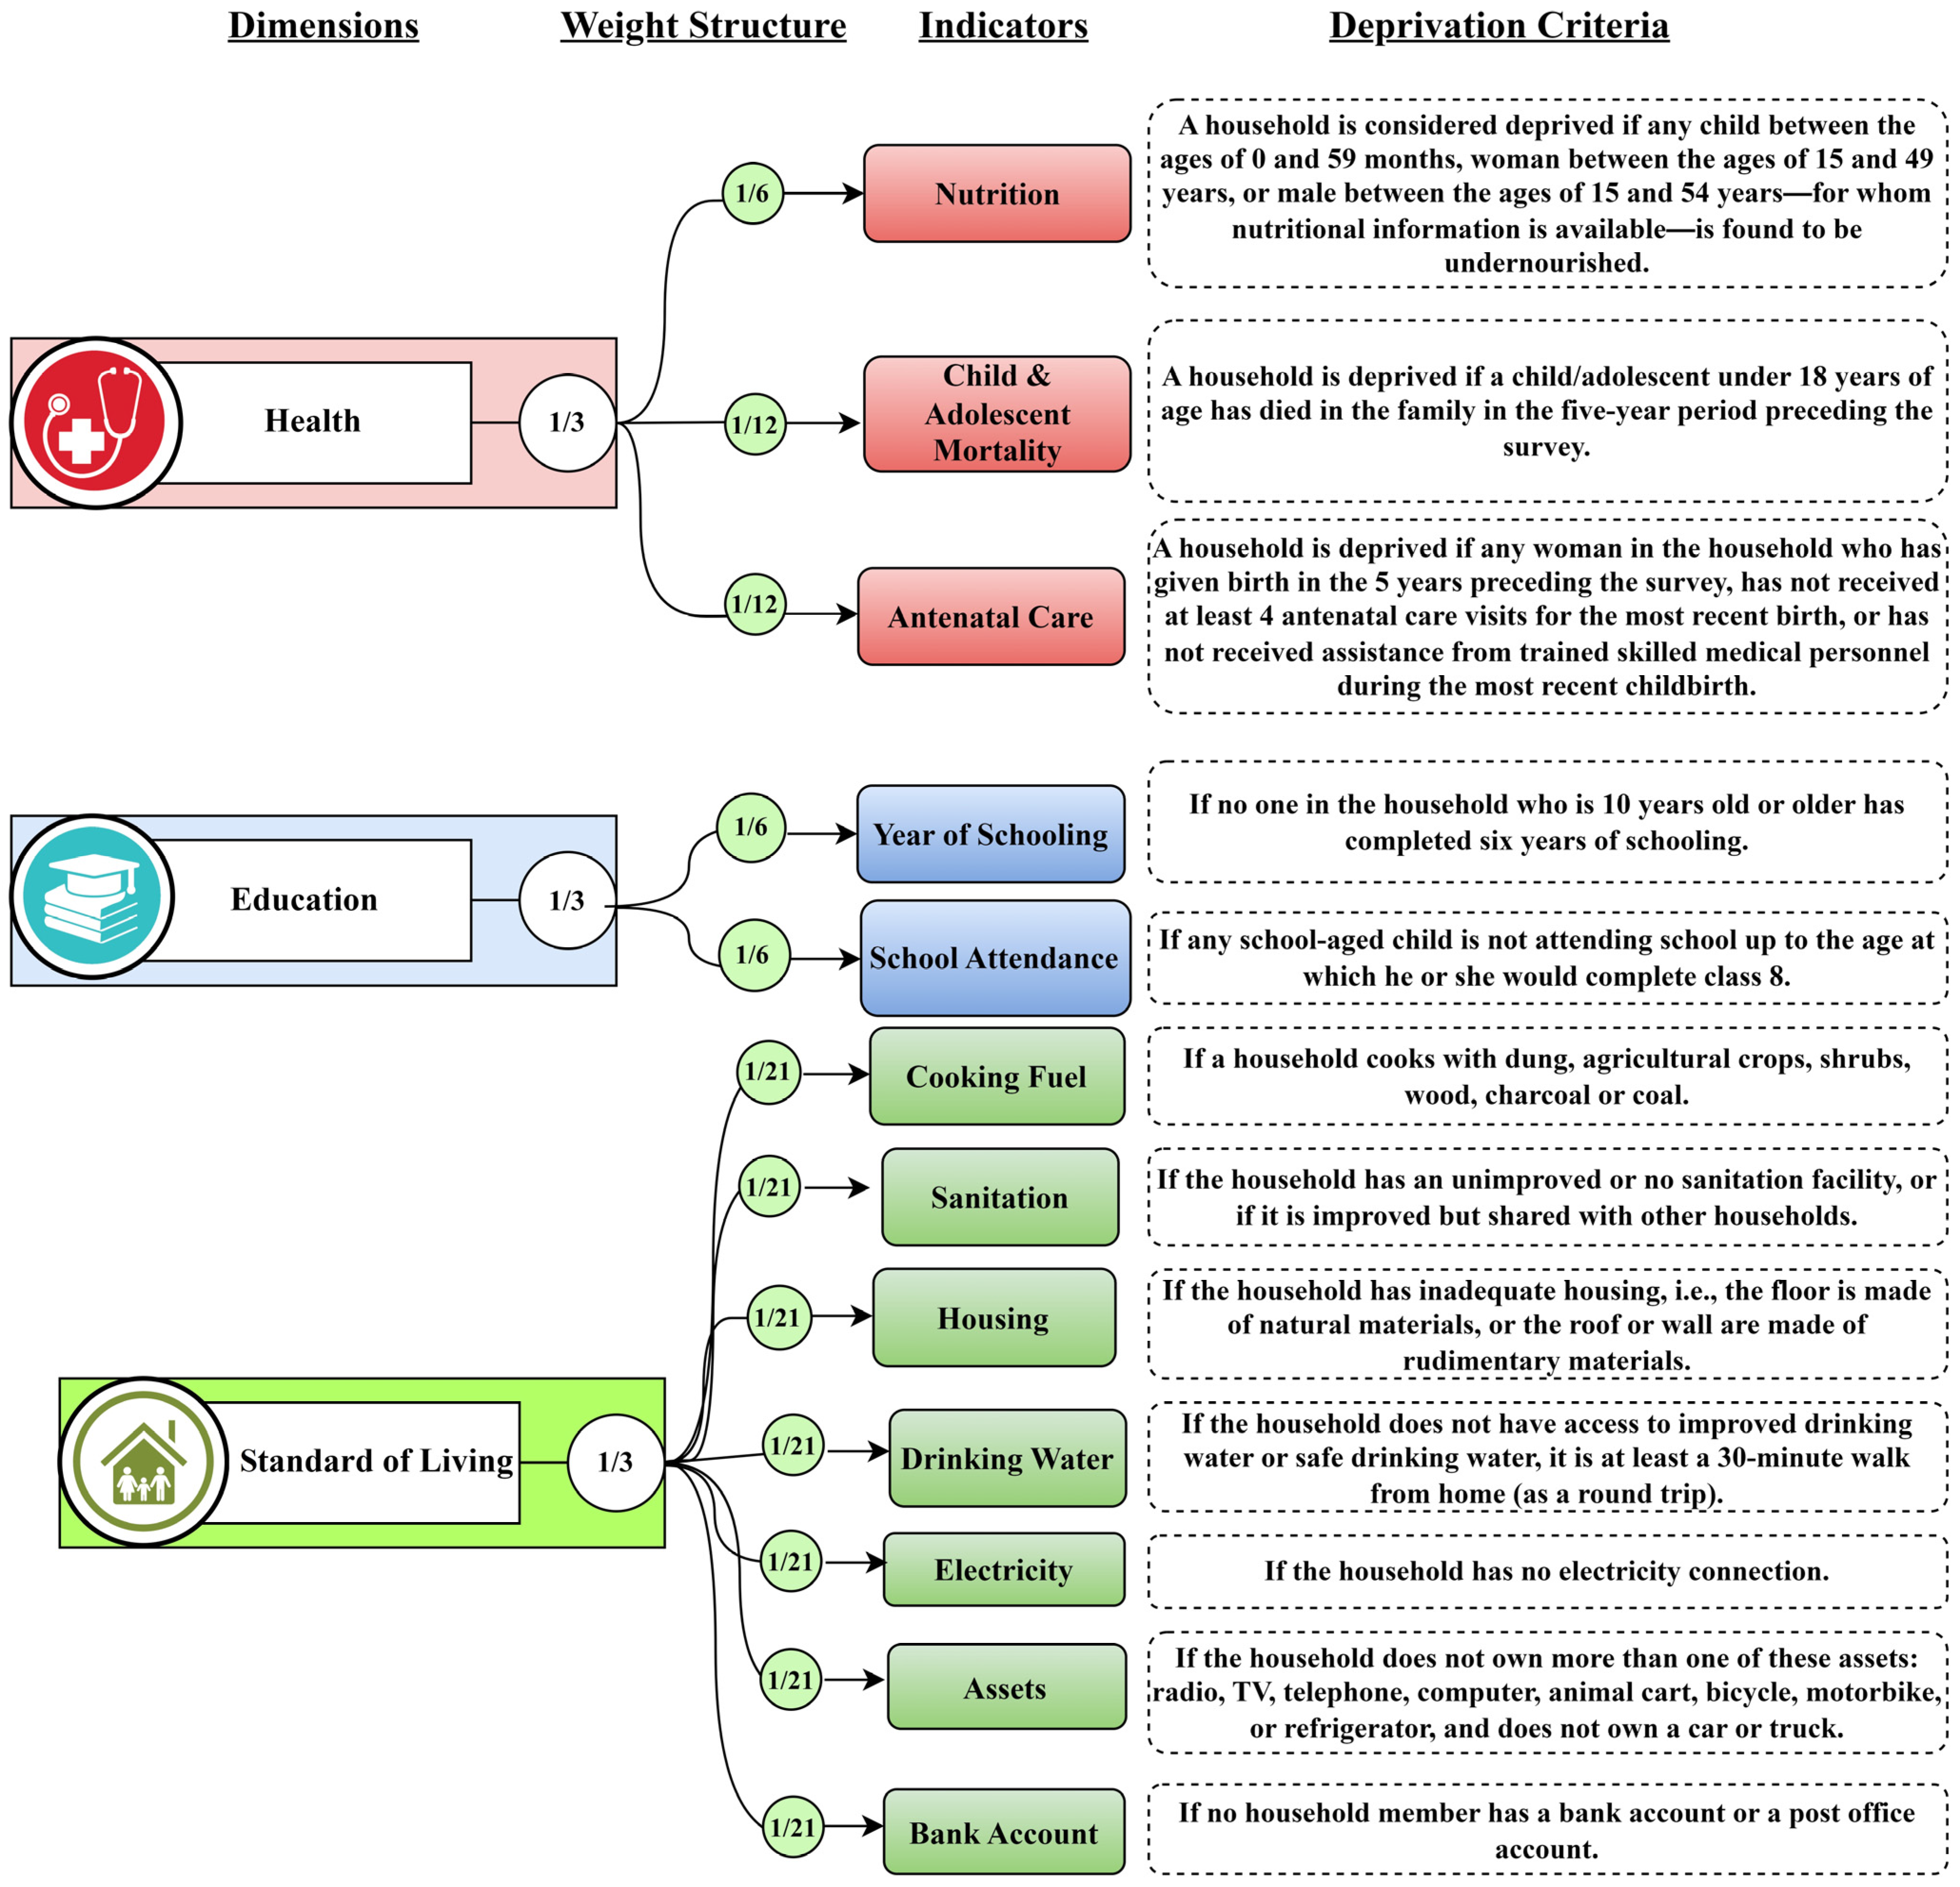
2.3.4. Methodology Regarding Multidimensional Measures of Poverty
2.3.5. Headcount Ratio
2.3.6. Intensity of Poverty
2.3.7. Multidimensional Poverty Index (MPI)
3. Results
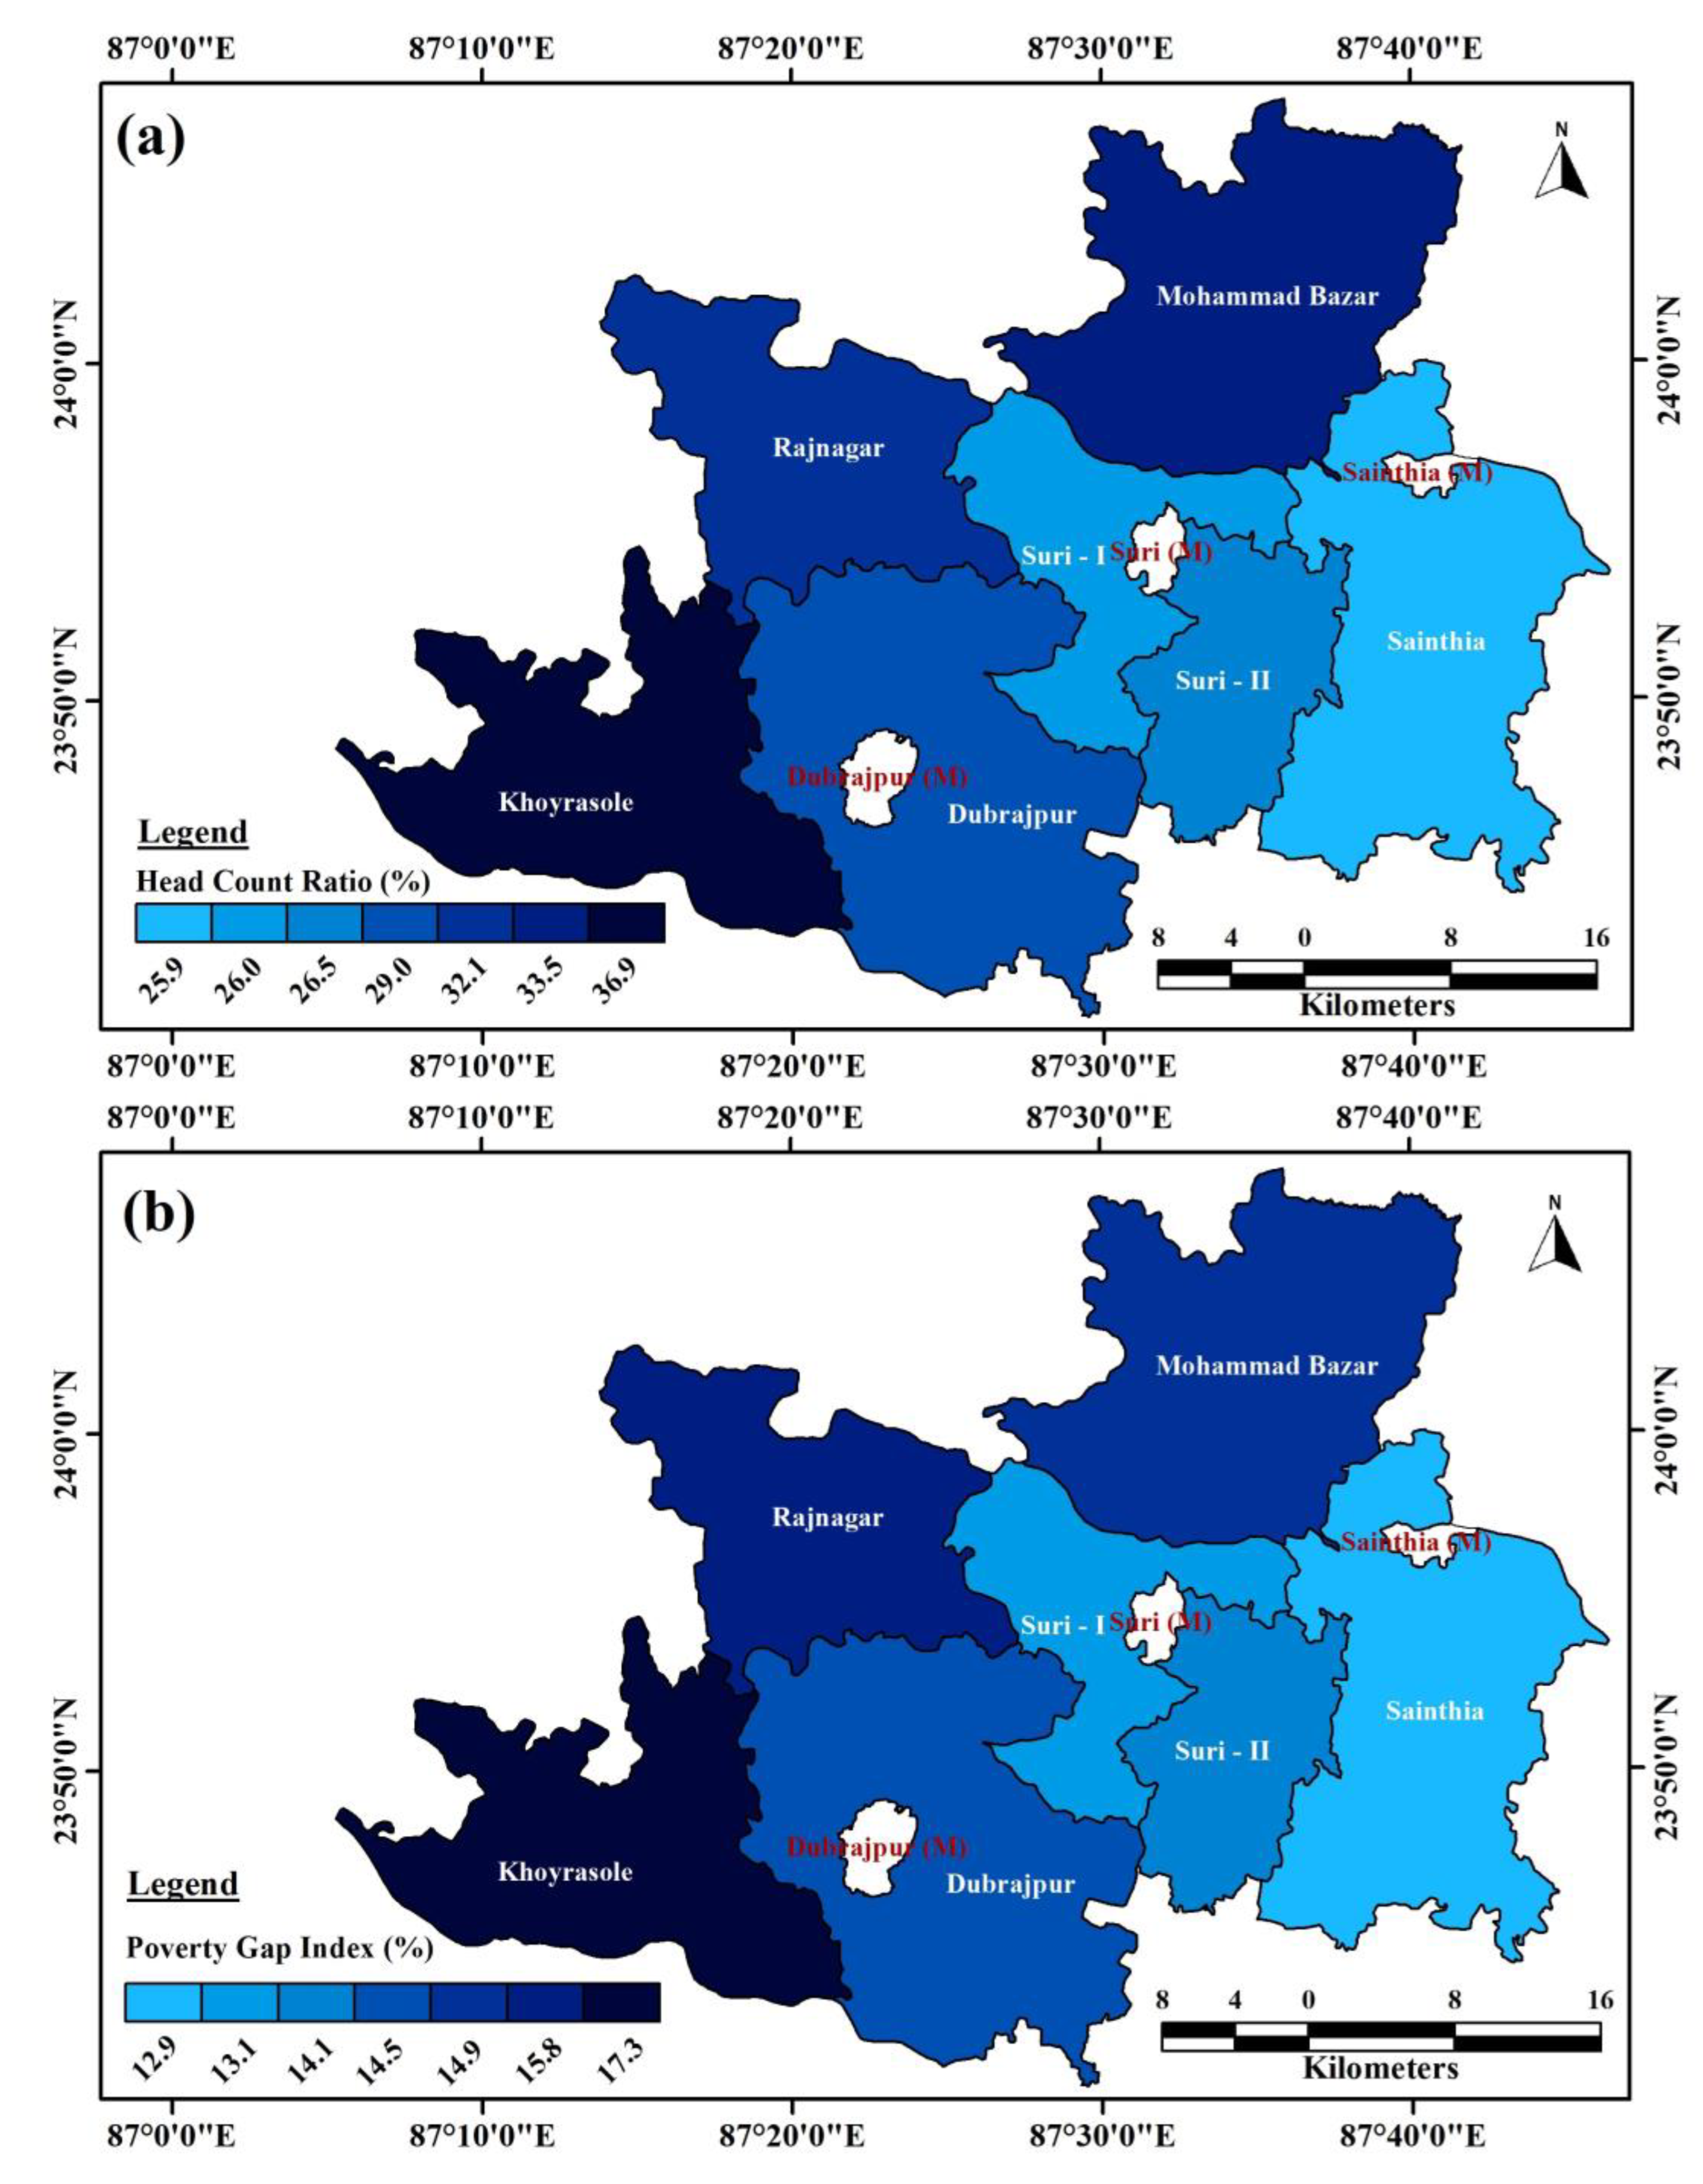
3.1. Overview of Unidimensional Poverty
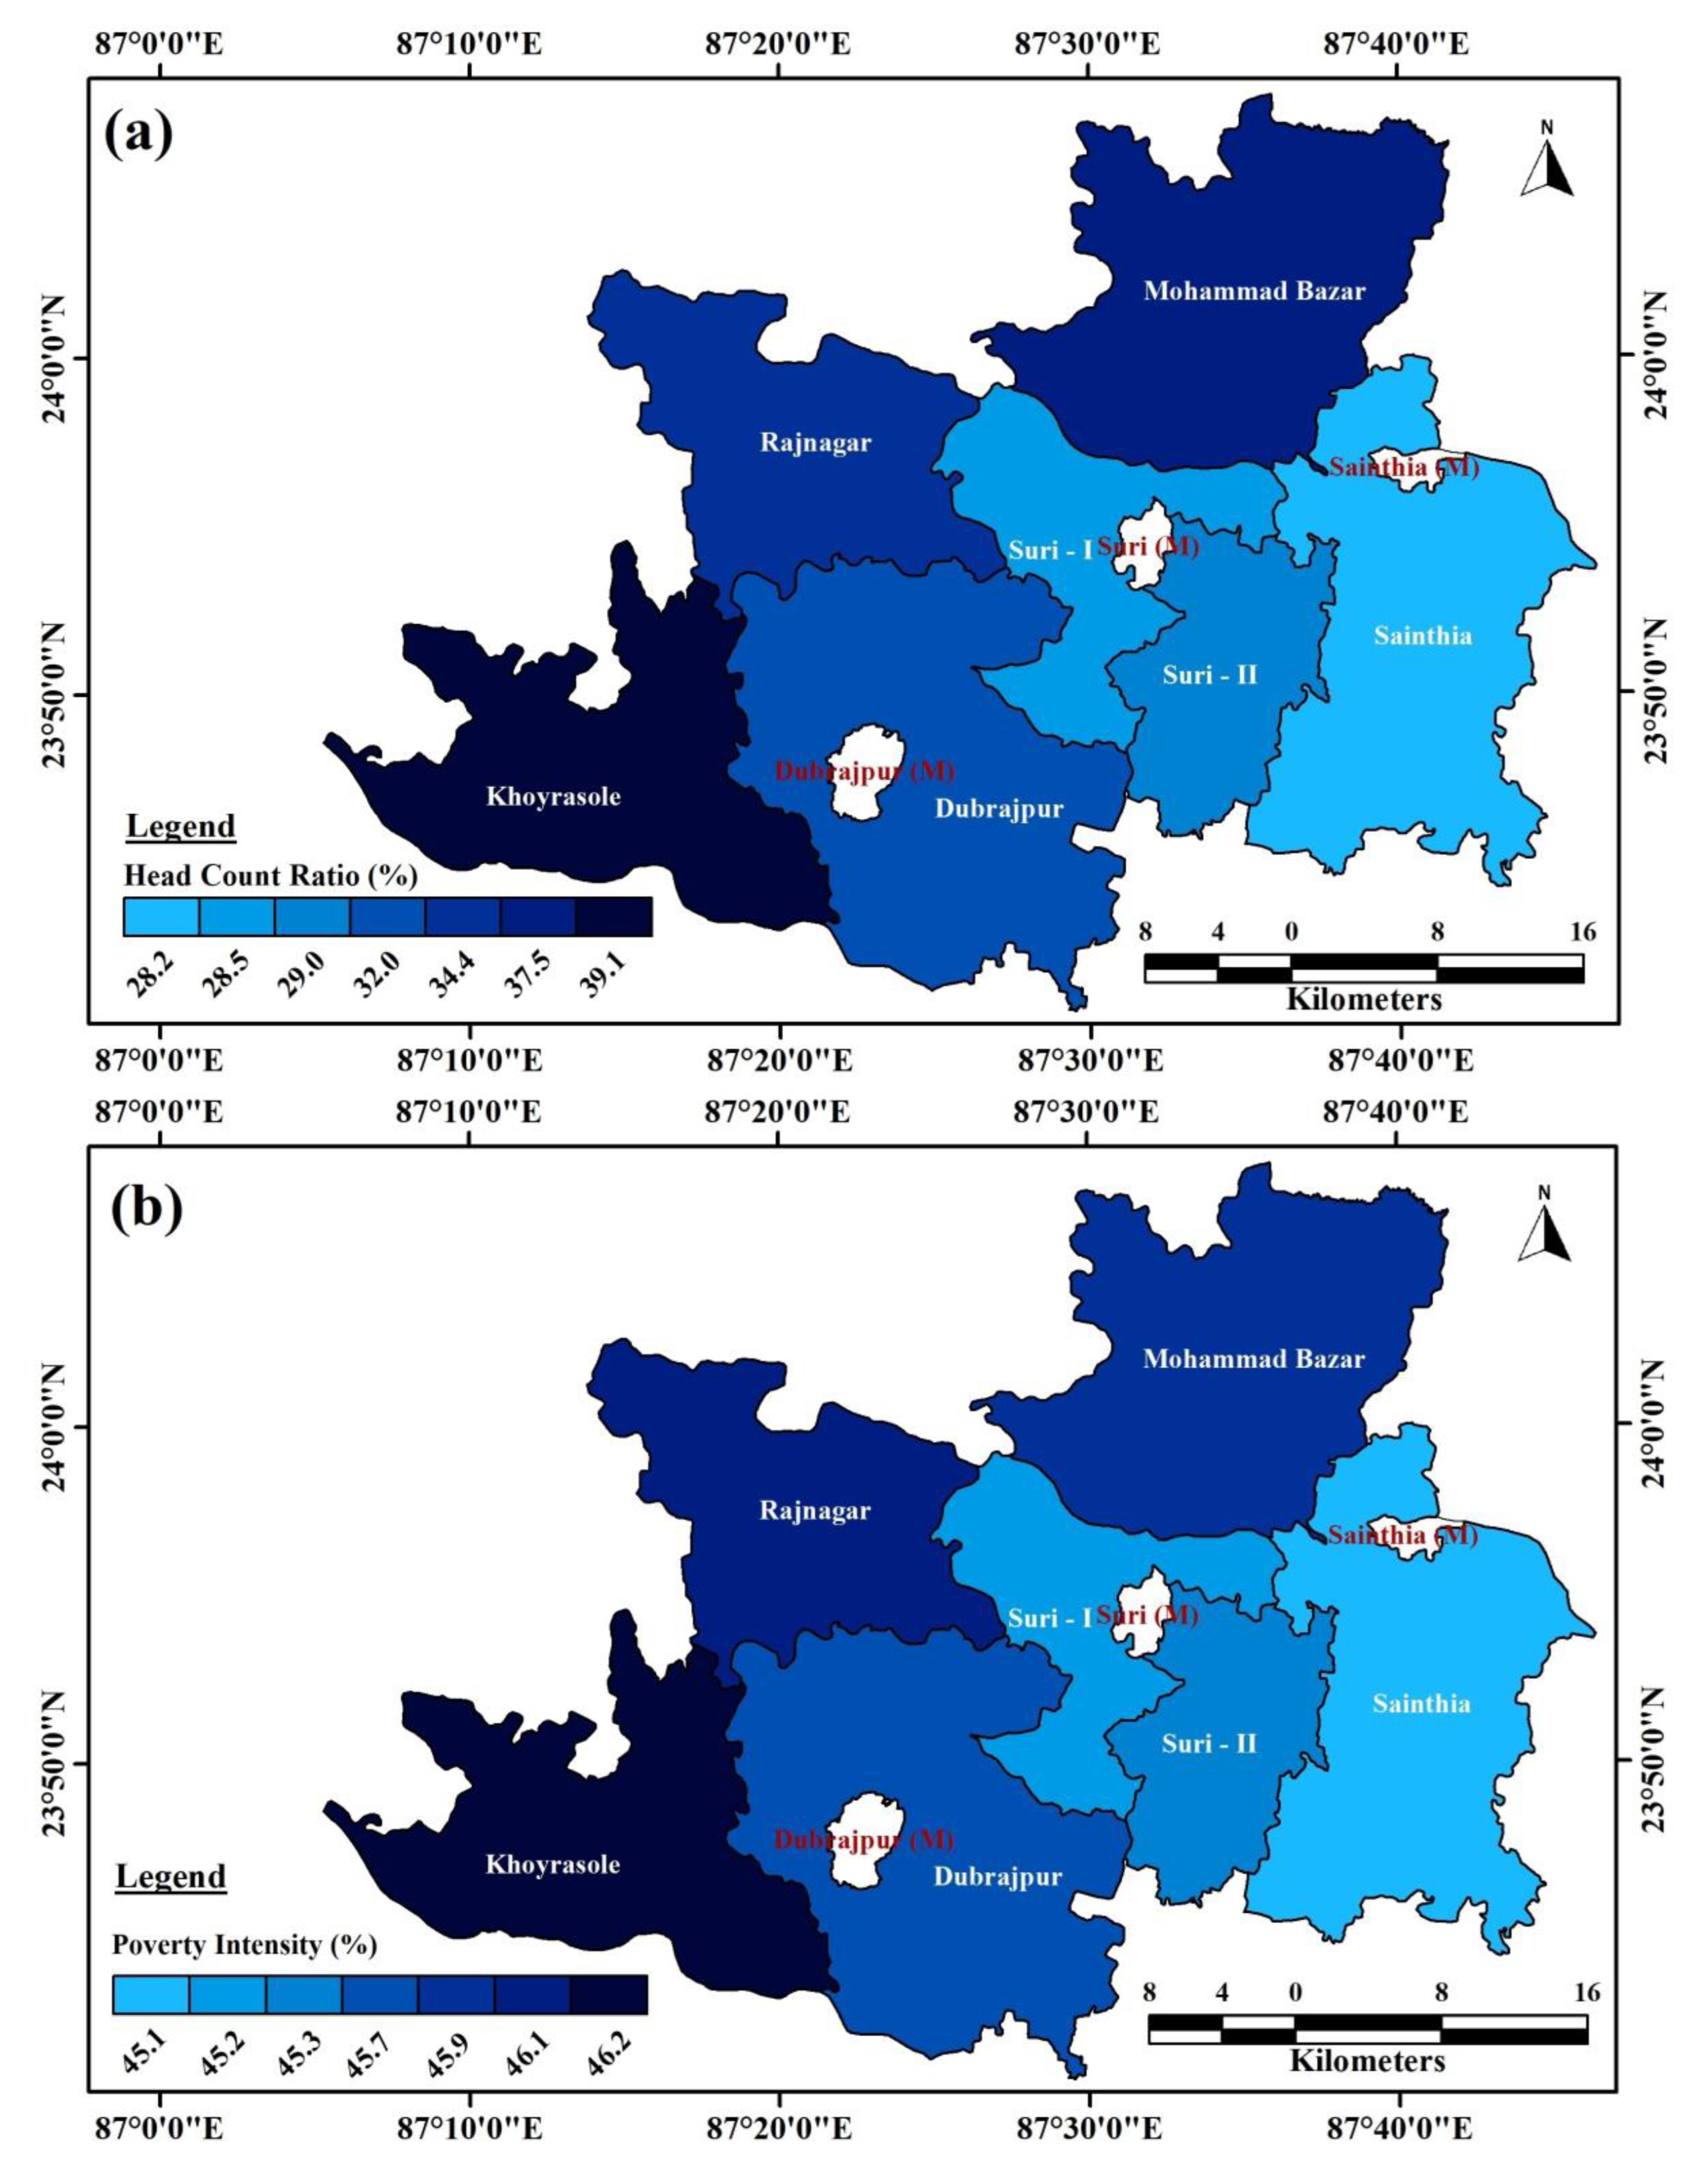
3.2. Overview of Multidimensional Poverty
4. Discussion
5. Conclusions
Author Contributions
Funding
Institutional Review Board Statement
Informed Consent Statement
Data Availability Statement
Conflicts of Interest
References
- Sumner, A. Economic Well-Being and Non-Economic Well-Being A Review of the Meaning and Measurement of Poverty. United Nations Res. Pap. 2004, 30, 1–21. [Google Scholar]
- Sen, A. Social Exclusion: Concept, Application, and Scrutiny; Asian Development Bank: Manila, Philippines, 2000; ISBN 9715612741. [Google Scholar]
- Estivill, J. Concepts and Strategies for Combating Social Exclusion an Overview; International Labour Office, STEP/Portugal: Geneva, Switzerland, 2003; ISBN 9221136523. [Google Scholar]
- Davis, E.P.; Sanchez-martinez, M. A Review of the Economic Theories of Poverty; National Institute of Economic and Social Research: London, UK, 2014; pp. 1–65. [Google Scholar]
- Atkinson, A.B.; Marlier, E. Analysing and Measuring Social Inclusion in a Global Context; United Nations: New York, NY, USA, 2010; ISBN 9789211302868. [Google Scholar]
- Hasan, S. Literature Review of Poverty and Urban Development Indicators; Homeless International: Coventry, UK, 2002; pp. 1–41. [Google Scholar]
- Ravallion, M. Poverty Lines in Theory and Practice: Living Standards Measurement Studty; World Bank: Washington, DC, USA, 1998; ISBN 0821342266. [Google Scholar]
- Krantz, L. The Sustainable Livelihood Approach to Poverty Reduction: Division for Policy and Socio-Economic Analysis. Div. Policy Socio-Econ. Anal. 2001, 44, 1–27. [Google Scholar]
- Genevey, R.; Pachauri, R.K.; Tubiana, L. Reducing Inequalities: A Sustainable Development Challenge; The Energy and Resources Institute, TERI: Mithapur, India, 2013; ISBN 978-81-7993-530-9. [Google Scholar]
- Sen, A. Poverty: An Ordinal Approach to Measurement. Econom. Soc. 1976, 44, 219–231. [Google Scholar] [CrossRef]
- Bourguignon, F.; Chakravarty, S.R. The Measurement of Multidimensional Poverty. J. Econ. Inequal. 2003, 103, 239–248. [Google Scholar] [CrossRef]
- Alkire, S. Choosing Dimensions: The Capability Approach and Multidimensional Poverty; Palgrave Macmillan: London, UK, 2012; ISBN 1904049877. [Google Scholar]
- Sen, A. Develeopment as Freedom; Anchor Books: New York, NY, USA, 1999; p. 384. [Google Scholar]
- Sen, A. Commodities and Capabilities; Oxford University Press: Oxford, UK, 1990; ISBN 9780195650389. [Google Scholar]
- Wijekoon, R.; Sabri, M.F.; Paim, L. Poverty: A Literature Review of the Concept, Measurements, Causes and the Way Forward. Int. J. Acad. Res. Bus. Soc. Sci. 2021, 11, 93–111. [Google Scholar] [CrossRef] [PubMed]
- Roshani, M.; Çamur, K.C. A Systematic Review of Multidimensional Urban Poverty and Deprivation Indicators. Geogr. Plan. Tour. Stud. 2023, 3, 50–69. [Google Scholar] [CrossRef]
- Cornia, G.A. Inequality Growth and Poverty in an Era of Liberalization and Globalization; Oxford University Press: Oxford, UK, 2004; ISBN 9780191601255. [Google Scholar]
- Arbatli-Saxegaard, E.; Coppo, M.; Khalil, N.; Kotera, S.; Unsal, D.F. Inequality and Poverty in India: Impact of COVID-19 Pandemic and Policy Response. IMF Work. Pap. 2023, 2023, 1–34. [Google Scholar] [CrossRef]
- Hari, K.S.; Hatti, N. Poverty and Inequality in India: An Exploratory Analysis. Soc. Sci. Spectr. 2015, 1, 249–261. [Google Scholar]
- Hnatkovska, V.; Lahiri, A. The Rural-Urban Divide in India; International Growth Center, London School of Economics and Political Science: London, UK, 2012; pp. 1–38. [Google Scholar]
- Kumar, A.K.S. Poverty and Human Development in India: Getting Priorities Right; United Nations Development Programme: New York, NY, USA, 2007; Volume 14, pp. 713–715. [Google Scholar] [CrossRef]
- Linn, J.F. Urban Poverty in Developing Countries: A Scoping Study for Future Research. SSRN Electron. J. 2012. [Google Scholar] [CrossRef]
- Jha, R. Reducing Poverty and Inequality in India: Has Liberalization Helped? World Institute for Development Economics Research: Helsinki, Finland, 2004; ISBN 9780191601255. [Google Scholar]
- Bersisa, M.; Heshmati, A. A Distributional Analysis of Uni- and Multidimensional Poverty and Inequalities in Ethiopia; Springer: Heidelberg, The Netherlands, 2021; Volume 155, ISBN 0123456789. [Google Scholar]
- Asselin, L.-M.; Ki, J.-B.; Anh, V.T. Analysis of Multidimensional Poverty Theory and Case Studies; Springer: New York, NY, USA, 2009; ISBN 9781552504604. [Google Scholar]
- Costa, M. A Comparison between Unidimensional and Multidimensional Approaches to the Measurement of Poverty; IRISS Working Papers; CEPS/INSTEAD: Luxembourg, 2003. [Google Scholar]
- Pomati, M.; Nandy, S. Measuring Multidimensional Poverty According to National Definitions: Operationalising Target 1.2 of the Sustainable Development Goals. Soc. Indic. Res. 2020, 148, 105–126. [Google Scholar] [CrossRef]
- Santos, M.E. Multidimensional poverty measurement: Motivation, approaches, methodological issues and axiomatic indices. Encycl. Life Support Syst. 2002, 1–46. [Google Scholar]
- D’Attoma, I.; Matteucci, M. Multidimensional Poverty: An Analysis of Definitions, Measurement Tools, Applications and Their Evolution over Time through a Systematic Review of the Literature up to 2019; Springer: Heidelberg, The Netherlands, 2023; ISBN 0123456789. [Google Scholar]
- Rakic, B.; Rakic, M. A Holistic Approach to the Causes and Consequences of the Poverty and Wealth of Countries, Companies and Individuals in the Context of Sustainable Development and Sustainability. International Monograph of Scientific-Research Interdisciplinary Project: Comparative Analysis of Social Entrepreneurship in Serbia, Russia, Europa and in the World; Faculty of Business Studies and Law, University “Union-Nikola Tesla”: Belgrade, Serbia, 2018; pp. 257–286. [Google Scholar]
- Mondal, S.; Kumar, S.; Mishra, A.P. Contextualizing Spatiality of Multidimensional Poverty in Rural and Urban India: A Geographical Perspective. Belgeo 2023, 1. [Google Scholar] [CrossRef]
- Belhadj, B.; Limam, M. Unidimensional and Multidimensional Fuzzy Poverty Measures: New Approach. Econ. Model. 2012, 29, 995–1002. [Google Scholar] [CrossRef]
- Sahoo, P.; Mondal, S.; Kumar, V. Multidimensional Deprivations among Social Groups in Rural India: A State Level Analysis. GeoJournal 2023, 88, 6137–6159. [Google Scholar] [CrossRef]
- Ghosh, R.; Das, N.; Mondal, P. Explanation of Major Determinants of Poverty Using Multivariate Statistical Approach and Spatial Technology: A Case Study on Birbhum District, West Bengal, India. GeoJournal 2022. [Google Scholar] [CrossRef] [PubMed]
- Antyodaya, M. Mission Antyodaya Survey Report; Department of Rural Development, Ministry of Rural Development, Government of India: New Delhi, India, 2020. [Google Scholar]
- Abdulla, F.; Hossain, M.M.; Rahman, M.M. On the Selection of Samples in Probability Proportional to Size Sampling: Cumulative Relative Frequency Method. Math. Theory Model. 2014, 4, 2224–5804. [Google Scholar]
- Skinner, C.J. Probability Proportional to Size (PPS) Sampling. Wiley StatsRef Stat. Ref. Online 2016, 1–5. [Google Scholar] [CrossRef]
- Cochran, W.G. Sampling Techniques; John Wiley & Sons: New York, NY, USA, 1977; ISBN 0-471-16240-X. [Google Scholar]
- Bagli, S.; Tewari, G. Multidimensional Poverty: An Exploratory Study in Purulia District, West Bengal. Econ. Aff. 2019, 64, 517–527. [Google Scholar] [CrossRef]
- Datt, G.; Ravallion, M. Has India’s Economic Growth Become More Pro-Poor in the Wake of Economic Reforms? World Bank Econ. Rev. 2009, 25, 157–189. [Google Scholar] [CrossRef]
- Sen, A. Himanshu Poverty and Inequality in India-II: Widening Disparities during 1990s. Econ. Polit. Wkly. 2004, 39, 4361–4375. [Google Scholar]
- Park, E.Y.; Nam, S.J. Multidimensional Poverty Status of Householders with Disabilities in South Korea. Int. J. Soc. Welf. 2019, 29, 41–50. [Google Scholar] [CrossRef]
- Bossert, W.; Cato, S.; Kamaga, K. Generalized Poverty-Gap Orderings. Soc. Indic. Res. 2022, 164, 189–215. [Google Scholar] [CrossRef]
- Alkire, S.; Santos, M.E. A Multidimensional Approach: Poverty Measurement & Beyond. Soc. Indic. Res. 2013, 112, 239–257. [Google Scholar]
- Gibba, M. A Study of Multidimensional Poverty Index in the Gambia: Alkire-Foster Approach. In Proceedings of the 35th IARIW General Conference, Copenhagen, Denmark, 20–25 August 2018; pp. 26–29. [Google Scholar]
- Wagle, U.; Vollmer, F.; UN DESA; Thorbecke, E.; Sen, A.; Santos, M.E.; Lugo, M.A.; Lopez-calva, L.F.; Cruces, G.; Battiston, D.; et al. Multidimensional Poverty Measurement and Analysis: Chapter 5—The Alkire-Foster Counting Methodology; Oxford Poverty & Human Development Initiative, University of Oxford: Oxfrod, UK, 2010; Volume 9, ISBN WPS 5580. [Google Scholar]
- Alkire, S.; Foster, J. Counting and Multidimensional Poverty Measurement. J. Public Econ. 2011, 95, 476–487. [Google Scholar] [CrossRef]
- NITI Aayog. National Multidimensional Poverty Index Baseline Report; NITI Aayog: New Delhi, India, 2021; Volume 4. [Google Scholar]
- Wagle, U.R. The Counting-Based Measurement of Multidimensional Poverty: The Focus on Economic Resources, Inner Capabilities, and Relational Resources in the United States. Soc. Indic. Res. 2014, 115, 223–240. [Google Scholar] [CrossRef]
- Duclos, J.-Y.; Tiberti, L. Multidimensional Poverty Indices: A Critical Assessment. SSRN Electron. J. 2016. [Google Scholar] [CrossRef]
- Ataguba, J.E.O.; Ichoku, H.E.; Fonta, W.M. Multidimensional Poverty Assessment: Applying the Capability Approach. Int. J. Soc. Econ. 2013, 40, 331–354. [Google Scholar] [CrossRef]


| Serial Number | Community Development Block | Total Households | Sample Households | Non-Responded Sample (5%) | Final Sample Households |
|---|---|---|---|---|---|
| 1 | Md. Bazar | 36,344 | 380 | 19 | 399 |
| 2 | Rajnagar | 14,875 | 374 | 19 | 393 |
| 3 | Suri-I | 22,194 | 378 | 19 | 397 |
| 4 | Suri-II | 20,808 | 377 | 19 | 396 |
| 5 | Sainthia | 44,337 | 381 | 19 | 400 |
| 6 | Khoyrasole | 34,107 | 380 | 19 | 399 |
| 7 | Dubrajpur | 40,439 | 381 | 19 | 400 |
| Total Households = 213,104 | Total Sample Household = 2784 |
| Serial Number | Community Development Block | Headcount Ratio (%) | Poverty Gap Index (%) |
|---|---|---|---|
| 1 | Rajnagar | 31.2 | 15.8 |
| 2 | Md. Bazar | 33.5 | 14.9 |
| 3 | Suri-I | 26.0 | 13.1 |
| 4 | Sainthia | 25.9 | 12.9 |
| 5 | Suri-II | 26.5 | 14.1 |
| 6 | Khoyrasole | 36.9 | 17.3 |
| 7 | Dubrajpur | 29.0 | 14.5 |
| Suri Sadar Sub-Division | 27.2 | 11.7 | |
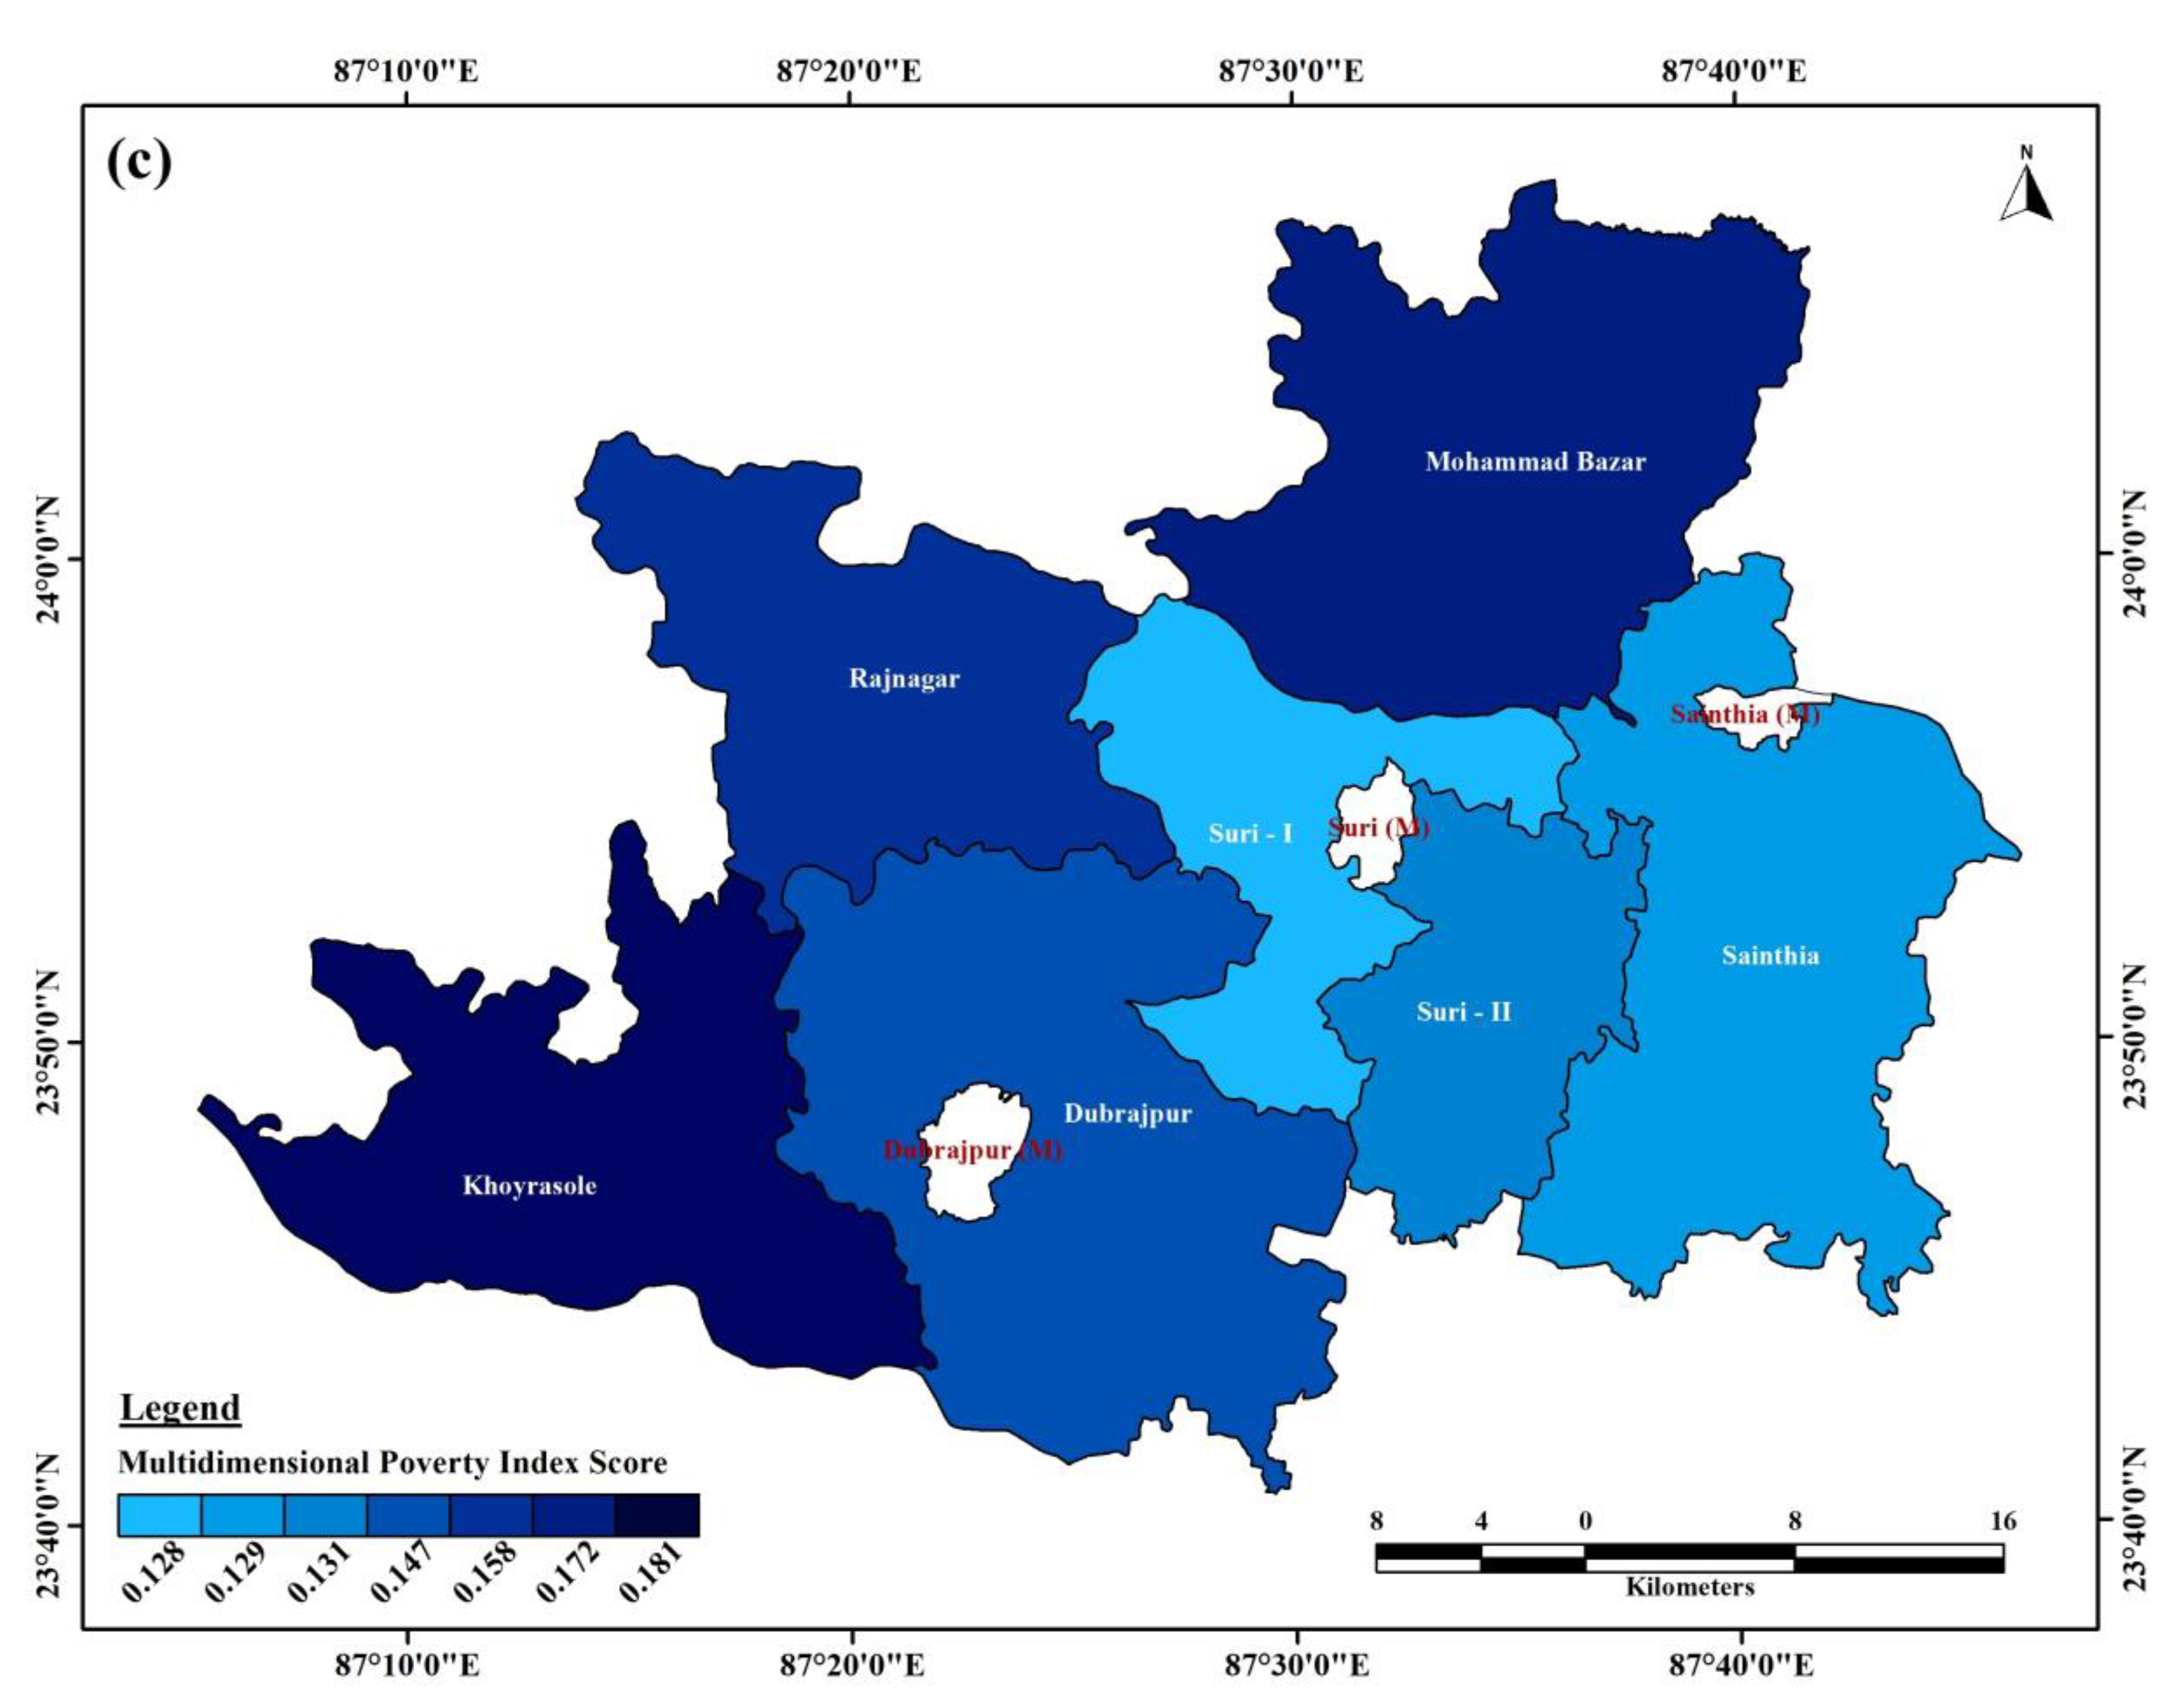
| Serial Number | Community Development Block | Incidence of Multidimensional Poverty (%) | Multidimensional Poverty Intensity (%) | Multidimensional Poverty Index |
|---|---|---|---|---|
| 1 | Rajnagar | 34.4 | 45.9 | 0.158 |
| 2 | Md. Bazar | 37.5 | 45.7 | 0.172 |
| 3 | Suri-I | 28.2 | 45.2 | 0.128 |
| 4 | Sainthia | 28.5 | 45.1 | 0.129 |
| 5 | Suri-II | 29.0 | 45.3 | 0.131 |
| 6 | Khoyrasole | 39.1 | 46.2 | 0.181 |
| 7 | Dubrajpur | 32.0 | 46.1 | 0.147 |
| Suri-Sadar Sub Division | 0.26.8 | 45.2 | 0.121 | |
Disclaimer/Publisher’s Note: The statements, opinions and data contained in all publications are solely those of the individual author(s) and contributor(s) and not of MDPI and/or the editor(s). MDPI and/or the editor(s) disclaim responsibility for any injury to people or property resulting from any ideas, methods, instructions or products referred to in the content. |
© 2024 by the authors. Licensee MDPI, Basel, Switzerland. This article is an open access article distributed under the terms and conditions of the Creative Commons Attribution (CC BY) license (https://creativecommons.org/licenses/by/4.0/).
Share and Cite
Ghosh, R.; Mondal, P. Unveiling the Complex Facets of Poverty: Unidimensional and Multidimensional Insights from Rural Areas of Suri Sadar Sub-Division, Birbhum District, Eastern India. Societies 2024, 14, 54. https://doi.org/10.3390/soc14040054
Ghosh R, Mondal P. Unveiling the Complex Facets of Poverty: Unidimensional and Multidimensional Insights from Rural Areas of Suri Sadar Sub-Division, Birbhum District, Eastern India. Societies. 2024; 14(4):54. https://doi.org/10.3390/soc14040054
Chicago/Turabian StyleGhosh, Ranajit, and Prolay Mondal. 2024. "Unveiling the Complex Facets of Poverty: Unidimensional and Multidimensional Insights from Rural Areas of Suri Sadar Sub-Division, Birbhum District, Eastern India" Societies 14, no. 4: 54. https://doi.org/10.3390/soc14040054