Abstract
In this paper, we analyze whether work values differ between three dimensions of time (age, birth cohort, period). Using data of five waves of the World Values Survey and the European Values Study from more than forty countries and hierarchical age-period-cohort regression models, we did not find relevant gaps between birth cohorts with respect to the relative importance of work or with respect to work values. Thus, we claim that, in European and Euro-Atlantic countries, birth cohorts, on average, do not differ significantly with regard to their work values. Our results suggest, however, that the relative importance of work is significantly higher in the middle-age groups than among the younger or older groups. Regarding work values, we found that the importance of having an interesting job, good pay, and good hours decreases with age, and that job security is equally important at every age, whereas the importance of having a useful job increases with age.
1. Introduction
Political speeches and everyday intellectual discourses paint the younger generations as less and less work-oriented. Specifically, they are thought to be increasingly less ready to perceive work as the center of their identity. The explanation usually goes as follows: in younger generations, the fact that it seems impossible to achieve what previous generations obtained in terms of their careers (stability with attractive benefits and pension) generates attempts to reduce cognitive dissonance by rejecting the value of these achievements. It is thought that these attitudinal trends are likely to be exacerbated by the growing obstacles to labor market entry, lengthening spells of unemployment or underemployment, and/or the spread of precarious work.
In this paper1, our aim is to add to the literature on generational and cohort differences in work values. Using data from cross-national surveys we analyze to what extent—if at all—do variously operationalized work values differ between three dimensions of time. More specifically, we analyze whether the centrality (or importance) of work and intrinsic and extrinsic values vary by birth cohorts, age groups, and time periods, using data of five waves of the World Values Survey and the European Values Study from more than forty countries (most of the European countries and some OECD countries from the Euro-Atlantic area)2. The contribution of our paper is primarily empirical. Most of the previous papers on work-related values use research design and/or data that make it difficult to detect age, period, and cohort differences at a population (or national) level. We use hierarchical age-period-cohort (HAPC) models [3,4] that are a suitable solution for the analysis of individual level data of repeated cross-sectional surveys [5]. We are not aware of previous research applying HAPC models to work values. Thus, our analysis contributes an important new perspective on this topic by using a rarely used method in the analysis of work values.
2. Theoretical Background
2.1. Generational Differences in Work Values
It is not our intention to reopen the decade-long debates on the meaning and types of work values. In this paper, we rely on a simple but straightforward definition of work values: “work values are evaluative standards relating to work or the work environment by which individuals discern what is ‘right’ or assess the importance of preferences” [6] (p. 227).
Work values form a subset of the general value system [7]. The reason for separating this subset is that: “[…] work plays a fundamental role in human life by providing opportunities to satisfy different needs and goals, work values have been argued to be ‘salient, basic, and influential’, occupy a central position in the overall pattern of values, and share significant relationship with other personal values3” [8] (p. 326).
In our analysis, we use two types of work values already widespread in the existing literature. (1) Work centrality as a proxy for the respondents’ attitude toward work in general—in other words, how important work is for a respondent as part of their everyday life and identity. (2) Extrinsic/intrinsic work values that are much debated and variously operationalized in the organization, business, and management literature. An extrinsic work value is “dependent on a source external to the immediate task-person situation” (such as status, respect, power, influence, high salary), while an intrinsic value is “derived from the task per se; that is, from outcomes which are not mediated by a source external to the task-person situation. Such a state of motivation can be characterized as a self-fulfilling experience” [9] (pp. 497–498). Elizur [10] uses a categorization based on work outcomes and argues that intrinsic values represent cognitive, whereas extrinsic values represent either instrumental or affective outcomes4.
The most widely accepted hypothesis regarding the trend of work values (and particularly the centrality of work) holds that there is a decline in the relevance of work as an important part of an individual’s life: “Generation X for instance, has been labelled the ‘slacker’ generation, and employers complain that younger workers are uncommitted to their jobs and work only the required hours and little more. Conversely, Boomers may be workaholics […] while Traditionals have been characterized as the most hardworking generation” [14] (p. 5).
However, according to the review of Parry and Urwin [15] (p. 88) “the empirical evidence for generational differences […] is at best mixed. […] Those differences that are found are not consistent”. On the other hand, according to Lyons and Kuron [16] (p. S146) “there is rather modest evidence of generational differences in work attitudes”. They also review several studies on work values that used different measures, different samples, and yielded mixed results. Moreover, even when the studies were comparable, “the direction of observed differences sometimes varied” (p. S145).
Kowske et al. [17] comparing various generations in the United States (with a special focus on the so-called millennial generation) found that work attitudes differed across generations, although effect sizes were relatively small and the role of generation was significantly weaker than other labor-market sensitive factors such as gender, industry, and occupation. Regarding the impact of different generations, they found curvilinear trends (i.e., U-shaped curves). This means that the least satisfied with the various aspects of work were the baby boomers, while the “G.I.” (born around the time of World War II) and millennial generations were the most satisfied (the latter especially with recognition and career).
Jurkiewicz [18] comparing Generation X and Baby Boomers found that the latter ranked some intrinsic values (“chance to learn new things” and “freedom from pressures”) higher than the former, whereas Generation Xers ranked another intrinsic value (“freedom from supervision”) higher. Lyons et al. [19] found that the importance of altruistic work values has decreased over time, the Silent Generation assigning the most importance to altruism and Generation Y the least.
To conclude, we quote from a paper in which the authors convincingly summarize the theoretical and methodological state of the art on the topic of generations: “Considering the extent to which generational stereotypes are commonly accepted, it is surprising that empirical evidence of generational differences is relatively sparse, and the research that exists is somewhat contradictory. One stream of research supports the general stereotypes […]. Another stream of research has found few, if any, generational differences in a variety of employee characteristics […]. Considering these inconsistent findings, there exists a great deal of controversy about whether or not generational differences exist at all […]. Scholars have also noted that observed generational differences may be explained, at least in part, by age, life stage, or career stage effects instead of generation5” [20] (pp. 175–176).
2.2. Birth Cohort versus Generation
We decided to use the concept of birth cohort as opposed to generation because the latter is rife with ambiguities and the attempts to analyze it empirically are often debatable.
The term “generation” refers to individuals born around the same time who experience more or less similar life events during their early years. The underlying assumption is that since in their most sensitive years6 they are exposed to identical political/economic/social events (e.g., wars, social or economic booms and crises, natural disasters, technological innovation, policy and political changes, etc.), their values will be rather similar to each other’s and different from other generations [15]. Such generation-specific values may become the basis of generation-specific identities [22]—i.e., the impetus of these values may be strong enough to mobilize a group of opinion leaders who influence their fellows from the same cohort to identify themselves as an “imagined generational community”, If such a feeling of generational identity takes hold, then the shared set of values and goals becomes the common denominator of a generation—i.e., one type of subculture [23] (p. 210).
Unfortunately, there are several problems with the generation concept. Firstly, it is plausible that there are no global generations, i.e., a generation cannot be assumed to have identical features all over the planet. Thus, when using cross-national data, the global generation concept will be controversial. To illustrate our point: while usually in the literature the political/economic/technological periodization of generations follows the dominant trends in the United States7, Diepstraten, Ester, and Vinken [22] identify “prewar”, “silent”, “protest”, “lost” and “pragmatic” generations for the Netherlands on the basis of an entirely different national “story”.
Secondly, the width of a generation is often much too loosely defined timewise to assume that the members of a generation indeed have similar experiences.
Thirdly, the empirical analysis of the generation is often based on anecdotal evidence or on invalid and unreliable survey data. For example:
- -
- The surveys often use research designs that are unable to decompose age or career stage differences, let alone generational differences (e.g., [25]).
- -
- The data are often restricted to only one or two generations, and to one or a few countries [15], and/or cover only special subgroups such as high school and college students (e.g., [24,26]).
- -
- Those (often huge) datasets that cover the entire economically active population are not representative due to selection bias (e.g., Kowske et al. [17] use self-administered questionnaires by volunteers who responded to an advertisement) or focusing only on a special segment of the labor force (usually a large firm or an occupation).
Unlike generation, “birth cohort” is defined narrowly and equally, usually as a five-year-wide “mini-generation”, and has a neutral meaning—i.e., it does not assume any a priori “significant event”. According to Parry and Urwin [15] (p. 83), a cohort is an “atheoretical construct”. Consequently, when applied in a comparative analysis since the content of the same birth cohort can be different country by country, the analysis can be more specific and dynamic (e.g., the same five-year cohort can be war-ridden in one country and the beneficiary of an economic miracle in another, or the same generation-creating innovation, such as the TV or the World Wide Web, can define birth cohorts differently, depending on the level of penetration of electricity and internet). Finally, being glocal and non-ideological, the birth cohort can be a better unit of analysis to incorporate within-generational differences by social strata, region, and ethnicity in the same country.
3. Methodological Background
The basic problem in analyzing the role of generation is that the effects of the three aspects of time—age, time period, and birth cohort—are closely intertwined. Any change over time can be determined by any of these three effects, as illustrated by the following fictional dialogue, based on Suzuki [27] (p. 452):
Endre: I’m very tired, I must be getting old. (Age effect)Gábor: You’re no spring chicken indeed, but maybe you’re going to bed so early every evening because life is so stressful nowadays. (Period effect)Endre: Could be, but you seem to be tired, too. The truth is, you young people are not as fit as we used to be at your age. (Cohort effect)
Since age, period (year of the survey), and birth cohort (year of birth) are linearly interdependent, their effects cannot be simultaneously estimated using standard regression models [3,4,28]. This perfect linear dependency is clear if we take the example of a forty-five-year-old individual who is interviewed in 1995. If we know these two pieces of data, we also know that her/his birth cohort (birth year) must be 1950.
As a possible solution to this identification problem for individual level data of repeated cross-sectional surveys, Yang and Land [3,4] propose cross-classified hierarchical (or multilevel) models to represent clustering effects in individual survey responses by period and birth cohorts when using repeated cross-sectional data8. They note that using hierarchical regression models is necessary since individuals are nested within birth cohorts and survey year. They use single years of age, time periods (the year when the survey was conducted), and birth cohorts defined by five-year intervals. In this way, the exact age of the respondents cannot be calculated from the year of the survey and the birth cohort group—i.e., there is no linear dependence between the three variables. In addition, they use a quadratic age variable.
Others, however, for example, Bell and Jones [31,32], argue that there is no statistically and mathematically correct solution to the age-period-cohort identification problem. They propose therefore that the research should be based on a priori assumptions. If the research can either deductively claim and/or empirically prove that one of the three time dimensions has no significant effect on the phenomenon proper, then the problem of multicollinearity is reduced. They use simulations to show how HAPC models could be misleading: the effects of the three time-related variables might be assigned to each other or be combined by the effects of the other two variables. However, they also show that the model works if there are no linear (or nonlinear) trends in periods or cohorts.
Answering these critics, Reither, Masters, et al. [33] argue that data generated by Bell and Jones are “theoretical improbable and empirically rare”. They also show empirically that the HAPC model works in “real-life situations” where the researchers do not suppose perfectly linear cohort and period effects. In another paper, Reither, Land, et al. [5]—demonstrating the consensus among APC scholars with an expanded list of coauthors—conclude that APC models fail only in the presence of exact algebraic effects of temporal variables, but in other specifications, APC models (including HAPC) are appropriate.
Since we have data from large cross-national surveys, the HAPC modeling framework is suitable for our analysis. To minimize the effect of multicollinearity between age, birth cohort, and period, we define fixed and equal time period (year of the survey) clusters. We use the year of fieldwork country by country, and these years are grouped together into five-year intervals, which can be considered the most “natural” (i.e., “theory-blind”) grouping principle. These five-year intervals almost exactly cover the original waves of the WVS. In these grouped data, period (with five-year intervals), age, and birth cohort (year of birth) are not perfectly dependent, in other words, we are no longer able to directly calculate the year of birth from age and period clusters; nonetheless, remarkable multicollinearity still remains. Moreover, we accept the reasoning of Yang and Land [4] that whereas the age variable is related to the biological process of individual aging, period and cohort effects reflect the influences of external (political, technological, economic, etc.) forces, thus the latter two variables can be treated as macro-level variables9. This means that we work with a multilevel data structure [34,35] assuming that the attitudes of individuals in the same birth cohort or interviewed in the same year will be more similar than those of individuals interviewed in different years or born in different birth cohorts.
Thus, we use HAPC models where it is assumed that individuals are nested simultaneously within the two second-level variables (period and cohort). In our case, since we use cross-national surveys, they are also nested within countries.
The level-1 model is the following:
the level-2 model is
and the combined model is
where, within each cohort j and period k, and country c, respondents’ work attitude is a function of their age, squared age, and other individual characteristics (vector of X). The control variables are the following: gender, education, marital status, labor force status, type of settlement. This model allows level-1 intercepts to vary randomly by cohorts, periods, and countries. β0jkc is the mean of the work attitude variable of individuals in cohort j, period k, and country c (cell mean); β1, β2, and β3 are the level-1 fixed effects; eijkc is the random individual variation, which is assumed normally distributed with mean 0 and within-cell variance σ2; γ0 is the grand mean (across all cohorts, periods, and countries) or the model intercept, u0j is the residual random effect of cohort j, v0k is the residual random effect of period k, w0c is the residual random effect of country c. u0j, v0k, and w0c are assumed normally distributed with mean 0 and variance τu, τv, and τw, respectively10. We estimate the models using the mixed command of Stata [37].
4. Work Centrality
4.1. Data
Given that our strategy of analyzing the changing (or unchanging) attitudes of generations toward work is based on secondary analysis of large, cross-sectional, cross-national data, we first have to select those questions that could be used as proxies of work values. Unlike other researchers who used these variables to create latent variables based on complex scaling techniques (e.g., [38,39,40]), we want to keep our variables simple. When analyzing unidimensional or global constructs like work centrality, single-item measures reduce the common method variance and have better face-validity and according to empirical analyses they are appropriate and provide useful information [41,42,43,44].
In the first analysis, our main dependent variable is work centrality (or the importance of work). We use data of the World Values Survey/European Values Study (WVS/EVS)11. Respondents were asked to answer the following question: “How important is [life aspect] in your life?” on a four-point scale. The coding was as follows: 1 = very important, 2 = quite important, 3 = not important, 4 = not important at all. Life aspects were, among others, work, family, friends, leisure time, and religion. We calculate the relative importance of work by using reverse-coded variables and by dividing the importance of work and the average importance of all other life aspects that were asked in the questionnaires12. Thus, the variable has values over 1 if work is more important in the respondent’s life than other life aspects, whereas it has a lower value than 1 if work plays a relatively small role in the respondent’s life. In this analysis, we also use the variables of relative importance of the other four life aspects (family, friends, leisure time, religion) that we calculate with an identical method to relative importance of work.
Questions about the importance of life aspects were asked in the second to sixth waves of the WVS/EVS. However, since the number of countries between 2000 and 2004 is low (ten countries) we exclude this period from the analysis. Thus, we have data from four periods: 1990–1994, 1995–1999, 2005–2009, 2010–2014. Our analysis covers most of the European countries and some countries from the Euro-Atlantic area. We restrict the sample for respondents between age 18 and 79 to have enough number of observations in every year of age. We exclude respondents with missing data on importance of life aspects. Our final sample size is 209,851. The number of observations and the means of the importance of life aspects by period are shown in Table 113.

Table 1.
Number of observations and the average of relative importance of life aspects by period.
4.2. Results
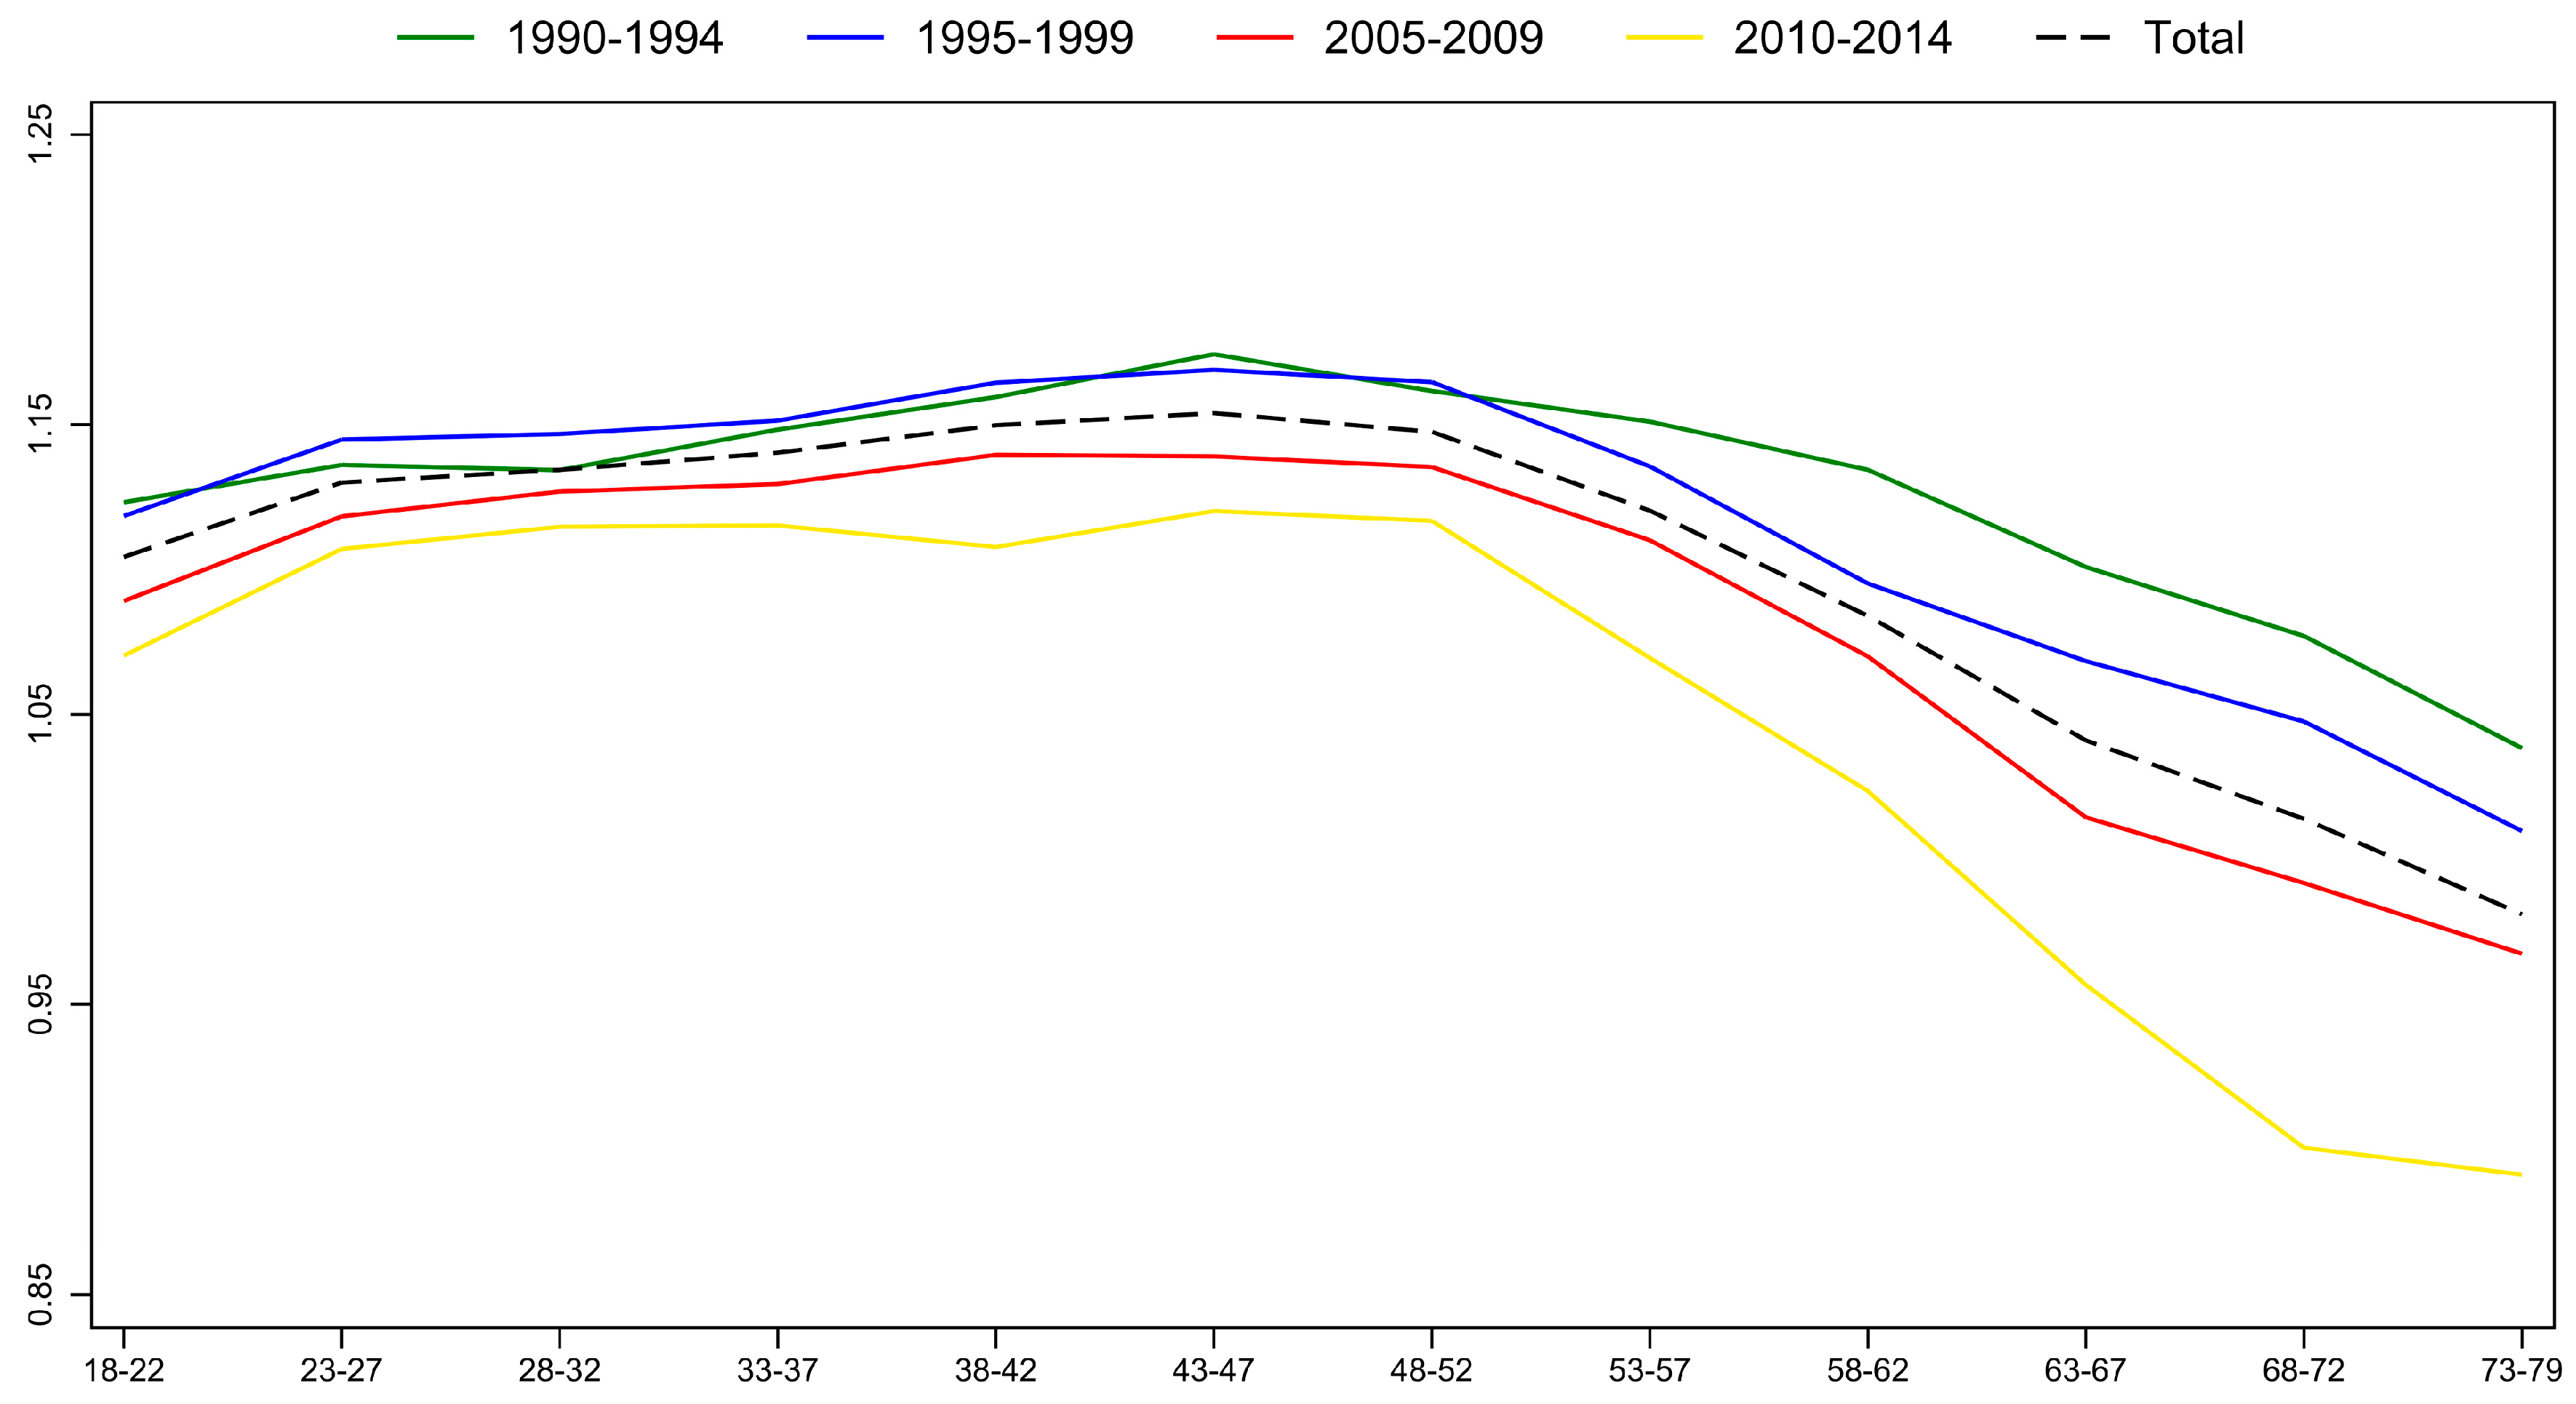
As an introduction, Figure 1 displays descriptive results: the mean relative importance of work by age group and period (uncontrolled by cohort). The general pattern is rather similar in the four periods: the relative centrality of work increases slightly until age 43–47 and decreases sharply thereafter. People seem to slowly “learn” the importance of work, but this holds only as long as they are in their active years.
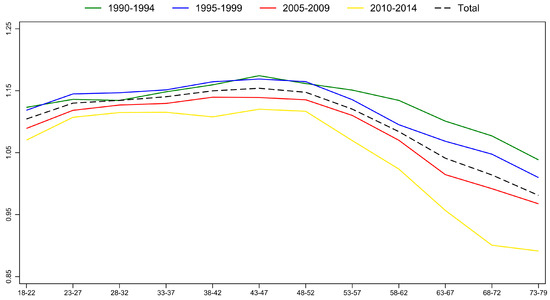
Figure 1.
Means of relative importance of work (y-axis) by age groups (x-axis) in the four periods.
For every age group, the importance of work is lowest in the last period (2010–2014). Among those aged over 53, work becomes less important in every subsequent period, whereas among the younger age groups, there is no difference between the first two periods and the decrease in the third and in the fourth period is much smaller. This means that the relative importance of work seems to be more or less stable among the young, but falls sharply among the old between 1990–1994 and 2010–2014.
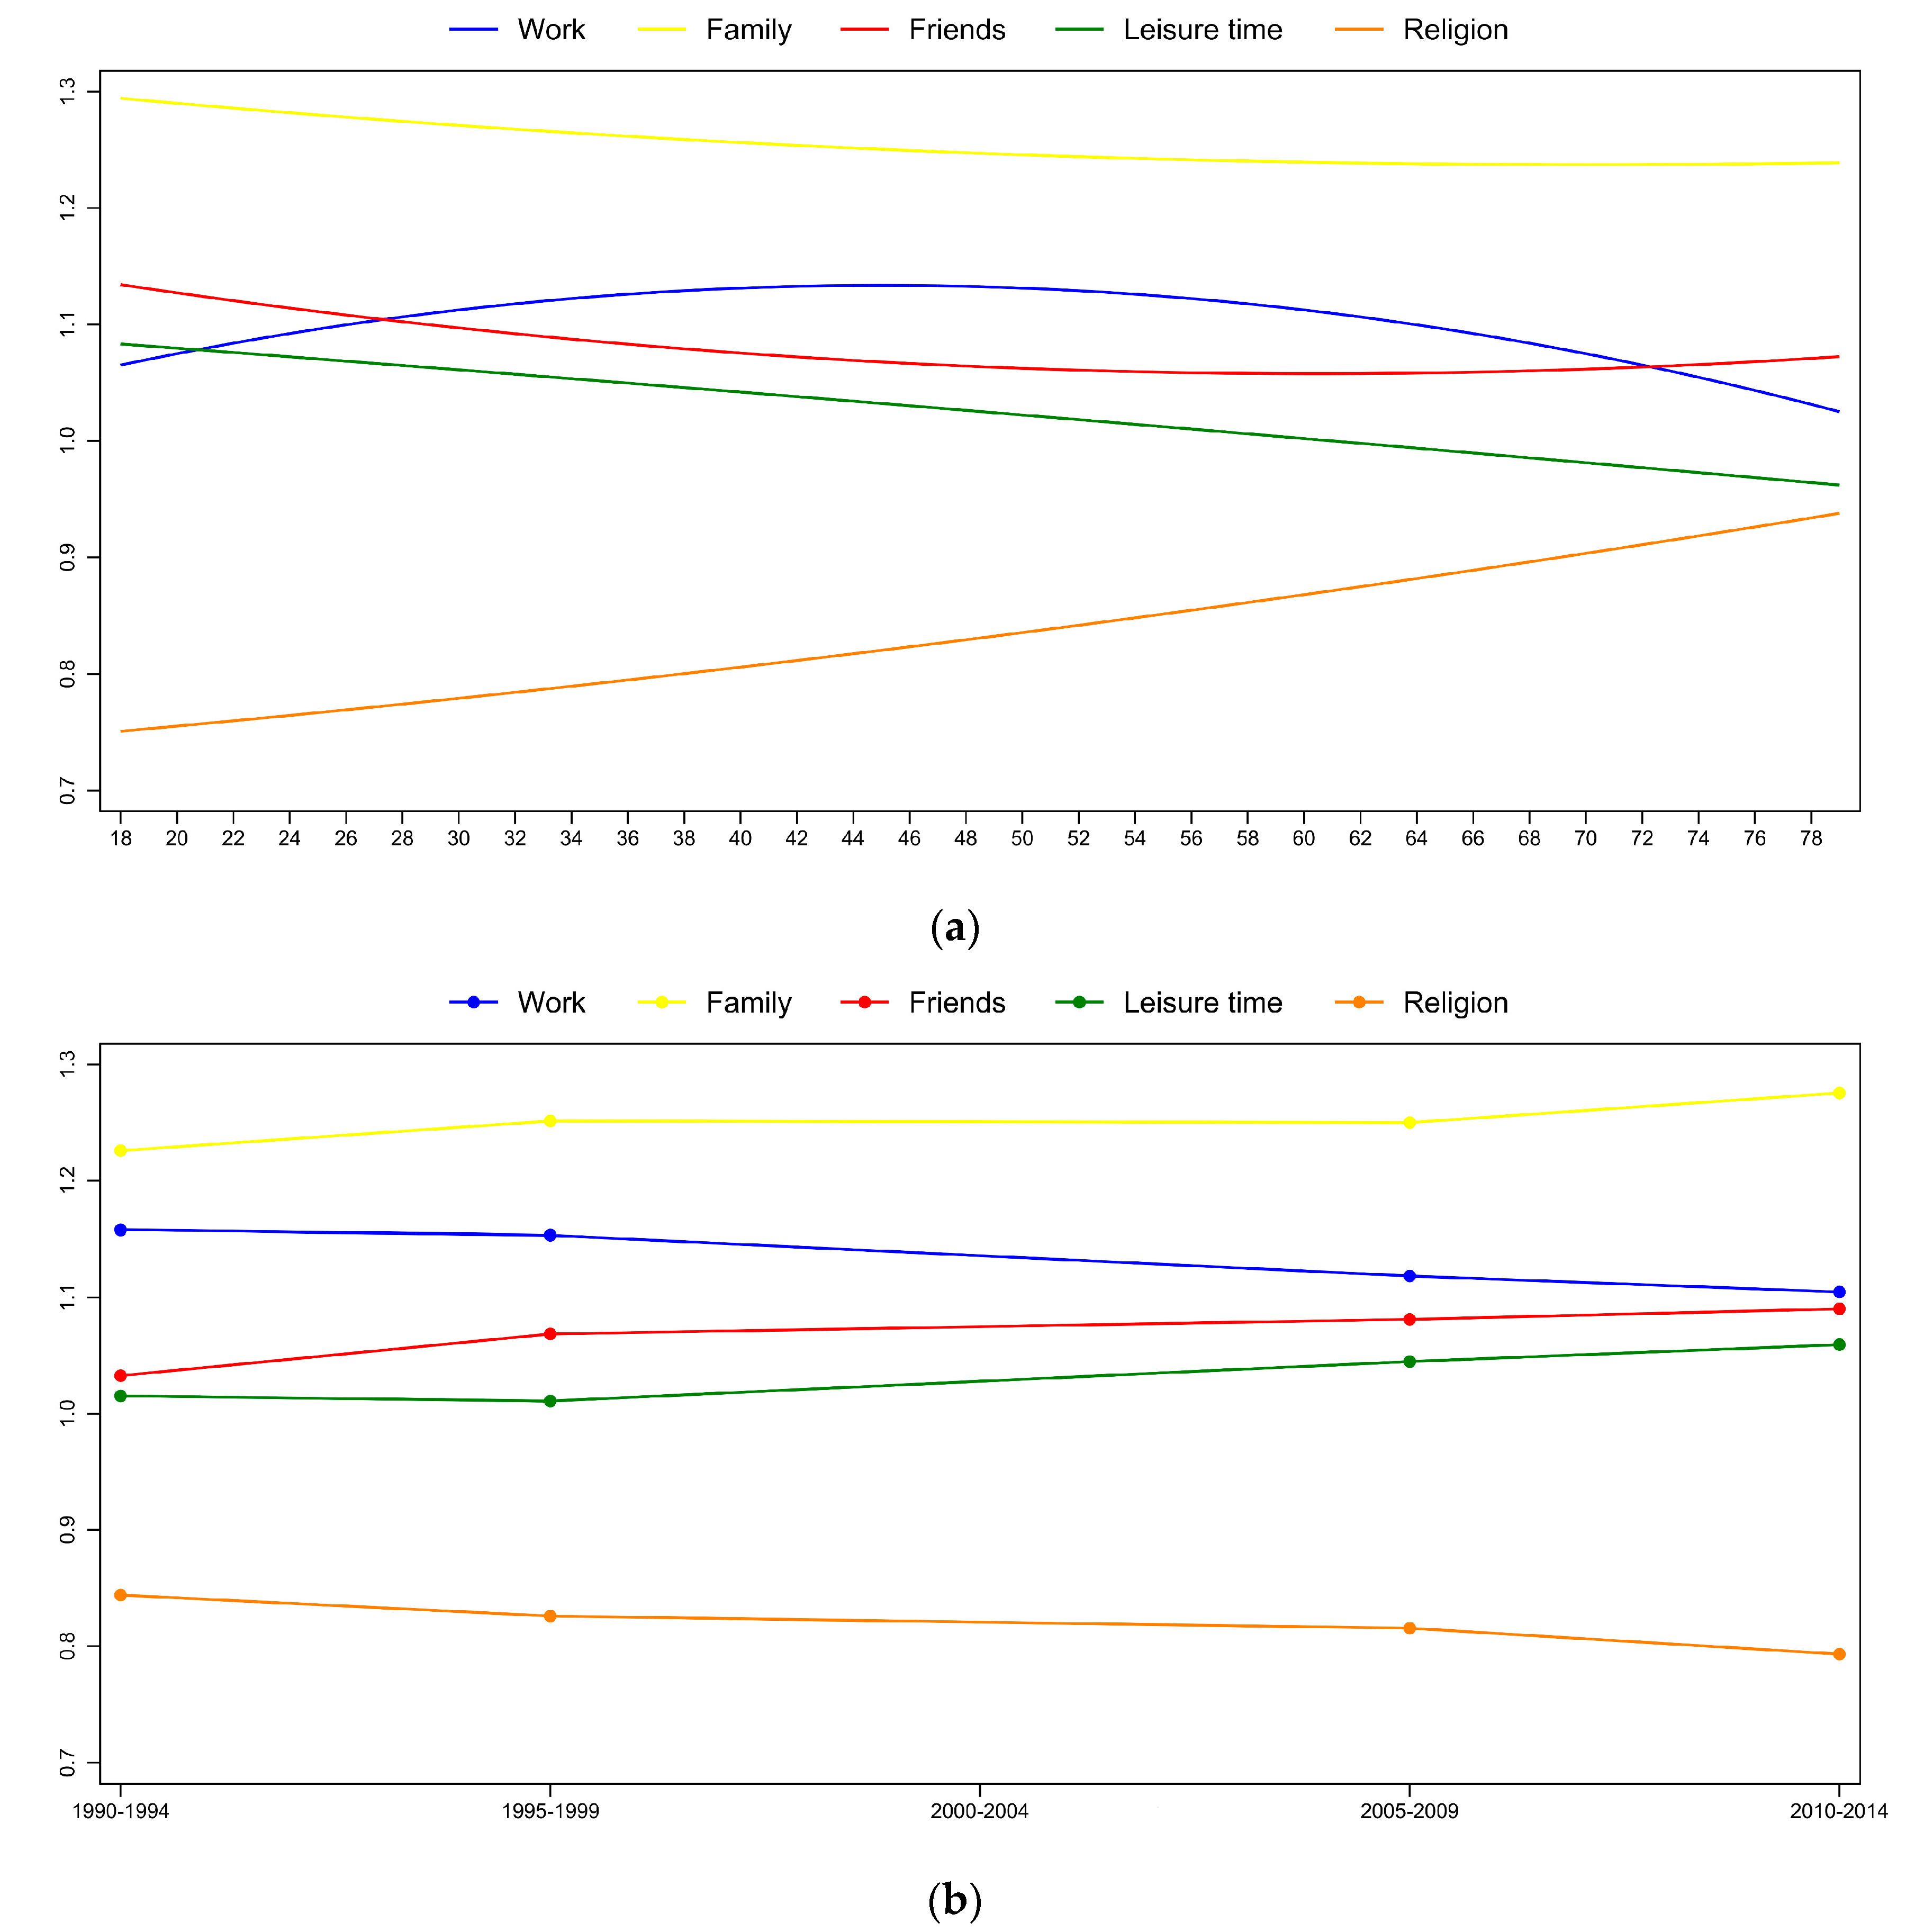
Table A7 and Table A8 in the Appendix A contain the results of the HAPC models without and with socio-demographic control variables, respectively. Since our main goal is to show how age, cohort, and period correlate with the importance of life aspects, Figure 2 visualizes the results of the HAPC models regarding the three time-related variables from models that control for the socio-demographic background of the individual and for time-invariant country effects.
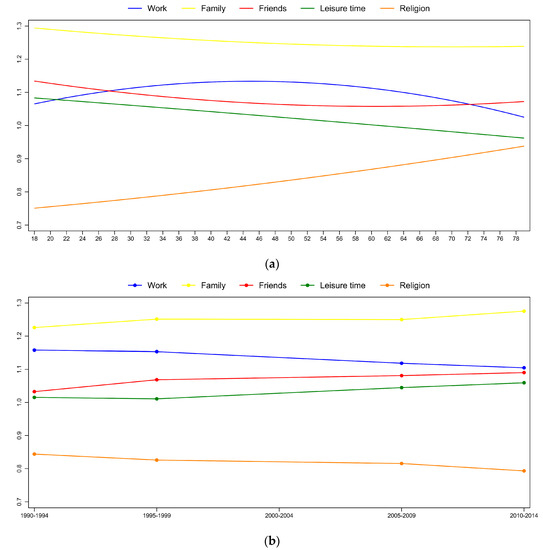
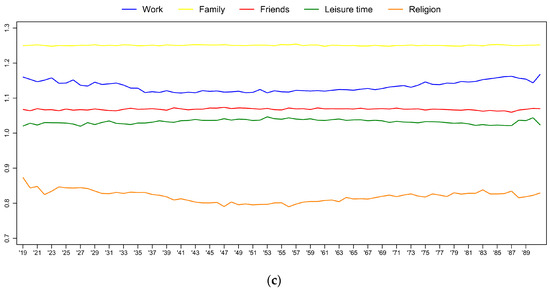
Figure 2.
(a) Age, (b) period, and (c) birth-cohort effects on relative importance of work and other life aspects (hierarchical age-period-cohort regression models). The y-axis shows the predicted value of the dependent variable (for an average respondent).
Comparing the five models, family is the most important in the respondents’ life, work is the second most important life aspect followed by friends and leisure time, and religion is the least important one. This pattern is similar in every period.
First, we focus on the relative importance of work. We can get information about the relevance of age effects by comparing the residual variance of the empty model with a model including only age variables14. Inclusion of age reduces the residual variance by 4.4%, which means that about 4% of the variation of this variable is due to age differences.
Figure 2a displays the age effect from the HAPC model. Basically, it replicates the main pattern regarding importance of work that we have seen in Figure 1 above. The relative centrality of work increases from age 18, reaching a peak around age 45, and decreases thereafter. This result is in accordance with a life-course concept of economic activity: since younger people are not yet and older people are no longer involved in income generating activities, it makes sense that their attitude toward the importance of work should be lower compared to those, for whom work plays a central role in forming their identity, (i.e., career-oriented, human-capital-investing, etc., individuals in [early] middle age), and for people in their active household and labor-market cycles (i.e., individuals entering the labor market, becoming adults, establishing a family, having children, etc.).
Focusing on the role of the other two time variables, we find that although they have a statistically significant impact on the relative importance of work, this is small compared to the impact of age and the country differences. The results of Figure 2b show that controlling for age, cohort, and country differences, the relative importance of work is decreasing constantly. However, period accounts for only 1.04% of the variance (see Table A7), that is, the effect size is rather small.
Finally, work is slightly less important for birth cohorts born in the middle of the twentieth century compared to the cohorts born earlier and later (Figure 2c). This result may be interpreted as a weak cohort effect: for those who entered the labor market around 1968, the centrality of work has temporarily decreased, but the effect size is very small (cohort accounts for only 0.45% of the variance in the centrality of work).
Socio-demographic control variables act according to what we would expect (Table A8). For example, work is less important for those who are retired, for part-time workers, and for others not in the labor market, whereas it is more important for those married or living with a partner, and for men.
Regarding the importance of other life aspects, it seems that the centrality of friends changes together (but in the opposite direction) with the centrality of work throughout one’s life course (Figure 2a). Friends are very important during the younger ages, they are the least important around age 50, and become more important again after retirement. Family is equally important in every age group, there are only small differences between the young and the old. Leisure time becomes less important with age. This finding is compatible with the change in the importance of work. If we assume that leisure time is defined as the lack of work, it is reasonable that without work as the “point of reference” the importance of leisure time also loses its significance. Simultaneously, when compared with leisure time, religion shows an opposite and stronger trend—i.e., it becomes more and more important with age. We can hypothesise that faith serves as a replacement for leisure, i.e., it fills in the “identity void” left by the decreasing importance of both work and leisure.
While the centrality of friends and leisure time, and the importance of family increases between the early 1990s and mid-2010s, the centrality of work and religion (especially in the past decade) decreases (Figure 2b).
Cohort differences in the importance of family, friends, and leisure time are even smaller than those of work. Only regarding the importance of religion can we detect very small differences. Religion is less important for respondents born in the late 1940s and in the first half of the 1950s, and it is more important for those born later or earlier (Figure 2c), but again cohort accounts for only 0.33% of the variance in the importance of religion.
4.3. Robustness
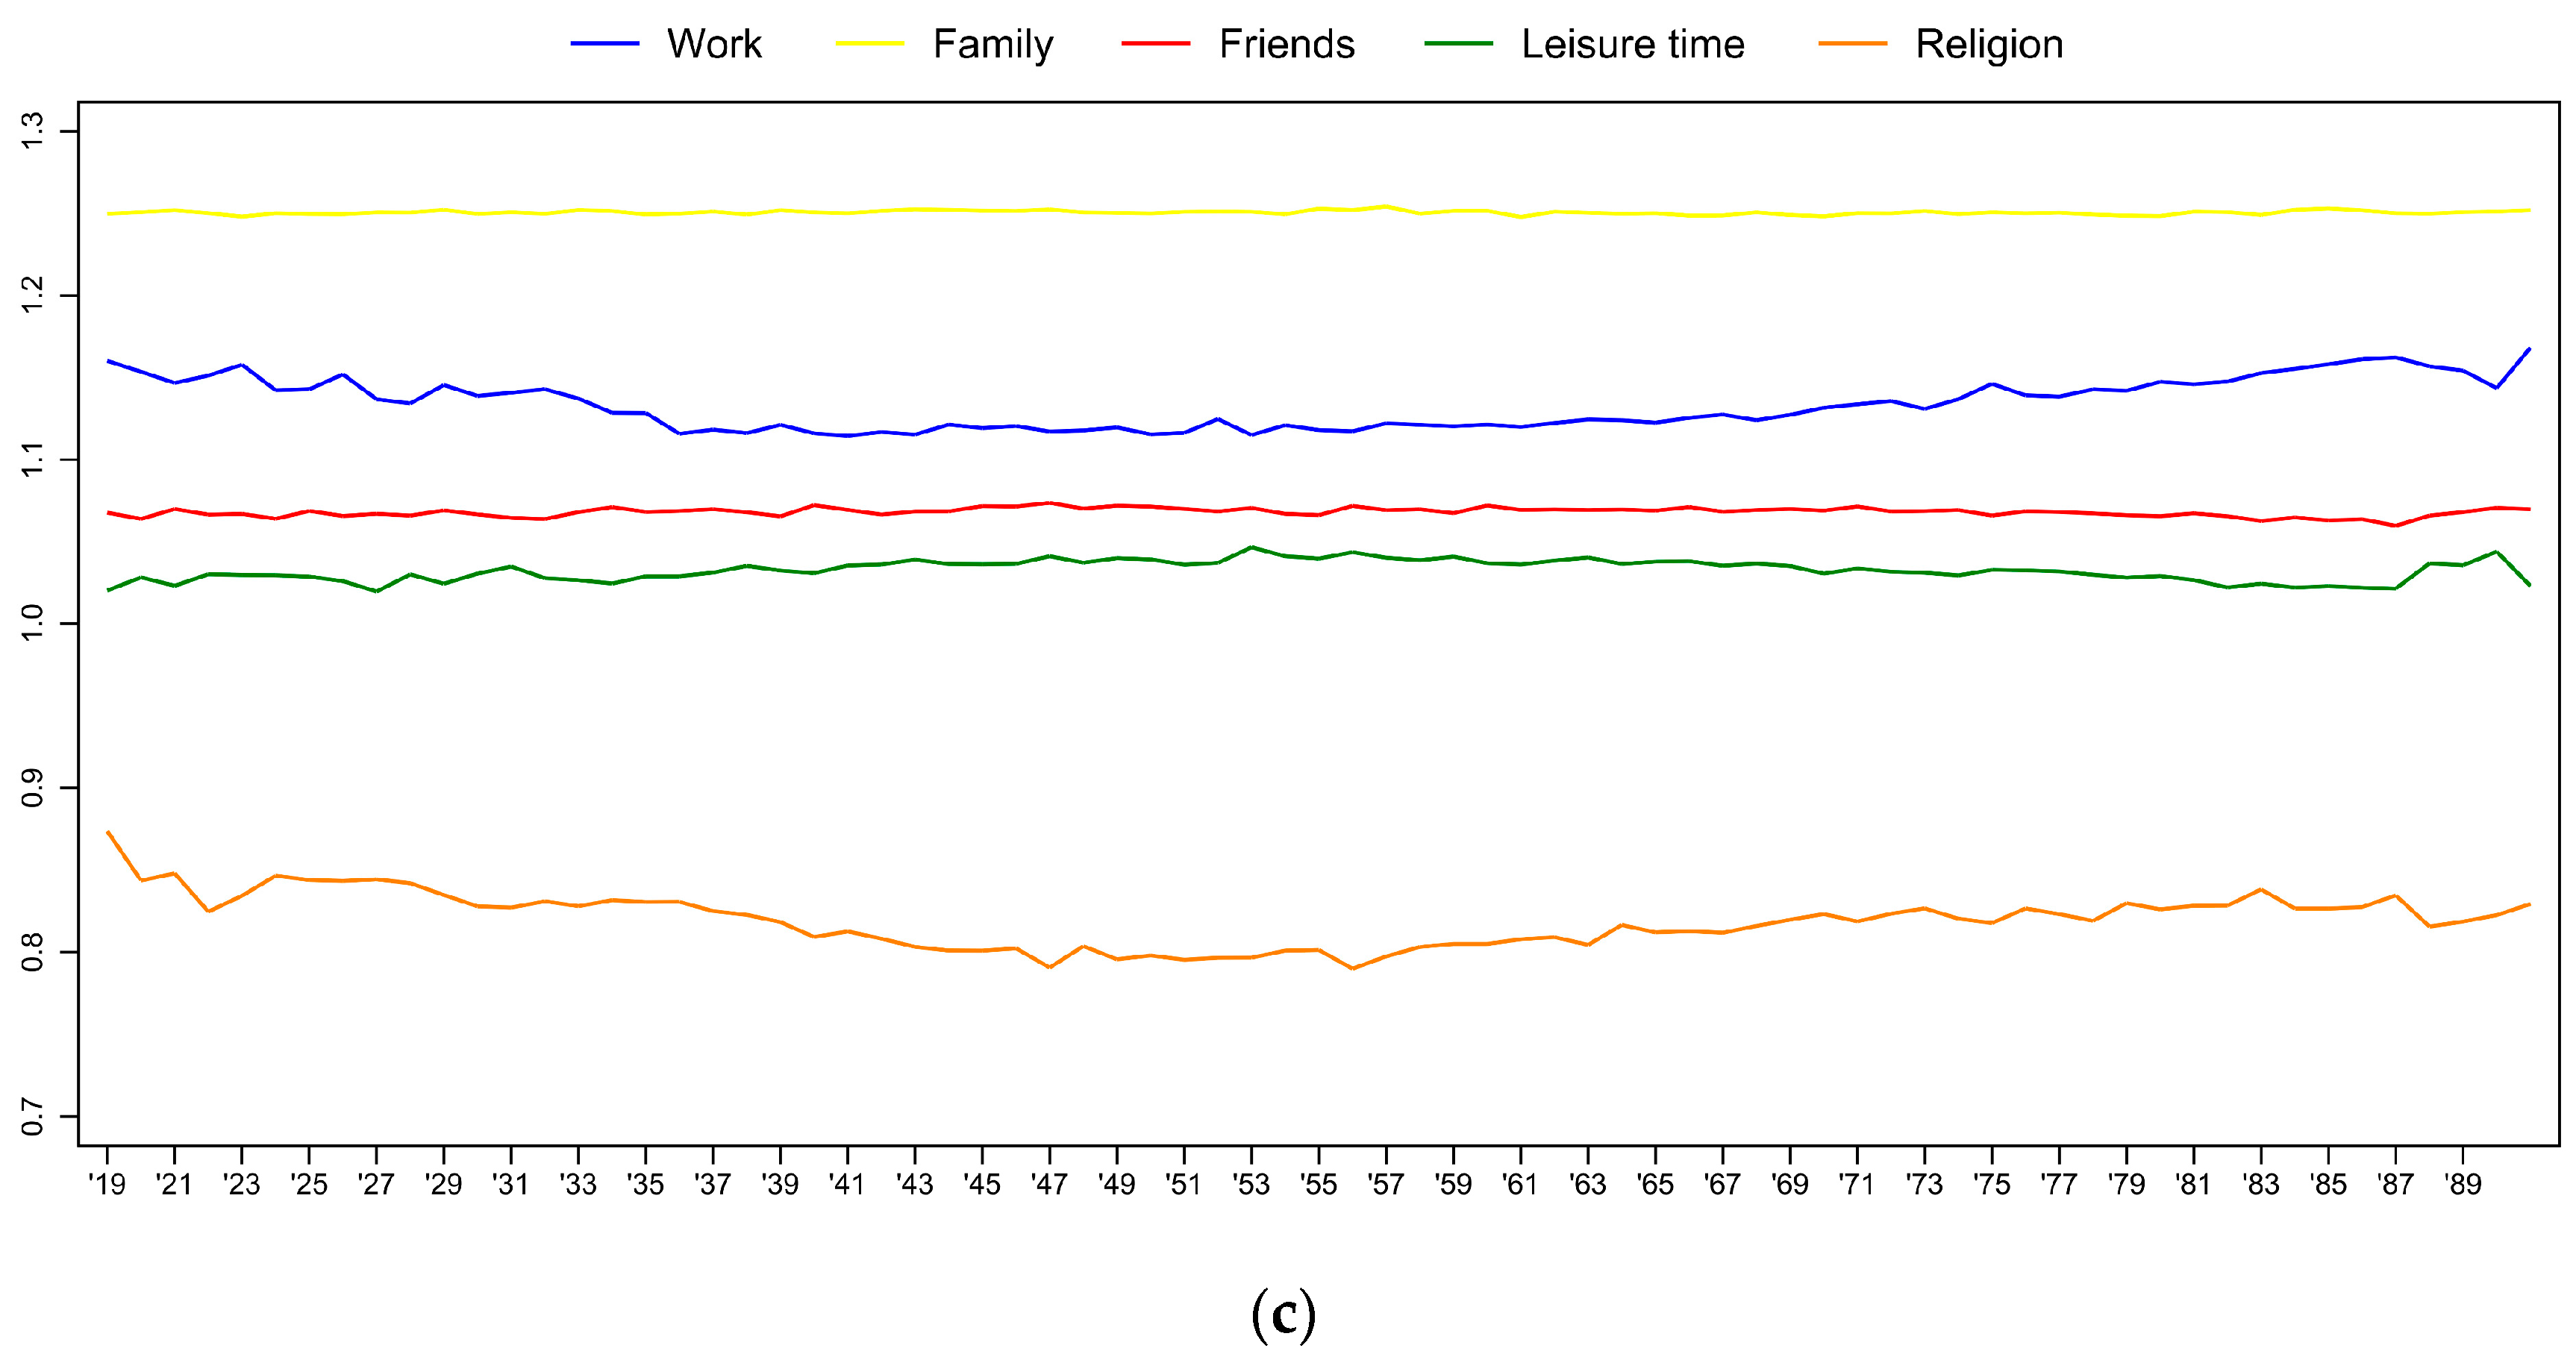
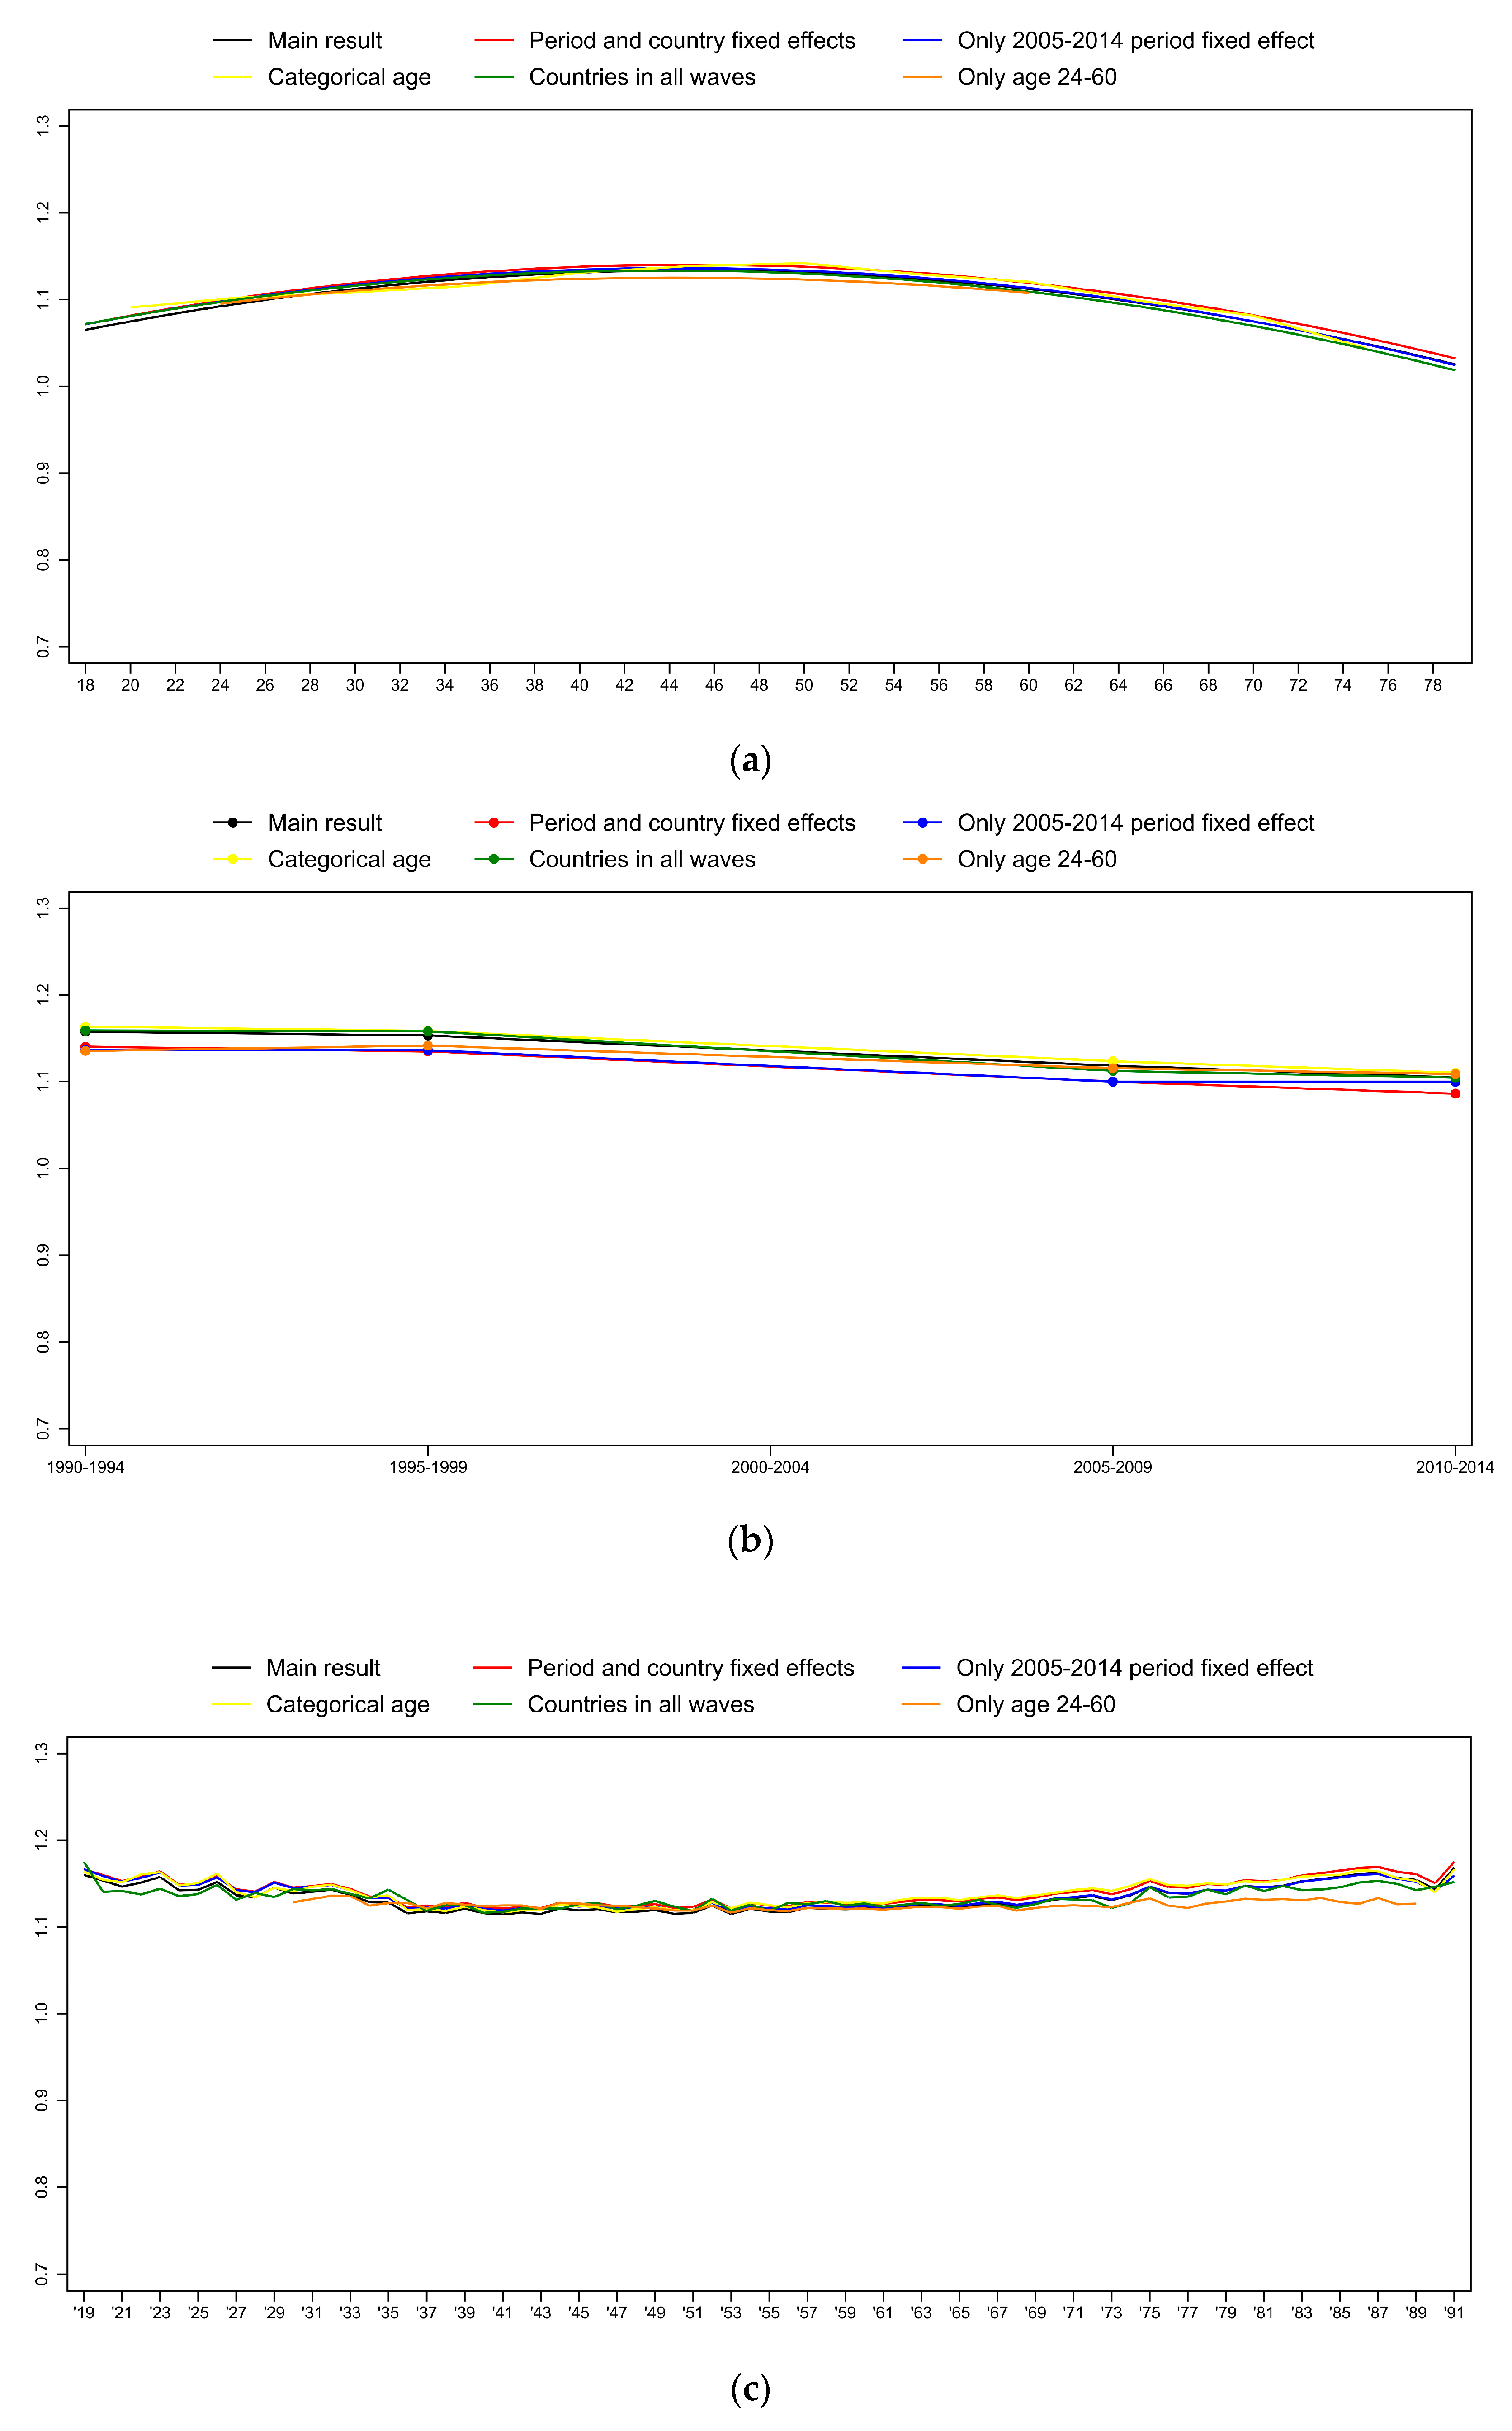
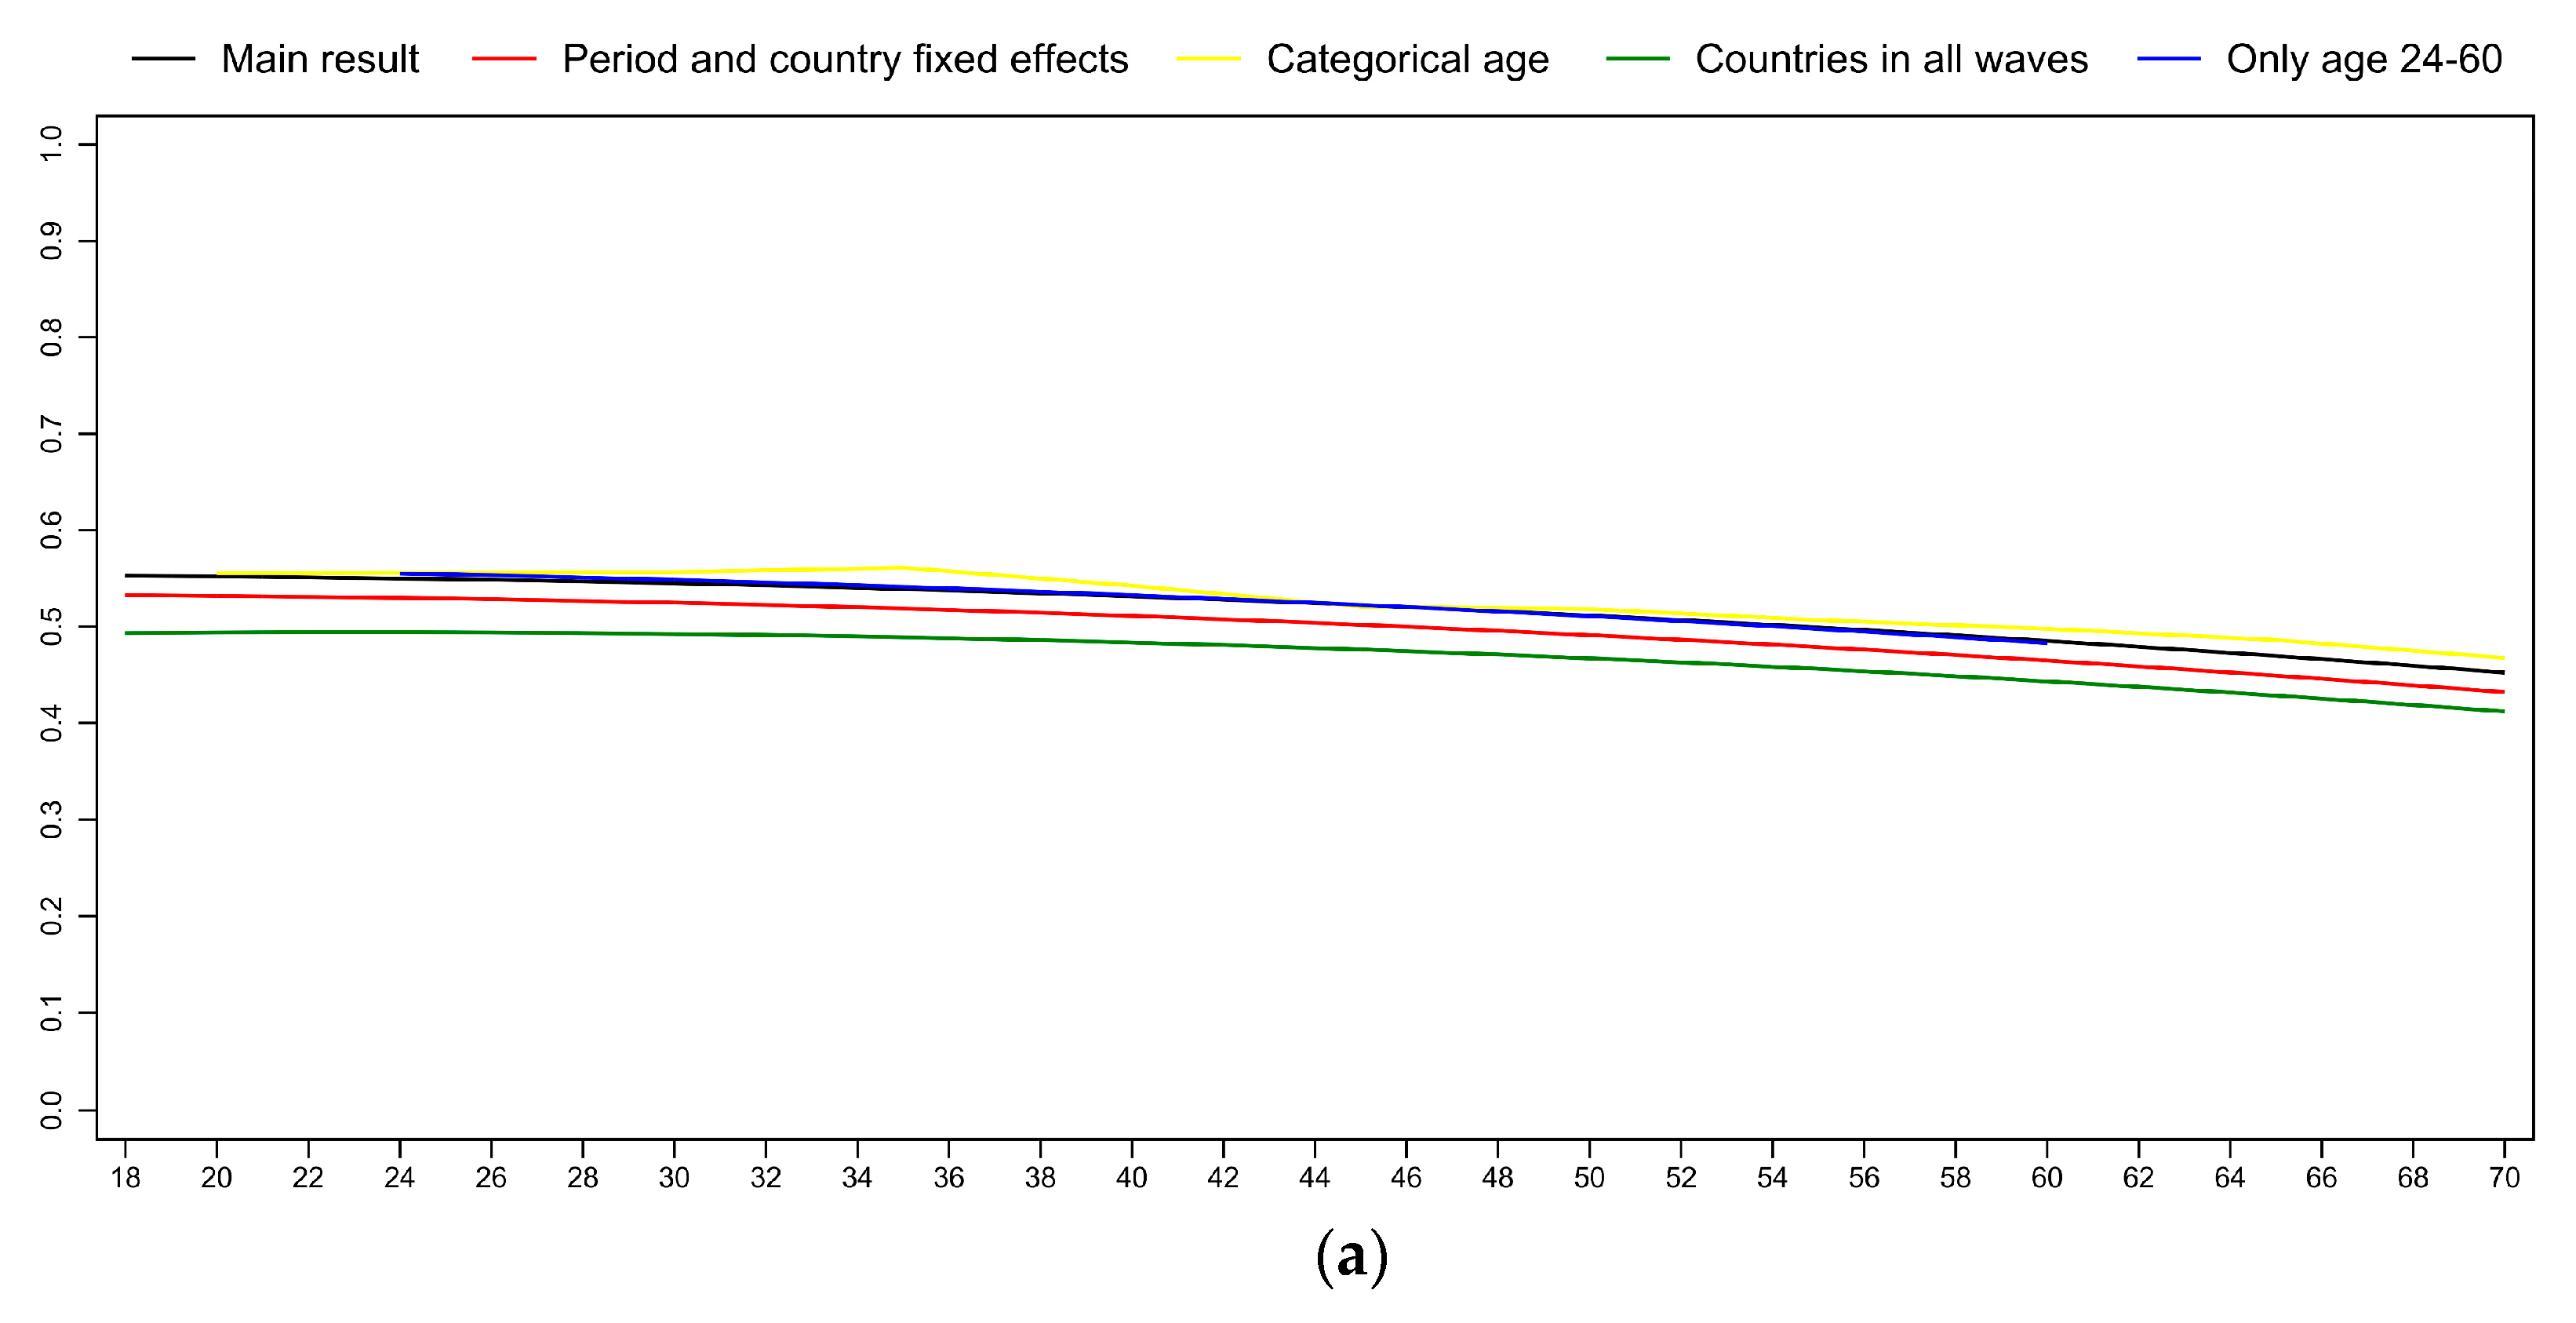
To test the robustness of the results regarding the relative importance of work, in Figure 3 we visualize the results of (a) various specifications of the HAPC model, and (b) of HAPC models on some selected sub-samples.
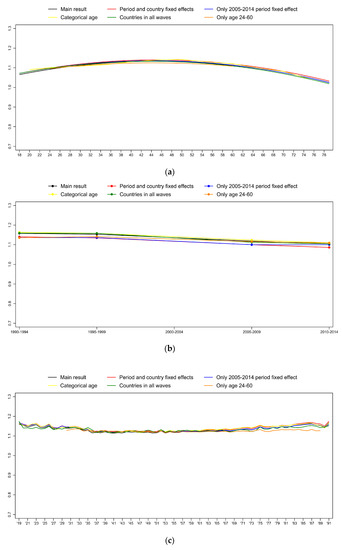
Figure 3.
Robustness of the results: (a) Age, (b) period, and (c) birth-cohort effects on relative importance of work (hierarchical age-period-cohort regression models). The y-axis shows the predicted value of the dependent variable (for an average respondent).
First, we specify the effect of time period and country as fixed instead of random (red line, Figure 3). Next, we allow only a “global financial crisis effect” instead of the random period effect of the main model. That is, we create a dummy variable for the two periods that cover the global financial crisis of 2007–2008 and we include it in the fixed part of the model (blue line, Figure 3). We also use a categorical age variable instead of the quadratic specification by including age group dummies with 5-year brackets. With this model we allow the relationship between age and work centrality to be non-linear, and further reduce collinearity between age and cohort (yellow line, Figure 3). The overall conclusion of this exercise is that the original results are not altered by any of the alternative specifications of the HAPC model.
Secondly, we relax the possible concern that stems from the fact that the WVS/EVS is not based on the same set of countries across all waves. These differences in the composition of the countries across the waves might bias the results of the HAPC models. In the robustness test, we restrict the sample to the eleven countries that participated in all four waves of the WVS/EVS. The green lines in Figure 3 show that the results are identical to those of the original model. Lastly, restricting our sample to respondents in their active ages (age 24–60) did not cause any deviation from the original model either (orange line, Figure 3).
5. Work Values
5.1. Data
In the second analysis (based again on WVS/EVS data), we use another set of work values as dependent variables, i.e., which aspects do respondents consider to be important in a job? The exact wording of the question was the following: “Here are some more aspects of a job that people say are important. Please look at them and tell me which ones you personally think are important in a job.” The respondent was offered fourteen items from which we select the following items as work values motivating an employee: good pay, good job security, good hours, an interesting job, and a job useful to society. The coding of the variables is the following: 1 = selected, 0 = not selected.
We are aware that there is much debate about the number and the types of work value and motivation dimensions [45,46], but since our aim is limited to testing the effects of the three aspects of time on work values, we decided not to enter into this debate and only use the simplest solution available. We assume that of the three extrinsic work values “good income” can be considered typical, since in modern societies income is the ultimate “external” motivation for work. “Security” is also an extrinsic value since it expresses the respondent’s attachment to the labor market in general and to a concrete job in particular (i.e., the respondent wants to hold the job proper). “Good hours”, however, is not purely extrinsic since it indicates the need of at least a limited level of freedom for the employee—i.e., some control over working time—and implicitly expresses the importance of life beyond the labor market (family, leisure, etc.). As for the two intrinsic work values, having an “interesting job” can be considered as the classic form of individualistic motivation on a post-industrial labor market, a shift upward on the Maslowian scale. The same is the case for having a job which is “useful to society”. In this case, however, the intrinsic value is derived not from the hedonistic self-satisfaction of the individual but from a more general humanistic-holistic or altruistic motivation.
We selected these five items since they represent not only intrinsic and extrinsic values [47], but they can also be categorized as entrepreneurial values and bureaucratic values [45]; as instrumental, cognitive, social/altruistic values; as growth-focused and context-focused values; or as individual-level, job/organization-level, and societal-level values [46]. These five values are diverse enough with respect to different categorizations of work values, but the relatively low number of dependent variables makes the results simple and easily understandable.
Questions about work values were asked in the first to fifth waves of the WVS/EVS. However, since the number of countries between 2000 and 2004 is low, we exclude this period from the analysis15. Thus, we have data from four periods: 1980–1984, 1990–1994, 1995–1999, and 2005–2009. This sample covers most of the European countries and some countries from the Euro-Atlantic area, similar to Illustration I. We restrict the sample for respondents between age 18 and 70 since they are either active on the labor market or just recently retired, thus their perceptions about a job relate to their actual (or recent) activities. The number of observations and means of the five variables are shown in Table 216.

Table 2.
Number of observations and the average of work values by period.
5.2. Results
Table A11 in the Appendix A contains the results of the HAPC models for work values without socio-demographic control variables, and Table A12 contains the results of the models with control variables. Figure 3 visualizes the results of the HAPC models with control variables since, just as in Section 4, our main goal is to show the correlation between age, cohort, period and work values.
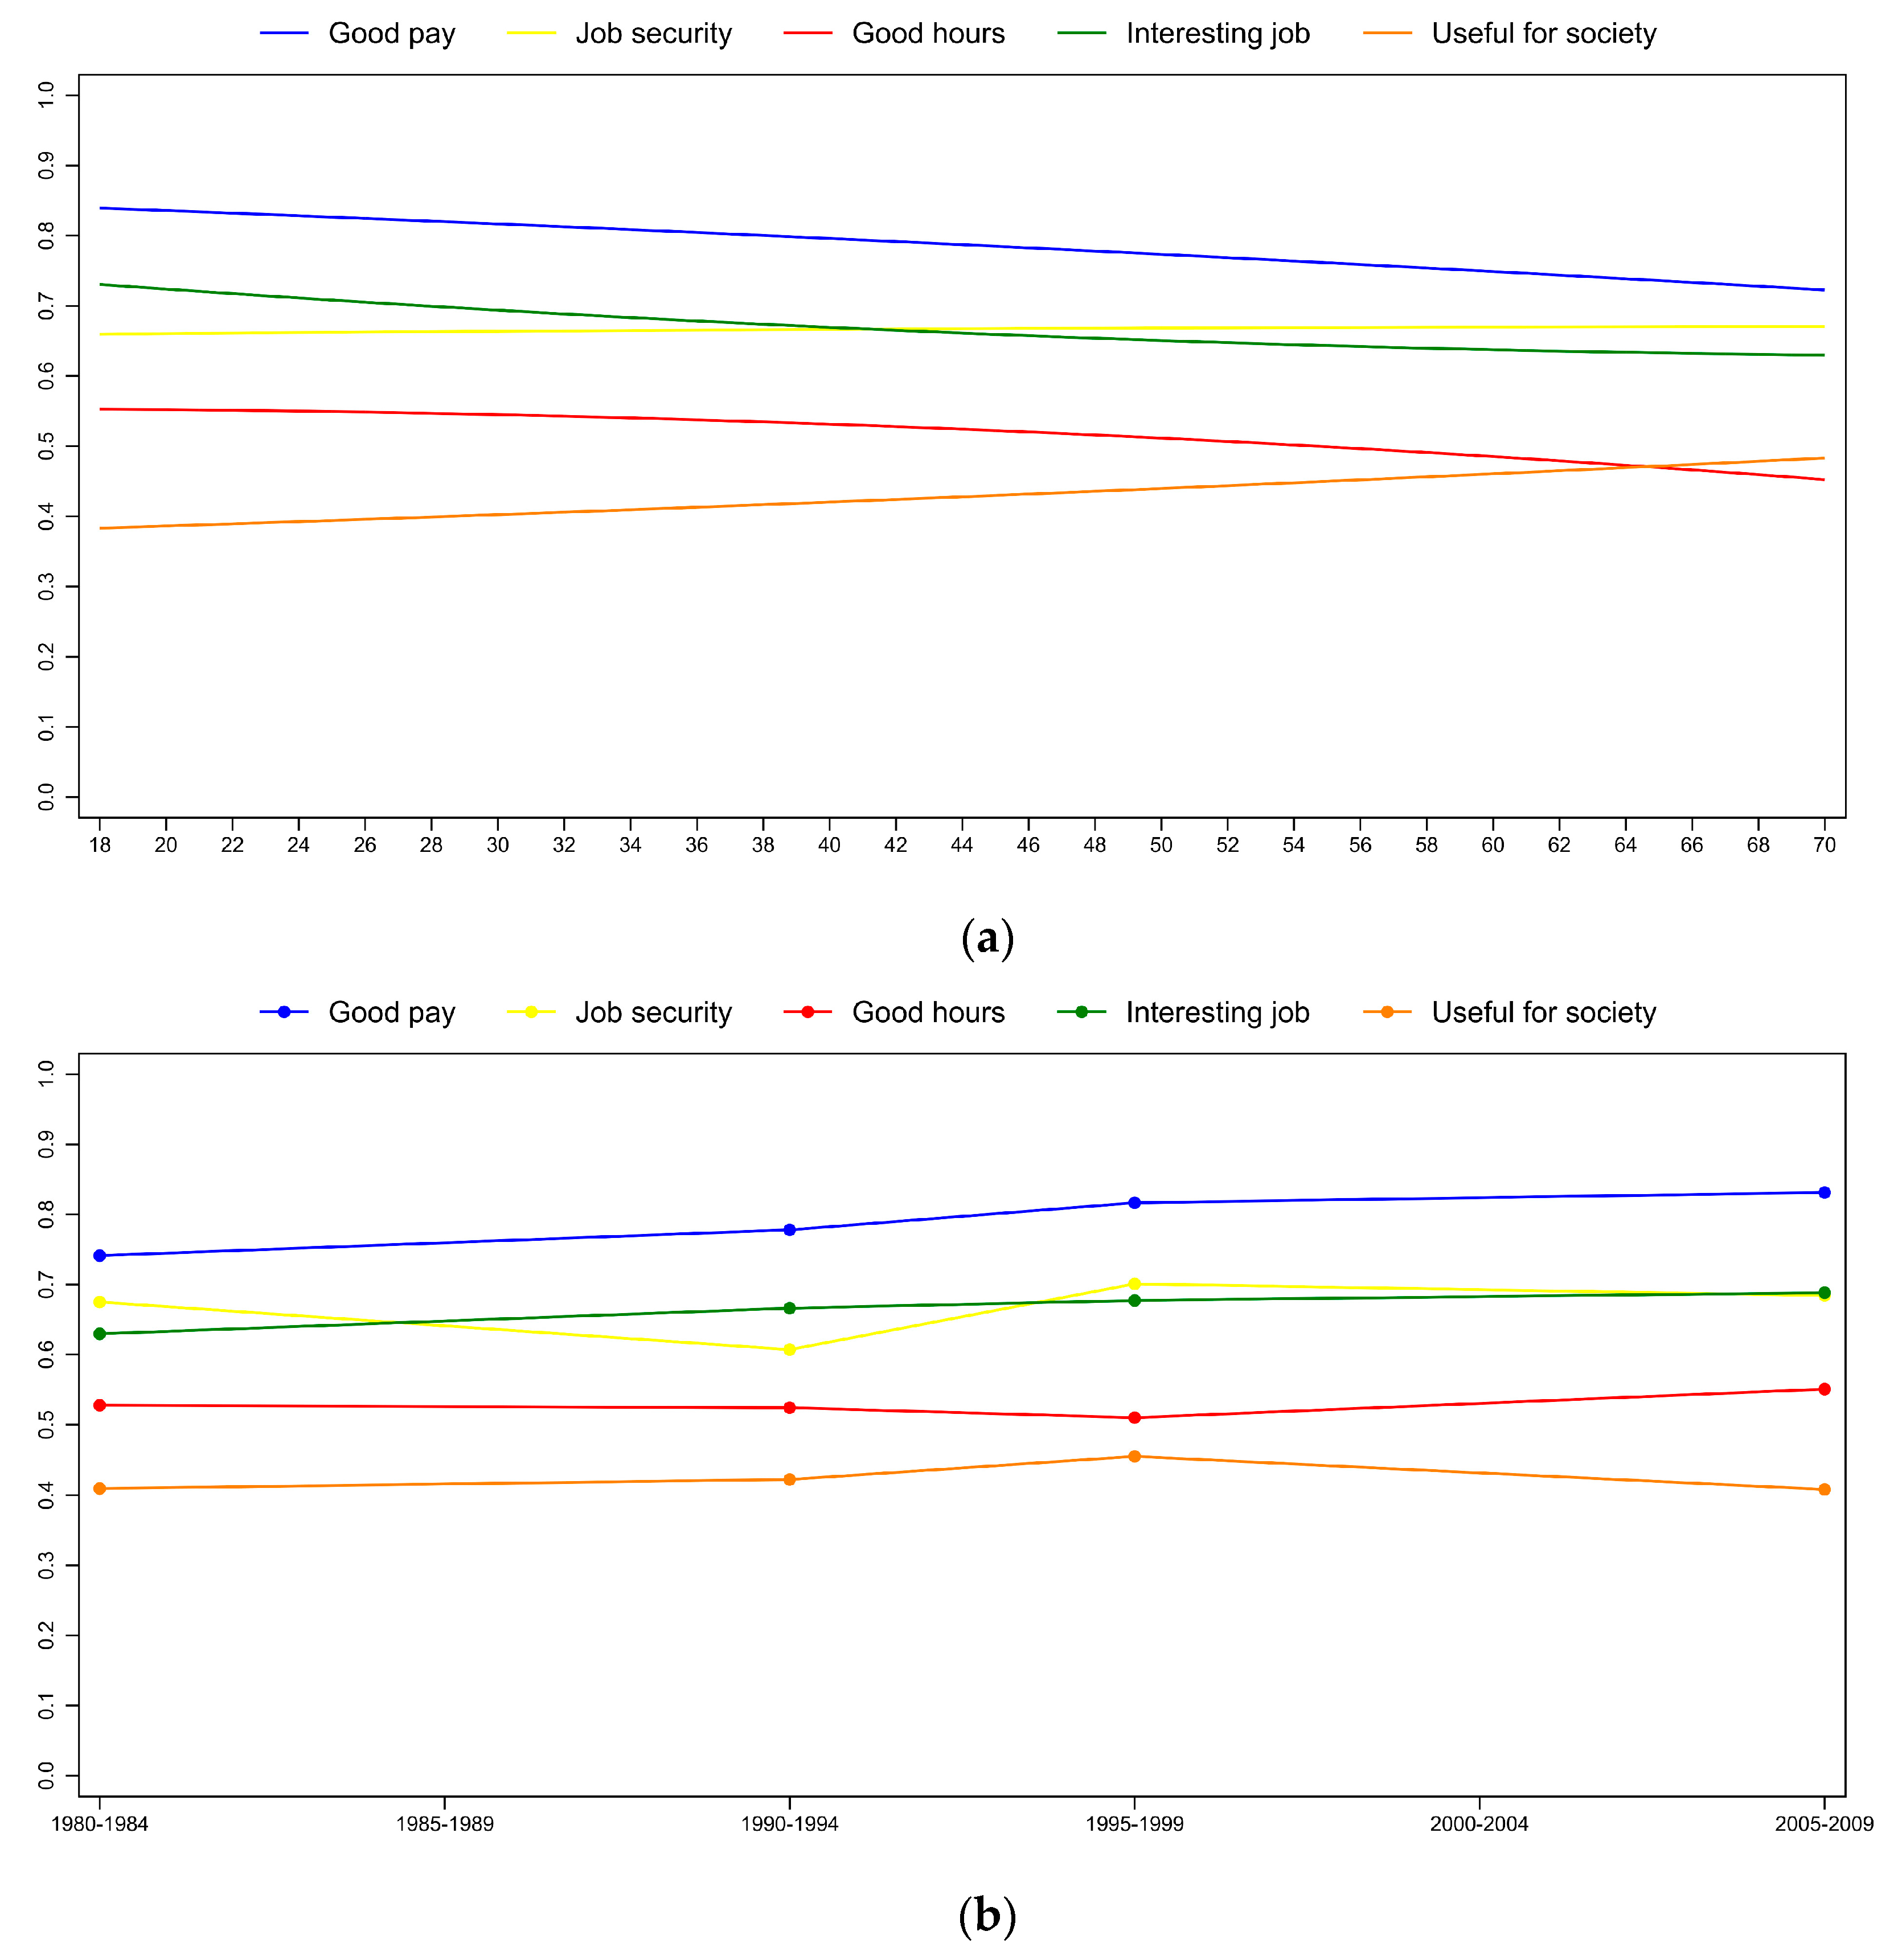
While the probability of having an interesting job, good pay and good hours being selected as important (after controlling for period and cohort) decreases with age (Figure 3a), the probability of usefulness being selected increases with age. The probability that job security is selected as important is similar for every age: although there is a slight increase with age (between 18 and 50), the trend is much weaker compared to the other four work values. These results suggest that work values, controlled for socio-economic variables, period and cohort effects, significantly change with age.
Previous research showed a decline in the importance of extrinsic values and a (non-significant) decline in the importance of intrinsic values for young adults in the United States [48]. Lechner et al. [49] found that work values are fairly stable in young adulthood. In a meta-analysis, Jin and Rounds [8] found stable intrinsic values and a decrease in the adolescence years in extrinsic values. Our results slightly differ from these results. The most important explanation might be that our sample covers the entire population rather than only young people, thus we are able to use information from the whole life span. For example, Loscocco and Kalleberg [50], using samples from the whole population, found a negative correlation between age and importance of good pay for American men and Japanese men and women. Second, age effects in our analysis are controlled for period, birth cohort and the most important life-transition variables (marital status, labor force status), whereas previous results were uncontrolled for some of these effects. The latter variables are especially important in the explanation of importance of extrinsic values [49]. It is possible that the decrease in the probability of having an interesting job, good pay and good hours being selected as important can be explained by a downgrading process that occurs when there is a discrepancy between work values and the reality [49]. Johnson [51] (p. 338) argues that young people are encouraged to hold high occupational expectations [52] that might “cool out” with the “increasing knowledge of the potential job rewards available and what can realistically be attained”. The positive association between age and the importance of usefulness is consistent with a more general psychological result that generativity striving (e.g., being concerned with creating something or being purposive interaction with the younger generation) is related positively to age [53].
The middle block shows that the probability of having an interesting job, good pay, and flexible hours being selected as important increases constantly between 1980–1984 and 2005–2009. The probability of having a job that is useful for society being selected as important is the highest in the 1990s and the lowest in 2005–2009. Regarding job security, we can see a significant increase between 1990–1994 and 1995–1999, and the probability of job security being selected is the highest in 1995–1999 and decreases slightly thereafter17. The third block indicates the complete lack of birth cohort effect on five types of work values.
The sign and size of coefficients of the control variables correspond to our expectations (Table A12). For example, for the educated having an interesting and a useful job is more important, whereas good pay, job security, and good hours are less important than for respondents with a low level of education. Compared to those working full-time, self-employed respondents consider job security and good working hours less important. For those married or living with a partner and for those divorced, separated, or widowed, good pay, job security, and good working hours are more important than for singles. Female respondents think that good pay is less important, whereas good hours are more important, which might reflect the distribution of household tasks and breadwinning roles within the family. These findings are in line with previous papers that found that education is related to higher importance of intrinsic and altruistic values [49,51,54], intrinsic and altruistic work values are more important, whereas extrinsic values are less important for women than for men [49,51,55,56], and being married is associated with higher extrinsic values [49,50] (Figure 4).
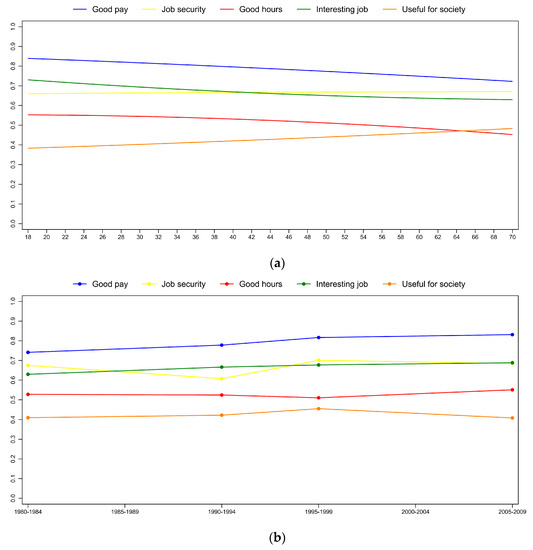
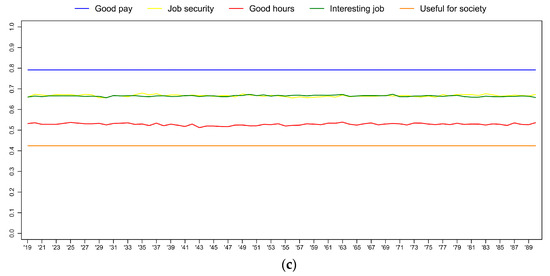
Figure 4.
(a) Age, (b) period, and (c) birth-cohort effects on importance of work values (hierarchical age-period-cohort regression model). The y-axis shows the predicted value of the dependent variable (for an average respondent).
5.3. Robustness
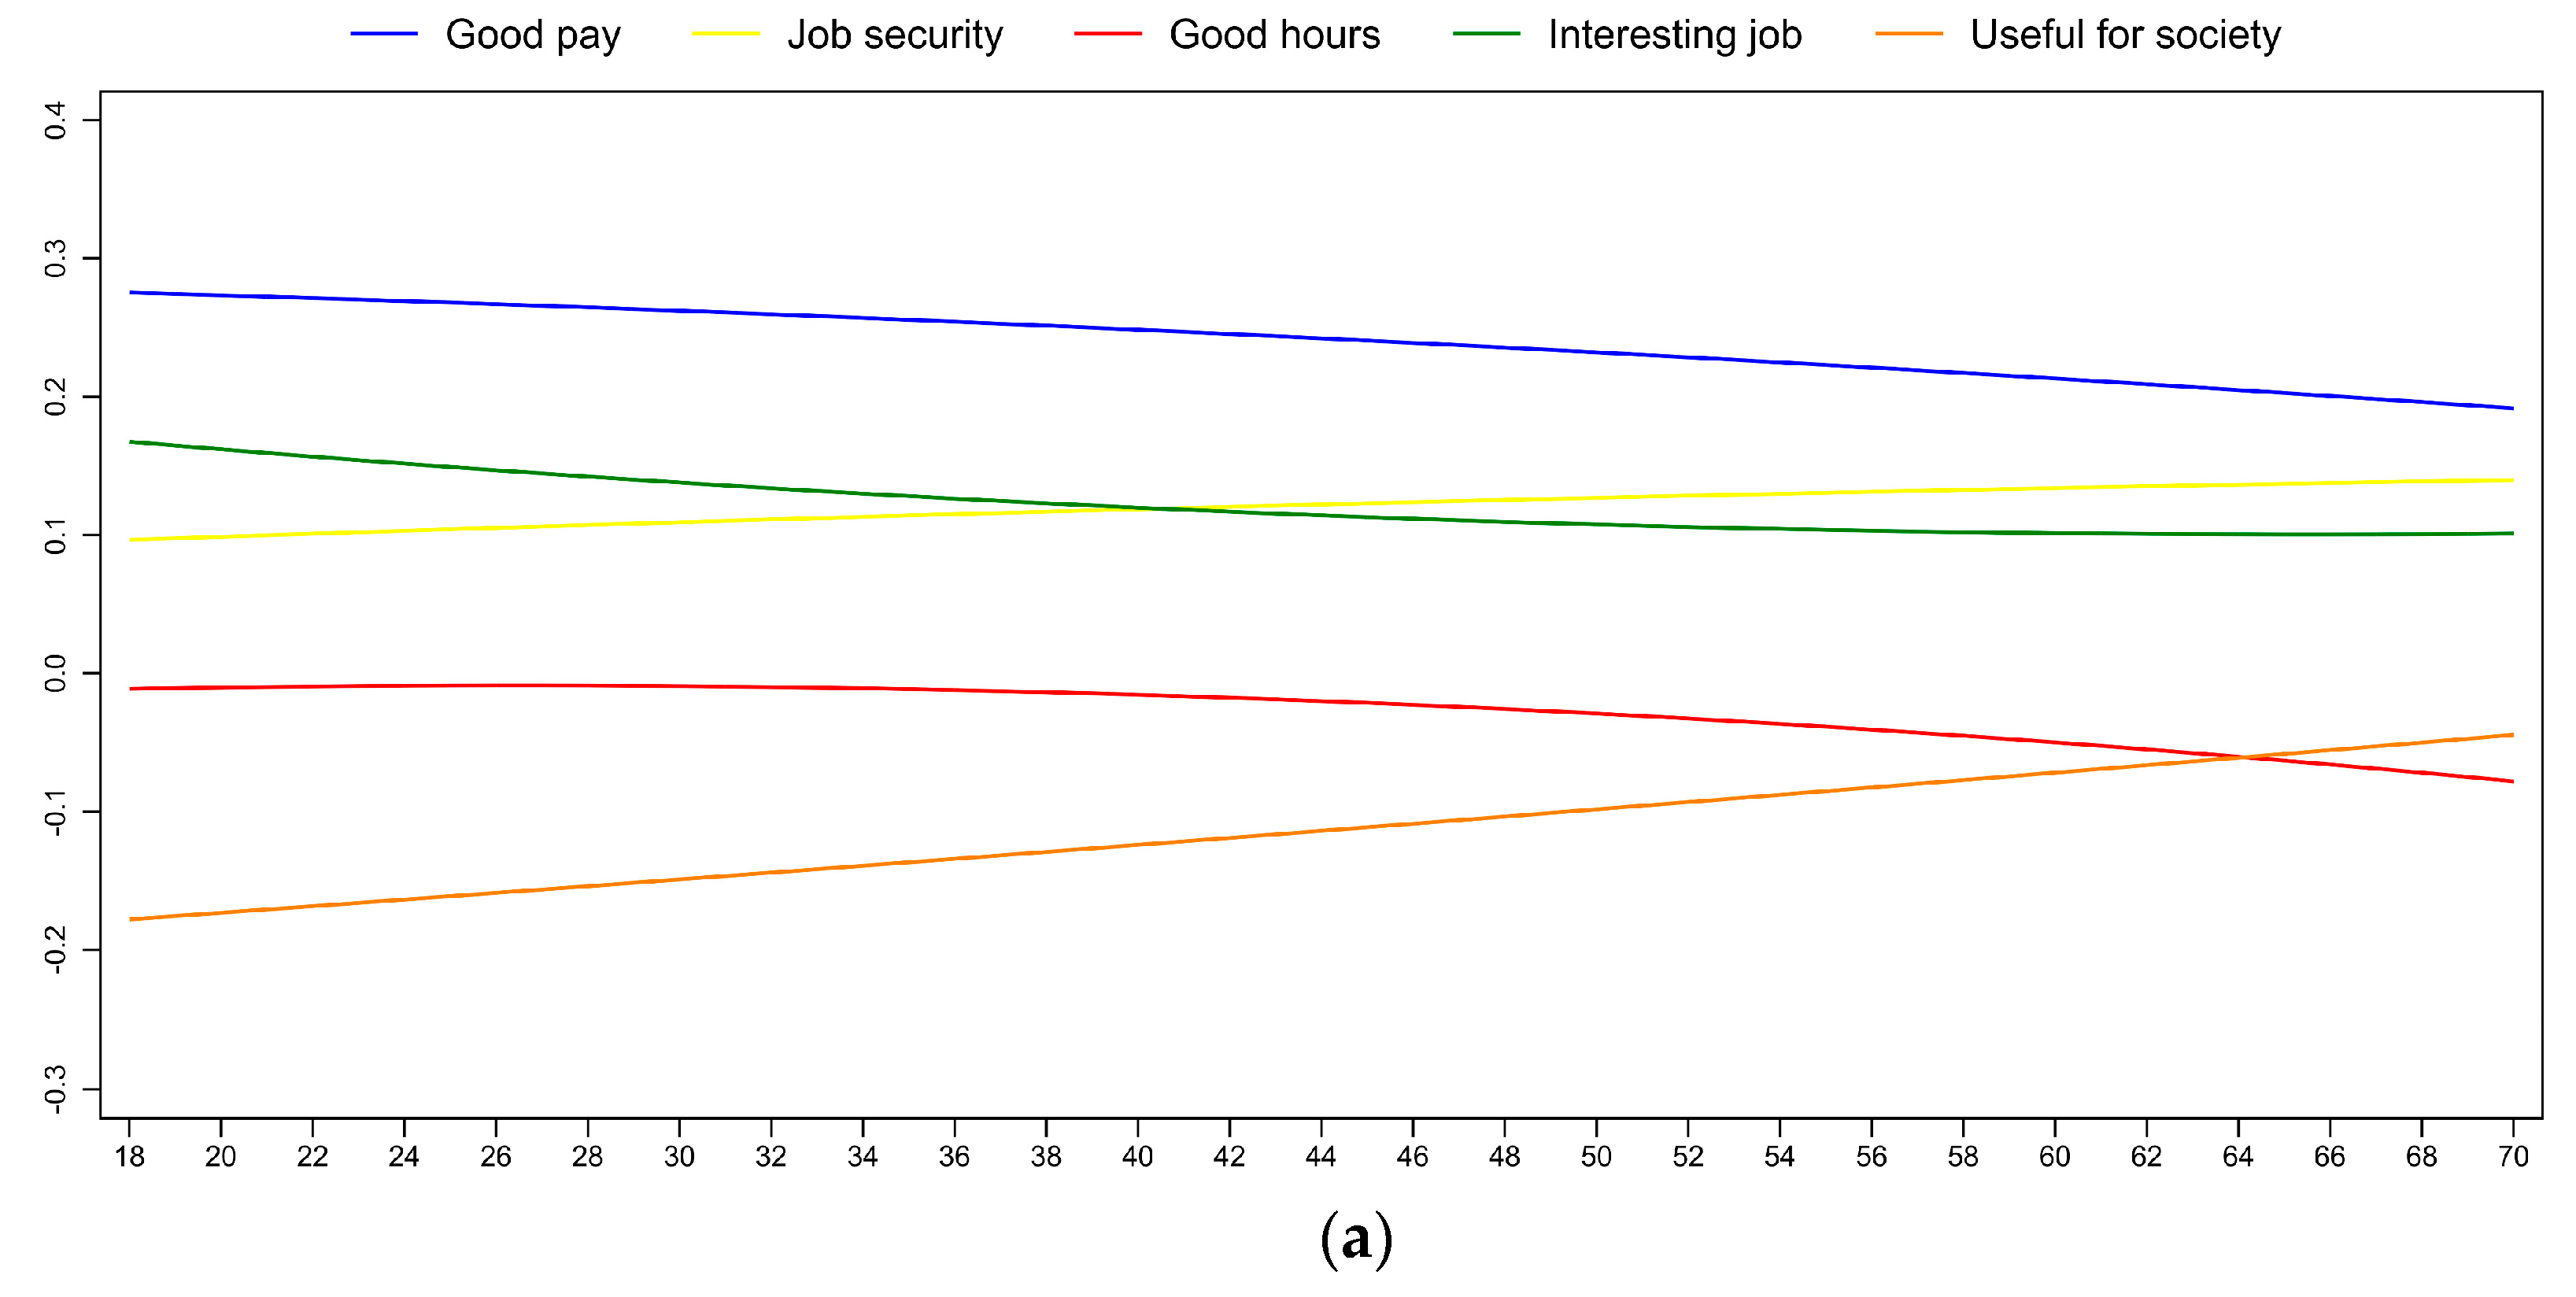
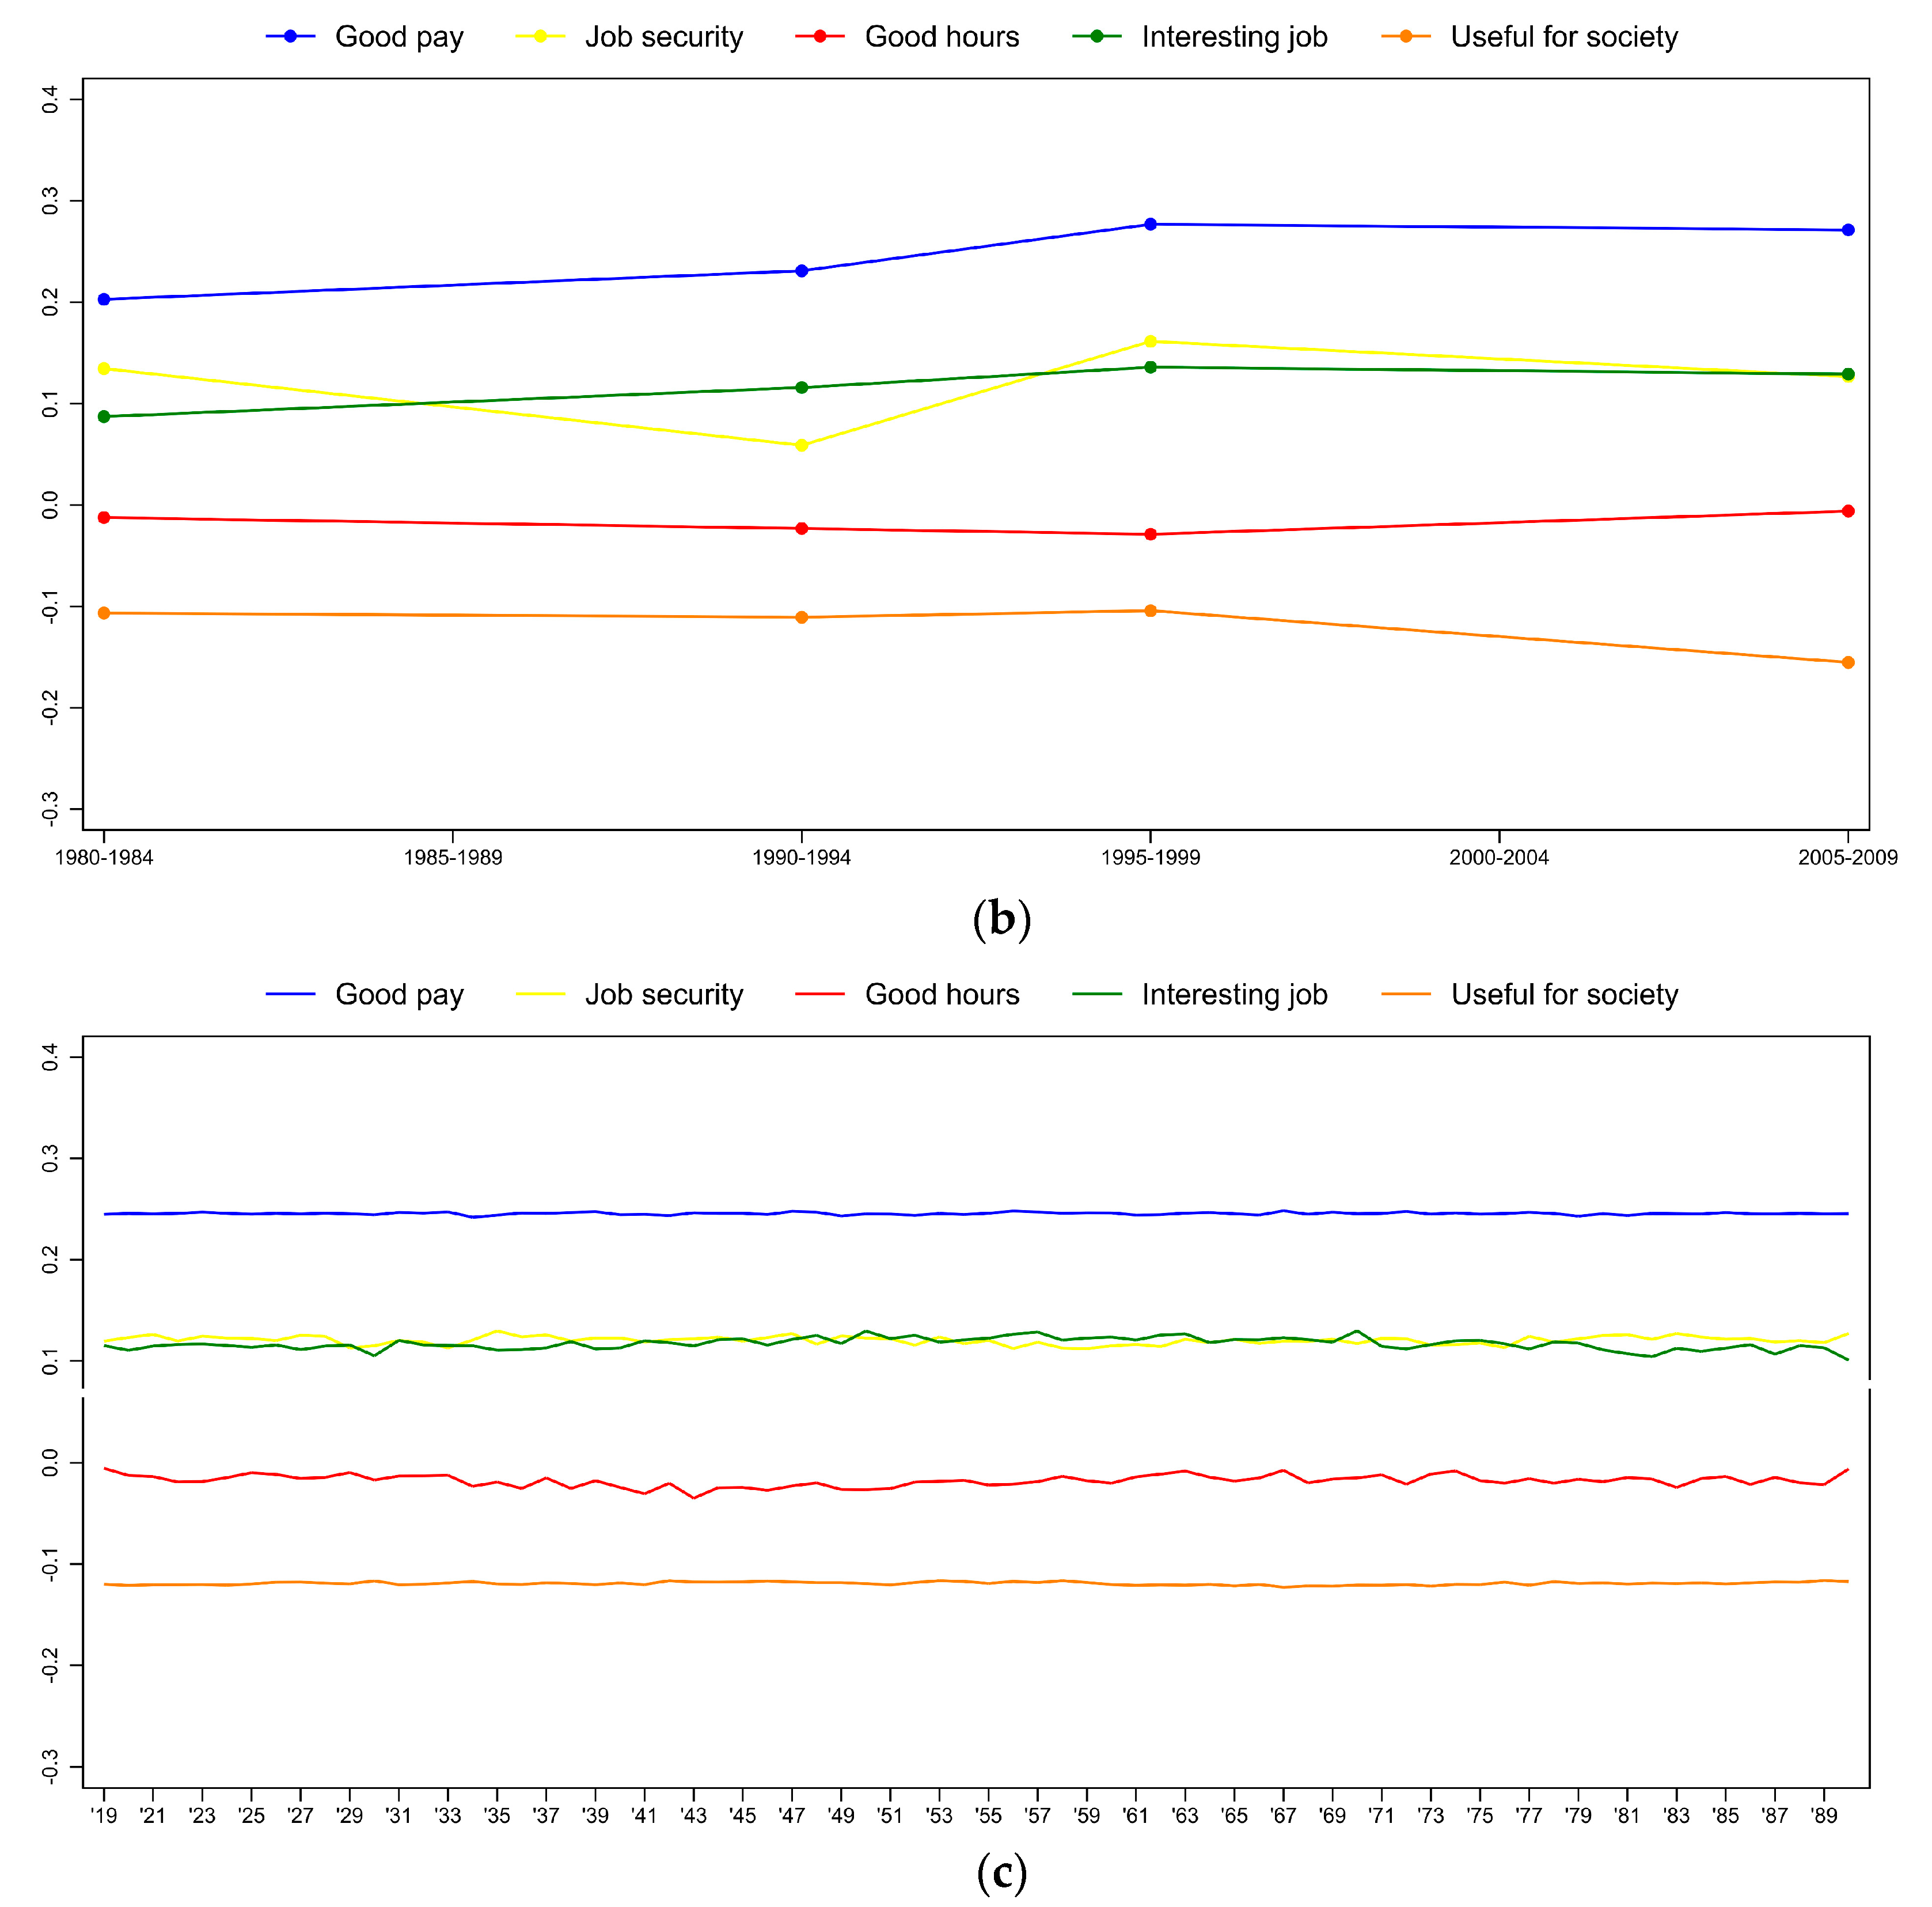
To test the robustness of the results, first, we use the relative importance of job-related work values as the dependent variable instead of the original variables. We calculate the relative importance of the work value by subtracting the mean importance of all work values in the WVS/EVS questionnaires (fourteen variables) from the importance of the work value. The value of the new variables is between −1 and 1. The relative importance of the work value is close to −1 if the respondent did not select the work value as important but selected most of the other work values as important, and it is close to 1 if the respondent selected the work value as important but did not select most of the other work values as important. In this way, we also control for scale use or response style differences among the respondents. The results are shown in Figure 5 and are very similar to our main results in Figure 4.
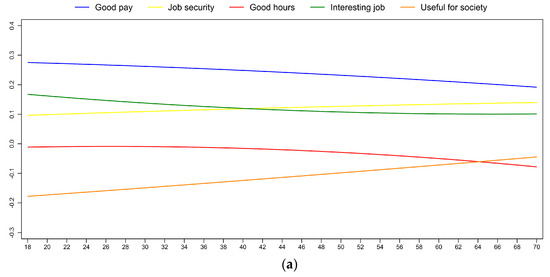
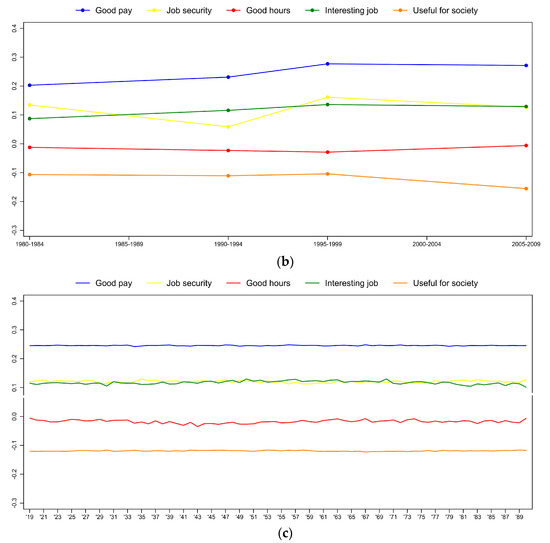
Figure 5.
(a) Age, (b) period, and (c) birth-cohort effects on relative importance of work values (hierarchical age-period-cohort regression model). The y-axis shows the predicted value of the dependent variable (for an average respondent).
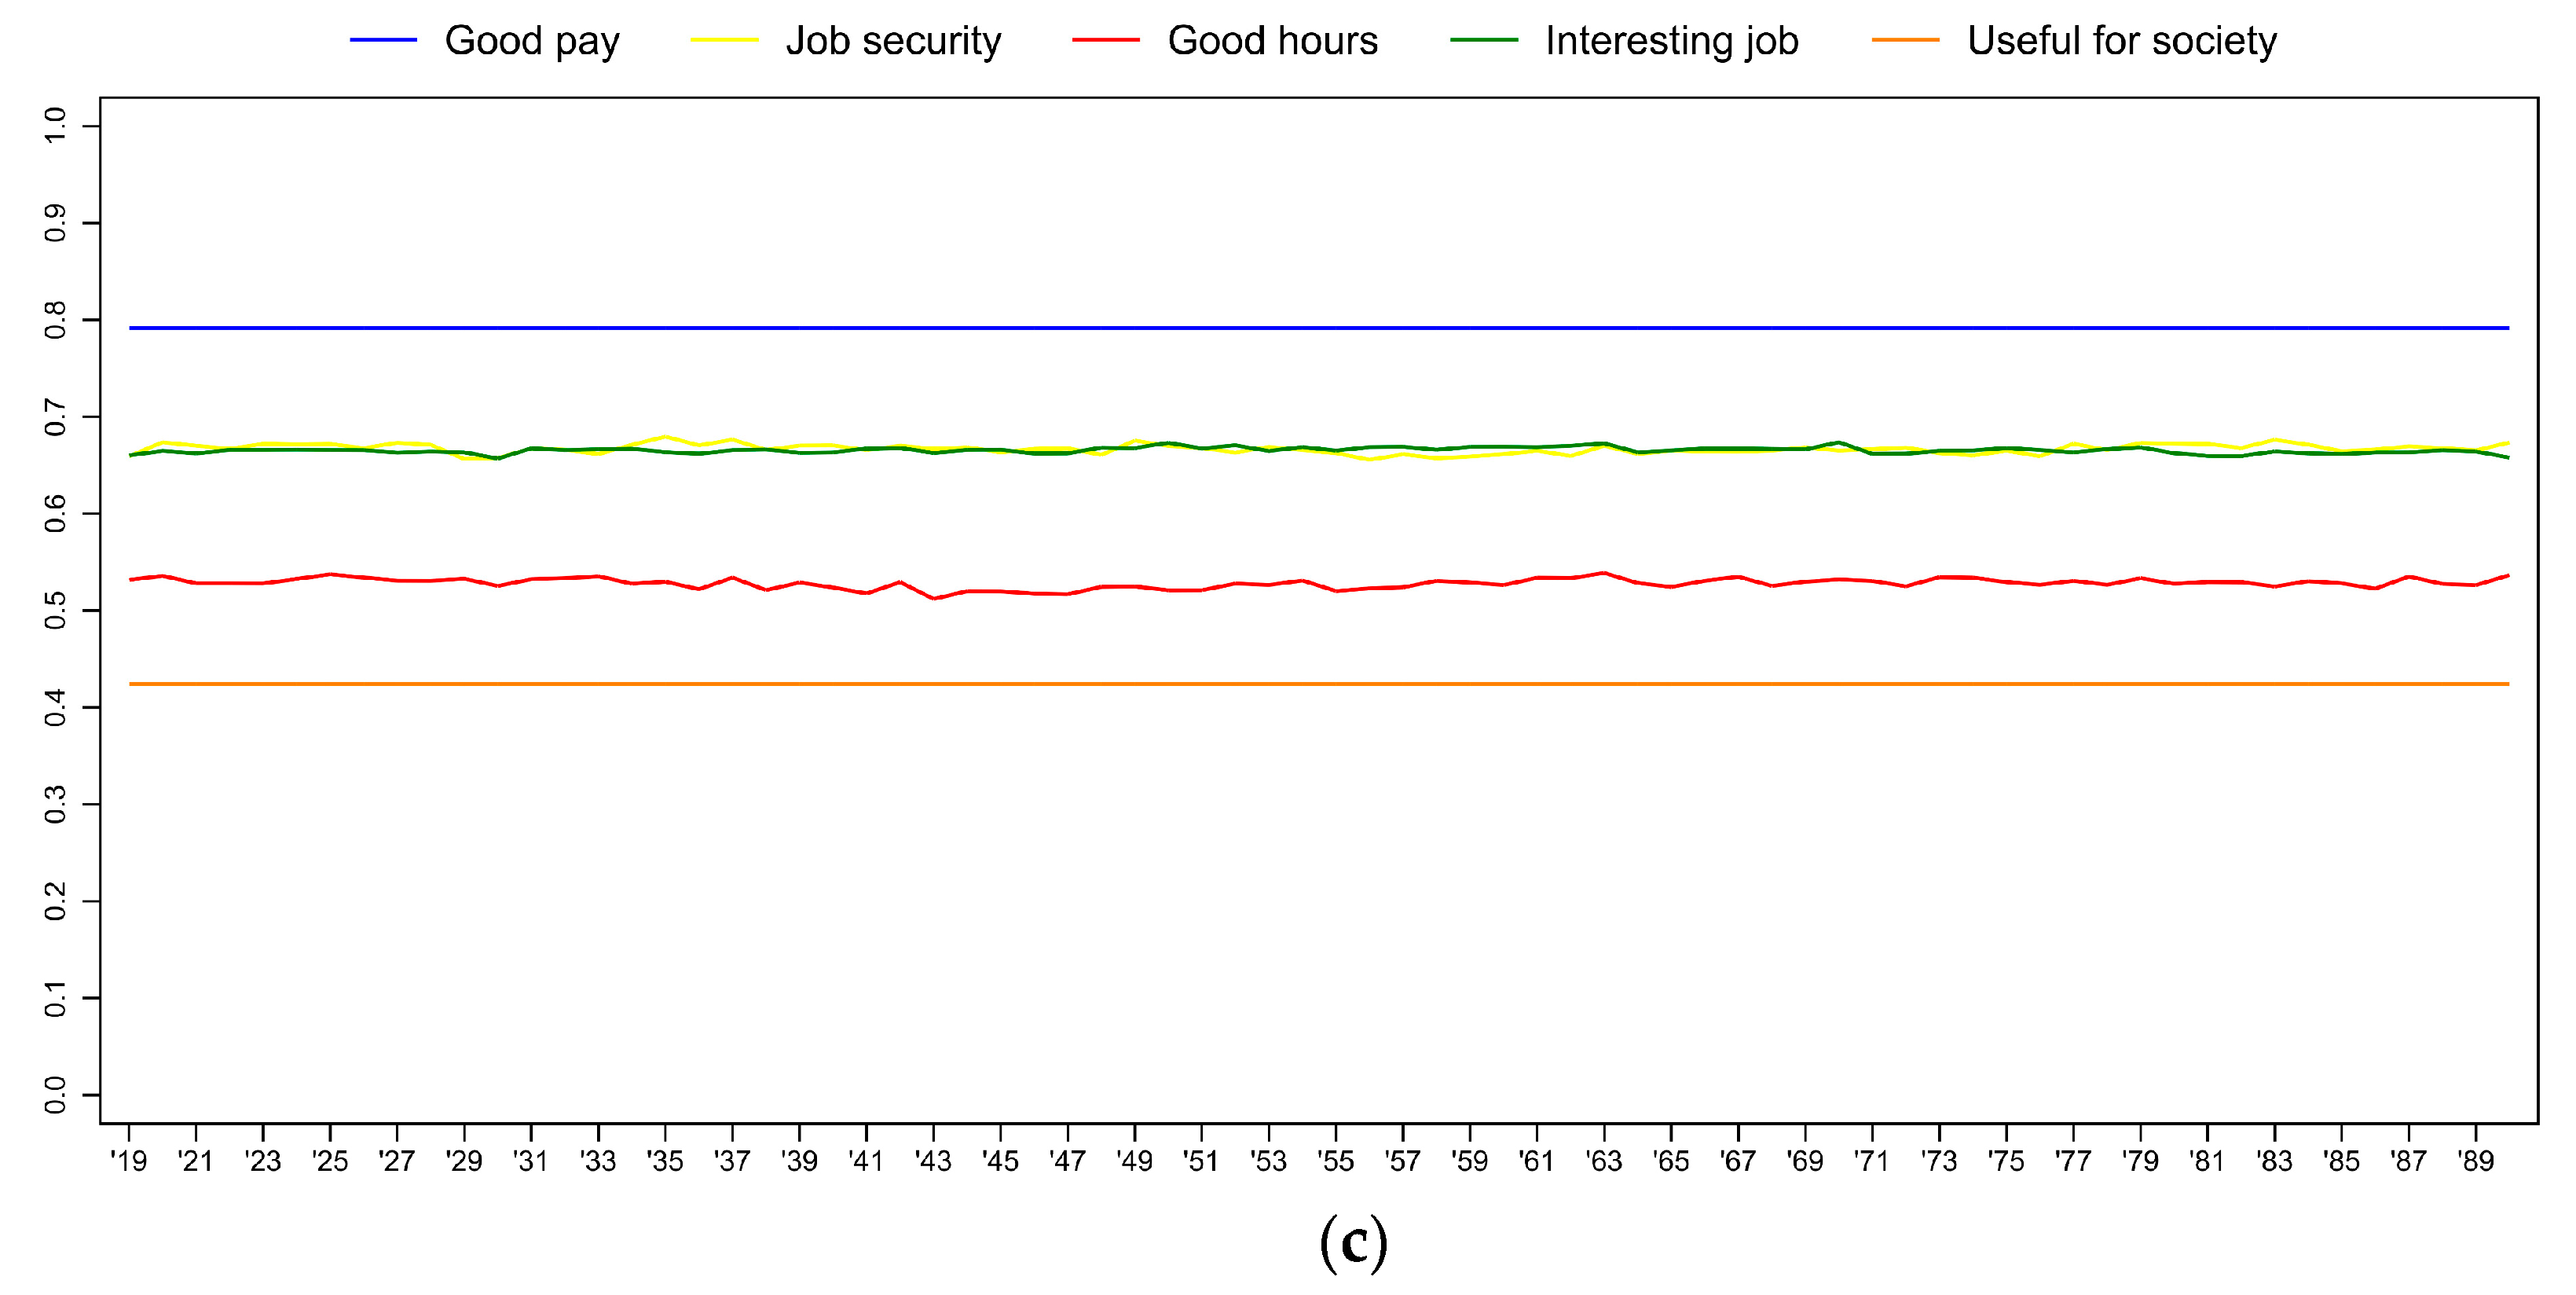
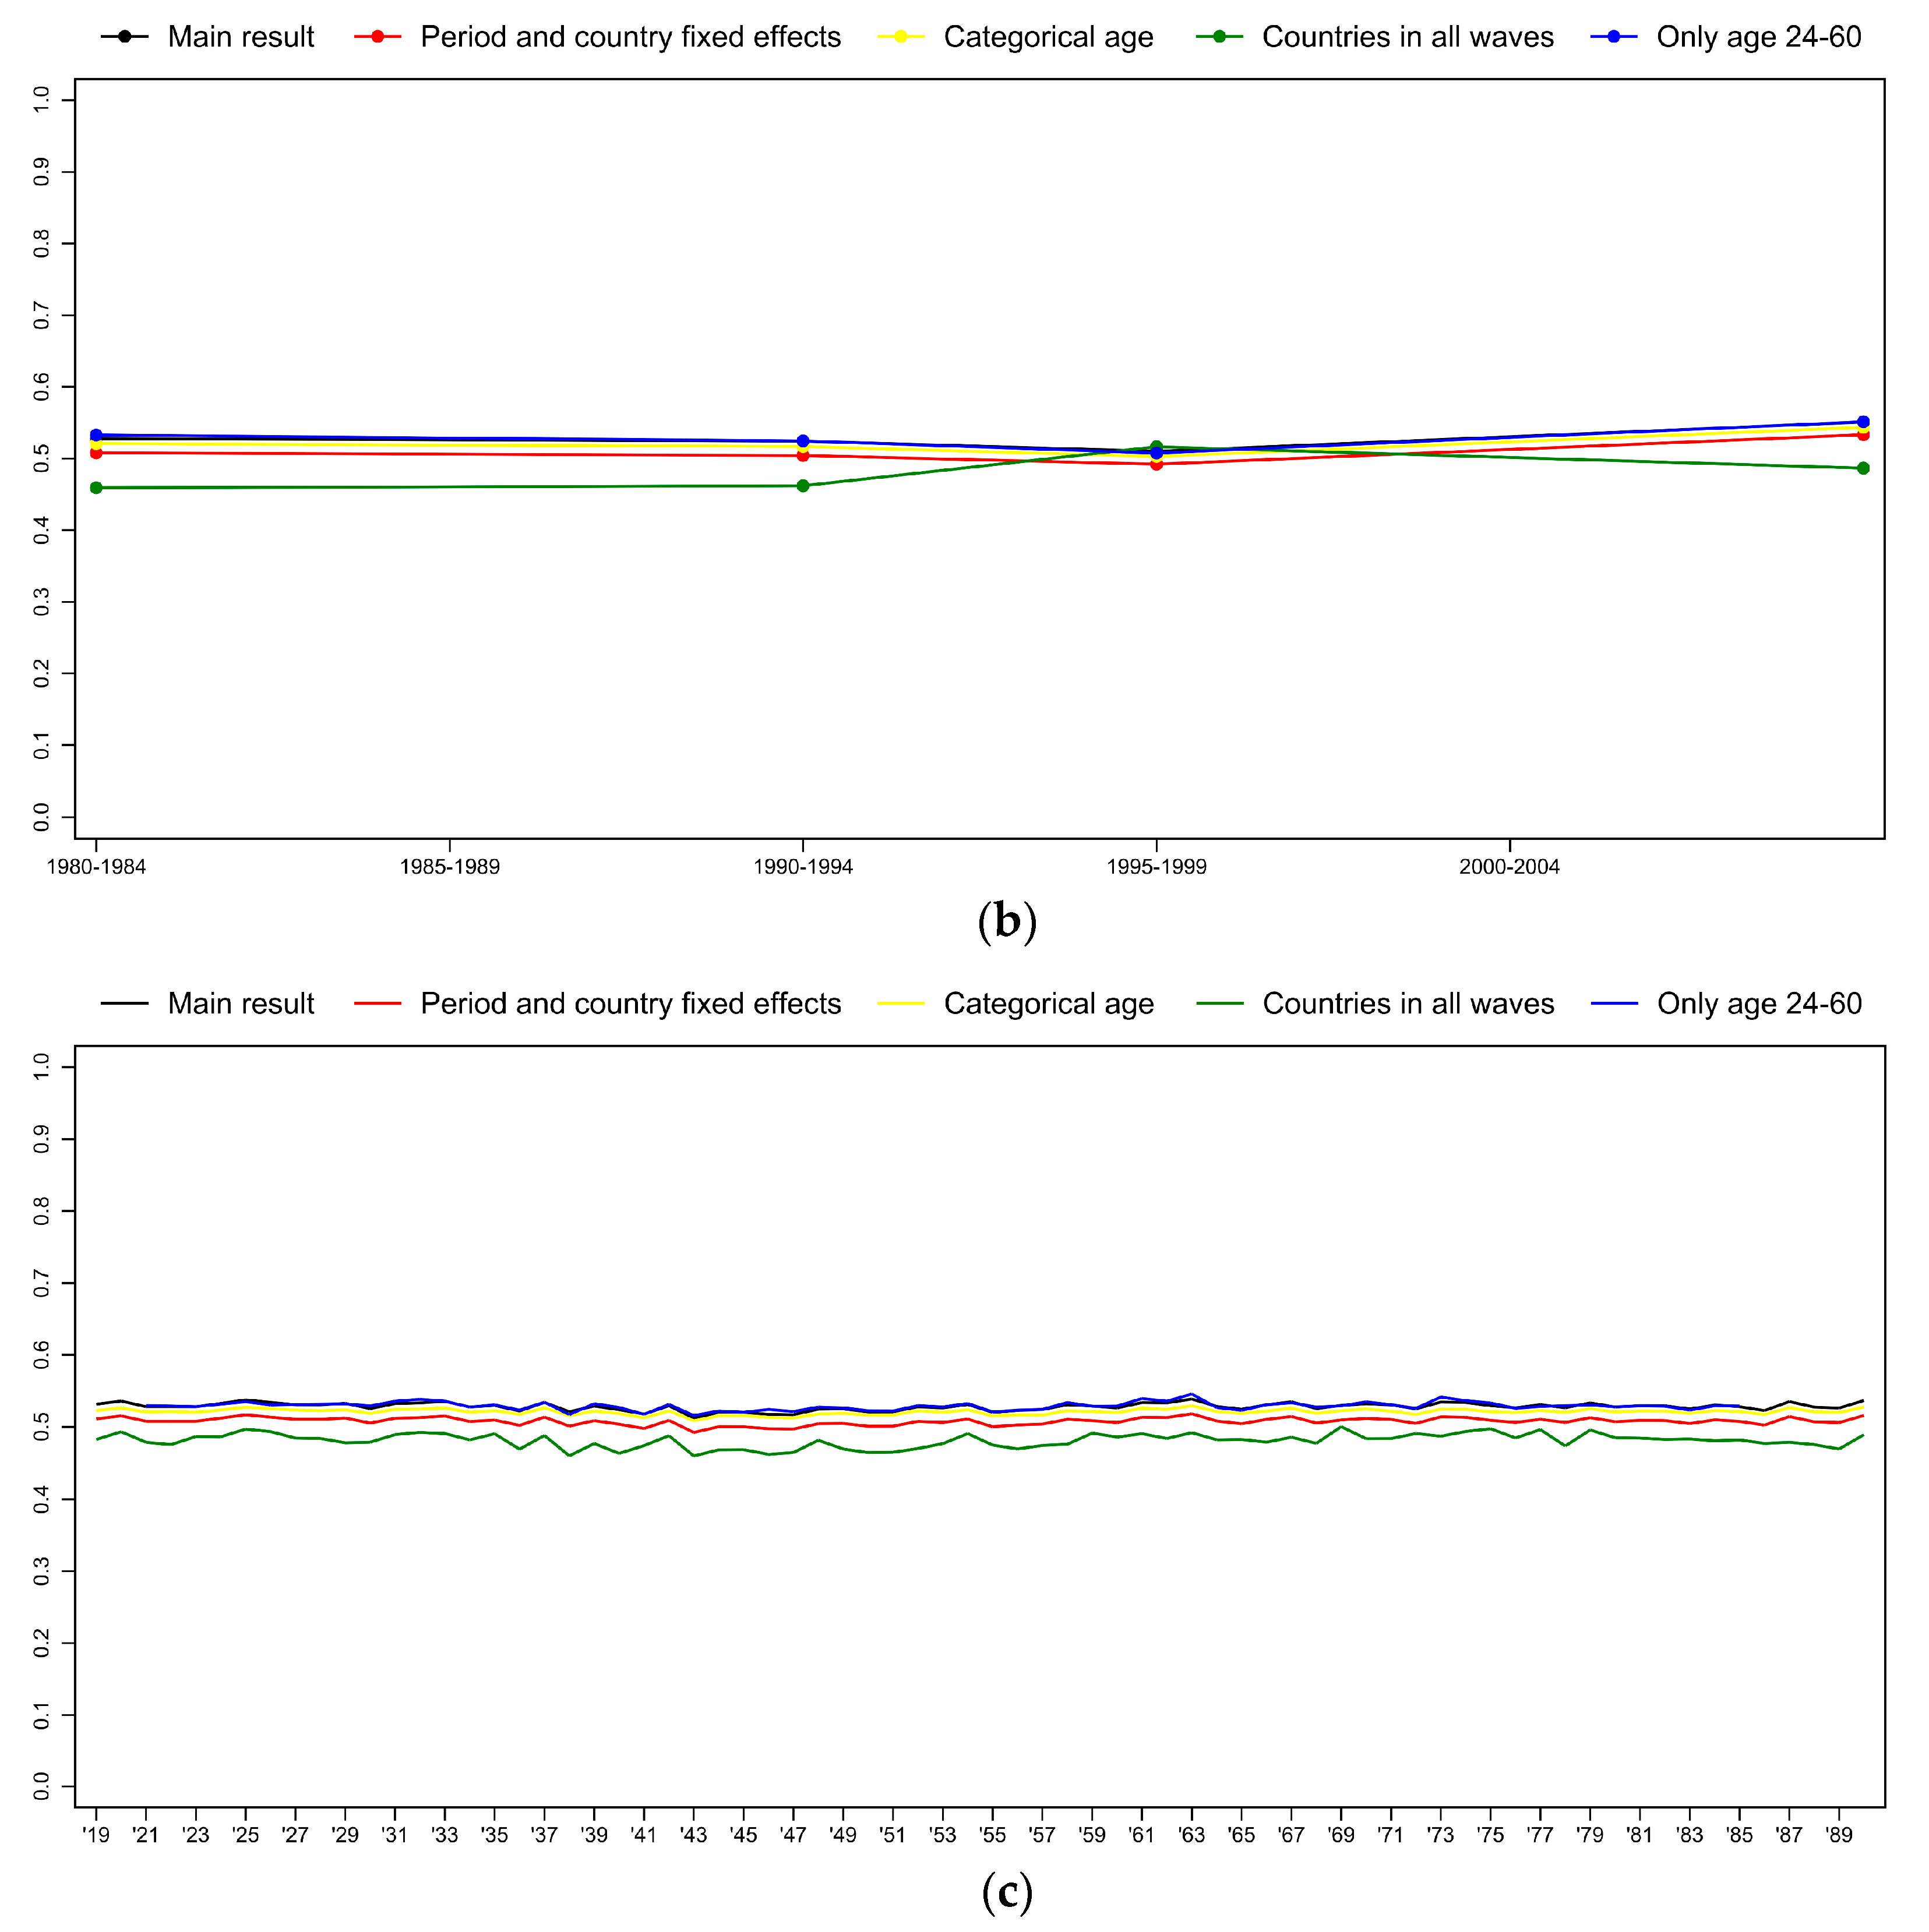
Figure 6 visualizes the results of further robustness tests where we change the specifications of the HAPC model and also use different samples. To keep the results clear-cut and to transfer the information efficiently, we show the results for one of the five work values (importance of good hours). The results for the other four work values are basically identical to this.
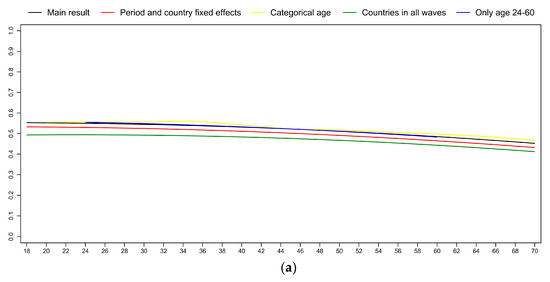
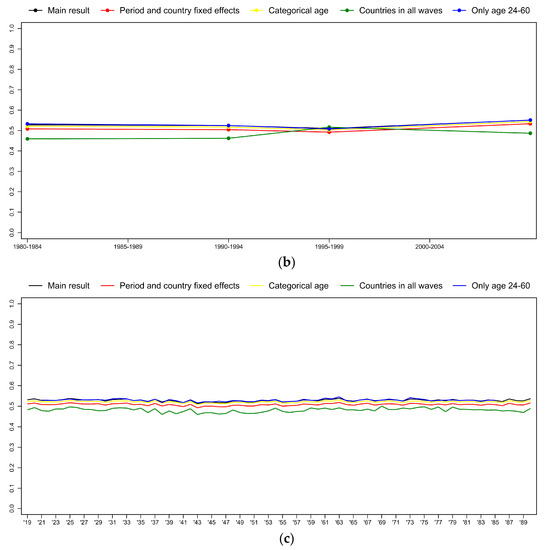
Figure 6.
Robustness of the results: (a) Age, (b) period, and (c) birth-cohort effects on importance of good hours (hierarchical age-period-cohort regression models). The y-axis shows the predicted value of the dependent variable (for an average respondent).
First, we specify the effect of time period and country as fixed instead of random (red line on Figure 5). Then, we use a categorical age variable instead of the quadratic specification. This model includes age group dummies with 5-year brackets (yellow line on Figure 5). We also restrict the sample to fourteen countries that participated in all the four waves of the WVS/EVS (green line on Figure 5). Lastly, we restrict our sample to respondents in their active ages (ages 24–60) (blue line on Figure 5). None of these alter the conclusion of the main model. Only the period effect in the model with the countries participating in all waves differs slightly from the other results. This is not very surprising, since thirteen of these countries are Western European, and previous results suggest that period differences are not the same in post-socialist and in the EU-15 countries [1].
6. Summary and Conclusions
In this paper, our aim was to expand the empirical findings in the literature on the role of generation and birth cohort on work values using multilevel models of the three dimensions of time and data from cross-national surveys.
We argued that while the concept of generation is seemingly concise and elegant, there are several problems with it—especially if one wants to use it in a cross-national analysis. For example, in the empirical literature, generations are often loosely defined timewise. The characteristics used to capture the main features of generations are often based on anecdotal evidence or on invalid and unreliable survey data. The assumption that there are global generations is questionable. Unlike generation, birth cohort is a narrowly defined and neutral phenomenon; therefore, our models use five-year birth cohorts.
From a methodological point of view, the main challenge stems from the fact that age, time period, and birth cohort are linearly interdependent, thus their effects cannot be simultaneously estimated using standard regression models. A possible solution to this identification problem for the analysis of individual level data of repeated cross-sectional surveys is the hierarchical age-period-cohort (HAPC) regression model as proposed by Yang and Land [3,4].
Using HAPC models and data from five waves of the World Values Survey and the European Values Study from more than forty countries, we did not find relevant gaps between birth cohorts with respect to the relative importance of work or with respect to work values. Regarding the relative importance of work, we found that work is slightly less important for birth cohorts born in the middle of the twentieth century compared to cohorts born earlier or later, but the effect size is rather small. Thus, we claim that, in European and Euro-Atlantic countries, birth cohorts are not divided significantly with regard to their work values. In this respect, our findings reinforce the results of Clark [57], Kowske et al. [17], Jin and Rounds [8], Costanza et al. [58], and Becton et al. [20]: instead of pointing to any cohort (or generational) differences, we should emphasize the lack of these.
Our results suggest that age correlates more strongly with the importance of work and work values than birth cohort. The relative centrality of work is higher in the middle age groups than among the younger or older groups, whereas the centrality of friends changes oppositely, being highest among the young and among the old. The importance of leisure time declines with age. This might be explained by the fact that leisure time is seen as the opposite of working hours. Since in older ages work is not central anymore, leisure time also loses its significance. Religion becomes more important with age.
Using a job-related set of work values, we found that the probability of selecting an interesting job, good pay, and good hours as important decreases with age; job security is equally important in every age, whereas the probability of having a useful job being important increases with age. These results suggest that individualistic work values might become less important and holistic or altruistic values might become more important as people get older.
We are aware that analyzing such a large sample of countries might “blind” us to differences among social groups and specific “stories” in single countries. Despite the lack of cohort effects in general, in a country or especially in a workplace, generations might have very diverse attitudes to work. Such analyses are beyond the scope of this paper, but it is a task for future research to identify cohort (or generational) differences in single countries or in subgroups of society. Another direction for future research is to analyze the effect of contextual variables using regional data of single countries. For example, it is possible that the level of unemployment or the activity rate affects work-related values.
In the case of European and Euro-Atlantic countries, the assumption that younger cohorts are less and less work oriented, have less faith in achieving a career, and are less optimistic about getting a job and making ends meet on the basis of a salary, turned out to be wrong. Thus, from a policy point of view, the implication of our results is that the generational differences often referred to in public debates and used in political discourses are very likely a myth. The lack of relevant differences among cohorts means that the social and economic efforts proposed to decrease youth unemployment will not be hindered by changing cohort attitudes towards work.
Acknowledgments
This paper draws on work conducted for the STYLE project (Strategic Transitions for Youth Labour on Europe) that received funding from the European Union’s Seventh Framework Programme for research, technological development and demonstration under grant agreement No. 613256 (http://www.style-research.eu).
Author Contributions
Gábor Hajdu and Endre Sik made a substantial contribution to the design and planning of the study, the interpretation of the data, and the writing and revising of the manuscript. Gábor Hajdu performed the statistical analyses. Endre Sik conceived the theoretical background. Both authors have read and approved the final manuscript.
Conflicts of Interest
The authors declare no conflict of interest.
Appendix A

Table A1.
The number of observations by country and period (relative importance of work).
Table A1.
The number of observations by country and period (relative importance of work).
| 1990–1994 | 1995–1999 | 2005–2009 | 2010–2014 | Total | |
|---|---|---|---|---|---|
| AD | 0 | 0 | 990 | 0 | 990 |
| AL | 0 | 944 | 1502 | 0 | 2446 |
| AT | 1374 | 1475 | 1451 | 0 | 4300 |
| AU | 0 | 1867 | 1291 | 1307 | 4465 |
| BA | 0 | 788 | 1475 | 0 | 2263 |
| BE | 2634 | 1803 | 1445 | 0 | 5882 |
| BG | 961 | 1873 | 2316 | 0 | 5150 |
| CA | 1676 | 0 | 2002 | 0 | 3678 |
| CH | 0 | 1130 | 2349 | 0 | 3479 |
| CS | 0 | 0 | 1181 | 0 | 1181 |
| CY | 0 | 0 | 1973 | 976 | 2949 |
| CZ | 2964 | 2977 | 1684 | 0 | 7625 |
| DE-E | 1276 | 1917 | 1870 | 916 | 5979 |
| DE-W | 1910 | 1969 | 1898 | 963 | 6740 |
| DK | 978 | 960 | 1436 | 0 | 3374 |
| EE | 939 | 1955 | 1425 | 1452 | 5771 |
| ES | 3963 | 2309 | 2526 | 1101 | 9899 |
| FI | 570 | 938 | 2050 | 0 | 3558 |
| FR | 950 | 1583 | 2320 | 0 | 4853 |
| GB-GBN | 1351 | 854 | 2188 | 0 | 4393 |
| GB-NIR | 291 | 899 | 433 | 0 | 1623 |
| GR | 0 | 1095 | 1398 | 0 | 2493 |
| HR | 0 | 2092 | 1406 | 0 | 3498 |
| HU | 949 | 1582 | 2443 | 0 | 4974 |
| IE | 965 | 931 | 860 | 0 | 2756 |
| IS | 690 | 953 | 770 | 0 | 2413 |
| IT | 1986 | 1957 | 2397 | 0 | 6340 |
| LT | 919 | 1924 | 1421 | 0 | 4264 |
| LU | 0 | 1125 | 1563 | 0 | 2688 |
| LV | 780 | 2094 | 1418 | 0 | 4292 |
| MD | 0 | 930 | 2483 | 0 | 3413 |
| ME | 0 | 218 | 1473 | 0 | 1691 |
| MK | 0 | 890 | 1416 | 0 | 2306 |
| MT | 332 | 954 | 1384 | 0 | 2670 |
| NL | 987 | 955 | 2309 | 1726 | 5977 |
| NO | 1224 | 1127 | 2102 | 0 | 4453 |
| NZ | 0 | 1060 | 0 | 740 | 1800 |
| PL | 923 | 2096 | 2355 | 897 | 6271 |
| PT | 1133 | 945 | 1424 | 0 | 3502 |
| RO | 1058 | 2287 | 3041 | 1433 | 7819 |
| RS | 0 | 1239 | 1451 | 0 | 2690 |
| RS-KM | 0 | 0 | 1561 | 0 | 1561 |
| RU | 1768 | 4248 | 3254 | 2215 | 11,485 |
| SE | 971 | 1999 | 2057 | 1093 | 6120 |
| SI | 986 | 1967 | 2285 | 992 | 6230 |
| SK | 1557 | 2371 | 1402 | 0 | 5330 |
| UA | 0 | 3596 | 2345 | 1447 | 7388 |
| US | 1698 | 2607 | 1189 | 2137 | 7631 |
| Total | 40,763 | 69,483 | 83,012 | 19,395 | 212,653 |
Note: AD—Andorra, AL—Albania, AT—Austria, AU—Australia, BA—Bosnia and Herzegovina, BE—Belgium, BG—Bulgaria, CA—Canada, CH—Switzerland, CS—Serbia and Montenegro, CY—Cyprus, CZ—Czech Republic, DE-E—East-Germany, DE-W—West-Germany, DK—Denmark, EE—Estonia, ES—Spain, FI—Finland, FR—France, GB-GBN—Great Britain, GB-NIR—North-Ireland, GR—Greece, HR—Croatia, HU—Hungary, IE—Ireland, IS—Iceland, IT—Italy, LT—Lithuania, LU—Luxemburg, LV—Latvia, MD—Moldova, ME—Montenegro, MK—Macedonia, MT—Malta, NL—Netherlands, NO—Norway, NZ—New-Zealand, PL—Poland, PT—Portugal, RO—Romania, RS—Serbia, RS-KM—Kosovo, RU—Russia, SE—Sweden, SI—Slovenia, SK—Slovakia, UA—Ukraine, US—United States.

Table A2.
The mean of the relative importance of work by country and period.
Table A2.
The mean of the relative importance of work by country and period.
| 1990–1994 | 1995–1999 | 2005–2009 | 2010–2014 | Total | |
|---|---|---|---|---|---|
| AD | - | - | 1.121 | - | 1.121 |
| AL | - | 1.270 | 1.240 | - | 1.252 |
| AT | 1.143 | 1.131 | 1.089 | - | 1.121 |
| AU | - | 1.045 | 1.005 | 0.986 | 1.016 |
| BA | - | 1.118 | 1.085 | - | 1.097 |
| BE | 1.149 | 1.153 | 1.135 | - | 1.147 |
| BG | 1.162 | 1.158 | 1.117 | - | 1.140 |
| CA | 1.069 | - | 1.024 | - | 1.044 |
| CH | - | 1.096 | 1.108 | - | 1.104 |
| CS | - | - | 1.108 | - | 1.108 |
| CY | - | - | 1.054 | 1.067 | 1.058 |
| CZ | 1.214 | 1.173 | 1.125 | - | 1.179 |
| DE-E | 1.150 | 1.173 | 1.133 | 1.090 | 1.143 |
| DE-W | 1.042 | 1.048 | 1.052 | 1.044 | 1.047 |
| DK | 1.100 | 1.055 | 1.055 | - | 1.068 |
| EE | 1.121 | 1.203 | 1.143 | 1.105 | 1.150 |
| ES | 1.177 | 1.174 | 1.135 | 1.140 | 1.162 |
| FI | 1.134 | 1.091 | 1.048 | - | 1.073 |
| FR | 1.181 | 1.183 | 1.159 | - | 1.171 |
| GB-GBN | 1.029 | 1.016 | 0.968 | - | 0.996 |
| GB-NIR | 1.060 | 0.957 | 0.905 | - | 0.961 |
| GR | - | 1.111 | 1.081 | - | 1.094 |
| HR | - | 1.114 | 1.098 | - | 1.107 |
| HU | 1.185 | 1.159 | 1.153 | - | 1.161 |
| IE | 1.099 | 1.028 | 1.018 | - | 1.050 |
| IS | 1.121 | 1.119 | 1.100 | - | 1.114 |
| IT | 1.144 | 1.131 | 1.119 | - | 1.131 |
| LT | 1.135 | 1.152 | 1.122 | - | 1.138 |
| LU | - | 1.117 | 1.167 | - | 1.146 |
| LV | 1.114 | 1.239 | 1.192 | - | 1.201 |
| MD | - | 1.125 | 1.112 | - | 1.116 |
| ME | - | 1.127 | 1.095 | - | 1.099 |
| MK | - | 1.180 | 1.065 | - | 1.109 |
| MT | 1.155 | 1.121 | 1.079 | - | 1.103 |
| NL | 1.072 | 1.054 | 1.018 | 1.023 | 1.034 |
| NO | 1.144 | 1.111 | 1.083 | - | 1.107 |
| NZ | - | 1.069 | - | 1.014 | 1.047 |
| PL | 1.131 | 1.153 | 1.089 | 1.100 | 1.118 |
| PT | 1.148 | 1.139 | 1.126 | - | 1.137 |
| RO | 1.201 | 1.178 | 1.115 | 1.110 | 1.144 |
| RS | - | 1.157 | 1.120 | - | 1.137 |
| RS-KM | - | - | 1.114 | - | 1.114 |
| RU | 1.120 | 1.137 | 1.081 | 1.073 | 1.106 |
| SE | 1.144 | 1.092 | 1.060 | 1.062 | 1.084 |
| SI | 1.232 | 1.195 | 1.148 | 1.125 | 1.173 |
| SK | 1.182 | 1.132 | 1.125 | - | 1.145 |
| UA | - | 1.107 | 1.060 | 1.044 | 1.080 |
| US | 1.035 | 0.992 | 0.936 | 0.950 | 0.981 |
| Total | 1.136 | 1.129 | 1.095 | 1.056 | 1.110 |
Note: For country codes see Table A1.

Table A3.
The mean of the relative importance of family by country and period.
Table A3.
The mean of the relative importance of family by country and period.
| 1990–1994 | 1995–1999 | 2005–2009 | 2010–2014 | Total | |
|---|---|---|---|---|---|
| AD | - | - | 1.282 | - | 1.282 |
| AL | - | 1.341 | 1.352 | - | 1.348 |
| AT | 1.248 | 1.241 | 1.208 | - | 1.232 |
| AU | - | 1.225 | 1.269 | 1.286 | 1.256 |
| BA | - | 1.189 | 1.194 | - | 1.192 |
| BE | 1.263 | 1.262 | 1.278 | - | 1.266 |
| BG | 1.255 | 1.302 | 1.292 | - | 1.289 |
| CA | 1.223 | - | 1.229 | - | 1.226 |
| CH | - | 1.237 | 1.205 | - | 1.215 |
| CS | - | - | 1.257 | - | 1.257 |
| CY | - | - | 1.189 | 1.196 | 1.192 |
| CZ | 1.327 | 1.343 | 1.332 | - | 1.334 |
| DE-E | 1.251 | 1.282 | 1.301 | 1.284 | 1.282 |
| DE-W | 1.229 | 1.239 | 1.240 | 1.221 | 1.234 |
| DK | 1.262 | 1.274 | 1.224 | - | 1.249 |
| EE | 1.305 | 1.303 | 1.302 | 1.308 | 1.304 |
| ES | 1.260 | 1.284 | 1.278 | 1.304 | 1.275 |
| FI | 1.251 | 1.252 | 1.277 | - | 1.266 |
| FR | 1.274 | 1.270 | 1.247 | - | 1.260 |
| GB-GBN | 1.267 | 1.297 | 1.284 | - | 1.281 |
| GB-NIR | 1.277 | 1.253 | 1.267 | - | 1.261 |
| GR | - | 1.205 | 1.159 | - | 1.179 |
| HR | - | 1.236 | 1.226 | - | 1.232 |
| HU | 1.315 | 1.327 | 1.301 | - | 1.312 |
| IE | 1.219 | 1.228 | 1.211 | - | 1.219 |
| IS | 1.272 | 1.264 | 1.222 | - | 1.253 |
| IT | 1.240 | 1.241 | 1.228 | - | 1.236 |
| LT | 1.233 | 1.238 | 1.267 | - | 1.247 |
| LU | - | 1.263 | 1.249 | - | 1.255 |
| LV | 1.306 | 1.278 | 1.278 | - | 1.283 |
| MD | - | 1.281 | 1.254 | - | 1.261 |
| ME | - | 1.281 | 1.235 | - | 1.241 |
| MK | - | 1.238 | 1.162 | - | 1.191 |
| MT | 1.229 | 1.199 | 1.197 | - | 1.202 |
| NL | 1.183 | 1.188 | 1.217 | 1.292 | 1.228 |
| NO | 1.203 | 1.233 | 1.219 | - | 1.219 |
| NZ | - | 1.262 | - | 1.279 | 1.269 |
| PL | 1.223 | 1.238 | 1.234 | 1.221 | 1.232 |
| PT | 1.254 | 1.247 | 1.249 | - | 1.250 |
| RO | 1.264 | 1.266 | 1.249 | 1.278 | 1.261 |
| RS | - | 1.269 | 1.232 | - | 1.249 |
| RS-KM | - | - | 1.221 | - | 1.221 |
| RU | 1.309 | 1.298 | 1.286 | 1.338 | 1.304 |
| SE | 1.217 | 1.218 | 1.255 | 1.223 | 1.231 |
| SI | 1.262 | 1.288 | 1.277 | 1.326 | 1.286 |
| SK | 1.284 | 1.282 | 1.270 | - | 1.279 |
| UA | - | 1.292 | 1.283 | 1.293 | 1.289 |
| US | 1.191 | 1.177 | 1.232 | 1.224 | 1.202 |
| Total | 1.257 | 1.263 | 1.251 | 1.275 | 1.258 |
Note: For country codes see Table A1.

Table A4.
The mean of the relative importance of friends by country and period.
Table A4.
The mean of the relative importance of friends by country and period.
| 1990–1994 | 1995–1999 | 2005–2009 | 2010–2014 | Total | |
|---|---|---|---|---|---|
| AD | - | - | 1.126 | - | 1.126 |
| AL | - | 1.027 | 1.005 | - | 1.014 |
| AT | 1.027 | 1.051 | 1.125 | - | 1.068 |
| AU | - | 1.126 | 1.136 | 1.148 | 1.135 |
| BA | - | 1.092 | 1.059 | - | 1.071 |
| BE | 1.114 | 1.088 | 1.112 | - | 1.106 |
| BG | 1.053 | 1.091 | 1.086 | - | 1.082 |
| CA | 1.070 | - | 1.123 | - | 1.099 |
| CH | - | 1.144 | 1.123 | - | 1.130 |
| CS | - | - | 1.111 | - | 1.111 |
| CY | - | - | 1.054 | 1.071 | 1.060 |
| CZ | 1.037 | 1.100 | 1.157 | - | 1.088 |
| DE-E | 1.040 | 1.144 | 1.174 | 1.179 | 1.137 |
| DE-W | 1.098 | 1.134 | 1.134 | 1.133 | 1.124 |
| DK | 1.121 | 1.147 | 1.123 | - | 1.129 |
| EE | 1.043 | 1.086 | 1.102 | 1.145 | 1.098 |
| ES | 1.103 | 1.086 | 1.113 | 1.159 | 1.108 |
| FI | 1.098 | 1.170 | 1.158 | - | 1.152 |
| FR | 1.089 | 1.120 | 1.109 | - | 1.109 |
| GB-GBN | 1.112 | 1.174 | 1.185 | - | 1.161 |
| GB-NIR | 1.121 | 1.174 | 1.205 | - | 1.173 |
| GR | - | 1.051 | 1.023 | - | 1.036 |
| HR | - | 1.088 | 1.075 | - | 1.083 |
| HU | 0.999 | 1.058 | 1.092 | - | 1.064 |
| IE | 1.081 | 1.116 | 1.155 | - | 1.116 |
| IS | 1.100 | 1.085 | 1.108 | - | 1.097 |
| IT | 1.053 | 1.029 | 1.043 | - | 1.042 |
| LT | 0.987 | 1.018 | 1.042 | - | 1.019 |
| LU | - | 1.097 | 1.112 | - | 1.106 |
| LV | 1.002 | 1.050 | 1.059 | - | 1.045 |
| MD | - | 0.978 | 0.990 | - | 0.987 |
| ME | - | 1.109 | 1.097 | - | 1.099 |
| MK | - | 1.054 | 1.086 | - | 1.074 |
| MT | 0.873 | 0.913 | 0.975 | - | 0.940 |
| NL | 1.130 | 1.133 | 1.142 | 1.161 | 1.144 |
| NO | 1.132 | 1.132 | 1.132 | - | 1.132 |
| NZ | - | 1.126 | - | 1.134 | 1.129 |
| PL | 0.927 | 0.979 | 1.042 | 1.030 | 1.002 |
| PT | 1.048 | 1.041 | 1.077 | - | 1.058 |
| RO | 0.973 | 0.950 | 0.956 | 0.936 | 0.953 |
| RS | - | 1.114 | 1.075 | - | 1.093 |
| RS-KM | - | - | 0.916 | - | 0.916 |
| RU | 1.045 | 1.046 | 1.077 | 1.070 | 1.059 |
| SE | 1.155 | 1.153 | 1.144 | 1.160 | 1.151 |
| SI | 1.059 | 1.111 | 1.127 | 1.138 | 1.113 |
| SK | 1.021 | 1.058 | 1.070 | - | 1.051 |
| UA | - | 1.080 | 1.058 | 1.070 | 1.071 |
| US | 1.045 | 1.076 | 1.099 | 1.089 | 1.076 |
| Total | 1.064 | 1.079 | 1.088 | 1.104 | 1.082 |
Note: For country codes see Table A1.

Table A5.
The mean of the relative importance of leisure time by country and period.
Table A5.
The mean of the relative importance of leisure time by country and period.
| 1990–1994 | 1995–1999 | 2005–2009 | 2010–2014 | Total | |
|---|---|---|---|---|---|
| AD | - | - | 1.144 | - | 1.144 |
| AL | - | 0.808 | 0.939 | - | 0.888 |
| AT | 1.023 | 1.027 | 1.070 | - | 1.040 |
| AU | - | 1.052 | 1.090 | 1.092 | 1.074 |
| BA | - | 0.992 | 1.012 | - | 1.005 |
| BE | 1.074 | 1.052 | 1.079 | - | 1.068 |
| BG | 1.032 | 0.949 | 0.989 | - | 0.983 |
| CA | 1.026 | - | 1.030 | - | 1.028 |
| CH | - | 1.066 | 1.057 | - | 1.060 |
| CS | - | - | 1.018 | - | 1.018 |
| CY | - | - | 1.013 | 1.043 | 1.023 |
| CZ | 1.017 | 1.028 | 1.127 | - | 1.046 |
| DE-E | 1.049 | 1.051 | 1.074 | 1.094 | 1.064 |
| DE-W | 1.103 | 1.054 | 1.050 | 1.047 | 1.066 |
| DK | 1.095 | 1.099 | 1.099 | - | 1.098 |
| EE | 1.046 | 1.023 | 1.066 | 1.083 | 1.052 |
| ES | 1.057 | 1.033 | 1.102 | 1.118 | 1.070 |
| FI | 1.107 | 1.076 | 1.132 | - | 1.113 |
| FR | 1.039 | 1.056 | 1.031 | - | 1.041 |
| GB-GBN | 1.076 | 1.138 | 1.103 | - | 1.101 |
| GB-NIR | 0.985 | 1.060 | 1.097 | - | 1.056 |
| GR | - | 1.035 | 1.026 | - | 1.030 |
| HR | - | 1.001 | 1.031 | - | 1.013 |
| HU | 1.019 | 1.046 | 1.081 | - | 1.058 |
| IE | 0.966 | 1.020 | 1.076 | - | 1.018 |
| IS | 1.023 | 1.013 | 1.008 | - | 1.014 |
| IT | 1.010 | 0.978 | 0.976 | - | 0.987 |
| LT | 0.971 | 0.977 | 1.035 | - | 0.995 |
| LU | - | 1.061 | 1.032 | - | 1.044 |
| LV | 1.013 | 0.966 | 1.046 | - | 1.001 |
| MD | - | 0.953 | 0.955 | - | 0.954 |
| ME | - | 0.958 | 1.035 | - | 1.025 |
| MK | - | 1.020 | 1.056 | - | 1.042 |
| MT | 0.990 | 1.018 | 1.024 | - | 1.018 |
| NL | 1.089 | 1.104 | 1.122 | 1.133 | 1.117 |
| NO | 1.036 | 1.045 | 1.076 | - | 1.057 |
| NZ | - | 1.086 | - | 1.103 | 1.093 |
| PL | 0.965 | 0.950 | 1.006 | 1.001 | 0.981 |
| PT | 0.996 | 0.986 | 1.005 | - | 0.997 |
| RO | 0.953 | 0.952 | 0.972 | 0.991 | 0.967 |
| RS | - | 0.959 | 1.019 | - | 0.992 |
| RS-KM | - | - | 0.899 | - | 0.899 |
| RU | 1.018 | 0.987 | 1.022 | 1.029 | 1.010 |
| SE | 1.106 | 1.084 | 1.115 | 1.102 | 1.101 |
| SI | 0.985 | 1.042 | 1.088 | 1.110 | 1.061 |
| SK | 0.994 | 1.008 | 1.009 | - | 1.004 |
| UA | - | 0.967 | 1.007 | 1.019 | 0.990 |
| US | 0.987 | 0.982 | 1.006 | 1.034 | 1.002 |
| Total | 1.032 | 1.013 | 1.042 | 1.063 | 1.033 |
Note: For country codes see Table A1.

Table A6.
The mean of the relative importance of religion by country and period.
Table A6.
The mean of the relative importance of religion by country and period.
| 1990–1994 | 1995–1999 | 2005–2009 | 2010–2014 | Total | |
|---|---|---|---|---|---|
| AD | - | - | 0.633 | - | 0.633 |
| AL | - | 0.911 | 0.841 | - | 0.868 |
| AT | 0.859 | 0.813 | 0.768 | - | 0.813 |
| AU | - | 0.769 | 0.707 | 0.679 | 0.725 |
| BA | - | 0.902 | 0.953 | - | 0.935 |
| BE | 0.770 | 0.773 | 0.717 | - | 0.758 |
| BG | 0.663 | 0.784 | 0.836 | - | 0.785 |
| CA | 0.846 | - | 0.849 | - | 0.848 |
| CH | - | 0.748 | 0.726 | - | 0.733 |
| CS | - | - | 0.898 | - | 0.898 |
| CY | - | - | 1.002 | 0.944 | 0.983 |
| CZ | 0.642 | 0.624 | 0.591 | - | 0.624 |
| DE-E | 0.654 | 0.547 | 0.554 | 0.573 | 0.576 |
| DE-W | 0.728 | 0.729 | 0.745 | 0.748 | 0.736 |
| DK | 0.661 | 0.656 | 0.676 | - | 0.666 |
| EE | 0.636 | 0.676 | 0.684 | 0.654 | 0.666 |
| ES | 0.809 | 0.809 | 0.714 | 0.656 | 0.768 |
| FI | 0.736 | 0.777 | 0.715 | - | 0.735 |
| FR | 0.738 | 0.689 | 0.694 | - | 0.701 |
| GB-GBN | 0.773 | 0.697 | 0.728 | - | 0.736 |
| GB-NIR | 0.911 | 0.850 | 0.861 | - | 0.864 |
| GR | - | 0.906 | 0.973 | - | 0.944 |
| HR | - | 0.894 | 0.914 | - | 0.902 |
| HU | 0.831 | 0.771 | 0.728 | - | 0.761 |
| IE | 1.011 | 0.940 | 0.854 | - | 0.938 |
| IS | 0.836 | 0.814 | 0.781 | - | 0.810 |
| IT | 0.906 | 0.938 | 0.924 | - | 0.922 |
| LT | 0.806 | 0.856 | 0.848 | - | 0.843 |
| LU | - | 0.747 | 0.689 | - | 0.713 |
| LV | 0.688 | 0.760 | 0.733 | - | 0.740 |
| MD | - | 0.964 | 1.002 | - | 0.992 |
| ME | - | 0.855 | 0.956 | - | 0.943 |
| MK | - | 0.861 | 0.921 | - | 0.898 |
| MT | 1.113 | 1.070 | 1.058 | - | 1.069 |
| NL | 0.730 | 0.700 | 0.699 | 0.622 | 0.682 |
| NO | 0.712 | 0.720 | 0.683 | - | 0.700 |
| NZ | - | 0.697 | - | 0.685 | 0.692 |
| PL | 1.048 | 1.020 | 0.980 | 0.975 | 1.002 |
| PT | 0.920 | 0.947 | 0.922 | - | 0.928 |
| RO | 1.010 | 1.030 | 1.103 | 1.073 | 1.064 |
| RS | - | 0.855 | 0.896 | - | 0.877 |
| RS-KM | - | - | 1.051 | - | 1.051 |
| RU | 0.717 | 0.793 | 0.808 | 0.792 | 0.786 |
| SE | 0.627 | 0.668 | 0.618 | 0.609 | 0.634 |
| SI | 0.774 | 0.766 | 0.748 | 0.720 | 0.753 |
| SK | 0.815 | 0.847 | 0.883 | - | 0.847 |
| UA | - | 0.837 | 0.878 | 0.901 | 0.863 |
| US | 0.979 | 0.991 | 0.944 | 0.911 | 0.958 |
| Total | 0.793 | 0.810 | 0.818 | 0.779 | 0.807 |
Note: For country codes see Table A1.

Table A7.
The HAPC models of the relative importance of life aspects, only time related variables.
Table A7.
The HAPC models of the relative importance of life aspects, only time related variables.
| Work | Family | Friends | Leisure Time | Religion | ||||||
|---|---|---|---|---|---|---|---|---|---|---|
| B | SE | B | SE | B | SE | B | SE | B | SE | |
| Individual effects | ||||||||||
| Age | −0.0011 *** | (0.000) | 0.0003 *** | (0.000) | −0.0017 *** | (0.000) | −0.0023 *** | (0.000) | 0.0037 *** | (0.000) |
| Age squared | −0.0002 *** | (0.000) | −0.0000 *** | (0.000) | 0.0001 *** | (0.000) | 0.0000 *** | (0.000) | 0.0000 *** | (0.000) |
| Intercept | 1.1515 *** | (0.014) | 1.2582 *** | (0.008) | 1.0574 *** | (0.014) | 1.0260 *** | (0.013) | 0.8142 *** | (0.021) |
| Variance components | ||||||||||
| Individual | 0.0512 *** | (0.000) | 0.0328 *** | (0.000) | 0.0360 *** | (0.000) | 0.0443 *** | (0.000) | 0.0744 *** | (0.000) |
| Period | 0.0005 *** | (0.000) | 0.0001 *** | (0.000) | 0.0004 *** | (0.000) | 0.0005 *** | (0.000) | 0.0004 *** | (0.000) |
| Cohort | 0.0002 *** | (0.000) | 0.0000 *** | (0.000) | 0.0000 *** | (0.000) | 0.0000 *** | (0.000) | 0.0003 *** | (0.000) |
| Country | 0.0030 *** | (0.000) | 0.0013 *** | (0.000) | 0.0035 *** | (0.000) | 0.0028 *** | (0.000) | 0.0163 *** | (0.002) |
| N | 209,851 | 209,851 | 209,851 | 209,851 | 209,851 | |||||
| AIC | −27,567.3 | −121,174.6 | −101,906.1 | −58,269.5 | 50,907.7 | |||||
Note: Standard errors in parentheses. *** p < 0.01.

Table A8.
The HAPC models of the relative importance of life aspects, with control variables.
Table A8.
The HAPC models of the relative importance of life aspects, with control variables.
| Work | Family | Friends | Leisure Time | Religion | ||||||
|---|---|---|---|---|---|---|---|---|---|---|
| B | SE | B | SE | B | SE | B | SE | B | SE | |
| Individual effects | ||||||||||
| Age | 0.0000 | (0.000) | −0.0011 *** | (0.000) | −0.0013 *** | (0.000) | −0.0020 *** | (0.000) | 0.0030 *** | (0.000) |
| Age squared | −0.0001 *** | (0.000) | 0.0000 *** | (0.000) | 0.0000 *** | (0.000) | −0.0000 | (0.000) | 0.0000 *** | (0.000) |
| Female | −0.0190 *** | (0.001) | 0.0161 *** | (0.001) | −0.0065 *** | (0.001) | −0.0137 *** | (0.001) | 0.0739 *** | (0.001) |
| Education: more than secondary | −0.0172 *** | (0.001) | −0.0173 *** | (0.001) | 0.0041 *** | (0.001) | −0.0087 *** | (0.001) | −0.0261 *** | (0.002) |
| Labor force status (reference: full-time worker) | ||||||||||
| Part-time worker | −0.0285 *** | (0.002) | −0.0006 | (0.002) | 0.0080 *** | (0.002) | −0.0086 *** | (0.002) | 0.0225 *** | (0.002) |
| Self-employed | 0.0093 *** | (0.002) | −0.0021 | (0.002) | 0.0030 | (0.002) | −0.0357 *** | (0.002) | 0.0146 *** | (0.003) |
| Retired | −0.1204 *** | (0.002) | 0.0310 *** | (0.002) | 0.0205 *** | (0.002) | 0.0041 ** | (0.002) | 0.0494 *** | (0.002) |
| Housewife | −0.0818 *** | (0.002) | 0.0207 *** | (0.002) | 0.0106 *** | (0.002) | −0.0243 *** | (0.002) | 0.0834 *** | (0.002) |
| Student | −0.0642 *** | (0.003) | −0.0014 | (0.002) | 0.0173 *** | (0.002) | −0.0078 *** | (0.002) | 0.0212 *** | (0.003) |
| Unemployed | −0.0191 *** | (0.002) | 0.0074 *** | (0.002) | 0.0035 ** | (0.002) | −0.0159 *** | (0.002) | 0.0346 *** | (0.002) |
| Other | −0.0849 *** | (0.004) | 0.0146 *** | (0.003) | 0.0159 *** | (0.003) | −0.0130 *** | (0.003) | 0.0652 *** | (0.004) |
| Type of settlement: city | −0.0099 *** | (0.001) | −0.0051 *** | (0.001) | 0.0090 *** | (0.001) | 0.0176 *** | (0.001) | −0.0317 *** | (0.001) |
| Marital status (reference: single) | ||||||||||
| Married/living with partner | 0.0029 * | (0.002) | 0.0775 *** | (0.001) | −0.0498 *** | (0.001) | −0.0323 *** | (0.001) | 0.0108 *** | (0.002) |
| Divorced/separated/widowed | 0.0085 *** | (0.002) | 0.0498 *** | (0.002) | −0.0266 *** | (0.002) | −0.0280 *** | (0.002) | 0.0168 *** | (0.002) |
| Intercept | 1.1873 *** | (0.014) | 1.1800 *** | (0.011) | 1.0939 *** | (0.014) | 1.0666 *** | (0.013) | 0.7642 *** | (0.021) |
| Variance components | ||||||||||
| Individual | 0.0497 *** | (0.000) | 0.0319 *** | (0.000) | 0.0356 *** | (0.000) | 0.0439 *** | (0.000) | 0.0716 *** | (0.000) |
| Period | 0.0006 *** | (0.000) | 0.0003 *** | (0.000) | 0.0005 *** | (0.000) | 0.0004 *** | (0.000) | 0.0004 *** | (0.000) |
| Cohort | 0.0002 *** | (0.000) | 0.0000 *** | (0.000) | 0.0000 *** | (0.000) | 0.0001 *** | (0.000) | 0.0003 *** | (0.000) |
| Country | 0.0030 *** | (0.000) | 0.0013 *** | (0.000) | 0.0034 *** | (0.000) | 0.0027 *** | (0.000) | 0.0153 *** | (0.002) |
| N | 209,851 | 209,851 | 209,851 | 209,851 | 209,851 | |||||
| AIC | −33,859.2 | −127,329.9 | −104,071.3 | −59,998.7 | 42,743.8 | |||||
Note: Standard errors in parentheses. ** p < 0.05, *** p < 0.01.

Table A9.
The number of observations for the importance of good pay by country and period.
Table A9.
The number of observations for the importance of good pay by country and period.
| 1980–1984 | 1989–1994 | 1995–1999 | 2005–2009 | Total | |
|---|---|---|---|---|---|
| AL | 0 | 0 | 960 | 1508 | 2468 |
| AT | 0 | 1346 | 1414 | 1355 | 4115 |
| AU | 1098 | 0 | 1761 | 0 | 2859 |
| BA | 0 | 0 | 777 | 1419 | 2196 |
| BE | 1009 | 2600 | 1688 | 1329 | 6626 |
| BG | 0 | 962 | 1782 | 1281 | 4025 |
| CA | 1173 | 1584 | 0 | 0 | 2757 |
| CH | 0 | 0 | 1069 | 1080 | 2149 |
| CZ | 0 | 2844 | 2720 | 1565 | 7129 |
| DE-E | 0 | 1220 | 1781 | 875 | 3876 |
| DE-W | 1251 | 1860 | 1831 | 941 | 5883 |
| DK | 1087 | 921 | 915 | 1325 | 4248 |
| EE | 0 | 961 | 1895 | 1261 | 4117 |
| ES | 2140 | 3851 | 2163 | 1224 | 9378 |
| FI | 0 | 565 | 918 | 1069 | 2552 |
| FR | 1099 | 942 | 1469 | 1269 | 4779 |
| GB-GBN | 1034 | 1272 | 869 | 1223 | 4398 |
| GB-NIR | 284 | 270 | 843 | 399 | 1796 |
| GR | 0 | 0 | 1092 | 1248 | 2340 |
| HR | 0 | 0 | 2088 | 1306 | 3394 |
| HU | 0 | 897 | 1477 | 1371 | 3745 |
| IE | 1105 | 907 | 868 | 827 | 3707 |
| IS | 891 | 665 | 910 | 748 | 3214 |
| IT | 1298 | 1948 | 1849 | 1317 | 6412 |
| LT | 0 | 923 | 1902 | 1339 | 4164 |
| LU | 0 | 0 | 1090 | 1493 | 2583 |
| LV | 0 | 881 | 2052 | 1308 | 4241 |
| MD | 0 | 0 | 912 | 1372 | 2284 |
| ME | 0 | 0 | 217 | 1432 | 1649 |
| MK | 0 | 0 | 962 | 1395 | 2357 |
| MT | 424 | 335 | 899 | 1215 | 2873 |
| NL | 1123 | 951 | 890 | 1232 | 4196 |
| NO | 949 | 1146 | 1042 | 1005 | 4142 |
| NZ | 0 | 0 | 1044 | 0 | 1044 |
| PL | 0 | 938 | 2000 | 1344 | 4282 |
| PT | 0 | 1093 | 849 | 1208 | 3150 |
| RO | 0 | 1048 | 2219 | 1298 | 4565 |
| RS | 0 | 0 | 1195 | 1363 | 2558 |
| RS-KM | 0 | 0 | 0 | 1559 | 1559 |
| RU | 0 | 1858 | 4093 | 1304 | 7255 |
| SE | 889 | 968 | 1882 | 1090 | 4829 |
| SI | 0 | 1032 | 1866 | 1170 | 4068 |
| SK | 0 | 1515 | 2243 | 1223 | 4981 |
| UA | 0 | 0 | 3685 | 1315 | 5000 |
| US | 2122 | 1609 | 2409 | 0 | 6140 |
| Total | 18,976 | 39,912 | 66,590 | 50,605 | 176,083 |
Note: For country codes see Table A1.

Table A10.
The number of observations for the importance of having a job that is useful for society by country and period.
Table A10.
The number of observations for the importance of having a job that is useful for society by country and period.
| 1980–1984 | 1989–1994 | 1995–1999 | 2005–2009 | Total | |
|---|---|---|---|---|---|
| AL | 0 | 0 | 0 | 1508 | 1508 |
| AT | 0 | 1346 | 1414 | 1344 | 4104 |
| BA | 0 | 0 | 0 | 1419 | 1419 |
| BE | 1009 | 2600 | 1688 | 1329 | 6626 |
| BG | 0 | 962 | 872 | 1206 | 3040 |
| CA | 1173 | 1584 | 0 | 0 | 2757 |
| CH | 0 | 0 | 0 | 1080 | 1080 |
| CZ | 0 | 2844 | 1683 | 1538 | 6065 |
| DE-E | 0 | 1220 | 823 | 875 | 2918 |
| DE-W | 1251 | 1860 | 840 | 941 | 4892 |
| DK | 1087 | 921 | 915 | 1325 | 4248 |
| EE | 0 | 961 | 917 | 1248 | 3126 |
| ES | 2140 | 3851 | 1073 | 1224 | 8288 |
| FI | 0 | 565 | 0 | 1069 | 1634 |
| FR | 1099 | 942 | 1469 | 1269 | 4779 |
| GB-GBN | 1034 | 1272 | 869 | 1223 | 4398 |
| GB-NIR | 284 | 270 | 843 | 372 | 1769 |
| GR | 0 | 0 | 1092 | 1247 | 2339 |
| HR | 0 | 0 | 994 | 1246 | 2240 |
| HU | 0 | 897 | 890 | 1371 | 3158 |
| IE | 1105 | 907 | 868 | 750 | 3630 |
| IS | 891 | 665 | 910 | 748 | 3214 |
| IT | 1298 | 1948 | 1849 | 1305 | 6400 |
| LT | 0 | 923 | 961 | 1339 | 3223 |
| LU | 0 | 0 | 1090 | 1472 | 2562 |
| LV | 0 | 881 | 911 | 1287 | 3079 |
| MD | 0 | 0 | 0 | 1352 | 1352 |
| ME | 0 | 0 | 0 | 1432 | 1432 |
| MK | 0 | 0 | 0 | 1203 | 1203 |
| MT | 424 | 335 | 899 | 1189 | 2847 |
| NL | 1123 | 951 | 890 | 1233 | 4197 |
| NO | 949 | 1146 | 0 | 1005 | 3100 |
| PL | 0 | 938 | 974 | 1310 | 3222 |
| PT | 0 | 1093 | 849 | 1200 | 3142 |
| RO | 0 | 1048 | 1034 | 1197 | 3279 |
| RS | 0 | 0 | 0 | 1363 | 1363 |
| RS-KM | 0 | 0 | 0 | 1559 | 1559 |
| RU | 0 | 1858 | 2223 | 1277 | 5358 |
| SE | 889 | 968 | 956 | 1090 | 3903 |
| SI | 0 | 1032 | 931 | 1166 | 3129 |
| SK | 0 | 1515 | 1223 | 1162 | 3900 |
| UA | 0 | 0 | 1084 | 1298 | 2382 |
| US | 2122 | 1609 | 0 | 0 | 3731 |
| Total | 17,878 | 39,912 | 34,034 | 49,771 | 141,595 |
Note: For country codes see Table A1.

Table A11.
The HAPC models of the importance of work values, only time related variables.
Table A11.
The HAPC models of the importance of work values, only time related variables.
| Good Pay | Job Security | Good Hours | Interesting | Useful | ||||||
|---|---|---|---|---|---|---|---|---|---|---|
| B | SE | B | SE | B | SE | B | SE | |||
| Individual effects | ||||||||||
| Age | −0.0019 *** | (0.000) | 0.0007 *** | (0.000) | −0.0015 *** | (0.000) | −0.0029 *** | (0.000) | 0.0013 *** | (0.000) |
| Age squared | −0.0000 *** | (0.000) | −0.0000 *** | (0.000) | −0.0000 *** | (0.000) | 0.0000 *** | (0.000) | 0.0000 *** | (0.000) |
| Intercept | 0.7949 *** | (0.027) | 0.6685 *** | (0.028) | 0.5238 *** | (0.022) | 0.6580 *** | (0.025) | 0.4275 *** | (0.023) |
| Variance components | ||||||||||
| Individual | 0.1483 *** | (0.000) | 0.2095 *** | (0.000) | 0.2384 *** | (0.000) | 0.2126 *** | (0.000) | 0.2282 *** | (0.000) |
| Period | 0.0018 *** | (0.001) | 0.0019 *** | (0.001) | 0.0008 *** | (0.000) | 0.0018 *** | (0.001) | 0.0004 *** | (0.000) |
| Cohort | 0.0000 *** | (0.000) | 0.0000 *** | (0.000) | 0.0001 *** | (0.000) | 0.0000 *** | (0.000) | 0.0000 *** | (0.000) |
| Country | 0.0119 *** | (0.001) | 0.0129 *** | (0.001) | 0.0113 *** | (0.001) | 0.0069 *** | (0.001) | 0.0184 *** | (0.002) |
| N | 176,083 | 175,712 | 175,523 | 175,631 | 141,595 | |||||
| AIC | 163,885.0 | 224,323.3 | 246,735.8 | 226,737.6 | 192,906.2 |
Note: Standard errors in parentheses. *** p < 0.01.

Table A12.
The HAPC models of the importance of work values, with control variables.
Table A12.
The HAPC models of the importance of work values, with control variables.
| Good Pay | Job Security | Good Hours | Interesting | Useful | ||||||
|---|---|---|---|---|---|---|---|---|---|---|
| B | SE | B | SE | B | SE | B | SE | |||
| Individual effects | ||||||||||
| Age | −0.0022 *** | (0.000) | 0.0002 * | (0.000) | −0.0018 *** | (0.000) | −0.0021 *** | (0.000) | 0.0019 *** | (0.000) |
| Age squared | −0.0000 | (0.000) | −0.0000 | (0.000) | −0.0000 *** | (0.000) | 0.0000 *** | (0.000) | 0.0000 | (0.000) |
| Female | −0.0474 *** | (0.002) | −0.0003 | (0.002) | 0.0506 *** | (0.003) | 0.0005 | (0.002) | 0.0145 *** | (0.003) |
| Education: more than secondary | −0.0340 *** | (0.003) | −0.0863 *** | (0.003) | −0.0525 *** | (0.004) | 0.0806 *** | (0.003) | 0.0597 *** | (0.004) |
| Labor force status (reference: full-time worker) | ||||||||||
| Part-time worker | −0.0432 *** | (0.004) | −0.0482 *** | (0.005) | 0.0514 *** | (0.005) | −0.0185 *** | (0.005) | 0.0125 ** | (0.005) |
| Self-employed | −0.0473 *** | (0.004) | −0.1264 *** | (0.005) | −0.0654 *** | (0.005) | −0.0116 ** | (0.005) | −0.0288 *** | (0.006) |
| Retired | −0.0182 *** | (0.004) | −0.0230 *** | (0.005) | −0.0039 | (0.005) | −0.0244 *** | (0.005) | −0.0138 ** | (0.005) |
| Housewife | −0.0042 | (0.004) | −0.0254 *** | (0.004) | −0.0013 | (0.005) | −0.0362 *** | (0.004) | −0.0380 *** | (0.005) |
| Student | −0.0286 *** | (0.005) | −0.0443 *** | (0.005) | −0.0313 *** | (0.006) | 0.0493 *** | (0.006) | 0.0554 *** | (0.006) |
| Unemployed | −0.0119 *** | (0.004) | −0.0123 *** | (0.004) | −0.0026 | (0.005) | −0.0229 *** | (0.004) | −0.0189 *** | (0.005) |
| Other | −0.0238 *** | (0.007) | −0.0250 *** | (0.008) | −0.0028 | (0.009) | −0.0372 *** | (0.008) | −0.0058 | (0.010) |
| Type of settlement: city | 0.0019 | (0.002) | −0.0297 *** | (0.003) | 0.0028 | (0.003) | 0.0335 *** | (0.003) | −0.0054 * | (0.003) |
| Marital status (reference: single) | ||||||||||
| Married/living with partner | 0.0205 *** | (0.003) | 0.0280 *** | (0.003) | 0.0110 *** | (0.004) | −0.0054 | (0.003) | −0.0001 | (0.004) |
| Divorced/separated/widowed | 0.0247 *** | (0.004) | 0.0192 *** | (0.005) | 0.0096 ** | (0.005) | −0.0160 *** | (0.005) | −0.0093 * | (0.005) |
| Intercept | 0.8262 *** | (0.025) | 0.7046 *** | (0.026) | 0.5217 *** | (0.019) | 0.6644 *** | (0.018) | 0.3964 *** | (0.025) |
| Variance components | ||||||||||
| Individual | 0.1473 *** | (0.000) | 0.2074 *** | (0.000) | 0.2367 *** | (0.000) | 0.2111 *** | (0.000) | 0.2274 *** | (0.000) |
| Period | 0.0014 *** | (0.001) | 0.0014 *** | (0.001) | 0.0003 *** | (0.000) | 0.0006 *** | (0.000) | 0.0005 *** | (0.000) |
| Cohort | 0.0000 *** | (0.000) | 0.0001 *** | (0.000) | 0.0001 *** | (0.000) | 0.0000 *** | (0.000) | 0.0000 *** | (0.000) |
| Country | 0.0117 *** | (0.001) | 0.0121 *** | (0.001) | 0.0113 *** | (0.001) | 0.0066 *** | (0.001) | 0.0194 *** | (0.002) |
| N | 176,083 | 175,712 | 175,523 | 175,631 | 141,595 | |||||
| AIC | 162,748.6 | 222,600.1 | 245,546.4 | 225,539.6 | 192,397.8 | |||||
Note: Standard errors in parentheses. * p < 0.10, ** p < 0.05, *** p < 0.01.
References
- Hajdu, G.; Sik, E. Searching for Gaps: Are Work Values of the Younger Generations Changing? CROME, University of Brighton: Brighton, UK, 2015. [Google Scholar]
- Hajdu, G.; Sik, E. Do people have different views on work by age, period and birth cohort? Int. J. Sociol. 2018, 48. in press. [Google Scholar]
- Yang, Y.; Land, K.C. A Mixed Models Approach to the Age-Period-Cohort Analysis of Repeated Cross-Section Surveys, with an Application to Data on Trends in Verbal Test Scores. Sociol. Methodol. 2006, 36, 75–97. [Google Scholar] [CrossRef]
- Yang, Y.; Land, K.C. Age–Period–Cohort Analysis of Repeated Cross-Section Surveys: Fixed or Random Effects? Sociol. Methods Res. 2008, 36, 297–326. [Google Scholar] [CrossRef]
- Reither, E.N.; Land, K.C.; Jeon, S.Y.; Powers, D.A.; Masters, R.K.; Zheng, H.; Hardy, M.A.; Keyes, K.M.; Fu, Q.; Hanson, H.A.; et al. Clarifying hierarchical age–period–cohort models: A rejoinder to Bell and Jones. Soc. Sci. Med. 2015, 145, 125–128. [Google Scholar] [CrossRef] [PubMed]
- Dose, J.J. Work values: An integrative framework and illustrative application to organizational socialization. J. Occup. Organ. Psychol. 1997, 70, 219–240. [Google Scholar] [CrossRef]
- Wuthnow, R. The Sociological Study of Values. Sociol. Forum 2008, 23, 333–343. [Google Scholar] [CrossRef]
- Jin, J.; Rounds, J. Stability and change in work values: A meta-analysis of longitudinal studies. J. Vocat. Behav. 2012, 80, 326–339. [Google Scholar] [CrossRef]
- Brief, A.P.; Aldag, R.J. The Intrinsic-Extrinsic Dichotomy: Toward Conceptual Clarity. Acad. Manag. Rev. 1977, 2, 496–500. [Google Scholar] [CrossRef]
- Elizur, D. Facets of work values: A structural analysis of work outcomes. J. Appl. Psychol. 1984, 69, 379–389. [Google Scholar] [CrossRef]
- Twenge, J.M. A Review of the Empirical Evidence on Generational Differences in Work Attitudes. J. Bus. Psychol. 2010, 25, 201–210. [Google Scholar] [CrossRef]
- Parboteeah, K.P.; Cullen, J.B.; Paik, Y. National differences in intrinsic and extrinsic work values: The effects of post-industrialization. Int. J. Cross Cult. Manag. 2013, 13, 159–174. [Google Scholar] [CrossRef]
- Gagné, M.; Deci, E.L. Self-determination theory and work motivation. J. Organ. Behav. 2005, 26, 331–362. [Google Scholar] [CrossRef]
- Tolbize, A. Generational Differences in the Workplace; Research and Training Center on Community Living, University of Minnesota: Minneapolis, MN, USA, 2008. [Google Scholar]
- Parry, E.; Urwin, P. Generational Differences in Work Values: A Review of Theory and Evidence. Int. J. Manag. Rev. 2011, 13, 79–96. [Google Scholar] [CrossRef]
- Lyons, S.; Kuron, L. Generational differences in the workplace: A review of the evidence and directions for future research. J. Organ. Behav. 2014, 35, S139–S157. [Google Scholar] [CrossRef]
- Kowske, B.J.; Rasch, R.; Wiley, J. Millennials’ (Lack of) Attitude Problem: An Empirical Examination of Generational Effects on Work Attitudes. J. Bus. Psychol. 2010, 25, 265–279. [Google Scholar] [CrossRef]
- Jurkiewicz, C.L. Generation X and the Public Employee. Public Pers. Manag. 2000, 29, 55–74. [Google Scholar] [CrossRef]
- Lyons, S.; Duxbury, L.; Higgins, C. An empirical assessment of generational differences in work-related values. Hum. Resour. Manag. 2005, 26, 62–71. [Google Scholar]
- Becton, J.B.; Walker, H.J.; Jones-Farmer, A. Generational differences in workplace behavior. J. Appl. Soc. Psychol. 2014, 44, 175–189. [Google Scholar] [CrossRef]
- Harpaz, I.; Fu, X. The Structure of the Meaning of Work: A Relative Stability Amidst Change. Hum. Relat. 2002, 55, 639–667. [Google Scholar] [CrossRef]
- Diepstraten, I.; Ester, P.; Vinken, H. Talkin’ ’bout my generation. Ego and alter images of generations in the Netherlands. Neth. J. Soc. Sci. 1999, 35, 91–109. [Google Scholar]
- Egri, C.P.; Ralston, D.A. Generation Cohorts and Personal Values: A Comparison of China and the United States. Organ. Sci. 2004, 15, 210–220. [Google Scholar] [CrossRef]
- Twenge, J.M.; Campbell, S.M.; Hoffman, B.J.; Lance, C.E. Generational Differences in Work Values: Leisure and Extrinsic Values Increasing, Social and Intrinsic Values Decreasing. J. Manag. 2010, 36, 1117–1142. [Google Scholar] [CrossRef]
- Smola, K.W.; Sutton, C.D. Generational differences: Revisiting generational work values for the new millennium. J. Organ. Behav. 2002, 23, 363–382. [Google Scholar] [CrossRef]
- Twenge, J.M.; Keith, W.; Freeman, E.C. Generational differences in young adults’ life goals, concern for others, and civic orientation, 1966–2009. J. Pers. Soc. Psychol. 2012, 102, 1045–1062. [Google Scholar] [CrossRef] [PubMed]
- Suzuki, E. Time changes, so do people. Soc. Sci. Med. 2012, 75, 452–456. [Google Scholar] [CrossRef] [PubMed]
- Firebaugh, G. Analyzing Repeated Surveys, 1 ed.; SAGE Publications, Inc.: Thousand Oaks, CA, USA, 1997; ISBN 978-0-8039-7398-5. [Google Scholar]
- Schwadel, P. Birth Cohort Changes in the Association between College Education and Religious Non-Affiliation. Soc. Forces 2014, 93, 719–746. [Google Scholar] [CrossRef]
- Down, I.; Wilson, C.J. A rising generation of Europeans? Life-cycle and cohort effects on support for ‘Europe’. Eur. J. Polit. Res. 2013, 52, 431–456. [Google Scholar] [CrossRef]
- Bell, A.; Jones, K. Another “futile quest”? A simulation study of Yang and Land’s Hierarchical Age-Period-Cohort model. Demogr. Res. 2014, 30, 333–360. [Google Scholar] [CrossRef]
- Bell, A.; Jones, K. Don’t birth cohorts matter? A commentary and simulation exercise on Reither, Hauser, and Yang’s (2009) age–period–cohort study of obesity. Soc. Sci. Med. 2014, 101, 176–180. [Google Scholar] [CrossRef] [PubMed]
- Reither, E.N.; Masters, R.K.; Yang, Y.C.; Powers, D.A.; Zheng, H.; Land, K.C. Should age-period-cohort studies return to the methodologies of the 1970s? Soc. Sci. Med. 2015, 128, 356–365. [Google Scholar] [CrossRef] [PubMed]
- Hox, J. Multilevel Analysis: Techniques and Applications; Routledge: New York, NY, USA, 2010. [Google Scholar]
- Gelman, A.; Hill, J. Data Analysis Using Regression and Multilevel/Hierarchical Models; Cambridge University Press: New York, NY, USA, 2007. [Google Scholar]
- Yang, Y.; Land, K.C. Age-Period-Cohort Analysis: New Models, Methods, and Empirical Applications; CRC Press: Boca Raton, FL, USA, 2013. [Google Scholar]
- Stata Corp. Stata Multilevel Reference Manual, Release 13; Stata Press: College Station, TX, USA, 2013. [Google Scholar]
- Den Dulk, L.; Groeneveld, S.; Ollier-Malaterre, A.; Valcour, M. National context in work-life research: A multi-level cross-national analysis of the adoption of workplace work-life arrangements in Europe. Eur. Manag. J. 2013, 31, 478–494. [Google Scholar] [CrossRef]
- Wollack, S.; Goodale, J.G.; Wijting, J.P.; Smith, P.C. Development of the survey of work values. J. Appl. Psychol. 1971, 55, 331–338. [Google Scholar] [CrossRef]
- Ros, M.; Schwartz, S.H.; Surkiss, S. Basic Individual Values, Work Values, and the Meaning of Work. Appl. Psychol. 1999, 48, 49–71. [Google Scholar] [CrossRef]
- Fisher, G.G.; Matthews, R.A.; Gibbons, A.M. Developing and investigating the use of single-item measures in organizational research. J. Occup. Health Psychol. 2016, 21, 3–23. [Google Scholar] [CrossRef] [PubMed]
- Wanous, J.P.; Reichers, A.E.; Hudy, M.J. Overall job satisfaction: How good are single-item measures? J. Appl. Psychol. 1997, 82, 247–252. [Google Scholar] [CrossRef] [PubMed]
- Hoeppner, B.B.; Kelly, J.F.; Urbanoski, K.A.; Slaymaker, V. Comparative Utility of a Single-Item vs. Multiple-Item Measure of Self-Efficacy in Predicting Relapse among Young Adults. J. Subst. Abuse Treat. 2011, 41, 305–312. [Google Scholar] [CrossRef] [PubMed]
- Gardner, D.G.; Cummings, L.L.; Dunham, R.B.; Pierce, J.L. Single-Item versus Multiple-Item Measurement Scales: An Empirical Comparison. Educ. Psychol. Meas. 1998, 58, 898–915. [Google Scholar] [CrossRef]
- Johnson, M.K.; Mortimer, J.T.; Lee, J.C.; Stern, M.J. Judgments About Work: Dimensionality Revisited. Work Occup. 2007, 34, 290–317. [Google Scholar] [CrossRef]
- Lyons, S.T.; Higgins, C.A.; Duxbury, L. Work values: Development of a new three-dimensional structure based on confirmatory smallest space analysis. J. Organ. Behav. 2010, 31, 969–1002. [Google Scholar] [CrossRef]
- De Vaus, D.; McAllister, I. Gender and Work Orientation: Values and Satisfaction in Western Europe. Work Occup. 1991, 18, 72–93. [Google Scholar] [CrossRef]
- Johnson, M.K.; Monserud, M.A. Work value development from adolescence to adulthood. Adv. Life Course Res. 2012, 17, 45–58. [Google Scholar] [CrossRef]
- Lechner, C.M.; Sortheix, F.M.; Göllner, R.; Salmela-Aro, K. The development of work values during the transition to adulthood: A two-country study. J. Vocat. Behav. 2017, 99, 52–65. [Google Scholar] [CrossRef]
- Loscocco, K.A.; Kalleberg, A.L. Age and the Meaning of Work in the United States and Japan. Soc. Forces 1988, 67, 337–356. [Google Scholar] [CrossRef]
- Johnson, M.K. Change in Job Values during the Transition to Adulthood. Work Occup. 2001, 28, 315–345. [Google Scholar] [CrossRef]
- McClelland, K.E. The Social Management of Ambition. Sociol. Q. 1990, 31, 225–251. [Google Scholar] [CrossRef]
- Sheldon, K.M.; Kasser, T. Getting older, getting better? Personal strivings and psychological maturity across the life span. Dev. Psychol. 2001, 37, 491–501. [Google Scholar] [CrossRef] [PubMed]
- Krahn, H.J.; Galambos, N.L. Work values and beliefs of ‘Generation X’ and ‘Generation Y’. J. Youth Stud. 2014, 17, 92–112. [Google Scholar] [CrossRef]
- Marini, M.M.; Fan, P.-L.; Finley, E.; Beutel, A.M. Gender and Job Values. Sociol. Educ. 1996, 69, 49–65. [Google Scholar] [CrossRef]
- Sortheix, F.M.; Chow, A.; Salmela-Aro, K. Work values and the transition to work life: A longitudinal study. J. Vocat. Behav. 2015, 89, 162–171. [Google Scholar] [CrossRef]
- Clark, A.E. Work, Jobs, and Well-Being across the Millennium. In International Differencies in Well-Being; Diener, E., Helliwell, J.F., Kahneman, D., Eds.; Oxford University Press: Oxford, UK, 2010; pp. 436–468. [Google Scholar]
- Costanza, D.P.; Badger, J.M.; Fraser, R.L.; Severt, J.B.; Gade, P.A. Generational Differences in Work-Related Attitudes: A Meta-analysis. J. Bus. Psychol. 2012, 27, 375–394. [Google Scholar] [CrossRef]
| 1 | This paper draws on work [1] conducted for the STYLE project (Strategic Transitions for Youth Labour on Europe) that received funding from the European Union’s Seventh Framework Programme for research, technological development and demonstration under grant agreement No. 613256 (http://www.style-research.eu). |
| 2 | In a separate paper, we raise the same questions with regard to another work value (employment commitment) using ISSP data between 1981 and 2014 from thirty-four countries [2]. |
| 3 | The bibliographical references of the quotation were omitted. |
| 4 | Twenge [11] and Parboteeah et al. [12] emphasize that intrinsic and extrinsic work values do not form the two poles of a continuum; they may compete with each other or may constitute a peacefully coexisting complex system. For example, the same people can follow extrinsically motivated behavior when the task is boring and monotonous but intrinsic motivation becomes dominant during the interesting phases of a task [13]. |
| 5 | The bibliographical references of the quotation were omitted. |
| 6 | It is assumed that the level of sensitivity towards such events is the highest during childhood and adolescence and that their impact remains relatively stable from then on [21]. |
| 7 | For example Twenge et al. [24] refer to baby boomers (“created” by the civil rights and women's movements, the Vietnam War, and the assassinations of John F. Kennedy and Martin Luther King); to GenX (AIDS epidemic, economic uncertainty, and the fall of the Soviet Union); to GenY (being “wired” and “tech savvy”, liking “informality”, learning quickly, and embracing “diversity”). |
| 8 | Hierarchical age-period-cohort regression models have been used to analyze the role of generation (using repeated cross-sectional data) on verbal test scores [3,4], on the changing association between higher education and non-religious affiliation in the United States [29], on support for the European Union [30], and on satisfaction with various job characteristics [17]. |
| 9 | Suzuki [27] shows a data structure where individuals are nested simultaneously within periods and birth cohorts, whereas age is an attribute of individuals rather than a random sample of age categories from a population of age groupings. |
| 10 | For more details see Chapters 7 and 8 of Yang and Lang [36]. |
| 11 | All the surveys included in the database of WVS/EVS are nationally representative surveys using standardized and properly pre-tested questionnaires developed by experts of survey analysis and data management. WVS (2015). World Values Survey 1981–2015 official aggregate v.20150418, 2015. World Values Survey Association (www.worldvaluessurvey.org). Aggregate File Producer: JDSystems, Madrid, and EVS (2011). European Values Study 1981–2008, Longitudinal Data File. GESIS Data Archive, Cologne, Germany, ZA4804 Data File Version 2.0.0 (2011-12-30) doi:10.4232/1.11005. |
| 12 | The five life aspects described above and politics. This way we can correct for scale use differences among the respondents. In the analysis, we do not present the results for importance of politics since—compared to the other life aspects—we think that it is not a core element of everyday life. |
| 13 | |
| 14 | These results are available from authors on request. |
| 15 | The question about the importance of having a job that is useful to society was not asked in 2004–2004, and the other four questions were asked only in nine countries. |
| 16 | The number of observations regarding the importance of having a useful job is somewhat smaller than sample sizes of the other four variables, since questions about the importance of having a job that is useful to society were not asked in some countries in the third wave of the WVS/EVS. Table A9 in the Appendix A contains the number of observations of the importance of good pay by country and period (as reference information regarding the other three variables), whereas Table A10 shows the same information for the importance of having a useful job. |
| 17 | This might reflect the Eastern-European transitions after 1989–1990, when the risk of unemployment was an everyday experience, thus the threat of unemployment made job security more important. When we analyzed the trend of work values on a sample that was split into a post-communist and a non-post-communist segment, our results confirm that the relatively large increase in the importance of security is driven by the post-communist countries [1]. |
© 2018 by the authors. Licensee MDPI, Basel, Switzerland. This article is an open access article distributed under the terms and conditions of the Creative Commons Attribution (CC BY) license (http://creativecommons.org/licenses/by/4.0/).

