1. Introduction
Pakistan has been an active target of terrorism activities in the past several years. This has been labeled by Wikipedia as “a major and highly destructive phenomenon”; in 2009, the annual death toll was 3318 and by 2010, 35,000 locals (Pakistanis) had already been killed [
1]. Antiterrorism activities consumed
$68 billion for the decade 2000–2010 [
2]. Furthermore, there were 3 million IDPs (internally displaced persons) in Pakistan in 2009 due to terrorist activities, of whom 130,000 were residents in camps as of 2010 [
3]. In fact, all major provinces of Pakistan have been affected by terrorism, i.e., Khyber Pakhtunkhwaa, Sindh, Punjab, and Balouchistan. Furthermore, there have been diverse terrorism event types (e.g., target killings and military operations) which have utilized diverse terrorism methods (e.g., suicide bombing and grenade attacks) and targeted diverse types of population (e.g., military and civilians). Consequently, fear has become rampant in Pakistani people, especially in regions of enhanced terrorist activities [
4]. A study conducted on 300 Pakistani students showed that more than 65% of the students had a significant stress level due to terrorism, 27% were witness to an actual terrorist event, and around 70% were restricted by parents in terms of leaving the house after sunset [
5]. Terrorism has also led to frequent hampering of education activities through the early closure of schools [
6].
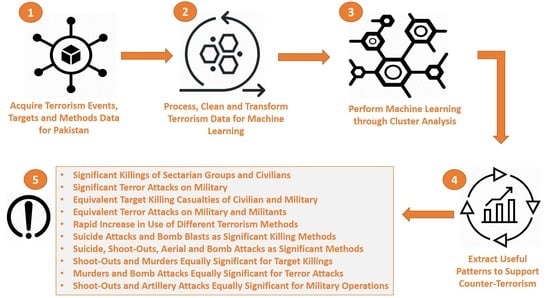
Our research shows that there are three reasons for these problems: (1) Different types of terrorist events have occurred; (2) some of these events have been highly frequent; and (3) an acute dearth of efforts to analyze these events through a data analytics/data science initiative to provide critical and useful data to counterterrorism authorities for arresting criminals and thwarting future attacks. In this paper, we applied data science techniques for the first time to comprehensively analyze Pakistan’s terrorism activities. Data science involves the extraction of potentially useful patterns from a large data set which is hidden and previously unknown [
7]. We extracted patterns which can assist in adopting counterterrorism measures. We acquired our database of terrorism activities in Pakistan from the online South Asian terrorism portal (SATP), for 1988–2012. Our initial data set comprised sixteen attributes. After data reduction and some basic preprocessing steps, we considered the following seven attributes, the first five being categorical and the remaining integer (attribute discretizations are given later on):
Event, or incident, of terrorism,
Year in which the given event occurred,
Province where the event occurred,
Method of terrorism used in the event,
Targeted party in the event,
Frequency of people injured in the event, and
Frequency of casualties.
For cluster analysis, we did some initial experiments with K-means, agglomerative hierarchical, and CLOPE algorithms [
7,
8] and selected CLOPE because: (1) It is resistant to missing values; (2) it is more easily configurable for fine-tuning the number and content of clusters; and (3) it is designed specifically for categorical data. After analyzing the clusters obtained with some sample runs with CLOPE, we formulated the following three goals for our clustering problem:
Goal 1: To acquire and analyze significant (distinct and meaningful) combinations of events and different targets related to these events,
Goal 2: To acquire and analyze significant combinations of events and different methods of attack used in these events, and
Goal 3: To determine and analyze a measure of gauging the intensity of terrorism, based on the number of casualties and injured people.
To acquire Goal 1 and Goal 2, we applied cluster analysis to obtain clusters of Event–Target combinations and Event–Method combinations, respectively. Using the Chi-squared test for independence, we verified that both the method of terrorism and the targeted party were dependent on (co-related with) the given terrorism event. Then, a more significant (or pure) clustering is one which groups together unique combinations in separate clusters. We analyzed the obtained clusters both provincially as well as annually, from 1988 to 2012. To acquire Goal 3, we proposed a statistic for calculating terrorism intensity, based on the number of injured and casualties. We analyzed this statistic, both provincially and annually, and for different types of events, methods, and targets. Our results provided the following generic information for counterterrorism authorities:
Frequency patterns of Event–Target and Event–Method clusters, indicating significant targets and significant usage of different methods, respectively, in each province,
Significantly targeted groups in each province for different types of terrorist events,
Significant terrorism methods used in each province for different events,
Significant pairs of targeted groups for different events,
Significant pairs of terrorism methods for different events,
Significant Event–Method and Event–Target clusters for each province, and
The trends of terrorism intensity associated with different events, methods, and targets.
3. Related Work
In [
9], three data mining techniques to counteract terrorism were identified, i.e., cluster analysis, association rule mining, and prediction. Clustering forms clusters of terrorists, terrorist groups, terrorism activities, or terrorized victims. These can be created based on features like user demographics, traveling habits, and characteristics of terrorism. We can also identify associations between terrorists and their countries of residence, e.g., if some terrorist is resident of country A, then all activity of this terrorist should be monitored. Furthermore, we can employ classification techniques from data science to be used to build predictive models of terrorism, e.g., when the next attack is likely to happen, what a particular terrorist can do next, and the likelihood of an attack on a particular structure. Unusual or anomalous activity patterns can be detected through outlier analysis, e.g., a person who is resident of some foreign country works from 9.30 a.m. until 5.30 p.m. for 3 years, but who, for the last two weeks, occasionally leaves work earlier and visits a firearms shop. Finally, we can use link analysis to detect critical links between terrorists, e.g., communication links through the Internet and telephone.
In [
10], an analysis of terrorism activities in Iraq was presented for 2004–2006. The authors employed GIS (geographic information systems) technology to acquire geospatial clusters. They used hot-spot analysis to detect clusters (groups of areas/cities) comprising above-average terrorism rate (hot-spot), or below-average rate (cold-spot), e.g., Baghdad was a single hot-spot in 2005. The results implied that the clusters of terrorism intensity evolved through the period 2004–2006 at a gradual rate. Additionally, the spread of terrorism at a geographic level was gradual, and terrorists found it difficult to build any substantial base for themselves. In addition to this, in [
11], the authors applied cluster analysis to data pertaining to the 9/11 attack. They grouped individual isolated people into a complete, evolving terrorist network. This evolutionary component is important for antiterrorism authorities to understand the inherent structure of the terrorist network.
In [
12], the authors employed time series forecasting models to predict terrorist events from 1968 to 1986, and also their victimization rates. The results showed that the occurrence was far from random and had a periodicity of around 1 month, but the victimization rate had no constant trend. Moreover, in [
13], the authors highlighted the importance of neural networks in predicting terrorism behavior. A game was designed by criminologists and psychologists to test the effectiveness of different AI technologies/algorithms. The winner was a feed-forward neural network with back propagation and 68% accuracy in classifying deceptive behavior. The conclusion was that such a neural network is a valuable tool to identify terrorists prior to an attack. Moreover, a company called Recorded Future (
www.recordedfuture.com) is using social intelligence techniques to predict terrorist attacks [
14]. RF extracts references to terrorism entities (events, targets, and methods) and predicts the ‘time’ and ‘space’ information for these entities, e.g., when and where a given event will occur. Prediction is done by building statistical models from similar past terrorism entities.
In [
15], the authors implemented a counterterrorism infrastructure called the Terrorism Knowledge Discovery Project, in the context of the “Making the Nation Safer” project. This project acquired, integrated, and interpreted large amounts of terrorist information from many sources, using diverse techniques, such as knowledge-based reasoning, data integration, data science, natural language processing technologies for information extraction and multilingual retrieval, and visualization. The knowledge models proposed by the project facilitate the analysis of terrorism research, dynamically model the behavior of terrorist networks, and provide an effective channel of communication with terrorized victims. In addition to this, a very useful collection of counterterrorism research work is that by [
16], which is organized into four areas.
The first area involves efforts to mine critical subsets of big and unstructured terrorism data. The second area focuses on using natural language processing to extract critical data from digitized documents of terrorism available in various languages. The third area analyzes terrorist networks and conveys novel methods of mining hidden graph structures and profiles of enemy’s plans. Finally, the fourth area describes software systems to simulate and predict effects of real-world conflicts.
There have been substantial research efforts in the USA to support counterterrorism activities in the post-9/11 era. Primarily, the focus has been on link analysis. The National Security Agency (NSA) has applied social network analysis on telephone communication network logs to mine the call data of terrorists [
17]. Outputs include the identification of suspected terrorists with a substantial personal call network, identification of terrorists who are connecting points (junctions) between one or more call networks, and identification of terrorists who are “close” or similar to a major base of other terrorists. Furthermore, the Data Sphere software by the National Counterterrorism Center (NCTC) detects terrorism patterns through link analysis based on actions and events and is useful for the detection of under-development terrorist attacks [
18]. The Intelligence Advanced Research Projects Activity (IARPA) is focusing on integrating terrorism data from diverse sources to detect suspicious activities [
18].
The Counterterrorism Research Lab in Denmark has also focused on link analysis and its related domains. The Crime Fighter counterterrorism toolbox [
19] extracts critical knowledge about the organization of terrorist networks, along with novel link analysis technologies [
20] for terrorist networks. The network of terrorists related to the Denmark terror plan of 2010 was also analyzed, revealing some novel trends of terrorism behavior. Related to these works is the SimBlast software, which models suicide bombing situations [
21]. Given a parametric set, SimBlast simulates the relevant suicide bombing scenario while predicting the damages, e.g., the amount of damage to a building and the number of mortalities.
Notwithstanding these works, many research authors have expressed their reservations regarding the usage of data science to support counterterrorism activities [
22,
23,
24,
25]. For instance, there is disagreement on using the personal information of the common population for analysis, as well as relying on the accuracy of the predictions for predicting terrorism because all the required information is not being used (or is not available) to make a better prediction. However, data science continues to flourish in counterterrorism [
26]. The data available for counterterrorism analysis have also been supplemented by the US government [
27]. Additionally, the aim of data science is not to determine the “ideal set of predictors” [
28]. Rather, it is to focus on the output and try to make it as better as possible through trial-and-error over different parameters and approaches. Even if a prediction is only 60% accurate, it
is based on historical data and provides a 60% chance of stopping the next terrorist attack.
In comparison to the related work, the primary motivation of our work was to provide useful knowledge to counterterrorism authorities. We have focused on cluster analysis to extract similar combinations of terrorism events and terrorism targets, and combinations of terrorism events and terrorism methods. We also estimated the intensity of terrorism based on the number of past casualties. In acquiring our data and doing our work, we have not compromised the privacy of any individual or organization.
4. Terrorism Data Preprocessing
We employed the online database of Pakistani terrorist events provided by the South Asian Terrorism Portal [
29]. It documents events from 1988–2012.We cross-checked SATP entries through the Wikipedia database [
1]. It is pertinent to mention that SATP and Wikipedia are global databases available online and cannot be considered to provide official data as recorded by the counterterrorism authorities of Pakistan. Therefore, the results and recommendations provided by us in this paper should not be considered as universal truths.
The total number of events was 1887 from 1988 until February 2012. Through their textual descriptions, we extracted 16 attributes to store these events, which are shown in
Table 1 (the labels of these attributes are self-explanatory). A manual inspection revealed that several attributes contained a substantial amount of missing values. In fact, a missing value rate of 1–5% is trivial, a rate of 5–15% is handled through more sophisticated methods, such as linear interpolation, and a rate of more than 15% is critical and could impact the analysis severely [
30]. The missing value statistics for our data set are shown in
Table 2.
Here,
Attribute represents the attribute label and
MissVal denotes the percentage of missing values. The number of discretized values of each attribute is shown in column
DisCount (the exact values will be detailed later on). It is a fact in statistics that there is no standard way to deal with missing data. As a general rule and from our experience, missing values greater than 50% can be dropped from the data. We see that five attributes have
MissVal >50%. Firstly, it was important to impute Casualty Count (
MissVal = 12%) and Injured Count (
MissVal = 25%) because we used them to compute an estimate of terrorism intensity (see
Section 5.3). Numerical missing values can be imputed with different measures, such as mean and median, or through linear interpolation. We used the package ‘Mice’ (multivariate imputation by chained equations) in the R statistical language (
https://cran.r-project.org/web/packages/mice/index.html), which can effectively impute numerical missing data with even more than 50% missing values. Mice estimates a data distribution for each column and uses it to impute the missing values for that column. We used the “predictive mean matching” method for imputation with 50 iterations. We inspected the distribution of the original (non-imputed) and imputed data and confirmed there was no major change in the original distribution due to imputation. Note that for Injury Count, we did not impute those rows in which no injury was recorded, or it was mentioned that the frequency of injuries is unknown. There were 198 such events.
Let us discuss the five attributes with MissVal >50%, which are all categorical. We decided not to impute any of these attributes due to the sensitive nature of our data. For instance, if we impute Suspect Category by its mode value ‘Sectarian Group’, it would imply that 47% of events are suspected to be sectarian attacks, which will be false information. We also avoided replacing the missing values with “Unknown” as the keyword, as it would make the cluster analysis heavily biased towards itself due to its larger frequency. We also ignored Casualty Type Category for this reason. We ignored Terrorism Event Detail as it contains the actual raw event description of each event and is not useful for our analysis. We ignored the Time attribute as it has almost 100% missing values and ignored Responsibility Claimed due to the highly sensitive nature of such analyses for publication of research. It was possible to impute the small percentage of missing values associated with Terrorism Event (MissVal = 0.4%), Terrorism Method (MissVal = 0.2%) and Terrorism Target (MissVal = 0.2%). We refrained from this, as these percentages are small and our clustering algorithm (CLOPE) catered for missing values. Hence, our final processed attribute set is: {Date, City, Province, Terrorism Target, Terrorism Event, Casualty Count, Terrorism Method, and Injured Count}.
We identified and applied several data mining techniques on the reduced data set. In this paper, we focused only on cluster analysis, for which we derived our primary motivation through the paper by [
10], although our clustering methodology was completely different. We initially performed some trial runs with three clustering algorithms: K-means, agglomerative hierarchical clustering (AH), and CLOPE, through the Rapid Miner tool (
http://rapid-i.com/). K-Means and AH are standardized, well-known algorithms with applications in diverse global industries [
7]. K-Means groups a row into a cluster CL if it is ‘near’ or similar to the center (centroid) of CL, with respect to a distance function. It creates a total of K clusters and represents each cluster with its centroid (mean) value. AH outputs a complete hierarchy of clusters; at the level of leaves, each instance is in its separate cluster. At each subsequent upper level, AH starts to group individual instances within clusters based on similarity. At the root level, all the instances are within one large cluster. The CLOPE algorithm is specific to string (categorical) attributes; it estimates similarity between string values of two given instances (we describe this in
Section 4.1).
We evaluated these algorithms on three performance measures: Effort required in data preprocessing, ease of cluster interpretation, and clustering time. The results are shown in
Table 3. K-Means and AH require more preprocessing effort than CLOPE and their results are also more difficult to interpret. Primarily, this is because they require transforming string variables into numerical types, e.g., through one-hot encoding. For instance, a column with values “target killing”, “terror attack”, and “military operation” might be converted to three binary columns with
target killing = 001,
terror attack = 010, and
military operation = 011. Such an encoding will give us uninterpretable clustering results for the Event–Target or Event–Method combinations because the original string values are lost (the data has changed). In this case, K-Means and AH will output the centroid vector; if the value of Event attribute in the centroid is 1.43, then this cannot be interpreted to mean target killing, terror attack, or military operation, or something as an average of these (which does not make sense). We note that this behavior will occur even with density and spectral clustering approaches [
7]. These issues have been highlighted in a book by [
31]. Furthermore, the ideal number of clusters is not known in advance in both K-Means and AH. A comprehensive trial-and-error activity needs to be conducted while monitoring several parameters, e.g., the intracluster and intercluster distances. By contrast, CLOPE automatically determines the ideal number of clusters. CLOPE also has only one parameter (repulsion), which is easy to fine-tune to acquire clusters of reasonable (analyzable) sizes. Moreover, K-means and AH do not cluster in the presence of missing values, while CLOPE is resistant to missing values and designed specifically for categorical data. We have already mentioned that there are missing values in our attributes of interest (Terrorism Event, Terrorism Target, Terrorism Method), as seen in
Table 2.
To compare clustering time, we divided our reduced attribute data set into four subsets containing 300, 700, 1200, and 1600 events, respectively (selected randomly). We arbitrarily selected five different parametric configurations for each algorithm. For each data subset, we applied these configurations and calculated the average time taken to put out clusters. The results are shown in
Figure 2, which shows that CLOPE takes the minimum time for each data subset, followed by K-means and AH.
We initially conducted a few sample runs with CLOPE and analyzed the clusters. We concluded that interpreting clusters could become simpler with lesser attribute discretizations. We hence ignored the City attribute (144 discretizations) and considered only the province for a given event. We also grouped the events annually; we considered the years 1988–2001 together because of a small number of events in this time period, and we took each Date discretization as a categorical value (this was for data handling convenience; in our analysis, we considered Date as ordered and presented individual results for each separate time period). We did not change the discretizations for Casualty Count and Injured Count, whose values ranged between 0 and 200, approximately. The final set of attributes and their discretizations are shown in
Table 4.
For Terrorism Target, ‘Military’ implies either the Pakistan Air Force, or Pakistan Army or Pakistan Navy, whereas ‘Militant’ indicates those anonymous militant groups which are waging war within Pakistan. ‘Foreigner’ and ‘Civilian’ refer to international and local people, respectively, while ‘Criminal’ refers to local criminals. Additionally, ‘Aerial Attack’ implies all types of aerial attacks, for instance, drone attacks, while ‘Artillery Attack’ includes all attacks using artillery, for instance, those done through heavy armored vehicles and tanks. Moreover, ‘Shelling’ represents attacks through mortars, rocket launchers, and grenades, while ‘Shootout’ represents a type of gun battle. The remaining labels are self-explanatory.
The sample run also showed that a
meaningful clustering is associated with grouping similar attribute combinations in the same cluster. These combinations are: (1) Terrorism Event and Terrorism Target; and (2) Terrorism Event and Terrorism Method. Such a clustering is meaningful only if the attributes in combination are dependent, i.e., different targeted groups and terrorism methods are associated with different types of events. To verify this, we performed a Chi-squared (χ
2) test of independence [
7]. For Event–Method, the null hypothesis is that the type of terrorism method being employed is independent of the terrorist event. For Event–Target, the null hypothesis is that the type of group being targeted is independent of the event. We used SPSS to perform the test and set the level of significance (α) to 5%. Our results are shown in
Table 5. Here, χ
2 represents the value of the chi-squared statistic, DF represents the degree of freedom, and
p-value is the test’s
p-value (2-tailed). For the Event–Method combination, the χ
2 value for 21 degrees of freedom is 32.67 (from the Chi-Squared table). As
p-value < 0.05 and 3117 > 46.80, the null hypothesis stands rejected. In a similar way, the Event–Target combination is also significant at 5% level. We hence accept the alternate hypothesis that both the method of terrorism and the targeted party in a terrorism event are dependent on the event and are potential candidates for our clustering task.
For comparison, we tested the Target–Method combination and found it to also be significant at 5% level. In other words, the targeted party is significantly related to the type of method being used. In this paper, we focused on Event–Method and Event–Target clustering, as it makes more sense to analyze methods and targets with respect to events. To further facilitate interpretation, we analyzed the Event–Method and Event–Target clusters along two dimensions, i.e., annually and provincially. We plan to make Target–Method clustering analysis a focus of another paper. We also tested Province–Method, Province–Target, and Province–Event combinations. For all these tests, we obtained a
p-value much greater than 0.05, i.e., we accepted the null hypothesis for all cases to prove that these combinations are not significant for clustering. Generally speaking, it is not possible to statistically prove the dependence of the occurrence of a given event in a province, or the use of a terrorism method in a province, or type of target in provinces. We did not test combinations with the Date attribute as it does not have String type, and we are presenting all the date-based analysis of our clusters in
Section 5.
Description of CLOPE
In this section, we describe the CLOPE algorithm. CLOPE clusters instances that contain similar values for categorical attributes. For the sake of clarity, we considered three attributes: Province, City, and Terrorism Event. Suppose we have the following five instances in order (Province, City, Terrorism Event):
- (1)
(KP, Peshawar),
- (2)
(KP, Peshawar, Target Killing),
- (3)
(KP, Peshawar, Terror Attack),
- (4)
(SIN, Target Killing),
- (5)
(SIN, Karachi, Terror Attack).
We use P = Peshawar, K = Karachi, TA = Terror Attack, TK = Target Killing and compare the following:
- (1)
Clustering 1: (KP,P), (KP,P, TK), (KP,P, TA)
- (2)
Clustering 2: (KP,P), (SIN,TK), (SIN,K,TA), and
- (3)
Clustering 3: (KP,P), (KP,P,TA), (SIN,K,TA)
For every clustering, we count frequency of distinct values to estimate the height (H) and width (W) of a histogram. For example, cluster (KP,P), (KP,P,TK), (KP,P,TA) has frequencies KP:3, P:3, TK:1, TA:1. Then, W is total number of distinct values, i.e., 4 and H is given by
, i.e., H = 2.
Figure 3 shows the height and width of each clustering.
We compare Clustering 2 and 3 (C2 and C3). Both of them have a width of 5. Assume that ‘S’ is the total number of blocks. C2 has a height of 1.2 (5 distinct items in 6 blocks), while C3 has a height of 1.6 (5 distinct items in 8 blocks). The reason of a larger height is the larger number of
overlappings in C3 (for KP, P, and TA), compared to a single overlapping for C2. For CLOPE, C3 is hence better than C2. Similarly, C1 is the best clustering due to its larger overlap than C3. If two clusterings have exactly the same heights, we use gradient
as criteria for clustering. Generally, the
Profit (usefulness) of a series of clusterings
C {(
C1), (
C2),
… (
Ck)} is given by Equation (1):
Here,
G(
Ci) is the gradient,
S(
Ci) and
W(
Ci) are number of blocks and width of
Ci, respectively, while |
Ci| represents the total attribute values in
Ci. Thus,
Profit(C1) = 0.75,
Profit(C2) = 0.5, and
Profit(C3) = 0.6. The profit function is normalized with respect to the repulsion parameter, shown in Equation (2), which controls the extent of similarity of instances within clusters; a low value of r will increase the intracluster similarity:
In short, CLOPE increases the within-cluster overlapping of instances by increasing the height-to-width ratio of the histogram, and the repulsion parameter controls the “tightness” of a given clustering. Varying this parameter generates a different number of clusters automatically, which are satisfying the overlapping condition. In this way, to use CLOPE, we need to determine the best value of the repulsion through some trial-and-error experiments and do not need to worry about determining the ideal number of clusters.
5. Results and Discussion
In this section, we present our Event–Target and Event–Method clustering results and our analysis of the terrorism intensity values. We set repulsion r = 0.995, for which we were able to obtain the largest number of clusters and, consequently, the largest frequency of different Event–Target and Event–Method combinations. We abbreviated provinces Khyber Pakhtunkhwaa, Balouchistan, Sindh, and Punjab as KP, BAL, SIN, and PUN respectively. To evaluate the quality of CLOPE’s clustering outputs, we used four parameters: (1) Mean element similarity (MES); (2) mean cluster distance (MeanCD); (3) minimum cluster distance (MinCD); and (4) maximum cluster distance (MaxCD). Our motivation for using these parameters to evaluate CLOPE output was derived from a CLOPE experiment done in the paper by [
32]. MES indicates how many of similar Event–Target or Event–Method combinations form a cluster, while MeanCD, Min CD, and MaxCD represent the average, minimum, and maximum distance between the obtained clusters obtained. The values of these parameters are shown in
Table 6 and
Table 7, for Event–Target and Event–Method combinations, respectively (both collectively and provincially).
The MES values in
Table 6 and
Table 7 range between 64% and 82%, which we consider fairly stable with respect to the optimum MES range of 70–90%. Province-wise, the lowest MES was obtained for BAL (<70%) while the best was obtained for KP (>80%) for both Event–Target and Event–Method. There were no upper bounds for MeanCD, MinCD, and MaxCD. However, an upper bound of several thousand for both MaxCD and MinCD is considered a poor clustering performance in typical experiments [
31,
32]. In both
Table 6 and
Table 7, MinCD values are all low (below 10) and can be considered optimal; it is generally not common to obtain large MinCD values. Barring KP, the results for MaxCD values are more satisfactory, as all values lie below 1000. The worst performance was obtained for KP for both Event–Target (1276) and Event–Method (1185) clusterings, which had a similar effect on the corresponding MeanCD values. Barring KP, the MeanCD values in both
Table 6 and
Table 7 can be considered to be optimal. It is apparent that clusters obtained for KP are more “spread out” compared to all SIN, BAL, PUN, and Pakistan clusters. We conjecture that this is due to the diversity and large frequency of terrorism dynamics which have occurred in KP (detailed in results below). In addition, we also computed the
silhouette score of the obtained clustering outputs in
Table 6 and
Table 7. This is a state-of-the-art performance measure and is calculated using the mean intracluster distance (
icd) and the mean nearest-cluster distance (
ncd). Here,
ncd is the mean distance between a row and the nearest cluster which contains attribute values which are most different from the current row, while
icd is the mean distance between clusters. Thus, silhouette indicates the similarity of a row to its own cluster compared to other clusters. It ranges from −1 (worst) to 1 (good) and is computed as
ncd-icd/max(icd,ncd). In
Table 6, the best silhouette is obtained for KP (0.54) and worst for countrywide clustering (−0.15). In
Table 7, the corresponding values are for KP (0.78) and SIN (−0.05). Our analysis of all performance measure in
Table 6 and
Table 7 does not allow us to claim that we have perfect clusters; however, we can claim that our clustering outputs are within standard bounds of each parameter to a large degree, barring a few cases which also cannot be considered extreme.
5.1. Annual Analysis of Event–Target Clusters
Initially, we analyzed the frequency of clusters obtained annually for each province (shown in
Figure 4), which is representative of the frequency of unique Event–Target combinations. In
Figure 4, the height of a bar depicts the number of Event–Target clusters (combinations) for the given year on the x-axis, and the absence of a bar indicates that no event was recorded for the corresponding time period. The larger the height, the more significant that result is (due to more overlapping). We also showed trend lines for each province (polynomials of degree 4 and abbreviated as TL). From 1988–2005, the frequency of these combinations was low in each province; CLOPE generated only one cluster for BAL and KP for 2002–2003 and for 2005. For KP, a single cluster was obtained each year for the time period 1988–2004 while PUN had two clusters for the same period. Additionally, SIN generated a single cluster in 2004–2005, and four clusters in 2002 because different groups were targeted in this time period (political, military, civilian, sectarian, and foreigner).
The Event–Target combinations increased in the post-2005 era. BAL generated 5 clusters in 2006–2007 and 2011–2012. KP generated 12 clusters in 2007, while it only had 3 clusters in 2004. KP also generated 10 clusters for 2008 and 2010–2011. KP generated 5 (lesser) clusters for only a 2-month period in 2012. Furthermore, PUN generated 4 clusters in 2007 and 2009, and 2 in the 2010–2011 period, while SIN generated a single cluster for 2007–2008 and 2012 and a larger number of clusters (6) in only 2011. We see that post-2006, KP generated a substantial increase in Event–Target combinations, followed (in order) by BAL, PUN, and SIN. This happened due to an increased number of events comprising a variety of Event–Target combinations. The important conclusion is that for each province, 2006–2012 witnessed a substantial increase in the frequency of targeted groups. KP witnessed an increased frequency of terrorism events post-2006 compared to other provinces. Years 2006–2008 and 2011 were significant (target-intensive) for BAL and 2007 and 2009 were significant for PUN, while 2002 and 2011 were significant for SIN.
5.1.1. Analysis of Event–Target Clusters Across Different Event Types
We then analyzed the frequency of Event–Target clusters across individual event types. The results for Target Killing, Terror Attack, and Military Operation are shown in
Figure 5,
Figure 6 and
Figure 7, respectively.
In
Figure 5, we see that the target killing of militants did not occur in any province. In BAL, ethnic, sectarian, and military target killings were more significant compared to other target killing types, while in KP and PUN, sectarian target killing was most significant. In SIN, the target killing of civilians was most significant. In all provinces, criminal, militant, and ethnic target killings were not very significant. Finally, target killing at ethnic level was significant only in BAL, while the target killing of criminals was significant only in PUN. Regarding terror attacks, we see in
Figure 6 that terror attacks on political figures and criminals were not significant in any province. In BAL, military terror attacks were most significant, and in KP, militant terror attacks were most significant. In PUN, military and sectarian terror attacks were most significant and in SIN, civilian and military terror attacks were most significant. Moreover, terror attacks on the military were significant in all provinces. We see that KP is representative of terror attacks; foreigner, militant, and ethnic attacks did not occur in any other province. Regarding military operation, we see from
Figure 7 that military operations on militants were most significant in BAL, while militant-based military operations were most significant in KP. In PUN, only military operations on sectarian groups were significant, while in SIN, only military operations on militants were significant. Moreover, in all provinces, militant-based military operations were more significant compared to operations on other targets. Our overall conclusion from the aforementioned analysis is that terrorism event types were most significant in the province of KP and least representative in SIN.
5.1.2. Analysis of Event–Target Clusters Separately for each Province
We then analyzed the frequency of Event–Target clusters separately for each province (BAL, KP, PUN, SIN). We show the results in
Figure 8 and
Figure 9, where MO denotes Military Operation, TK denotes Target Killing, and TA denotes Terror Attack. A bar with a light gray color denotes a separate cluster and two consecutive bars of dark grey color represent one cluster. Civilian target killings were most significant in BAL and SIN, while military operation on militants and sectarian target killings were most significant in KP and PUN, respectively; the cluster of KP contained approximately 700 instances. In BAL, target killings of military and foreigners were clustered together, and terror attacks on ethnic and civilians also formed a cluster. In KP, terror attacks on militants and civilians formed a cluster, along with ethnic and militant target killings. In PUN, military operation and terror attacks on militants were clustered together, while in SIN, foreigner and political target killings, military target killings and terror attacks, and criminal and sectarian terror attacks were clustered together. Less significant clustering was obtained for ethnic and sectarian target killings in BAL and SIN, and for civilian target killings in KP and PUN, respectively. One major result we see here again is that the target killing of civilians was significant in three provinces. Another result is that counterterrorism authorities were active in KP against the war on terror, with excessive targeting of militants in military operations, target killings and terror attacks. Additionally, sectarian target killings needed to be controlled and curbed in PUN.
5.2. Annual Analysis of Event–Method Clusters
We adopted a similar pattern for Event–Method analysis as for Event–Target. We initially analyzed the frequency of clusters obtained annually for each province (shown in
Figure 10), which is representative of the frequency of unique Event–Method combinations. The larger the height of a bar in
Figure 10, the more significant that result is (due to more overlapping). We also show the trend lines for each province (polynomials of degree 4 and abbreviated as TL). Similar to the Event–Method analysis, the frequency of combinations increased rapidly in the post-2006 era. In BAL, the frequency increased from 2002 onwards, indicating the use of more diverse killing methods. In KP, the Event–Method combinations increased remarkably in the time period 2004–2010, while in PUN, the frequency increased in 1988–2003 and 2006–2011. In SIN, the Event–Method combinations increased in frequency in 1988–2004 and 2007–2011 and decreased in 2004–2007.
Figure 10 shows the critical situation in KP; terrorists were applying different terrorism methods with a high frequency, which can potentially lead to more killings. A similar, yet less critical trend, can be seen for other provinces also.
5.2.1. Analysis of Event–Method Clusters Across Different Event Types
Similar to our approach in
Section 5.1.1, we analyzed the frequency of Event–Method clusters across individual event types. The results for Target Killing, Terror Attack, and Military Operation are shown in
Figure 11,
Figure 12 and
Figure 13, respectively. We see from
Figure 11 that artillery attacks were only conducted in KP and aerial attacks were not employed for target killing in any province. Additionally, bomb blasts were the most significant terrorism usage methods in BAL, suicide attacks and bomb blasts were most significant in KP, suicide attacks in PUN, and bomb blasts in SIN. From
Figure 12, we see that the most significant methods of terror attacks in BAL were shootouts and murders only. Importantly, all attack methods were significant in KP; suicide attacks, shootouts, aerial attacks, and bomb blasts were most significant, followed by shelling, murders, and artillery attacks. Moreover, murdering was a significant terror attack method in PUN and there was no significant attack method associated with SIN. Finally, from
Figure 13, we see that the most significant attack method in military operations in BAL were only shootouts and murders. Aerial attacks were the most significant attack methods in KP (due to the largely mountainous terrain). Less significant ones included murders, shootouts, artillery attacks, bomb blasts, and shelling. Additionally, only artillery attacks were significant in PUN, while no method was significant in SIN. Along with this, in each province, suicide attacks were not carried out in parallel with military operations. Our overall result is that, in all provinces, significant methods for target killing were suicide attacks, bomb blasts, shootouts, and murders (in this order). Regarding terror attacks and military operations, KP saw intense counterterrorism activity using almost all types of attack methods, while shootouts and murders were significant in BAL and PUN.
5.2.2. Analysis of Event–Method Clusters Separately for each Province
Similar to
Section 5.1.2, we analyzed the frequency of Event–Method clusters separately for each province (BAL, KP, PUN, SIN). We show the results in
Figure 14 and
Figure 15 (MO = Military Operation, TK = Target Killing, TA = Terror Attack). A bar with a light gray color denotes a separate cluster and two consecutive bars of dark grey color represent one cluster. We see that the more significant methods of target killing in BAL were shootouts, bomb blasts, and murders (in this order). Murder activity was significant in both target killing and terror attacks, while bomb blasts and suicide attacks were collectively significant in target killing. Shootouts and murders were collectively significant in military operations. Furthermore, murdering and aerial attacks in military operations were most significant in KP. Shootouts and murders were significant in military operations, while murders and aerial attacks (in this order) were significant in terror attacks, but to a lesser degree compared to military operations. Suicide attacks, murders, and bomb blasts were significant target killing methods, but to a lesser degree compared to terror attacks. Finally, bomb blasts, artillery attacks, and shelling were collectively significant methods for terror attacks and military operations. In addition, shootouts, murders, bomb blasts, and suicide attacks (in this order) were significant in PUN for target killing, while clusters for terror attacks and military operations were significant to a lesser degree. Finally, suicide attacks, shootouts, bomb blasts, and murders (in this order) were significant in SIN for target killing.
5.3. Terrorism Intensity Statistic
In this section, we propose and analyze a terrorism intensity statistic (TIS), which is based on the combination of the number of casualties and injured people. As before, we analyzed TIS province-wise both collectively and individually, along with an annual analysis effectively from 1988 to 2012. This analysis was also done for each type of terrorism event. We initially formulated TIS as Equation (3):
where
TISy represents the TIS value for year
y,
Casualtyy and
Injuredy represent the number of casualties and injured people in
y, while #
Eventsy denotes the number of terrorism events which occurred in
y. This equation is basically a ratio assessing the human loss with respect to the frequency of events, for a given year. It is very similar to the TIS proposed in Siebeneck et al. (2009). In some description of terrorism events, it was documented that ‘many’ people were killed or injured; the exact count was not mentioned. To solve this problem, we estimated the mean of the standard normal distribution for
Casualty and
Injured separately (after imputation of their missing values in
Section 4), which were 30 and 18, respectively. We considered it safe to use these values as a lower bound for events using the word “many”. The distributions of terrorism events with respect to Casualty Count and Injury Count (after imputation of missing values) are shown in
Figure 16. Here, the x-axis represents bins of Casualty Count (left) and Injury Count (right); for instance, there were 483 terrorism events in which between 0 and 20 casualties occurred, and 371 events with 0-20 injuries. Most frequent casualties and injuries per event were between 0 and 20. There were only 14 events in which more than 100 people were killed; however, there were 184 events in which more than 100 people were injured. Except the 100+ bin, the distribution of terrorism events with respect to Casualty Count and Injury Count is balanced.
5.3.1. Province-Wise Analysis of TIS Values
The TIS values for the four provinces from 1988 to 2012 are illustrated in
Figure 17. Here, PUN has the highest TIS (64), followed by SIN (38), while KP and BAL have the same TIS value (23). We note that the total number of events in these four provinces was 81, 92, 1515, and 167, respectively. Thus, TIS in PUN and SIN is high because the number of casualties and injured are considerably larger compared to the number of events. Therefore, although terrorism events in PUN and SIN were infrequent compared to KP, these events were more intensive due to a larger number of casualties. To acquire more details, we calculated the province-wise TIS values, separately for Target Killing, Terror Attack, and Military Operation. Our results are in
Figure 18, which we enlist as follows:
For both target killings and terror attacks, PUN had the highest TIS value, followed by SIN, KP, and BAL.
For military operations, PUN had the highest TIS, followed by KP, BAL, and SIN.
Military operations in PUN had the highest TIS, caused by two military operations which occurred in 2007, in which the number of casualties and injured was around 150.
Target killings in PUN had the second highest TIS, caused by several incidents of target killing with casualties reaching up to 100, and injured reaching up to 200.
Target killings in SIN incurred the next highest TIS, with the number of casualties in several events reaching up to 60 and injured up to 200.
The TIS values for each event type were almost similar for both KP and BAL.
5.3.2. Annual Analysis of TIS values
The TIS values from 2001 to 2012 are shown in
Figure 19. In this figure, 2001 represents the label 1988–2001, and 2012 represents data for the first two months of 2012. There was a decrease in terrorism intensity in 2002, but this increased steeply in 2002–2005. This trend was caused by several events with a comparatively large number of casualties and injured people from 2002 to 2005; these events occurred in PUN, SIN, and KP (in decreasing order of frequency). The 2005–2007 era witnessed a decrease in terrorism intensity due to increased counterterrorism activities. These measures were mostly coordinated by the Pakistan army, under the then-President Pervez Musharraf (who had a military background).
When Musharraf resigned in 2008, counterterrorism measures were left unchecked, leading to an increase in intensity from 2007–2009. However, the measures improved in the next three years, leading to reduced intensity until 2012. To drill down on these trends, we obtained the annual TIS values separately for target killing, terror attack, and military operation for 2001–2012, shown in
Figure 20. The target killing intensities increased considerably in 2004 and 2009, while the highest intensity for terror attacks and military operations occurred in 2008 and 2006, respectively. Target killings have the highest average intensity (~42), followed by terror attacks (~37) and military operations (~27). Target killings and terror attacks have generated more intense terrorism activity compared to military operations (which were lesser in frequency due to their larger resource requirements). Note that no military operations were conducted in 2004.


