Prediction and Experimental of Yield Strengths of As-Quenched 7050 Aluminum Alloy Thick Plates after Continuous Quench Cooling

Abstract
:1. Introduction
2. Experiments
2.1. Materials
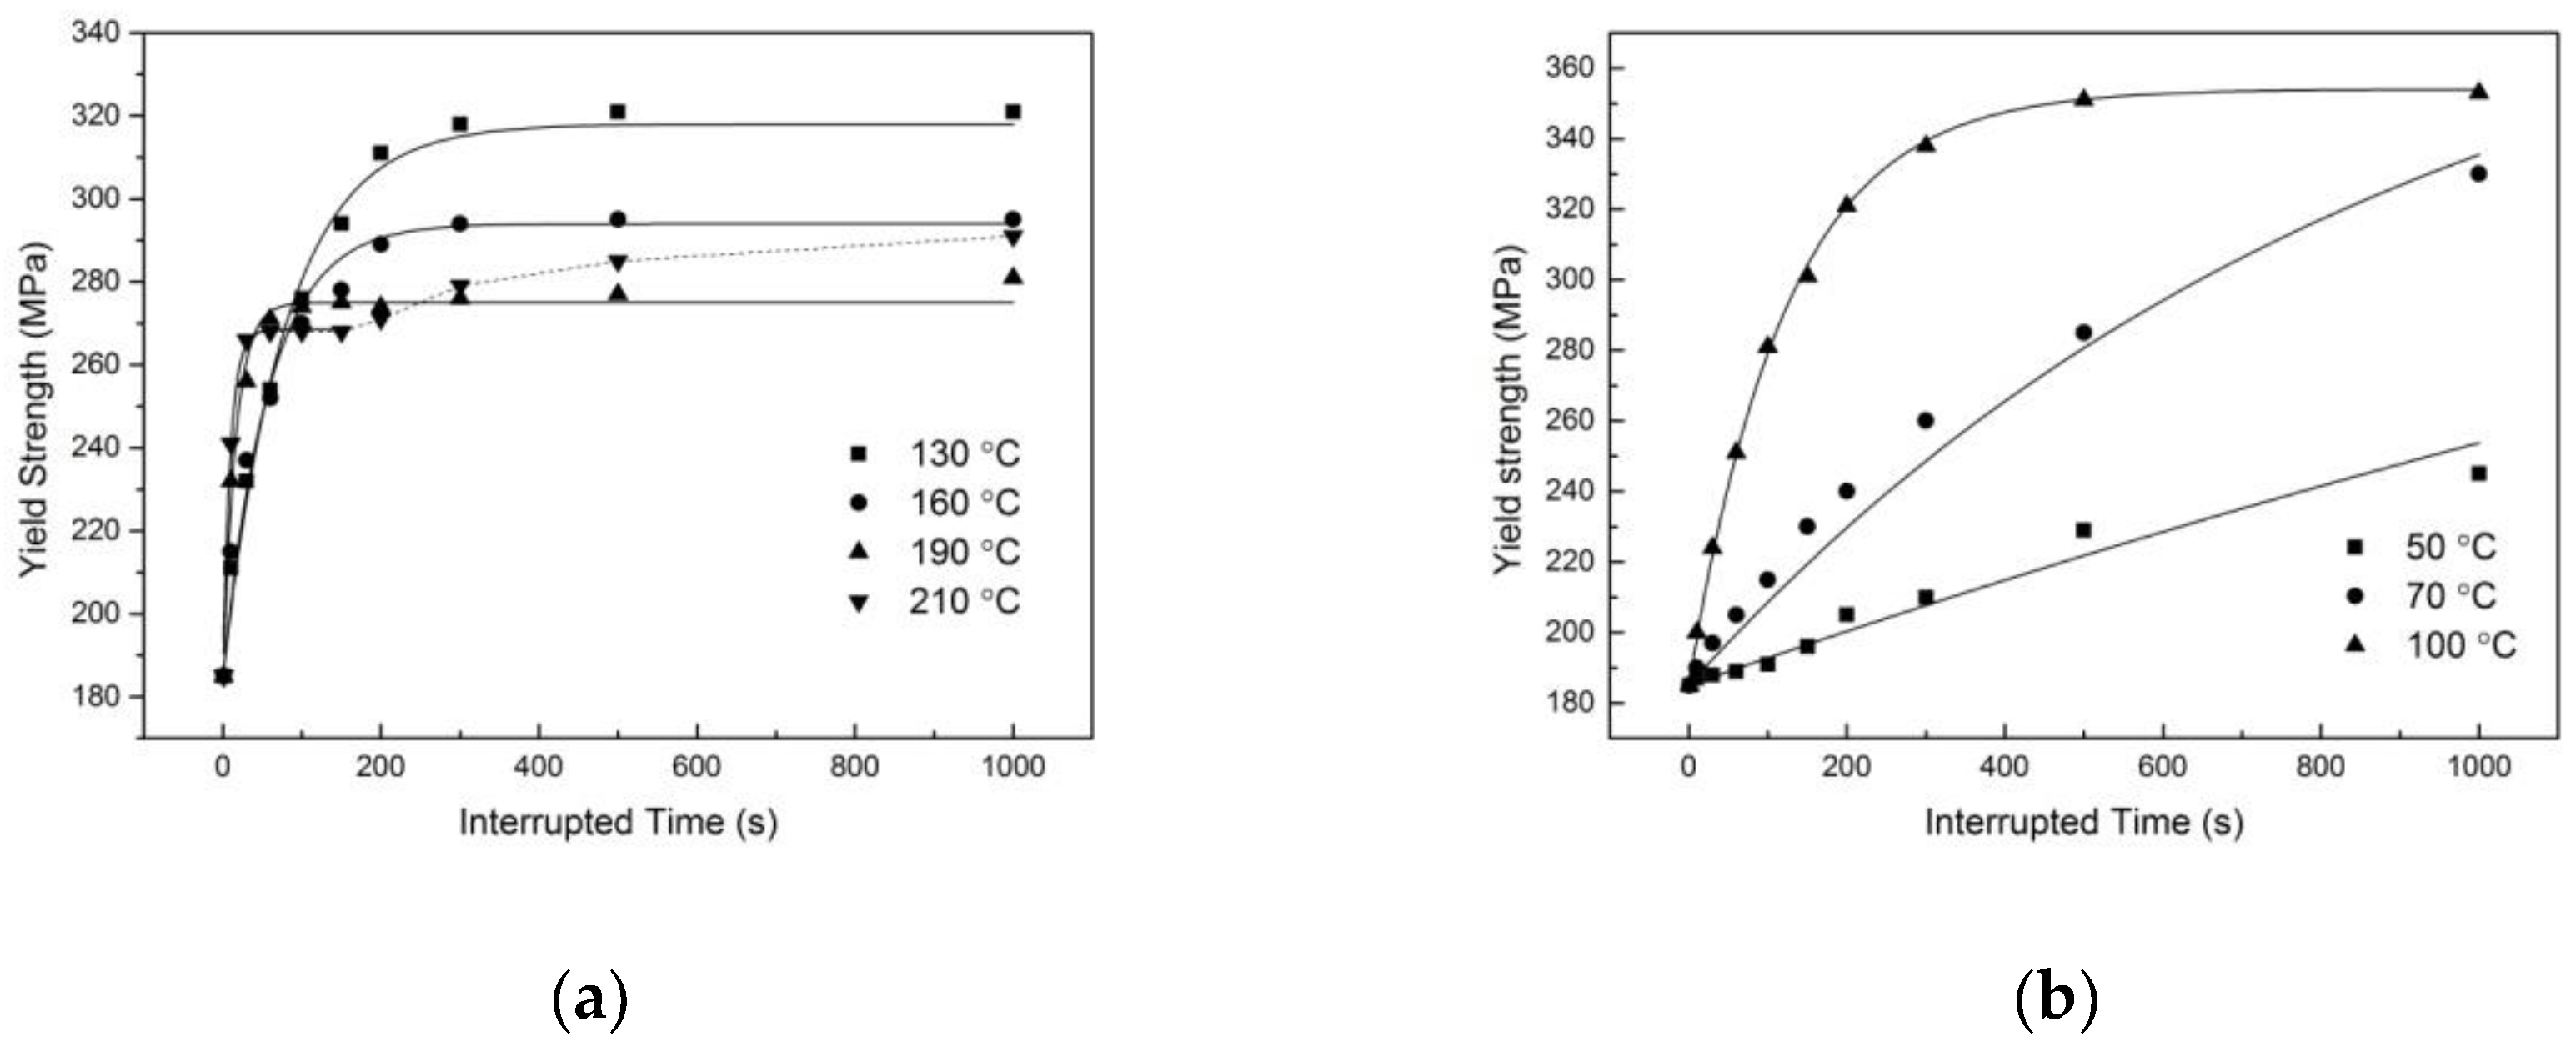
2.2. Compression Tests after Interrupted Quenching
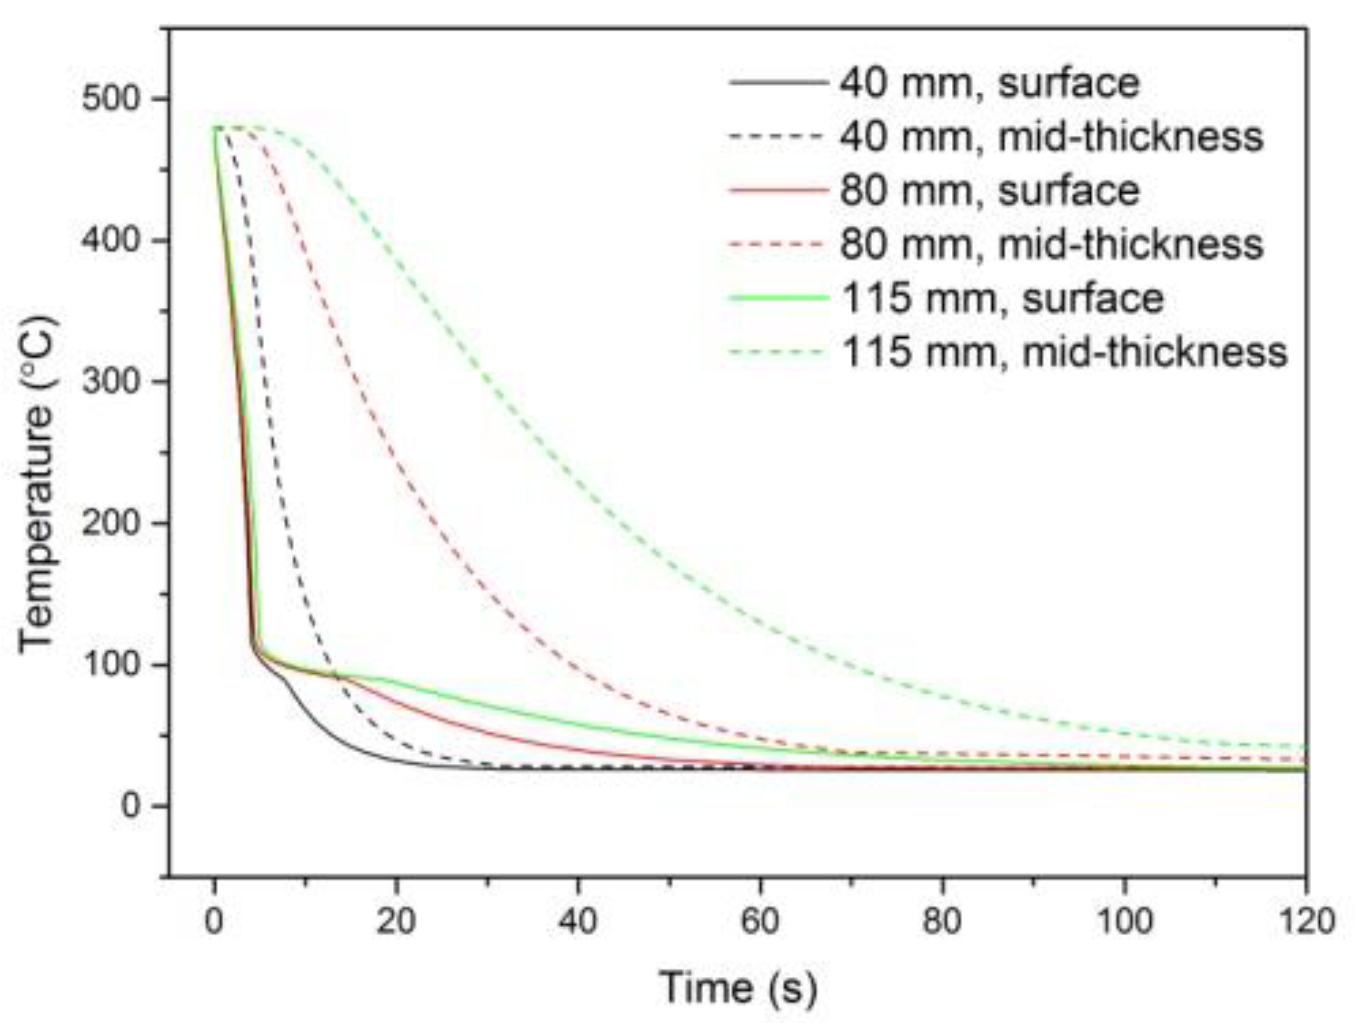
2.3. Quenching Experiments and Heat Transfer Analysis
3. Model
3.1. Classical QFA
3.2. Discussion of QFA Assumptions
3.3. Improved QFA
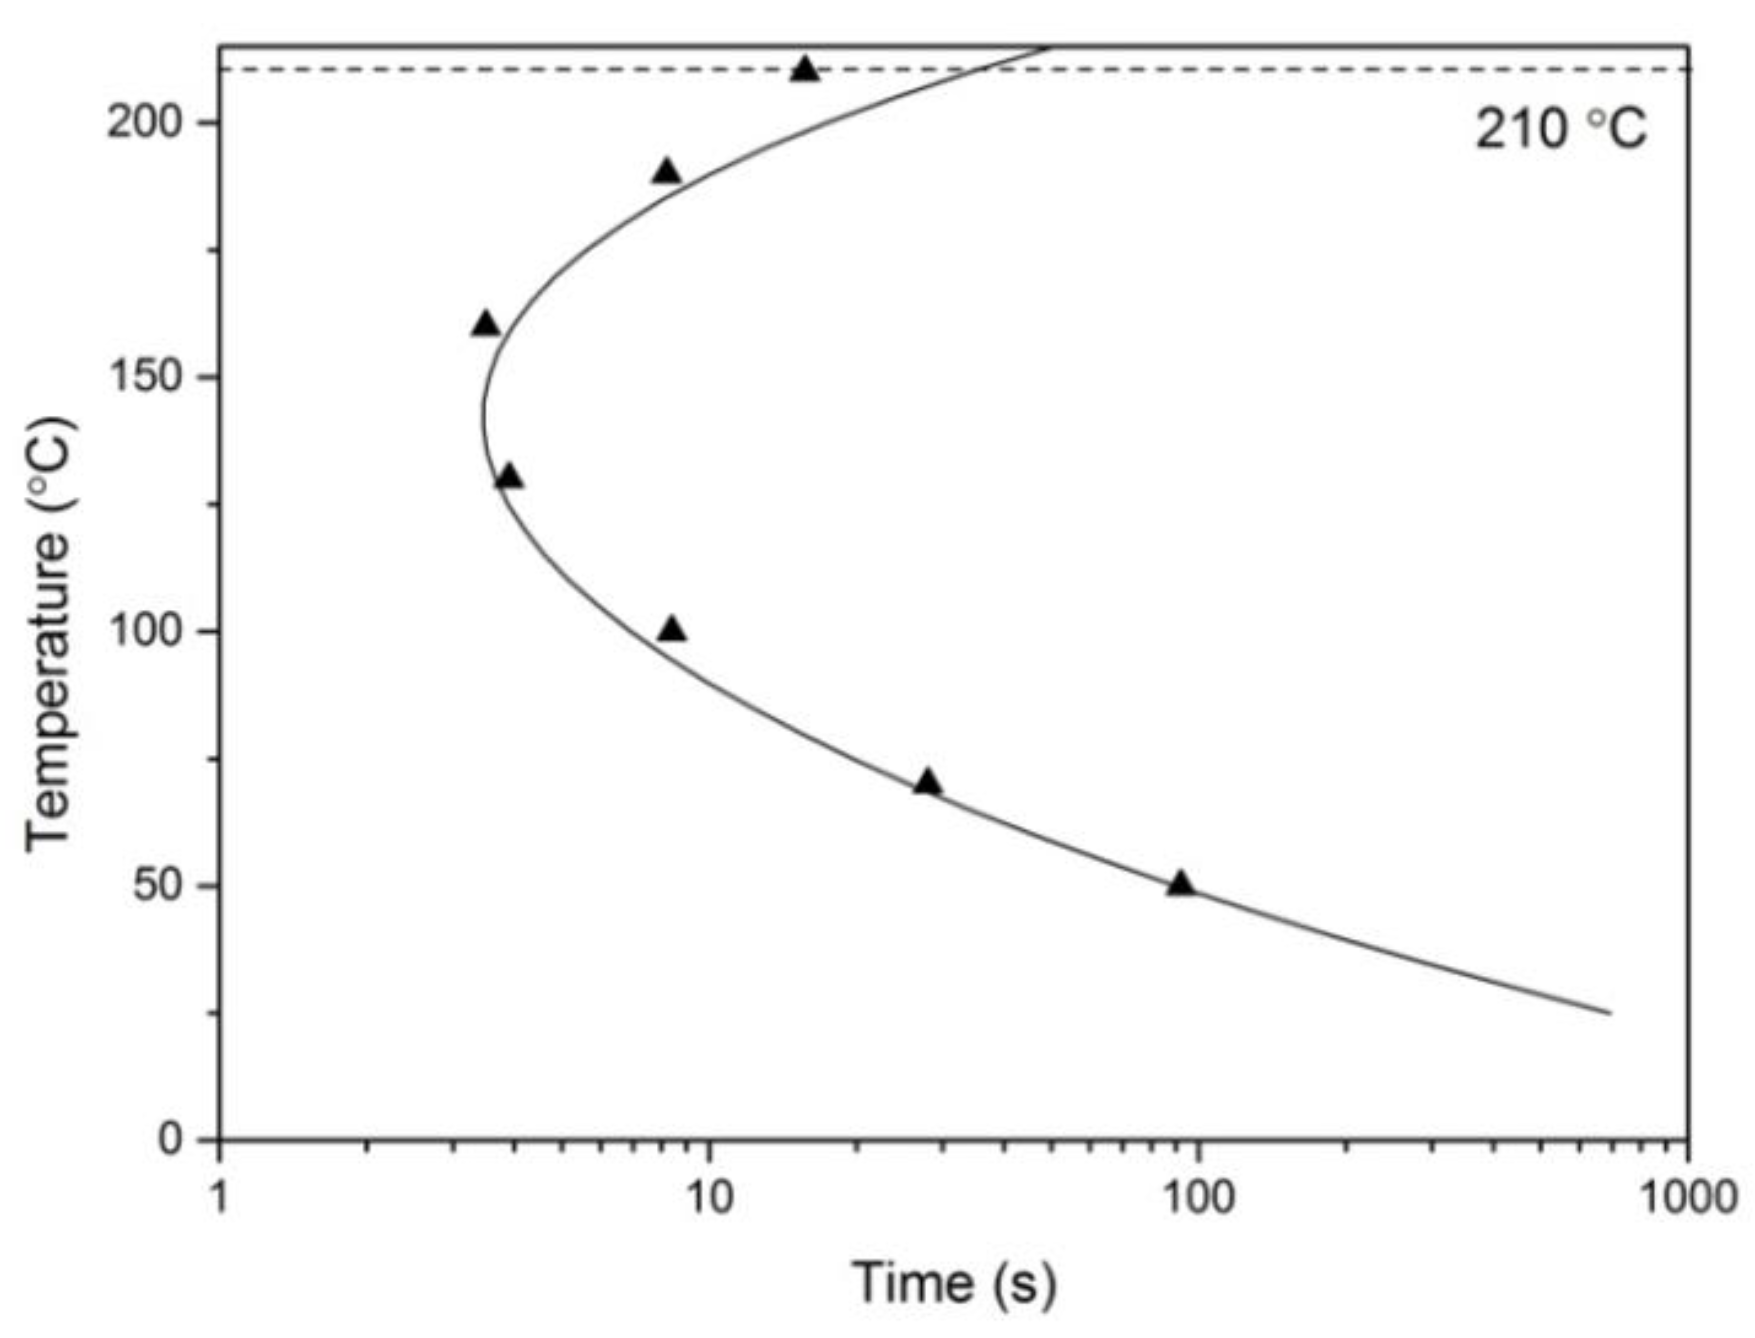
3.3.1. C-Curve
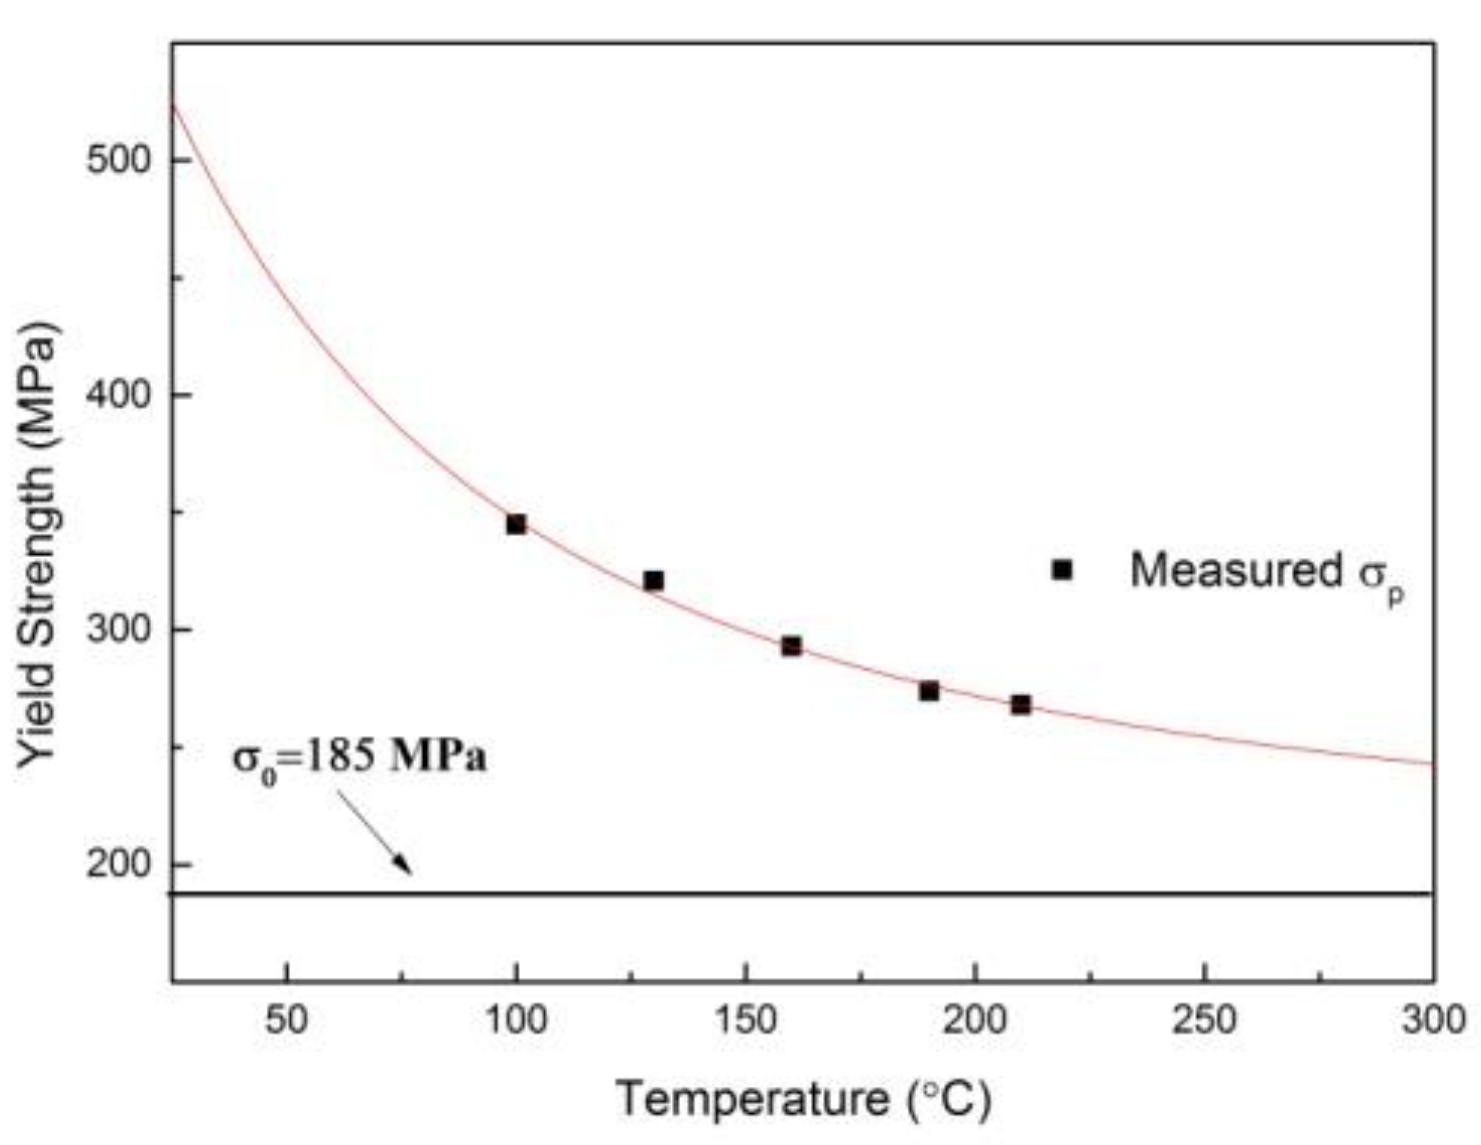
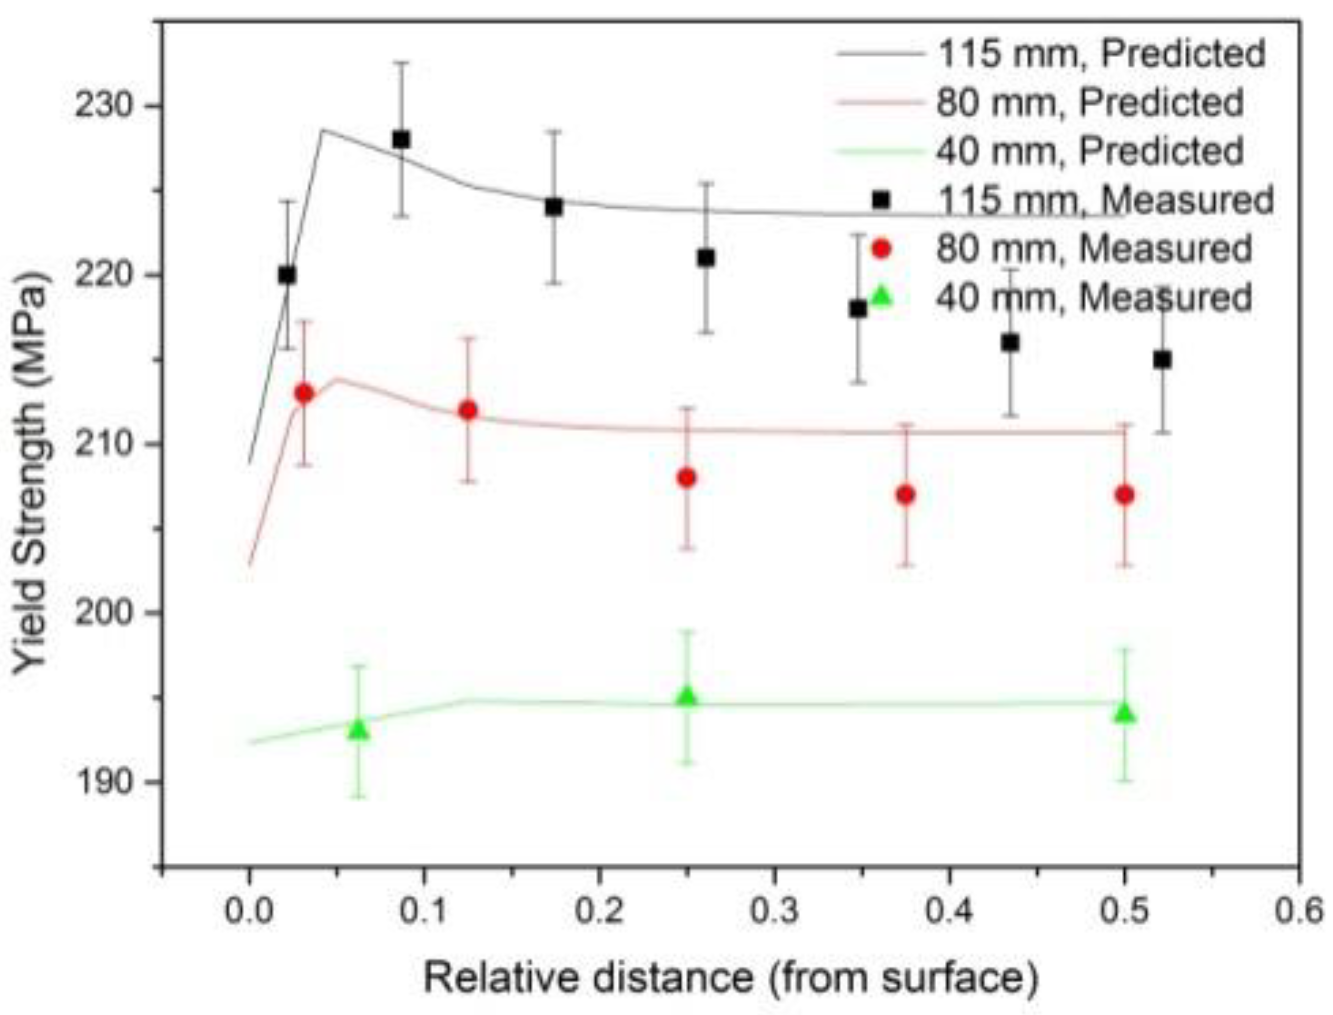
3.3.2. Property Prediction
3.3.3. Discussions
4. Conclusions
Author Contributions
Funding
Conflicts of Interest
References
- Miller, W.S.; Zhuang, L.; Bottema, J.; Wittebrood, A.J.; Smet, P.D. Recent development in aluminium alloys for the automotive industry. Mater. Sci. Eng. A 2000, 280, 37–49. [Google Scholar] [CrossRef]
- Williams, J.C.; Starke, J.E.A. Progress in structural materials for aerospace systems. Acta Mater. 2003, 51, 5775–5799. [Google Scholar] [CrossRef]
- Chen, J.; Zhen, L.; Yang, S.; Shao, W.; Dai, S. Investigation of precipitation behavior and related hardening in AA 7055 aluminum alloy. Mater. Sci. Eng. A 2009, 500, 34–42. [Google Scholar] [CrossRef]
- Robinson, J.S.; Tanner, D.A. Reducing Residual Stress in 7050 Aluminum Alloy Die Forgings by Heat Treatment. J. Mater. Process. Technol. 2007, 130, 635–644. [Google Scholar] [CrossRef]
- Tanner, D.A.; Robinson, J.S. Residual stress prediction and determination in 7010 aluminum alloy forgings. Exp. Mech. 2000, 40, 75–82. [Google Scholar] [CrossRef] [Green Version]
- Chobaut, N.; Carron, D.; Arsène, S.; Schloth, P.; Drezet, J.M. Quench induced residual stress prediction in heat treatable 7xxx aluminium alloy thick plates using gleeble interrupted quench tests. J. Mater. Process. Technol. 2015, 222, 373–380. [Google Scholar] [CrossRef] [Green Version]
- Robinson, J.S.; Truman, C.E. 50th Anniversary Article: The origin and management of residual stress in heat-treatable aluminium alloys. Strain 2014, 50, 185–207. [Google Scholar] [CrossRef]
- Starink, M.J.; Milkereit, B.; Zhang, Y.; Rometsch, P.A. Predicting the quench sensitivity of Al–Zn–Mg–Cu alloys: A model for linear cooling and strengthening. J. Mater. Des. 2015, 88, 958–971. [Google Scholar] [CrossRef] [Green Version]
- Schloth, P.; Deschamps, A.; Gandin, C.A.; Drezet, J.M. Modeling of GP(I) zone formation during quench in an industrial AA7449 75mm thick plate. J. Mater. Des. 2016, 112, 46–57. [Google Scholar] [CrossRef] [Green Version]
- Staley, J.T. Quench factor analysis of aluminium alloys. Metal. Sci. J. 2013, 3, 923–935. [Google Scholar] [CrossRef]
- Zhang, J.; Deng, Y.L.; Yang, W. Design of the multi-stage quenching process for 7050 aluminum alloy. J. Mater. Des. 2014, 56, 334–344. [Google Scholar] [CrossRef]
- Ruitenberg, G.E.; Petford-Long, A.K. Comparing the Johnson–Mehl–Avrami–Kolmogorov equations for isothermal and linear heating conditions. Thermochim. Acta 2001, 378, 97–105. [Google Scholar] [CrossRef]
- Kalu, P.N.; Waryoba, D.R. A JMAK-microhardness model for quantifying the kinetics of restoration mechanisms in inhomogeneous microstructure. Mater. Sci. Eng. A 2008, 464, 68–75. [Google Scholar] [CrossRef]
- Cahn, J.W. Transformation kinetics during continuous cooling. Acta Metall. 1956, 4, 572. [Google Scholar] [CrossRef]
- Noseda Grau, V.; Cuniberti, A.; Tolley, A.; Castro Riglos, V.; Stipcich, M. Solute clustering behavior between 293k and 373k in a 6082 aluminum alloy. J. Alloys Compd. 2014, 684, 481–487. [Google Scholar] [CrossRef]
- Reich, L.; Ringer, S.P.; Hono, K. Origin of the initial rapid age hardening in an Al-1.7 at.% Mg-1.1 at.% Cu alloy, Phil. Mag. Lett. 1999, 79, 639–648. [Google Scholar] [CrossRef]
- Rometsch, P.A.; Starink, M.J.; Gregson, P.J. Improvements in quench factor modeling. Mater. Sci. Eng. A 2003, 339, 255–264. [Google Scholar] [CrossRef] [Green Version]
- Flynn, R.J.; Robinson, J.S. The application of advances in quench factor analysis property prediction to the heat treatment of 7010 aluminium alloy. J. Mater. Process. Technol. 2004, 153, 674–680. [Google Scholar] [CrossRef]
- Sigli, C.; de Geuser, F.; Deschamps, A.; Lépinoux, J.; Perez, M. Recent advances in the metallurgy of aluminum alloys. Part II: Age hardening. C.R. Physique 2018, 19, 699–709. [Google Scholar] [CrossRef]


| Zn | Mg | Cu | Zr | Fe | Si | Cr | Mn | Ti | Al |
|---|---|---|---|---|---|---|---|---|---|
| 6.27 | 2.37 | 2.21 | 0.11 | 0.11 | 0.11 | 0.03 | 0.05 | 0.05 | Bal. |
| k2 (s) | k3 (J mol−1) | k4 (K) | k5 (J mol−1) | k6 (MPa) | k7 (K−1) |
|---|---|---|---|---|---|
| 2.52 e-15 | 9300 | 735 | 7,8366 | 8.52 | 1100 |
© 2019 by the authors. Licensee MDPI, Basel, Switzerland. This article is an open access article distributed under the terms and conditions of the Creative Commons Attribution (CC BY) license (http://creativecommons.org/licenses/by/4.0/).
Share and Cite
Ye, S.; Chen, K.; Liu, L.; Chen, S.; Zhu, C. Prediction and Experimental of Yield Strengths of As-Quenched 7050 Aluminum Alloy Thick Plates after Continuous Quench Cooling. Metals 2020, 10, 26. https://doi.org/10.3390/met10010026
Ye S, Chen K, Liu L, Chen S, Zhu C. Prediction and Experimental of Yield Strengths of As-Quenched 7050 Aluminum Alloy Thick Plates after Continuous Quench Cooling. Metals. 2020; 10(1):26. https://doi.org/10.3390/met10010026
Chicago/Turabian StyleYe, Shengping, Kanghua Chen, Li Liu, Songyi Chen, and Changjun Zhu. 2020. "Prediction and Experimental of Yield Strengths of As-Quenched 7050 Aluminum Alloy Thick Plates after Continuous Quench Cooling" Metals 10, no. 1: 26. https://doi.org/10.3390/met10010026