Article

Analysis and Control of Twist Defects of Aluminum Profiles with Large Z-Section in Roll Bending Process

1
School of Mechanical Engineering, Northwestern Polytechnical University, Xi’an 710072, China
2
School of Mechanical and Manufacturing Engineering, Supmeca-Paris, 93407 Saint Ouen, France
3
Engineering Technology Center, AVIC XAC Commercial Aircraft Co., Ltd., Xi’an 710089, China
*
Authors to whom correspondence should be addressed.
Metals 2020, 10(1), 31; https://doi.org/10.3390/met10010031
Submission received: 22 November 2019 / Revised: 14 December 2019 / Accepted: 15 December 2019 / Published: 23 December 2019

Abstract

:
This paper focuses on the twist defects and the control strategy in the process of four-roll bending for aluminum alloy Z-section profiles with large cross-section. A 3D finite element model (3D-FEM) of roll bending process has been developed, on the premise of the curvature radius of the profile, the particularly pronounced twist defects characteristic of 7075-O aluminum alloy Z-section profiles were studied by FE method. The simulation results showed that the effective control of the twist defects of the profile could be realized by adjusting the side roller so that the exit guide roll was higher than the entrance one (the side rolls presented an asymmetric loading mode with respect to the main rolls) and increasing the radius of upper roll. Corresponding experimental tests were carried out to verify the accuracy of the numerical analysis. The experimental results indicated that control strategies based on finite element analysis (FEA) had a significant inhibitory function on twist defects in the actual roll bending process.

1. Introduction

As one of the indispensable structures for mass transportation and load-carrying with enormous quantities and diversities, the aluminum alloy products, especially aluminum alloy profiles have been increasingly applied in the aerospace industries, such profiles satisfy the current needs for products with high strength-to-weight ratio, excellent formability, lightweight and high performance [1,2]. To realize the various applications in the aerospace industry, the demand for bent profile parts usually with large scales and shapes differs in various bending angles/radii and geometric cross-section are mainly produced by roll bending process [3,4]. However, similar to sheet metal bending, non-uniform deformation inevitably occurs during bending, viz., tension at the extrados and compression at the intrados of the bending profiles and also a certain degree of twist often occurs during the roll bending process [5,6]. This phenomenon even behaves more obvious for the profiles with asymmetrical section characteristics and can be defined as twist springback or twist defects, which significantly affects the dimensional accuracy and geometrical properties of the product [7,8,9]. As the higher precision requirement in the aerospace industry, it becomes a challenge to efficiently control aluminum alloy twist defects and to accomplish precision forming. It is necessary to make accurate prediction for twist defects and adopt the effective control strategy to guarantee the achievement of high-precision manufacturing quality for the aluminum alloy profiles with asymmetrical section in roll bending.
Plenty of former research studies have been conducted in the field of twist defects via experimental and numerical methods. Ona et al. [10] investigated twist defects of asymmetrical channel sections in an eight-stand cold roll forming process. They proposed solutions for reducing twist defects by transversely displacing the stands and adjusting the pressure applied to strips during forming using a pair of rollers for over-forming on a bend. Takamura et al. [11] concerned the occurrence of twist phenomenon in curved hat channel products and aimed to clarify the causes of twist using physical quantities obtained by simulation. Chatti et al. [12] investigated a novel rolling-based process for three-dimensional bending of pipes with asymmetrical sections and proposed a simple compensation system for twisting of asymmetrical profiles. The system was based on the elementary theory of bending for a 3D bent profile with two successive bending radii in two different bending planes. Gangwar et al. [13] presented a theoretical analysis for determining springback of arbitrary shaped thin tubular section of materials under torsion loading, in which the residual angle of twist can directly be calculated from the shear stress-strain curve. Liao et al. [9,14,15] investigated the behavior of twist deformation of asymmetric aluminum tube workpieces in rotary drawing bending process and characterized the influence of constitutive model on twist deformation prediction using experimental and numerical methods. A control strategy was proposed realizing twist deformation for lightweight automotive structures and drew the conclusion of improving formability and avoiding defects during the bending process. Zhou et al. [16] utilized three-dimensional free bending technology to analyze the twisting of L-shaped aluminum profiles under different bending conditions through both simulations and experiments. Based on trying to contact both long and short flange edges with the rolls simultaneously at the same height, Yaser et al. [17] studied the twist defects by finite-element analysis for asymmetrical channels with different flange lengths and some experiments were performed to verify the accuracy of the finite-element model, proposed an idea of designing asymmetrical forming rolls to decrease the twist angle.
The above studies indicate that the experimental and numerical methods have been widely used in the twist analysis, and can effectively predict it for profiles with a certain section in the corresponding forming process. However, these researches have rarely been focused on the twist defects of the profile parts in roll bending process, without involving numerical prediction and control strategy. Therefore, it is necessary to establish a reliable finite-element analysis model and to propose corresponding control strategies to improve the forming quality for such profiles in roll bending.
The present work aims to analyze twist defects and identify control strategy in roll bending process for asymmetric aluminum alloy profiles with large Z-section. In this work, the twist defects for the profiles were identified to determine the reference control strategy. A 3D finite element analysis model for the four-roll bending process of profiles with large Z-section was developed using ABAQUS finite-element package (version 6.14). The control strategies are assessed for the efficient reduction of twist defects. Afterward, the numerical simulation results were verified by the experimental tests and discussed.

2. Roll-Bending Process for Z-Section Profiles

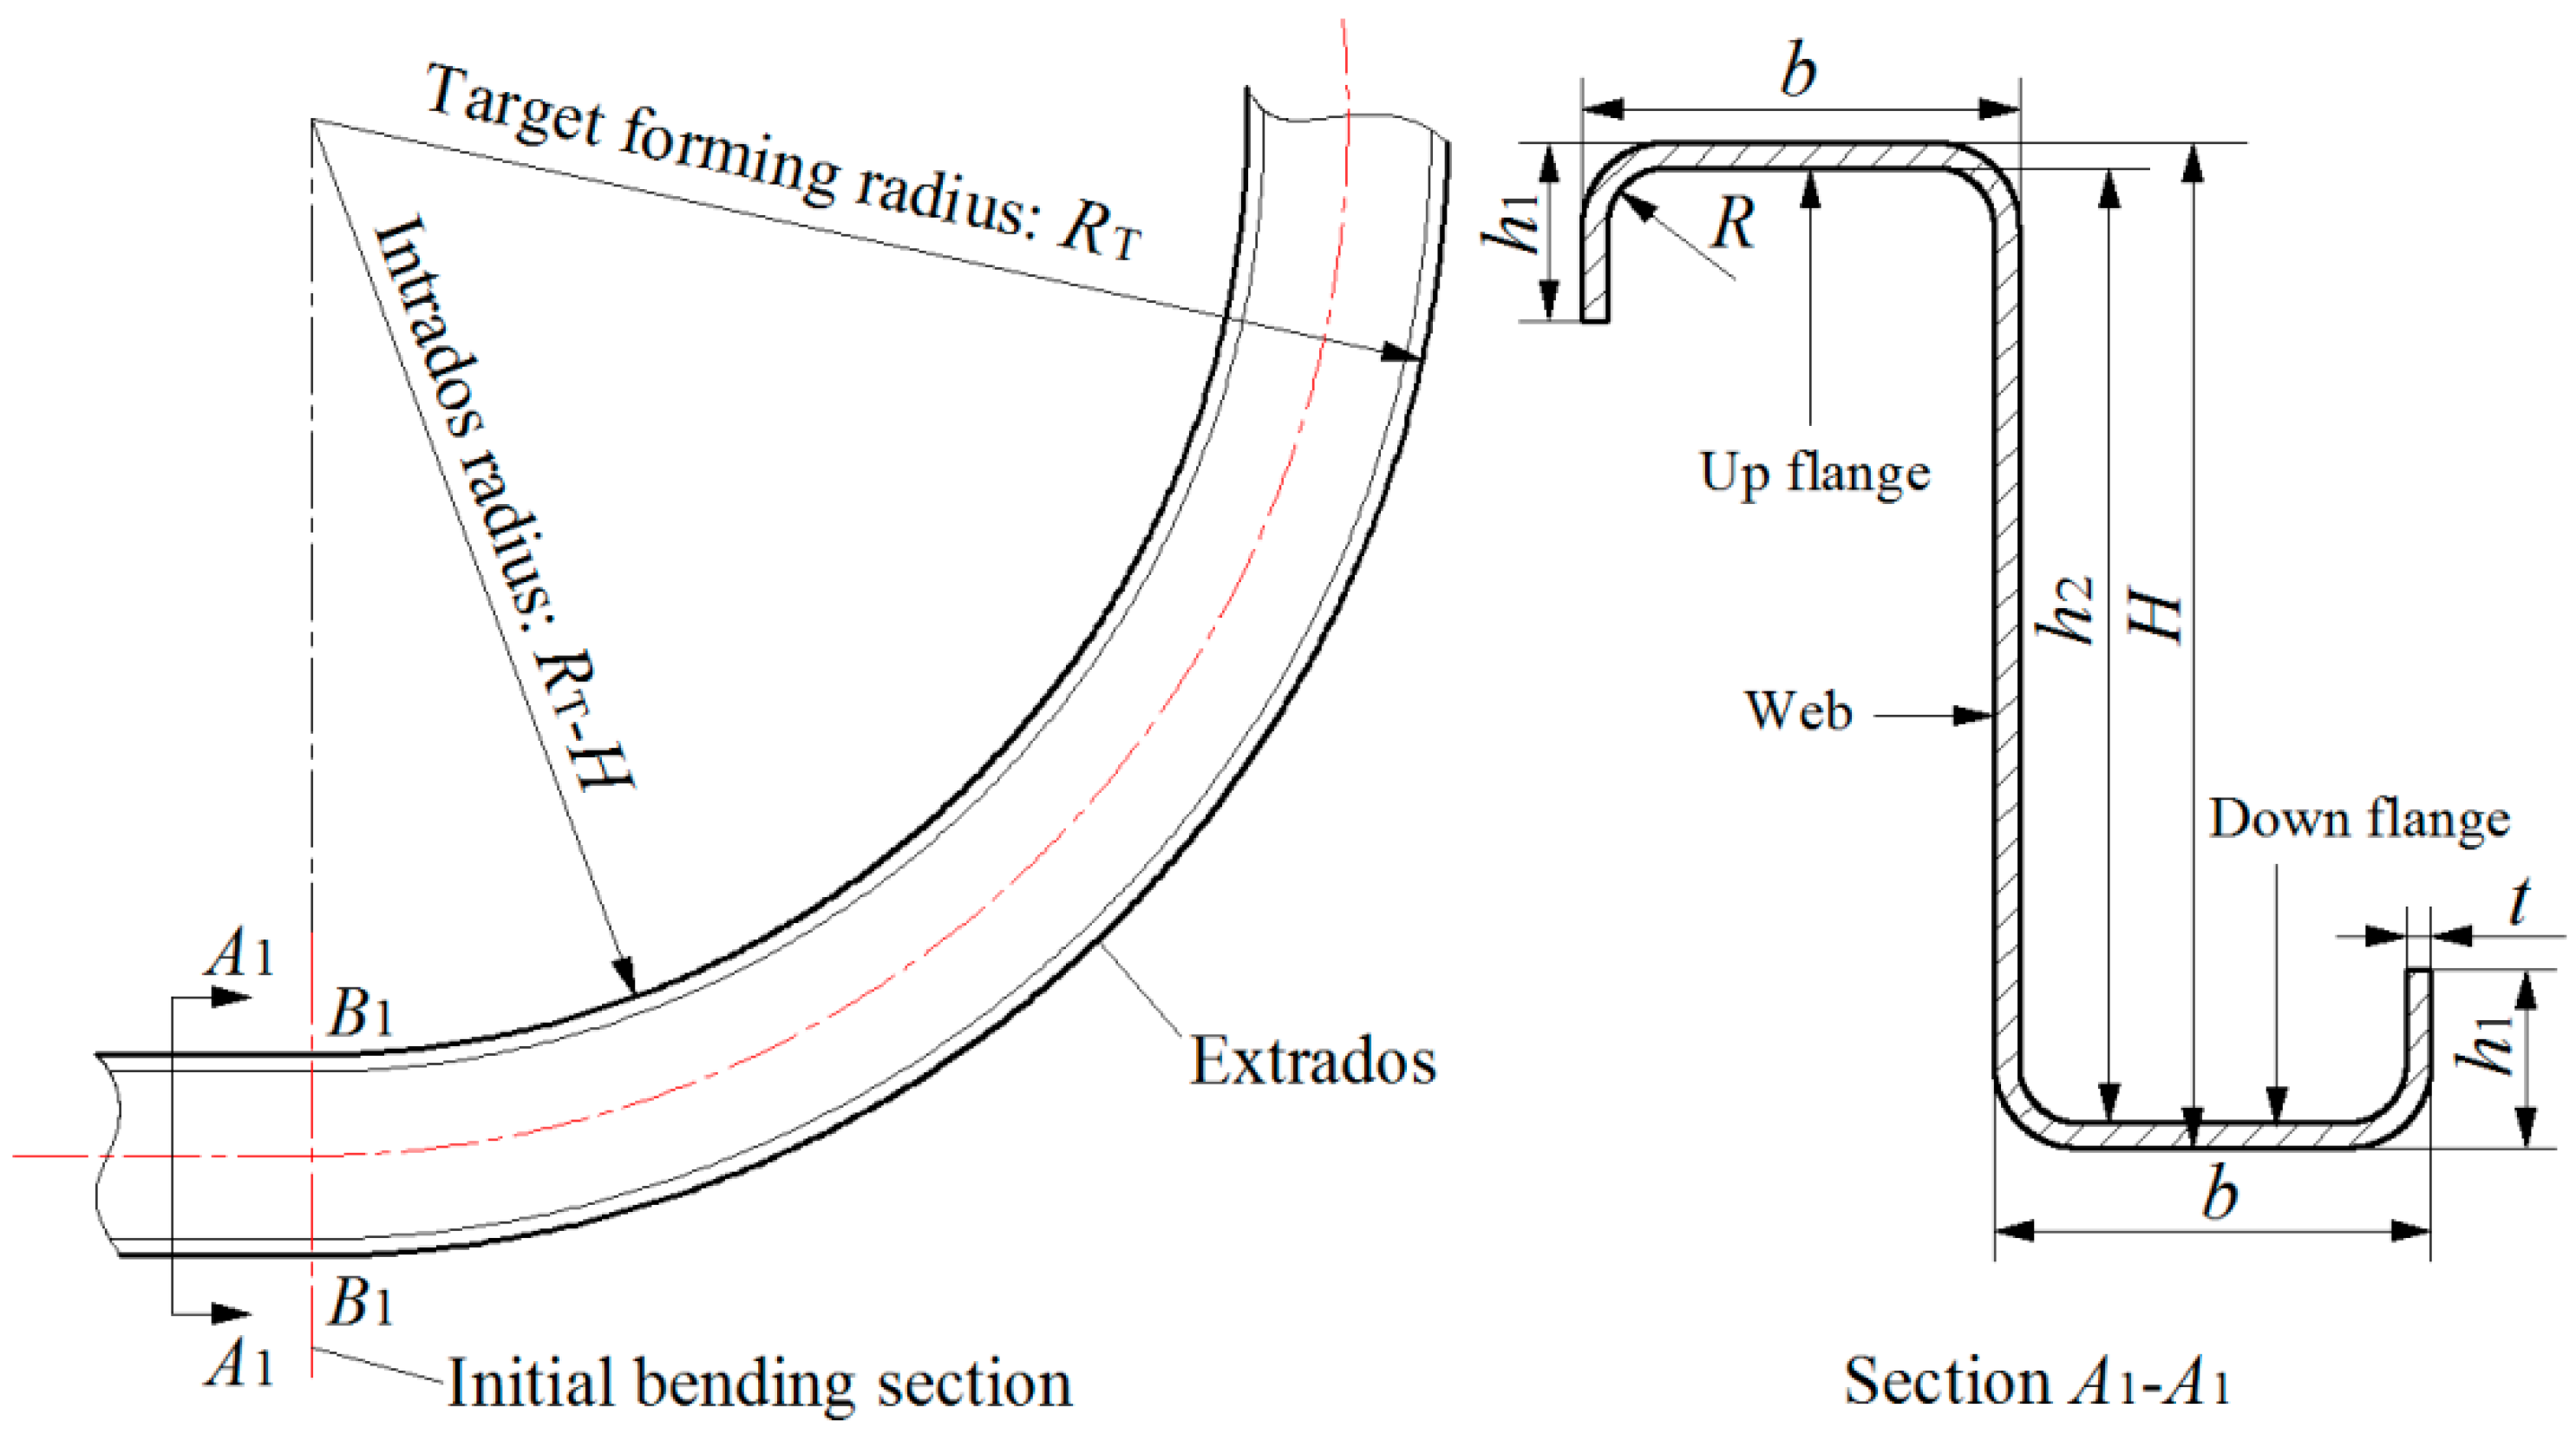
2.1. Geometric Parameters of Z-Section Profiles

The rolled profile with Z-section used in the roll bending tests as shown in Figure 1. It has height H = 50.8 mm. The up and down flanges are both of width b = 22.1 mm and the distance between them is h 2 = H 2 t , where t is the wall thickness. The transition radius R = 3.0 mm and the hook height h1 = 9.0 mm. The sidewall thickness t = 2.0 mm. Note that the cross-section thickness of the Z-section rolled profile is constant.

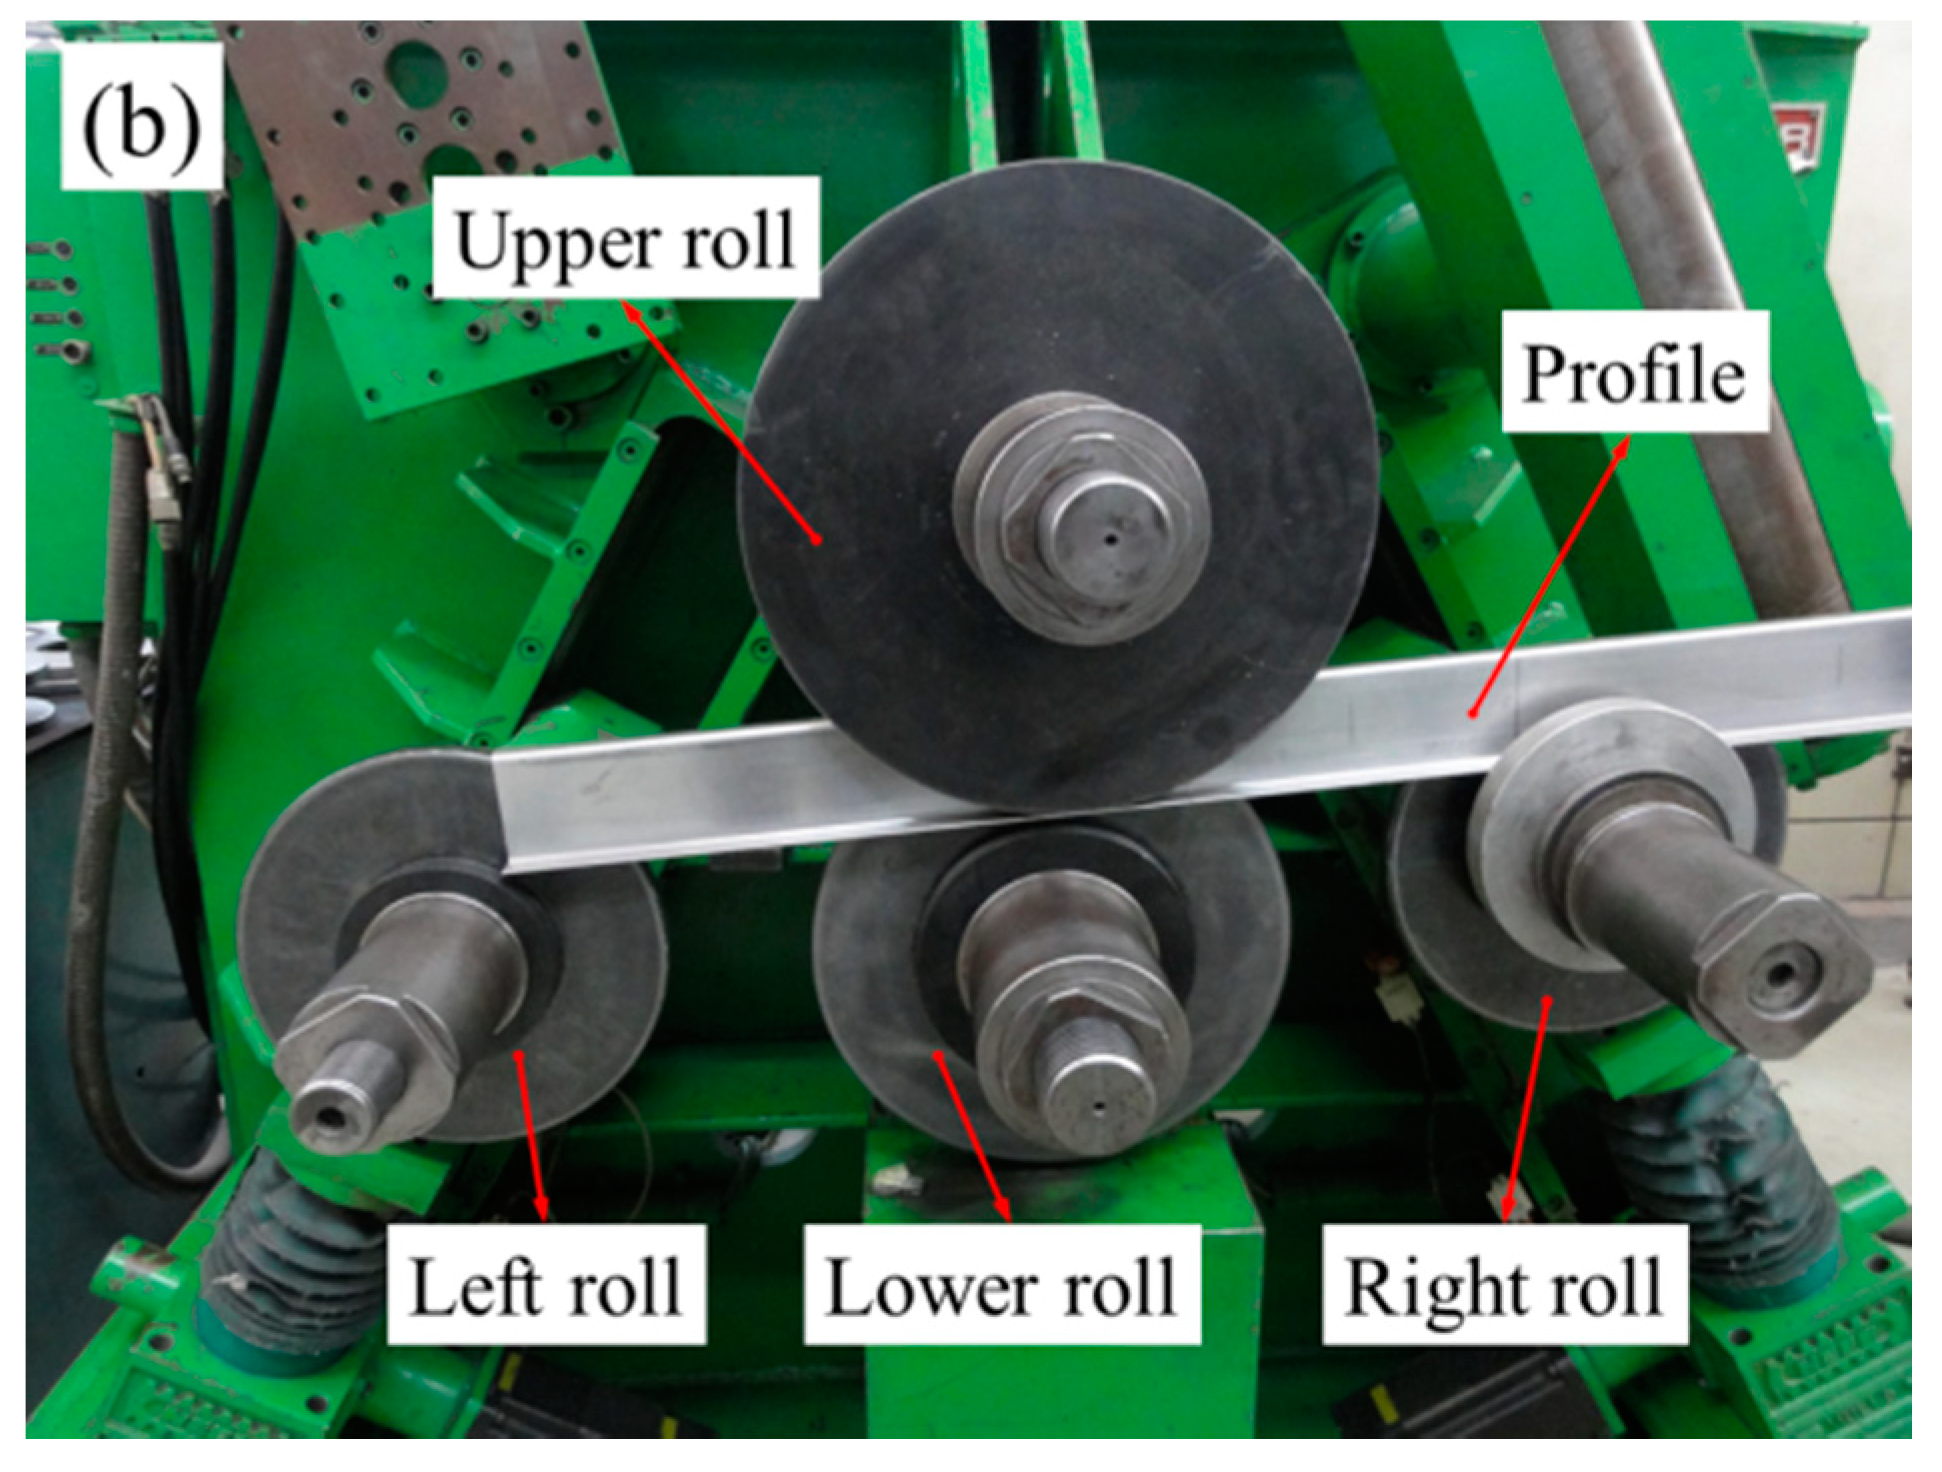
2.2. Roll-Bending Process

The application of profiles with asymmetrical section need to satisfy the requirement of various curvatures and different cross-section at the same time, a profiles bending technique that guarantees design flexibility and shape accuracy is a requisite. Accordingly, the roll bending process as a flexible forming process is usually used to produce such profiles, the schematic diagram of four-roll bending process is shown in Figure 2a. During roll bending, the upper and lower rolls (O1 and O2) clamp the workpiece with clamping force P and also ensure that there is enough friction to move the workpiece at a certain speed v. The bent part will be shaped with a certain curvature by adjusting the strokes X1 and X2 of side rolls O3 and O4. In this study, a Versatile Place and Route-Specification-Computer Numerical Control (VPR-SPEC-CNC; HAEUSLER AG Duggingen, Baselstrasse, The Switzerland) four-roll bending forming machine is adopted, as shown in Figure 2b.

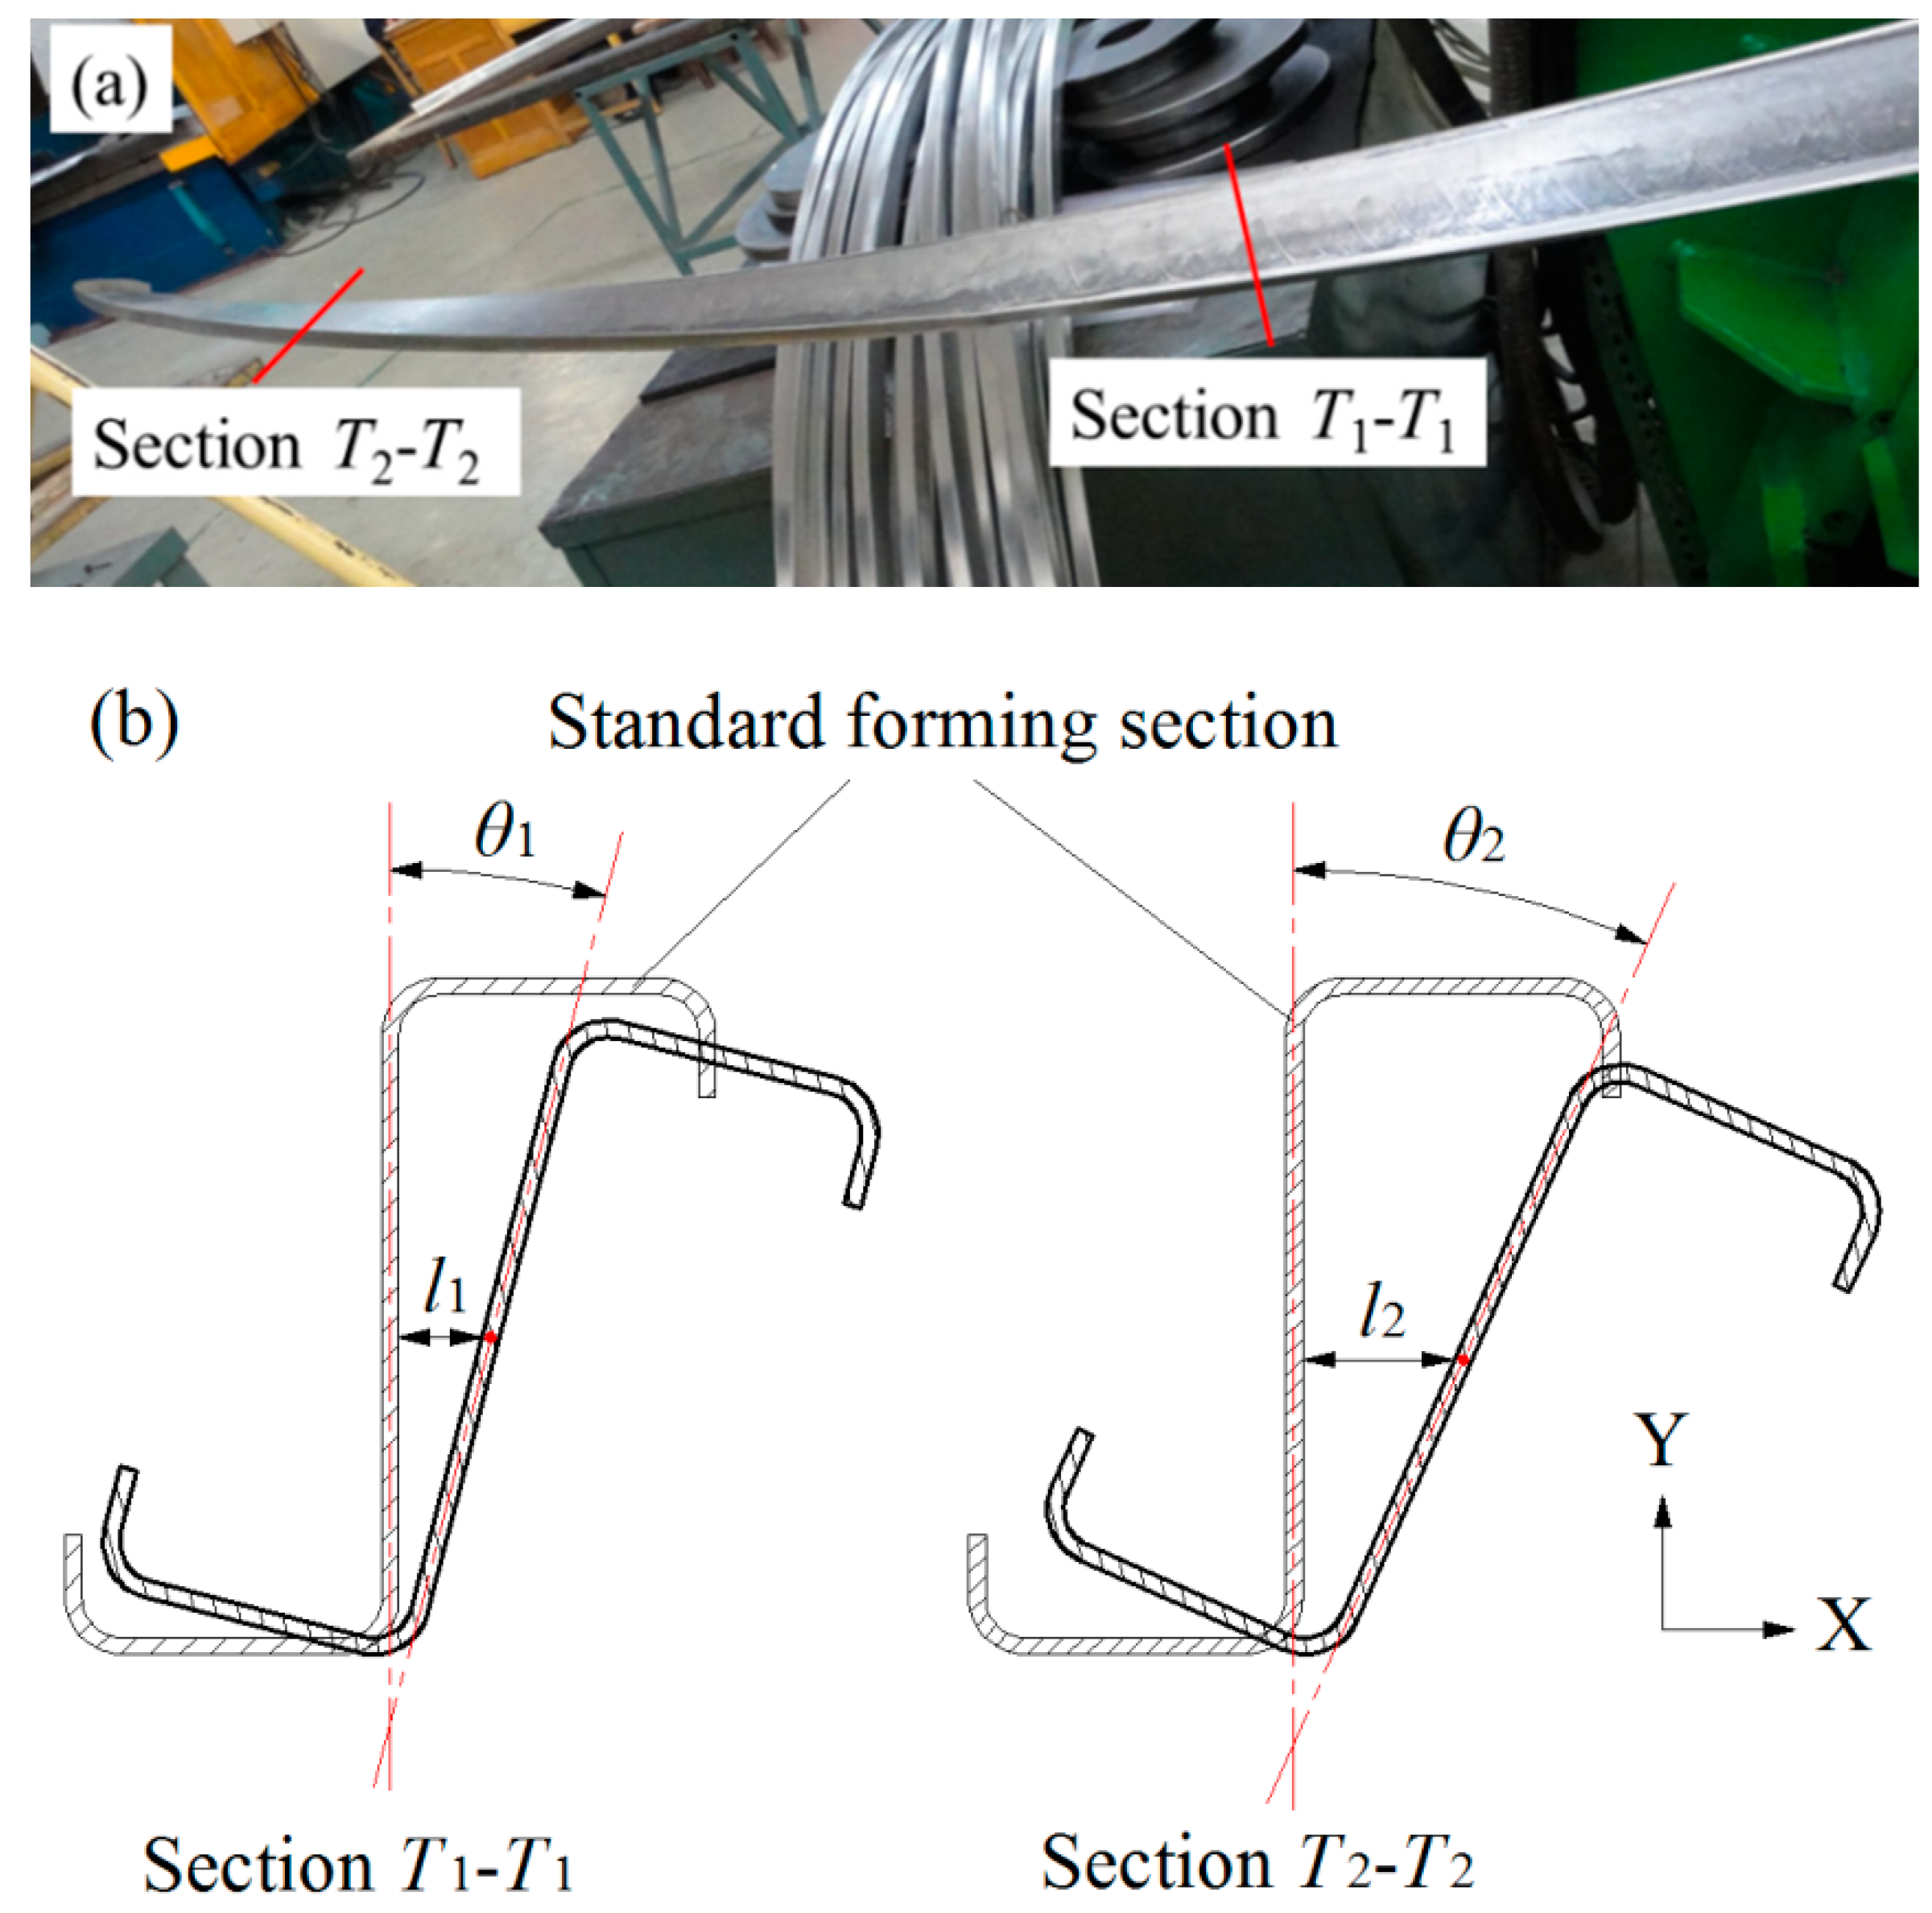
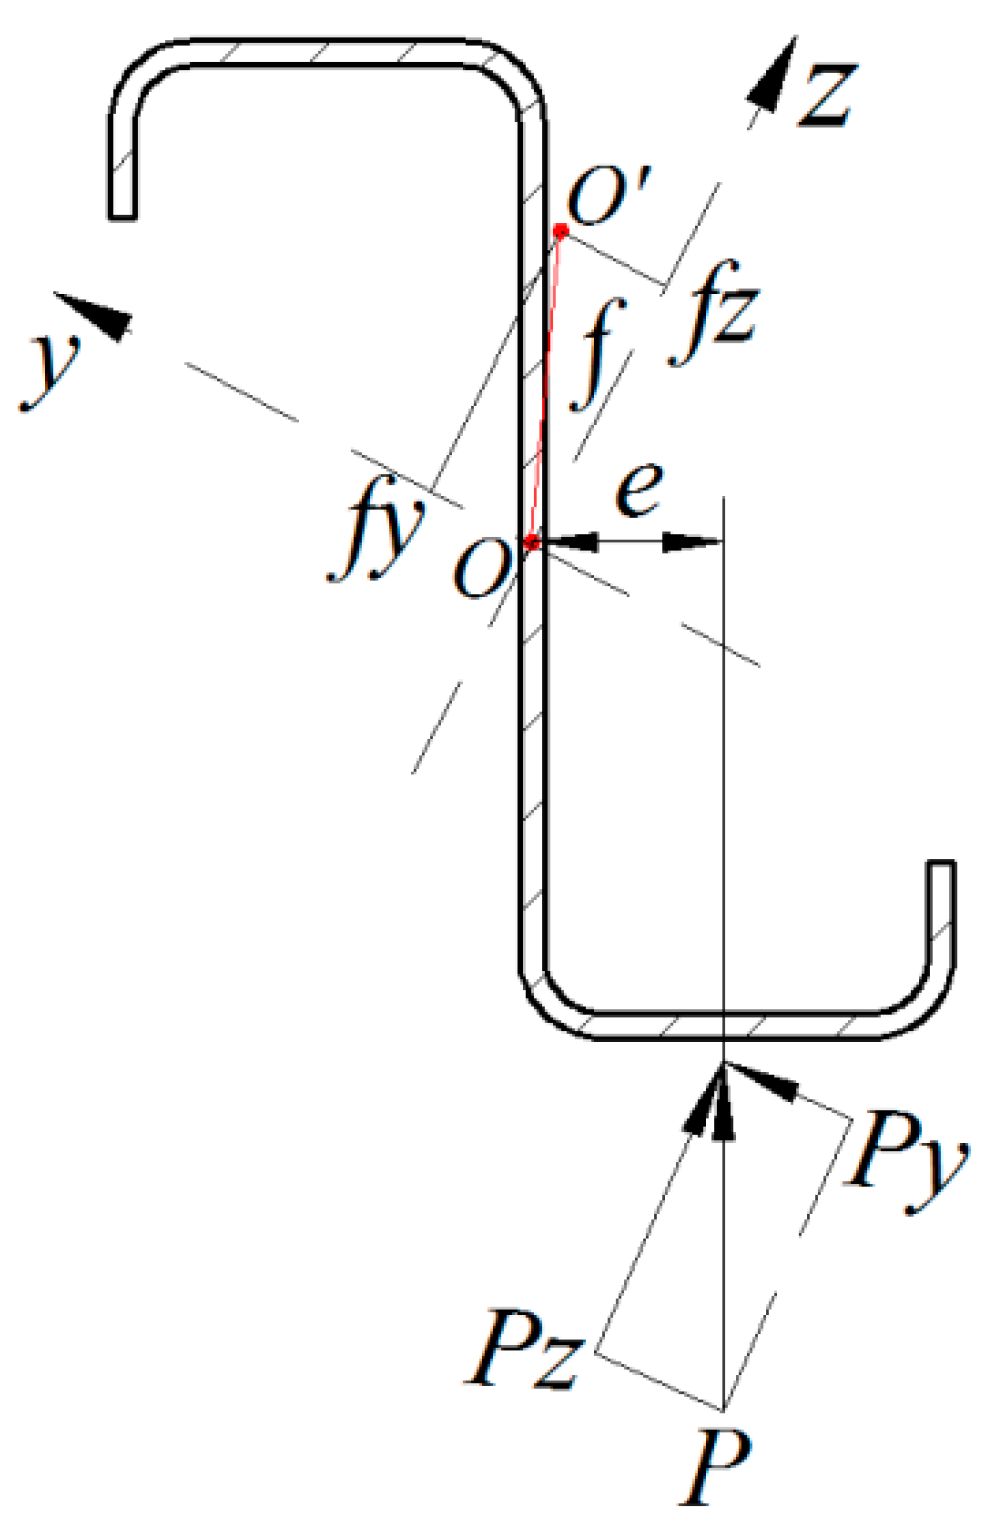
2.3. Analysis of Twist Defects

The main defect produced in profiles with large Z-section in roll bending process is the twist phenomenon after releasing the specimen from tools, as shown in Figure 3a. The twist of a bent profile part with Z-section results in the translation of the cross-section is accompanied by rotation along the circumferential direction length as shown in Figure 3b, which can be defined as twist displacement and twist angle, respectively. Assuming the initial bending section (the section A1-A1 in Figure 1) as the standard forming section, Figure 3b shows the comparison of the twist cross-section with the standard forming section corresponding to the section T1-T1 and section T2-T2 (in Figure 3a). As can be seen in Figure 3, the twist angle increases with the increasing circumferential direction length, viz. θ 1 < θ 2 , and the twist displacement also varies in the same trend, that is l 1 < l 2 . Besides, the twist displacement is the distance from the deformed section to standard forming section at point H / 2 . The calculation of the twist displacement ( l 1 and l 2 ) and twist angle ( θ 1 and θ 2 ) are as follows in Section 3.3.
The potential reason for the occurrence of twist defects is that during the roll-bending process of Z-section profiles, the resultant force P exerted by side rolls on the profile section does not pass through any central inertial plane of the cross-section, viz., the plane doesn’t through the y-axis or z-axis, but passes parallel to the profile web as shown in Figure 4. This phenomenon is due to the asymmetry of profile section.
As can be seen from Figure 4, the resultant force P mentioned above is parallel to the web, which can be decomposed into two components P y and P z , which are parallel to the y-axis and z-axis, respectively. Based on the mechanics of sheet metal forming [18], the deflection caused by the two components are f y and f z , expressed as
{ f y = P y D s 3 3 E I y f z = P z D s 3 3 E I z
where, P y and P z are the components of the resultant force P, D s is the distance between the upper roll and the side roll, E is the young’s modulus, I y and I z are the moment of inertia. As, P y P z , I y I z , in addition, the centroid of the Z-section moving from O and O , the axial deflection between the clamping rolls (upper and lower rolls) and side rolls is f . In addition, the resultant force P of side rolls on the workpiece does not pass through the flexural center c during roll bending, resulting in the torque M = P e upon the twist defects, where, e is the horizontal distance between the centroid O and the applied point of resultant force P .
In the light of the reason for twist, the deflection resulting in the twist can be reduced by reducing the variable parameters P and D s that reflected in Equation (1). On the premise of no slipping in the actual rolling bending process, the resultant force P is often calculated according to the material properties and set as small as possible to prevent the material from being damaged due to excessive resultant force [19]. According to Equation (1), the twist defects can be inhibited by reducing the distance between the upper roll and the side roll. Besides, in order to inhibit the twist defects, the method to increase enough constraint along X-axis (in Figure 3b) on profiles in the deformation region is adopted, which can be conducted by adjusting the loading pattern of side rolls. Therefore, the following research work will discuss the inhibition methodology of twist defects based on the two ideas mentioned above.

3. Finite Element Analysis of Twist Defects

The numerical implementation for the twist is realized by ABAQUS and the simulation process consists of two steps: (i) elastic-plastic loading (corresponding to roll bending) as the A B interval in Figure 2a, and (ii) elastic-plastic unloading (corresponding to releasing the specimen from tools) as the C D interval in Figure 2a.

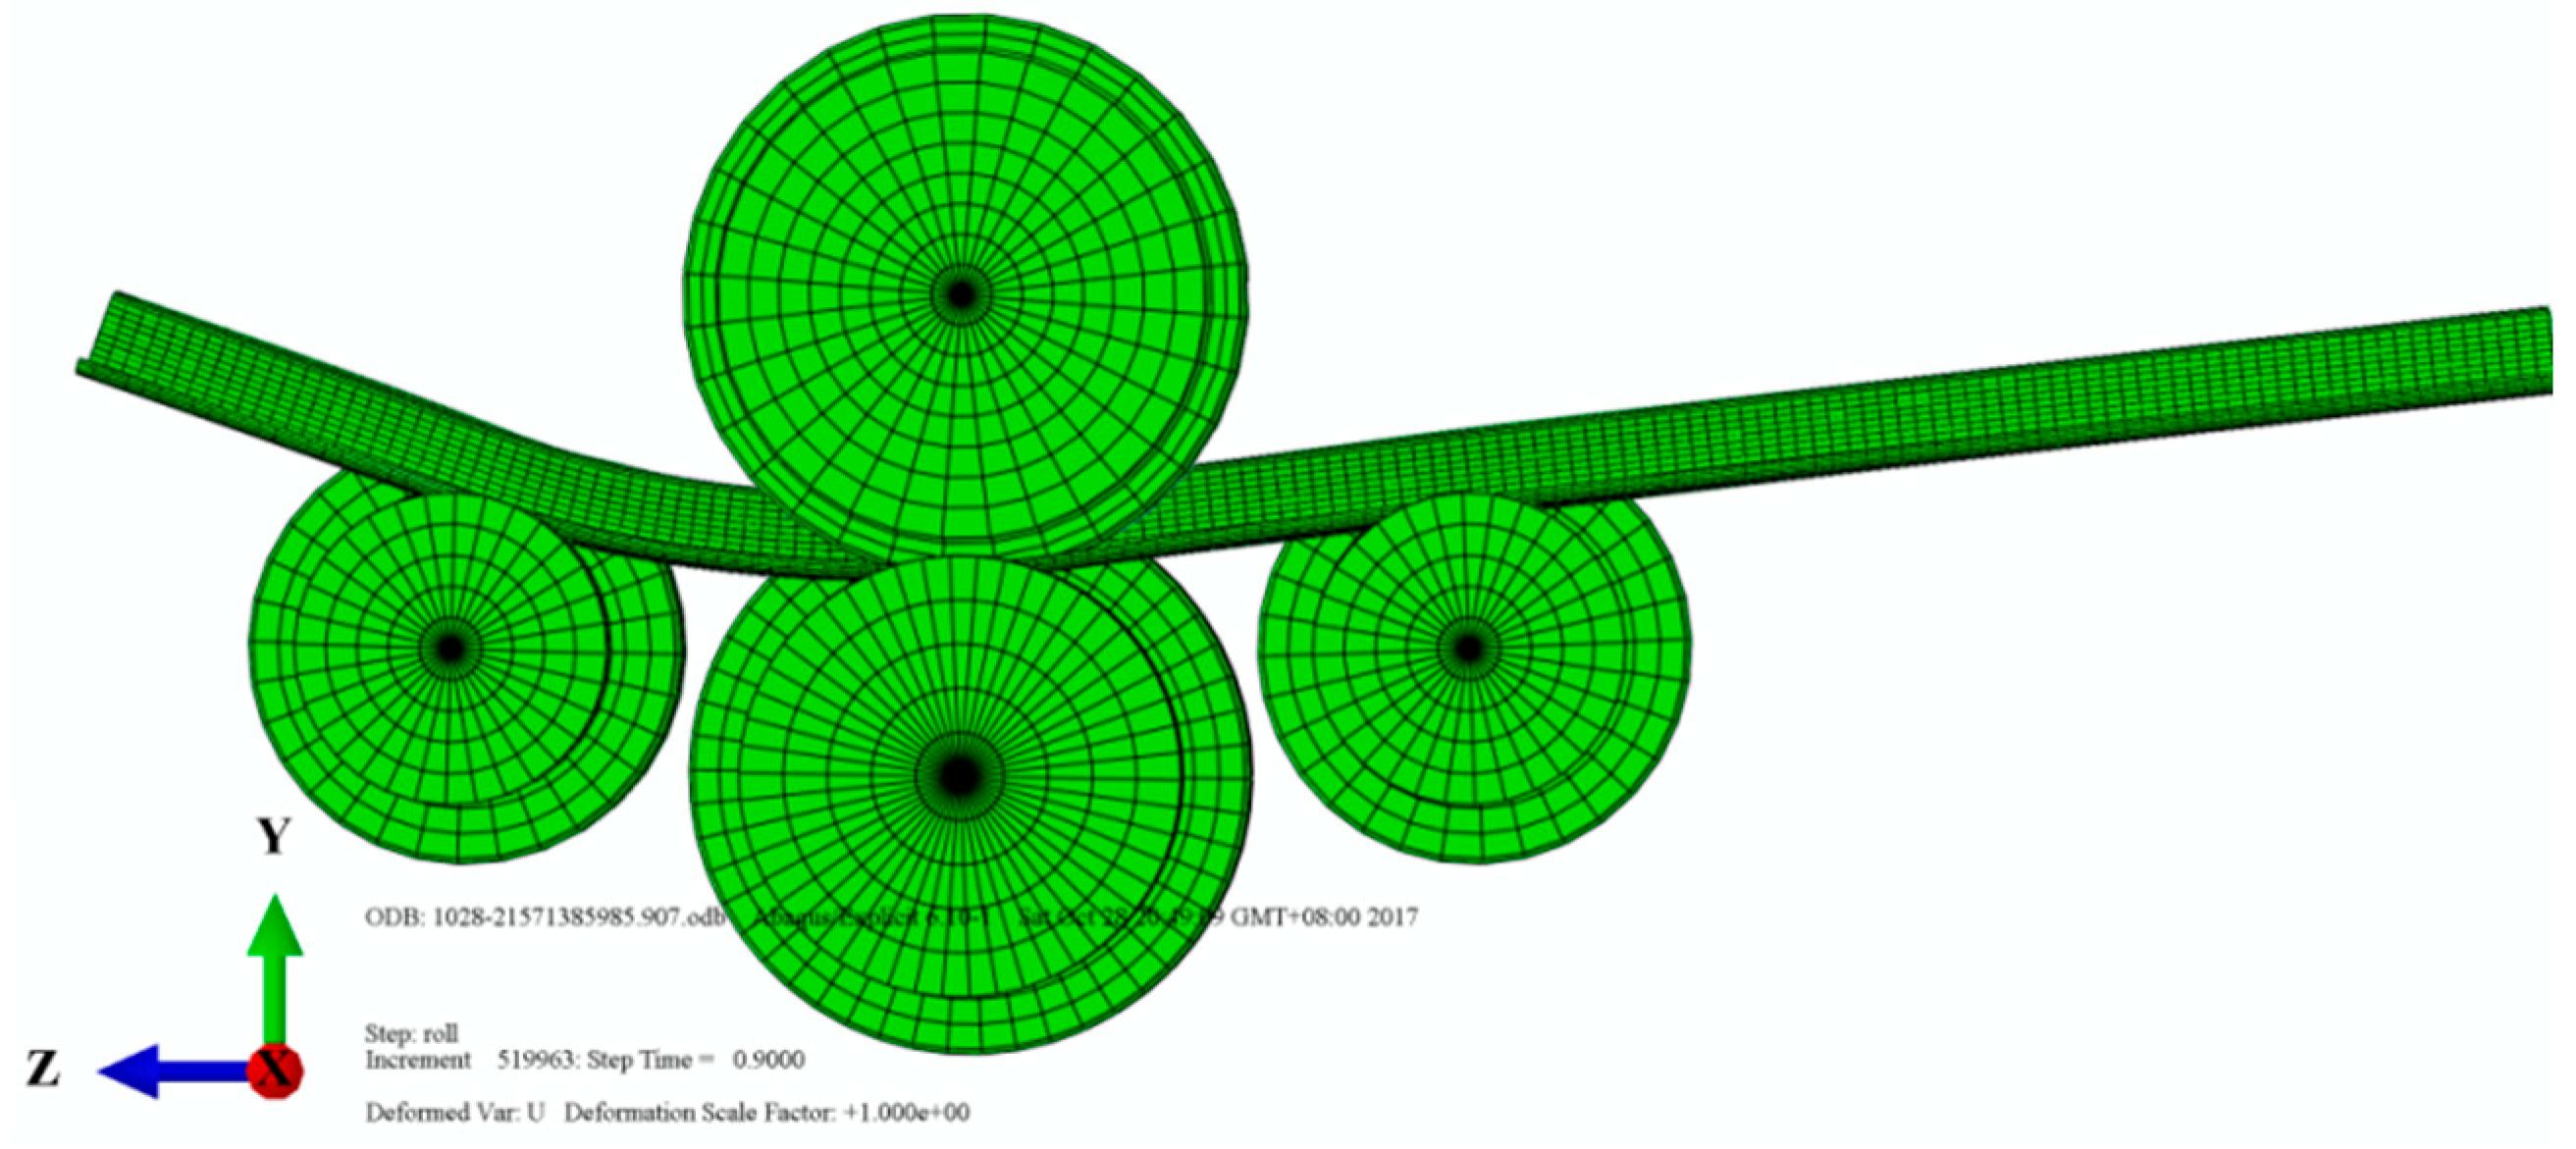
3.1. 3D-FEM of Roll-Bending Process

3.1.1. Procedure Type and Element

According to the practical profile roll bending process, a 3D elastic-plastic finite element model (3D-FEM) of roll bending test has been developed in the ABAQUS/CAE (Computer Aided Engineering) environment, which represents an approximated modeling of the roll bending machine tools interacting with the specimen. The simulation analysis of roll bending process mainly involves five parts: Four rigid rolls and one flexible profile. In order to ensure the accuracy of simulation results, the specimen is meshed with linear brick eight-node element (C3D8R). The four rigid rolls are discretized with a 4-node 3-D bilinear rigid quadrilateral (R3D4), and the final finite element model is illustrated in Figure 5. The rolls are modeled as an ideal undeformable shell, the stiffness of which are imposed infinite (rigid-body constraint), given the higher plasticity as compared to those of the specimen. In bending simulation, the mass scaling feature of 100 is utilized to improve the computation efficiency with neglected inertia effect by using the convergence analysis.

3.1.2. Interaction and Output

The “point and face” contact type is used to define the contact behaviors between all surfaces of profiles and rolls. The “limited slip” is used to define the slip behaviors between profile and rolls during roll bending. The “coulomb friction” model is used to represent the friction behavior; friction coefficient of 0.17 is used for the contact interactions. Rigid body constraints are specified to form element-based rigid bodies (rolls). A penalty-type mechanical constraint is used for all of the contact pair definitions. Material anisotropy is ignored [17], a general contact interaction is defined between the rolls and the element-based surface of the aluminum alloy profile as shown in Table 1.

3.1.3. Boundary Conditions

In FEM, geometric nonlinearity and automatic time incrementation using element-by-element stable time increment estimates are utilized. All the degrees of freedom are constrained at the reference nodes of the bending rolls. The boundary constraints are applied by “displacement/rotates” to realize the actual process of four-roll bending process.
The roll bending simulations consist of three explicit dynamic steps. In step 1, the upper and lower rolls O1 and O2 clamped the workpiece with clamping force P (as shown in Figure 2a). In step 2, the side rolls are adjusted to a certain position as strokes X1 and X2 respectively. In step 3, the friction between the upper roll drive and the workpiece at a certain speed v is to form the bent profile part. The constraint definition for components is shown in Table 2. Additionally, these constraint definitions do not change during roll bending and the constraint components keep the same position.

3.2. Material and Properties for Simulation Input

The studied material is 7075-O aluminum alloy and the chemical compositions of this material are listed in Table 3.
Uniaxial tension tests are conducted for the 7075-O aluminum alloy to obtain the mechanical properties. The samples were cut from web of profile with respect to the roll direction by water-jet cutting, and the design dimension for the specimen shape is shown in Figure 6. The tensile tests were carried out at room temperature using CSS.44100 electronic universal testing machine (CSS.44100 EUTM; Fangyuan Instrument Co., Ltd., Wenzhou, China) equipped by extensometer with a gauge length of 50 mm, see Figure 7.
Tensile loading speed in longitudinal direction was set to 1 mm/min, the acquisition frequency of the load and displacement data input built-in automatic signal acquisition system was 10 Hz. The axial strain obtained by the longitudinal extensometer, viz., the 50 mm extensometer was used to measure the strain, and the 25 mm extensometer was used to calibrate the elastic modulus of the sample. The material flow behavior was characterized on the basis of the true stress-strain curve, as the black curve illustrates in Figure 8. According to the data fitting method, the true stress-strain curves can be fit by the Holloman power law [21], as the red curve that shown in Figure 8. The mechanical properties obtained from the tension tests are listed in Table 4. Note that the material constitutive properties of the profile are implemented considering the results of the tensile tests, and the Von Mises yield function and isotropic hardening model are used [22,23].

3.3. Twist Defects Measurement

Measuring reference points and distribution cross-section of these points for the twist of Z-section profiles after roll bending are illustrated in Figure 9. The measuring points are distributed at the intersection line between the transition surface from the web to the flange, as shown in Figure 9a, where RP-1 is the measuring point near the intrados and RP-2 is the measuring point near the extrados, respectively. Besides, RP-1 and RP-2 must be distributed at the same reference cross-section, see Figure 9b. According to the simulation result, the displacements of the measurement points and their corresponding nodes along the Z-axis direction are taken to calculate the twist as shown in Figure 9c.
As shown in Figure 9c, set the distance between the measuring point near the intrados and the measuring reference surface as l i , the corresponding distance near the extrados is l e , let the distance between the two reference points (RP-1 and RP-2) at the same section as h . The twist angle can be given by
θ T = a r c s i n | l i l e | h        θ T ( 0 , π 2 )
where h = H 2 ( t + R ) , which can be calculated based on the geometric relationship of the cross-section as shown in Figure 1.
Assuming that the neutral layer, viz., the transition layer that is neither tensile nor compressive doesn’t shift during roll-bending, the displacement of neutral layer shift along the X-axis can be defined as twist displacement, expressed as
l T = | l i + l e | 2

3.4. FE Analysis of Twist

3.4.1. Simulation Scheme

According to the analysis of twist for roll bending profile in Section 3.3, the twist defects of the profiles in roll bending is mainly affected by the combination of forming radius. Therefore, a numerical simulation test scheme was designed for the comprehensive influence of the radius of upper roll and the stroke of the side roller. Taking the twist of the profiles with extrados target forming radius RT = 1630 mm as a research object, the detailed simulation schemes, as shown in Table 5.

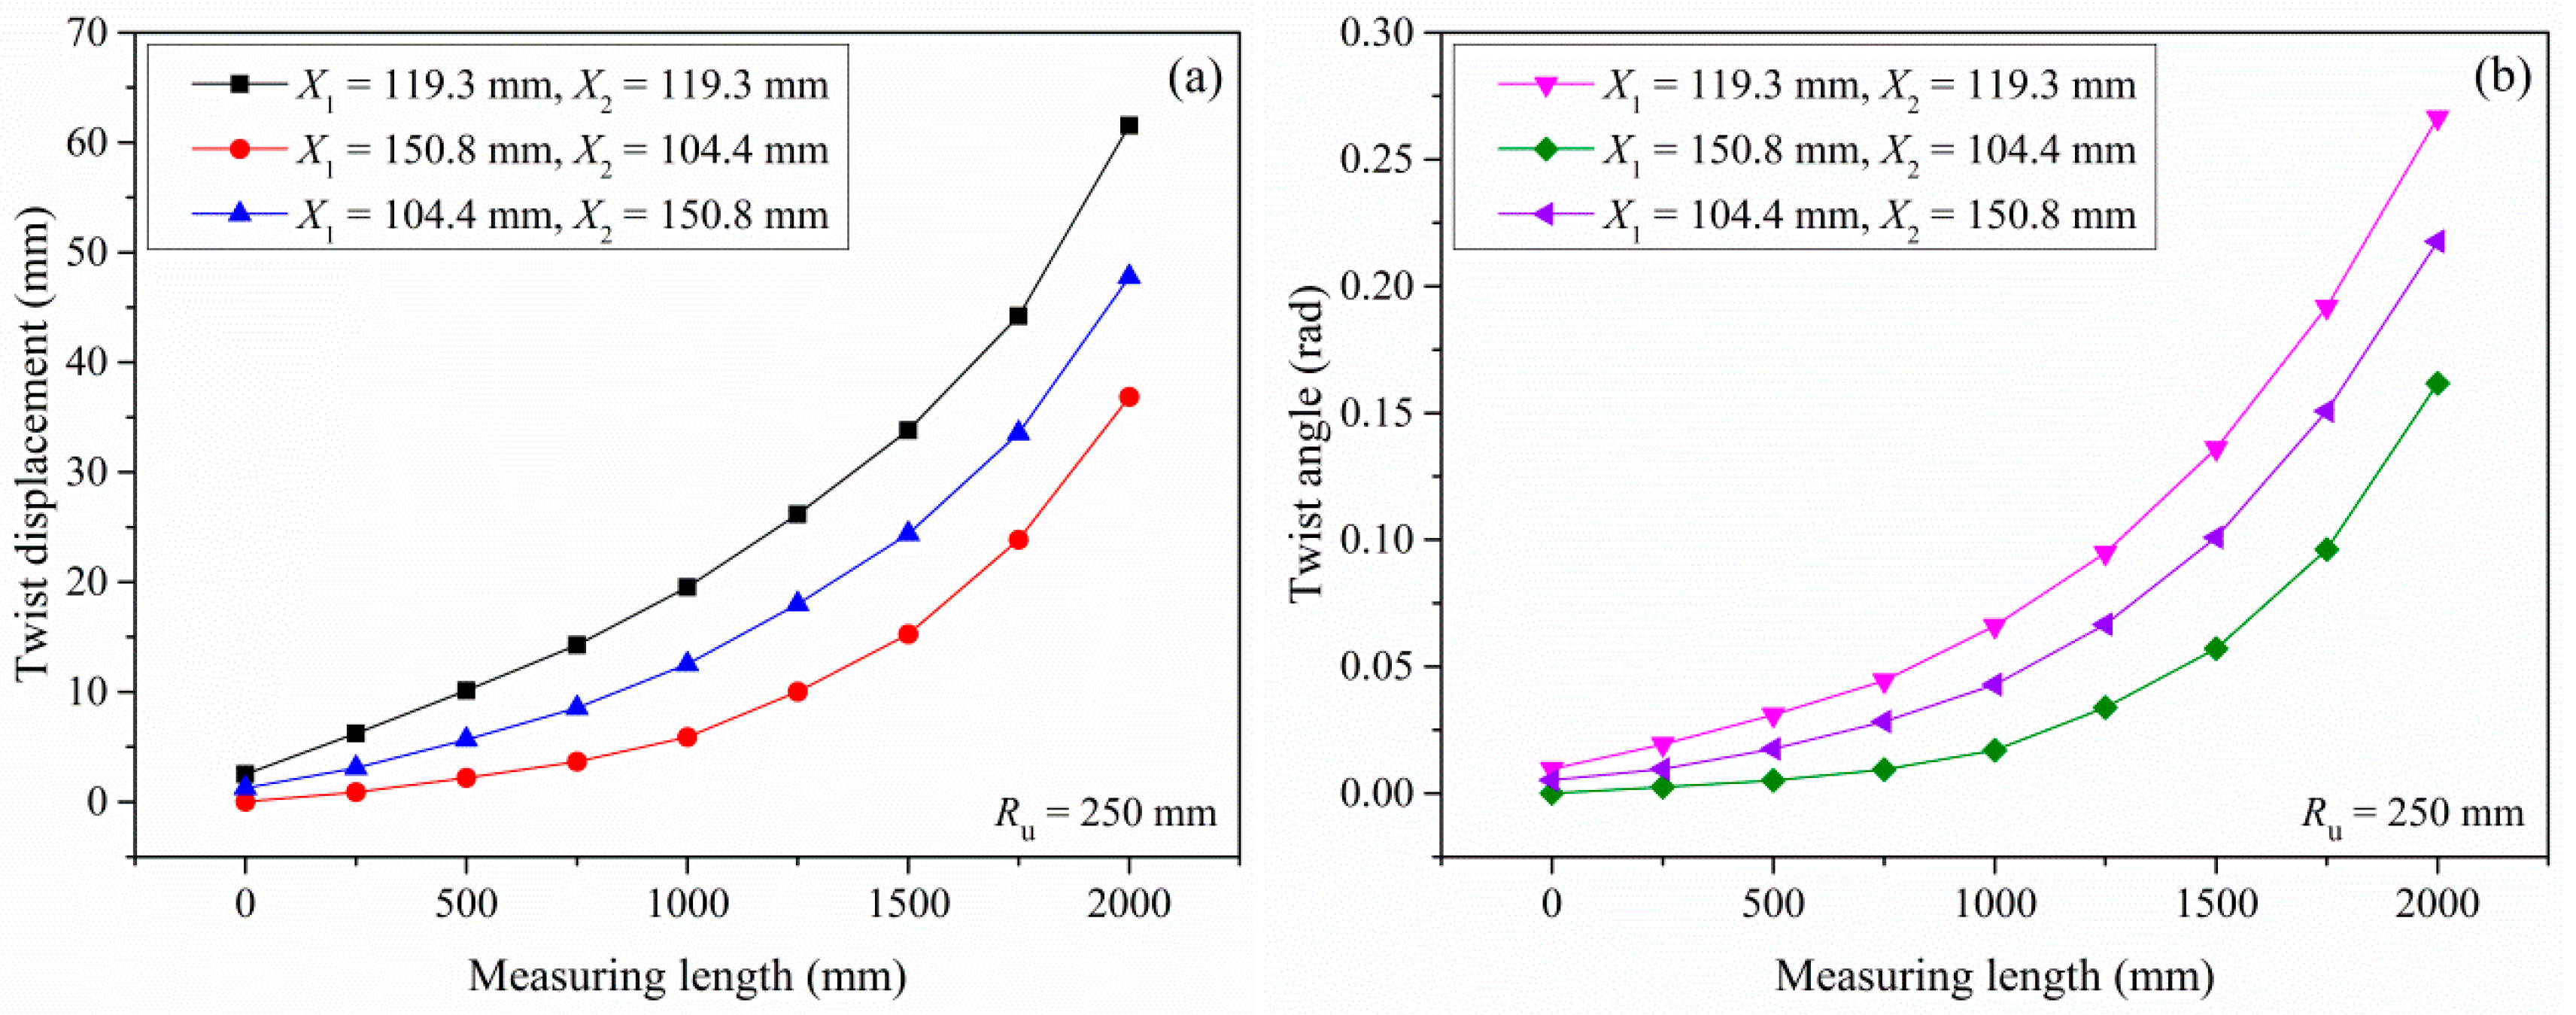
3.4.2. Effect of Loading Pattern of Side Rolls on Twist Defects

For accurate measurement, the corresponding measuring nodes (250 mm per interval) were selected as the measuring point in simulations. In the case of Ru = 220 mm, RT = 1630 mm and the length of bending region profiles was 2000 mm. Detailed simulations results of the twist displacement and twist angle for Z-section profiles, as shown in Figure 10. It can be seen clearly that under the asymmetrical loading patterns, the twist displacement and twist angle were smaller than that obtained value under the symmetrical loading pattern. In the case of asymmetrical loading pattern X1 = 107.2 mm, X2 = 171.5 mm (Scheme 3 in Table 5), the simulation results of twist displacement and twist angle were 56.49 mm and 0.247 rad, respectively. Comparison with the corresponding values 73.45 mm and 0.304 rad obtained by symmetrical loading X1 = X2 = 134.1 mm (Scheme 1 in Table 5) shows that the twist displacement and twist angle decreased by maximum of 23.09% and 18.75%, respectively. While, under the asymmetrical loading pattern that the exit guide roll was adjusted higher than the entrance one (Scheme 2 in Table 5), the twist displacement and twist angle were 40.73 mm and 0.195 rad, comparison with the symmetrical loading shows that both values decreased by 44.54% and 35.86%, respectively.
The simulation results indicate that asymmetrical loading pattern could be used to control twist defects under the same radius of upper roll process conditions. Especially, the exit guide roll was adjusted higher than the entrance one, the twist displacement and twist angle were smaller than the other two loading patterns. The potential reason behind the inhibition function of the asymmetrical loading pattern on twist can be explained by the fact that under this loading condition, more constraints from the upper and lower rolls imposed on the clamping region result in decreasing twist defects.

3.4.3. Effect of the Radius of Upper Roll on Twist Defects

Similar to the asymmetrical loading pattern, based on the methodology that increasing constraint region results in decreasing twist defects, a control strategy with an increased radius of the upper roll was adopted to inhibit twist defects. For the radius of upper roll Ru = 250 mm, detailed simulations results of twist defects for Z-section profiles under three loading patterns, as shown in Figure 11. As can be seen in Figure 11, in the case of the same Ru, for asymmetrical loading pattern that the exit guide roll higher than the entrance one X1 = 150.8 mm and X2 = 104.4 mm (Scheme 5 in Table 5), the twist displacement and twist angle were 36.85 mm and 0.162 rad, respectively. Comparison with the corresponding values 61.56 mm and 0.267 rad obtained by symmetrical loading X1 = X2 = 119.3 mm (Scheme 4 in Table 5), the twist displacement and twist angle decreased by maximum of 40.14% and 39.33%, respectively. While under the same asymmetrical loading pattern, the twist displacement and twist angle were smaller than that obtained for the radius of the upper roll Ru = 220 mm that as illustrated in Figure 10. The justification behind this phenomenon was that when the radius of upper roll was larger, the more constraints from the upper and lower rolls imposed on the clamping region, the more significant inhibitory function on twist defects. Theoretically, the control strategy by increasing the radius of upper roll for twist defects can be described by Equation (1). As the radius of the upper roll increases, the distance D s between the upper roll and the side roll decreases (see Figure 2a), resulting in a decrease in deflection that upon on the twist.
Both Figure 10 and Figure 11 indicated, by the asymmetrical loading pattern, that the exit guide roll was adjusted higher than the entrance one; additionally, if increasing the radius of upper roll was adopted simultaneously, a better inhibitory function on twist.

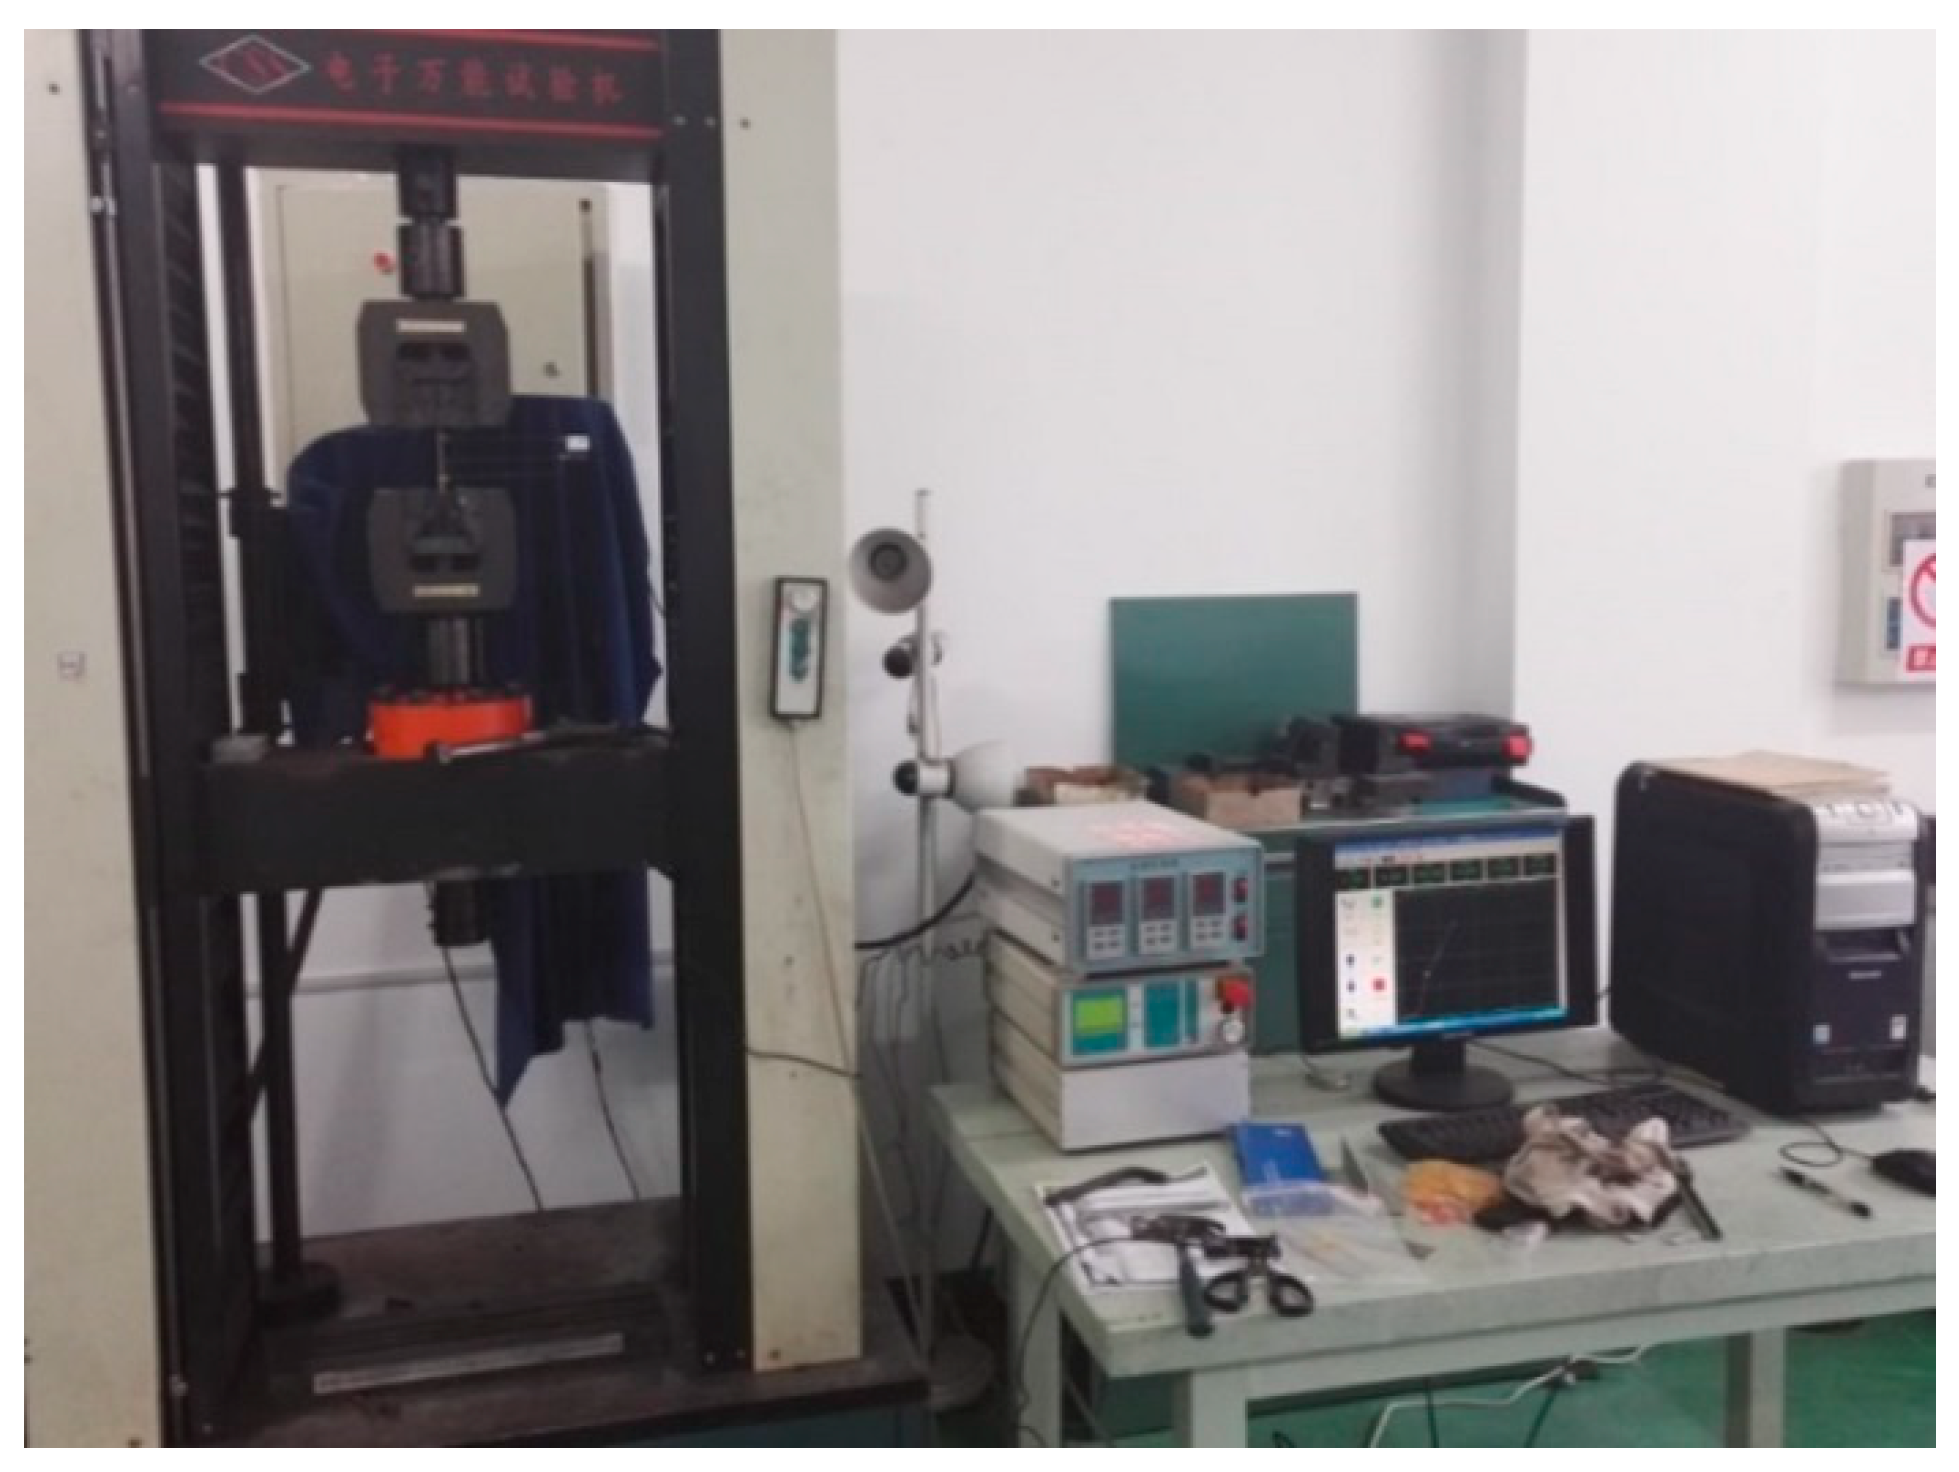
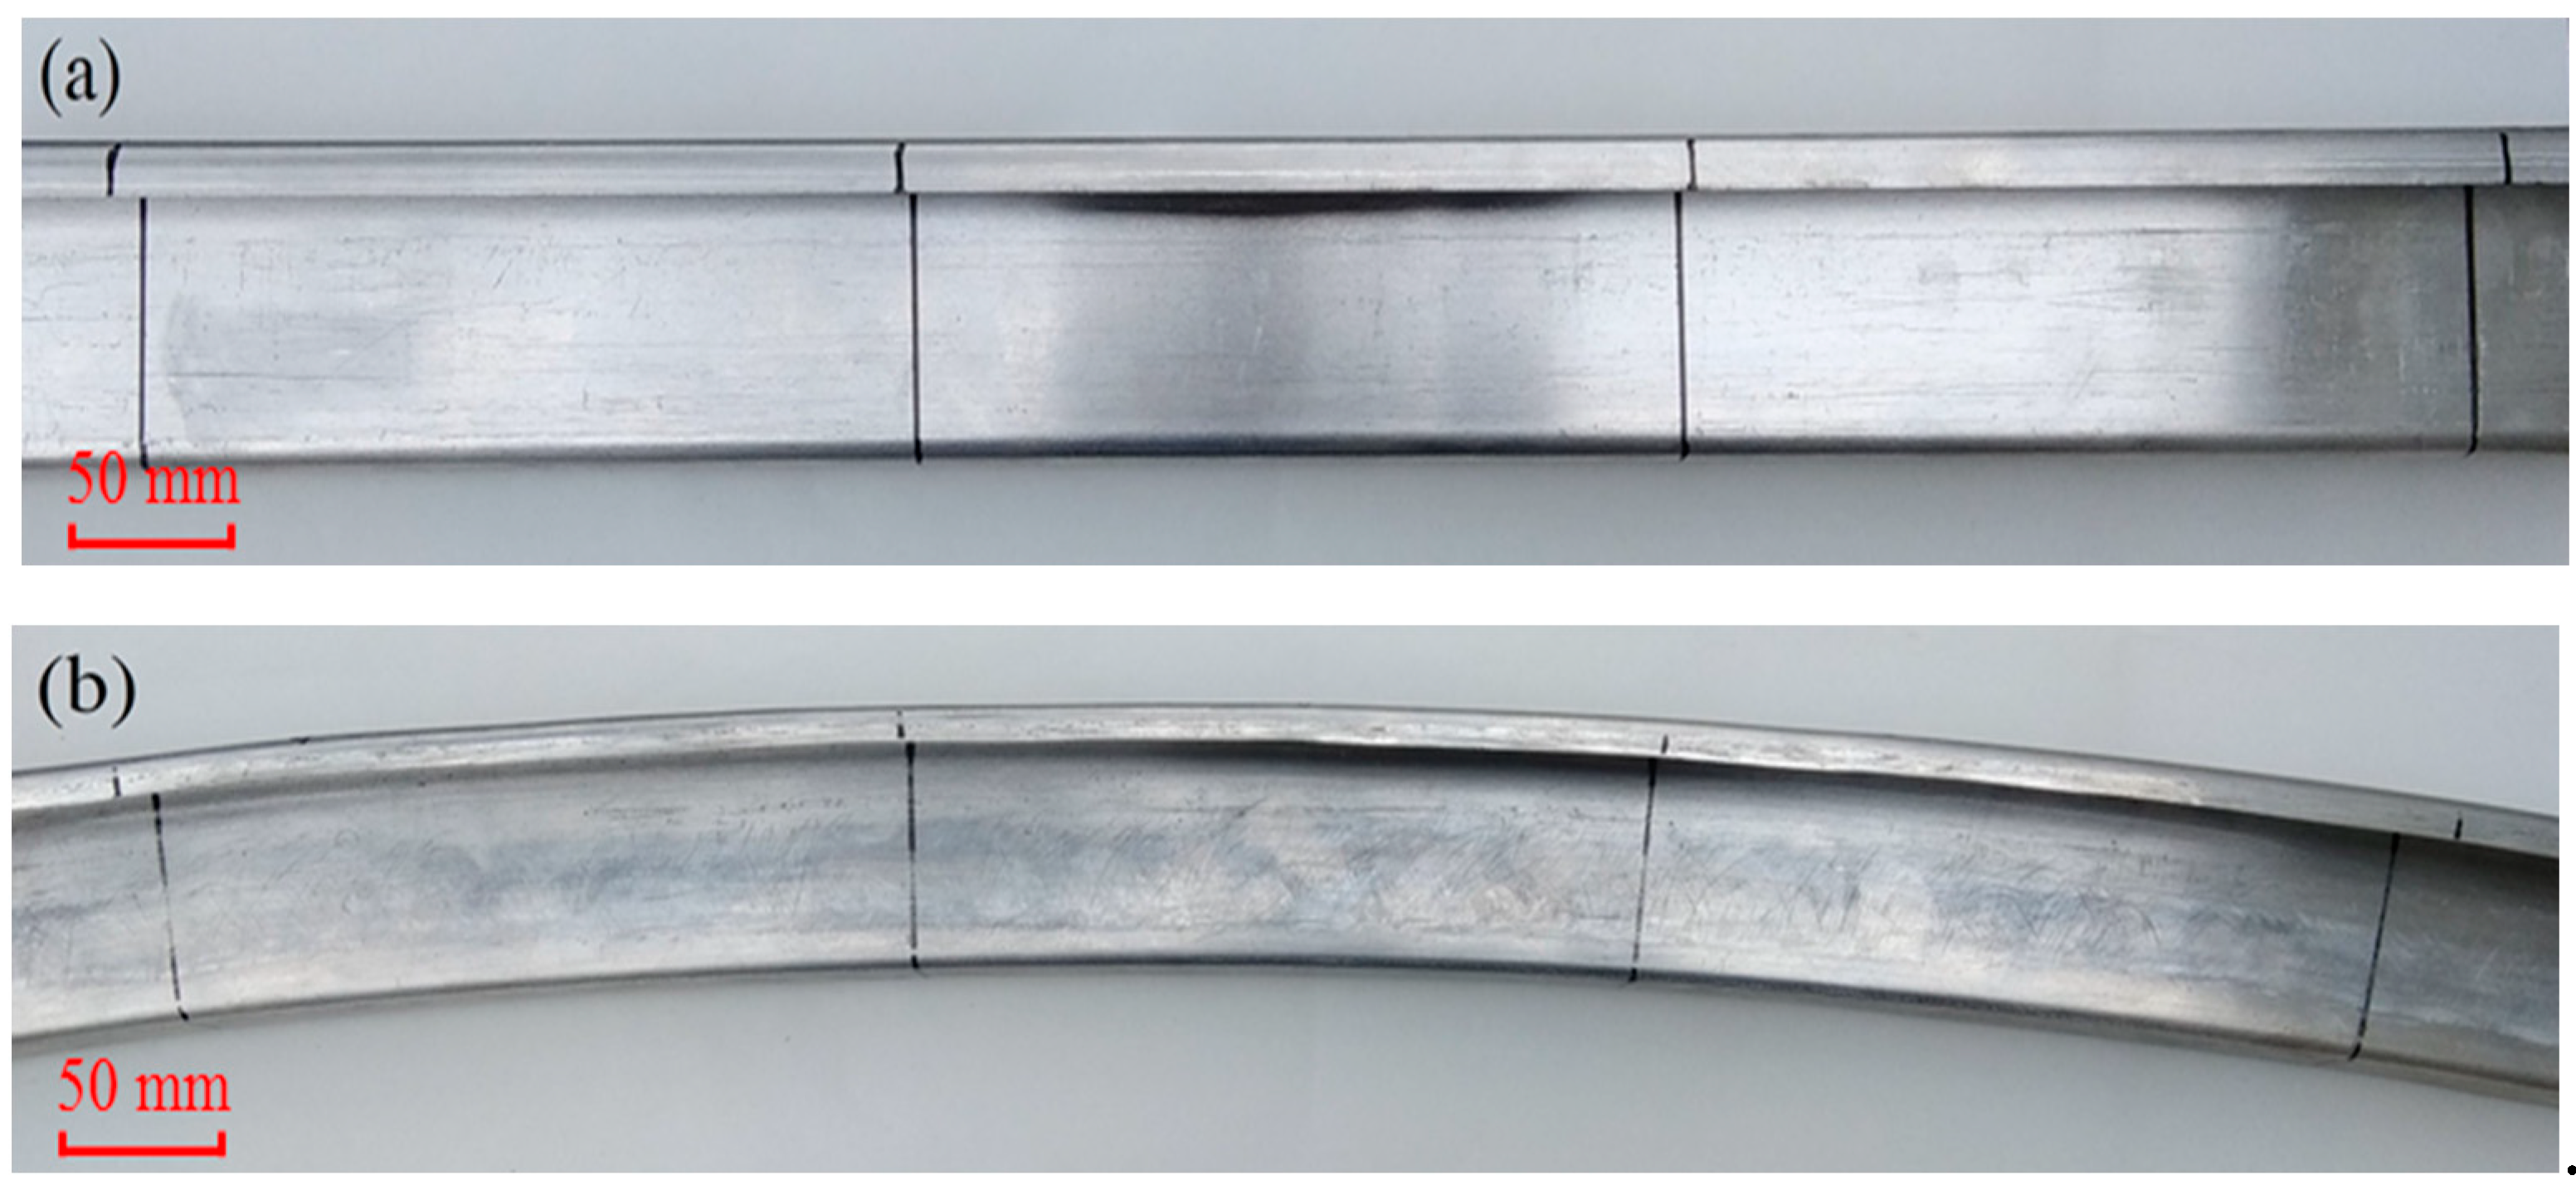
4. Experimental Results and Discussion

4.1. Experimental Procedures

Roll bending tests for Z-section profiles were performed with extrados target forming radius RT = 1630 mm and the length of bending region profiles was 2000 mm. To verify the inhibitory function of loading pattern and the radius of upper roll on twist defects, a series of experiments were carried out for 7075-O aluminum alloy Z-section profiles. A VPR-SPEC-CNC four-roll bending forming machine was adopted (as shown in Figure 2b).
The method of obtaining experimental measurement data and twist calculation were the same as the simulation as illustrated in Section 3.3. In order to guarantee the measuring points RP-1 and RP-2 at the same section before and after roll bending, the length of Z-section profiles before roll bending was divided into multiple intervals with the same length and marked, as shown in Figure 12a. The measuring marks of the local forming workpiece after roll bending as shown in Figure 12b.

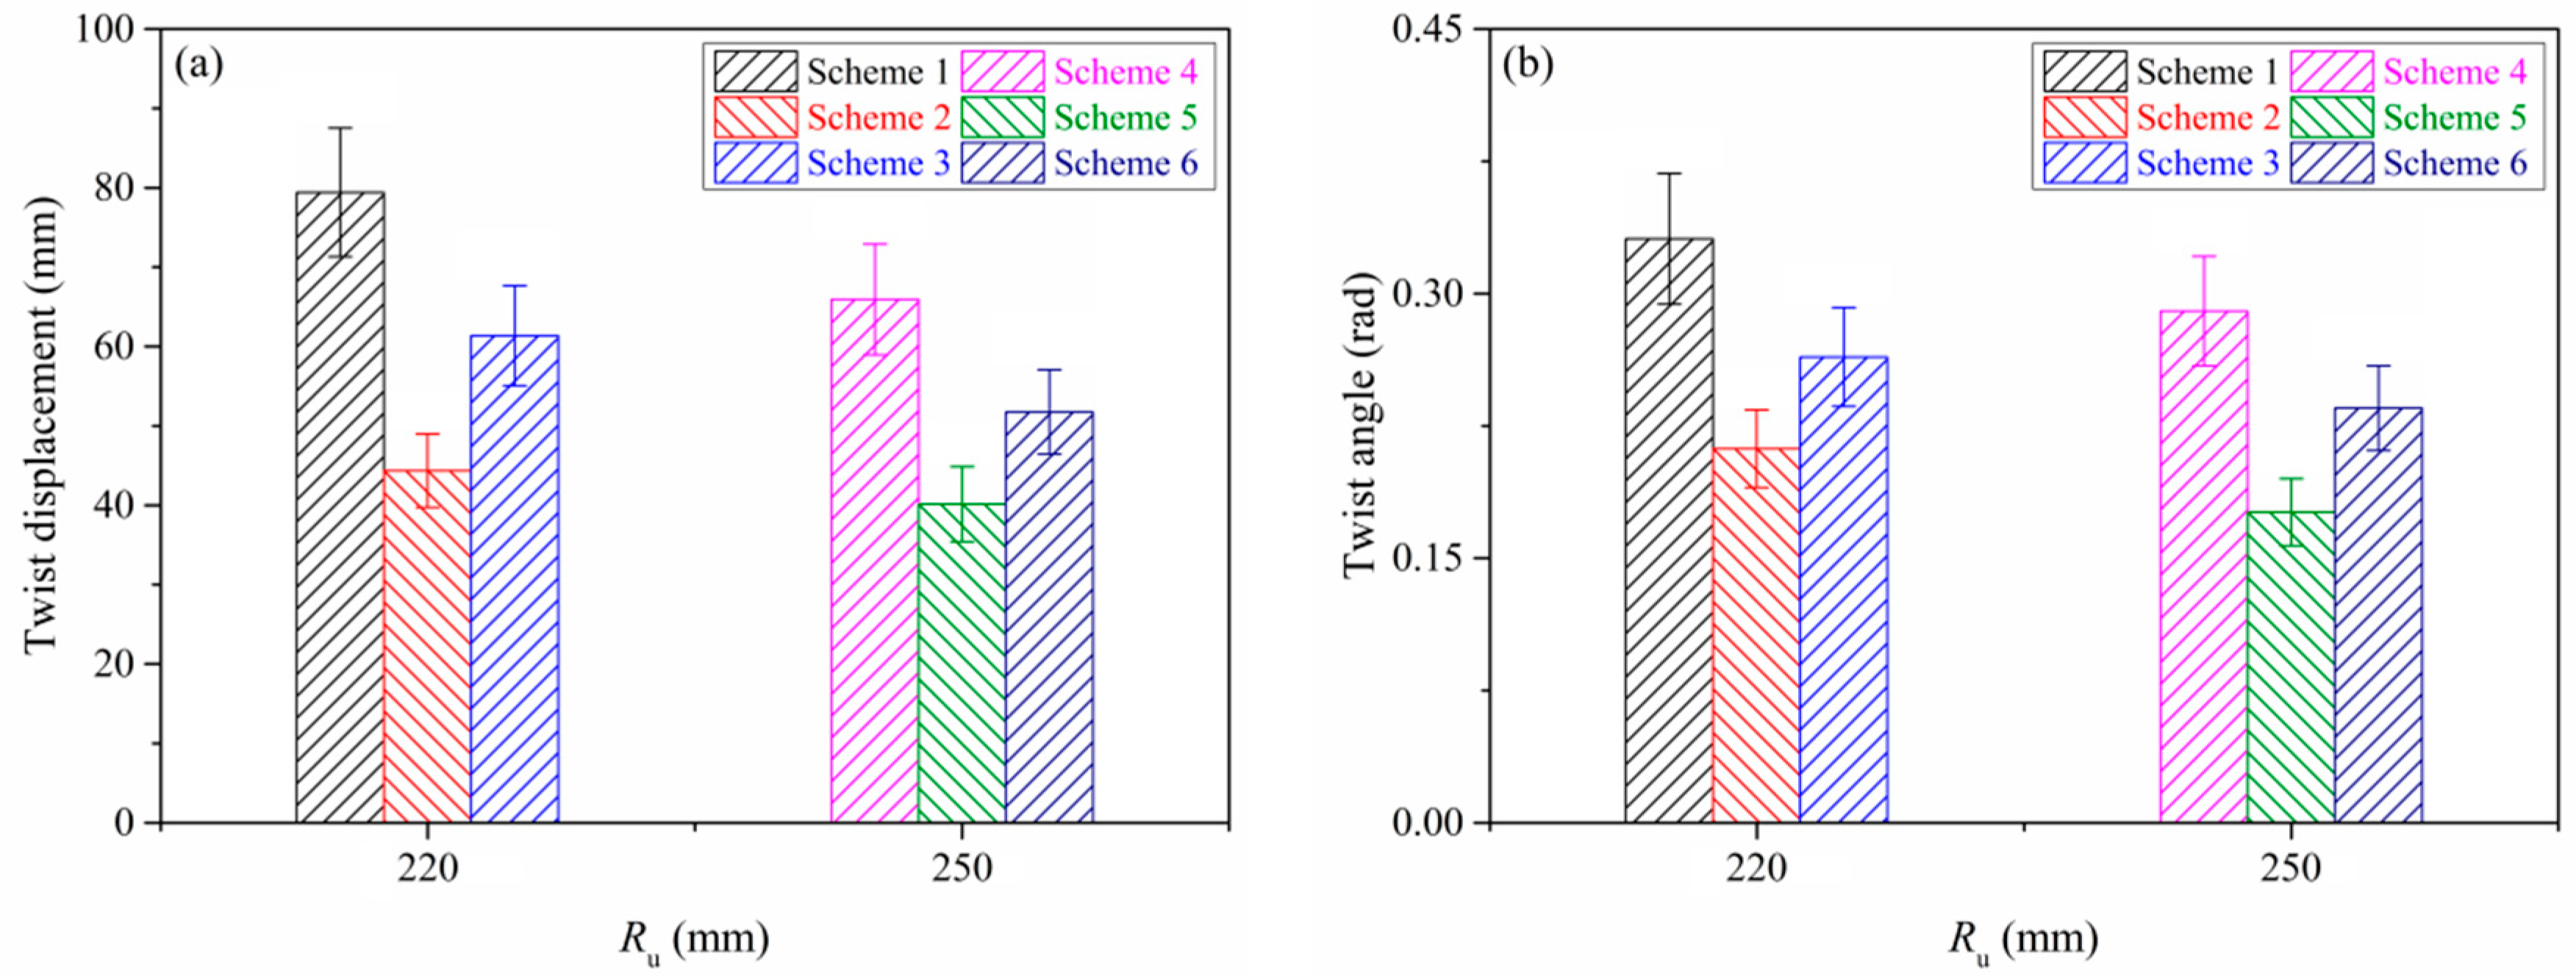
4.2. Validation of the Simulation Model

According to the simulation scheme as shown in Table 5, the corresponding roll bending tests for Z-section profiles were performed to verify the accuracy of the simulation model. Maximum deformation was a criterion for evaluating part forming accuracy, which was often located at the end of the bending region; Figure 13 illustrated the maximum twist displacement and twist angle measured at this region. The comparison with those numerical simulation results of maximum twist displacement and twist angle at the end of the bending region, as shown in Table 6. As can be seen, the maximum prediction error of twist displacement and twist angle were 8.90% and 8.88%, respectively. The comparison analysis indicated that the error between the finite element calculation and experimental measurement results was small and within a reasonable range of 10%. Additionally, the error bars (see in Figure 13) were used to characterize the spread of measurement data, which can be given by
S d = 1 3 i = 1 3 ( m i m ¯ ) 2 ( i = 1 , 2 , 3 )
where, m i is the measurement value, m ¯ is the average value for three measurement values.
In order to compare twist displacement and twist angle between experimental tests and finite element results, Figure 14 shows the detailed evolution of these two variables with measuring length. It can be seen clearly that the simulation results were closer to the experimental tests. The variation trends of both were almost the same under the three loading patterns and the two radii of upper roll. Under the asymmetrical loading pattern, the twist displacement and twist angle were smaller than that obtained under the symmetrical loading pattern. In addition, the error between the experimental and numerical simulation results under asymmetric loading was smaller than that under symmetric loading. Under the asymmetrical loading pattern that the exit guide roll was adjusted higher than the entrance one. The difference between the simulation results and experimental tests was smallest, as more constraints imposed on Z-section profiles in actual roll bending process were more closely to the ideal constraint condition in finite element model. Besides, when the radius of upper roll was Ru = 250 mm, the error between numerical calculation and experimental results was less than that of Ru = 220 mm, as shown in Figure 14, which could be explained by the same reason for asymmetrical loading pattern. Moreover, as the twist displacement and twist angle were calculated numerically under ideal constraint conditions, the error was smaller than the experimental results, but the difference between them was all within a reasonable range. Therefore, the finite element analysis model can be used to predict the twist of the profiles with large Z-section during roll-bending under certain process conditions.

5. Conclusions

In this work, twist defects of Z-section profiles with large cross-section occurring in the four-roll bending process was investigated using experimental and numerical simulation methods. A 3D finite element model for roll bending process was developed by ABAQUS and twist displacement and twist angle were analyzed under different process parameters. Corresponding control strategies including asymmetrical loading pattern and increasing the radius of upper roll for inhibiting twist defects were proposed based on theoretical analysis of twist defects. Finite-element results were verified by comparison with the results of experimental results. The main achievements of this study were as follows:
(1)
The roll bending process was simulated by ABAQUS and twist defects of Z-section profiles were analyzed under different loading patterns and the radius of upper roll. The maximum prediction error of the twist displacement and twist angle compared with the experimental results was within a reasonable range 10%.
(2)
The reason for the twist defects of the profile with asymmetrical section during the roll bending was explained, and the formula for the twist displacement and twist angle were deduced for Z-section profiles.
(3)
The asymmetrical loading pattern can be used to control twist defects. A significant inhibitory function on twist defects was obtained when the exit guide roll was adjusted higher than the entrance one.
(4)
The idea of using a larger radius of upper roll presented in this work was to increase the constraint region between the clamp rolls and profiles that could effectively inhibit twist defects.

Author Contributions

A.W. performed the original draft preparation, data analysis and drawing. H.X. and E.B. supervised the work and discussed the results with the other authors. S.S. provided some advice on the writing of the paper. Y.Y. performed the simulation investigation. The experiment was developed and carried out by P.C. All authors have read and agreed to the published version of the manuscript.

Funding

This research was funded by Natural Science Basic Research Plan in Shaanxi Province of China (No. 2015JM1007), Shaanxi Province Key Research and Development Program (2019KW-063) and 111 Project (Grant No. B13044).

Acknowledgments

The authors gratefully acknowledge the Chengdu Aircraft Company for their support in the roll bending tests.

Conflicts of Interest

The authors declare no conflict of interest.

References

  1. Lou, S.; Zhao, G.; Wang, R.; Wu, X. Modeling of aluminum alloy profile extrusion process using finite volume method. J. Mater. Process. Technol. 2008, 206, 481–490. [Google Scholar] [CrossRef]
  2. Yu, J.; Zhao, G.; Chen, L. Analysis of longitudinal weld seam defects and investigation of solid-state bonding criteria in porthole die extrusion process of aluminum alloy profiles. J. Mater. Process. Technol. 2016, 237, 31–47. [Google Scholar] [CrossRef]
  3. Hua, M.; Baines, K.; Cole, I.M. Continuous four-roll plate bending: A production process for the manufacture of single seamed tubes of large and medium diameters. Int. J. Mach. Tools. Manuf. 1999, 39, 905–935. [Google Scholar] [CrossRef]
  4. Hua, M.; Baines, K.; Cole, I.M. Bending Mechanisms, Experimental Techniques and Preliminary Tests for the Continuous Four-Roll Plate Bending Process. J. Mater. Process. Technol. 1995, 48, 159–172. [Google Scholar] [CrossRef]
  5. Pham, C.H.; Thuillier, S.; Manach, P.Y. Twisting analysis of ultra-thin metallic sheets. J. Mater. Process. Technol. 2014, 214, 844–855. [Google Scholar] [CrossRef]
  6. Cha, W.; Kim, N. Study on twisting and bowing of roll formed products made of high strength steel. Int. J. Precis. Eng. Manuf. 2013, 14, 1527–1533. [Google Scholar] [CrossRef]
  7. Xue, X.; Liao, J.; Vincze, G.; Gracio, J. Twist Springback of Asymmetric Thin-walled Tube in Mandrel Rotary Draw Bending Process. Procedia Eng. 2014, 81, 2177–2183. [Google Scholar] [CrossRef] [Green Version]
  8. Dezelak, M.; Stepisnik, A.; Pahole, I. Evaluation of twist springback prediction after an AHSS forming process. Int. J. Simul. Model. 2014, 13, 171–182. [Google Scholar] [CrossRef]
  9. Xue, X.; Liao, J.; Vincze, G.; Gracio, J.J. Modelling of mandrel rotary draw bending for accurate twist springback prediction of an asymmetric thin-walled tube. J. Mater. Process. Technol. 2015, 216, 405–417. [Google Scholar] [CrossRef]
  10. Ona, H.; Jimma, T.; Fukaya, N. Experiments into the cold rollforming of straight asymmetrical channels. J. Mech. Work. Technol. 1983, 8, 2291–2723. [Google Scholar] [CrossRef]
  11. Takamura, M.; Sakata, M.; Fukui, A.; Hama, T.; Miyoshi, Y.; Sunaga, H.; Makinouchi, A.; Asakawa, M. Investigation of twist in curved hat channel products by elastic-plastic finite element analysis. Int. J. Mater. Form. 2010, 3, 131–134. [Google Scholar] [CrossRef]
  12. Chatti, S.; Hermes, M.; Tekkaya, A.E.; Kleiner, M. The new TSS bending process: 3D bending of profiles with arbitrary cross-sections. CIRP Ann. Manuf. Technol. 2010, 59, 315–318. [Google Scholar] [CrossRef] [Green Version]
  13. Gangwar, M.; Choubey, V.K.; Dwivedi, J.P.; Talukder, N.K.D. Springback analysis of thin tubes with arbitrary stress–strain curves. J. Mech. Eng. 2011, 8, 57–76. [Google Scholar]
  14. Liao, J.; Xue, X.; Lee, M.; Barlat, F.; Gracio, J. On twist springback prediction of asymmetric tube in rotary draw bending with different constitutive models. Int. J. Mech. Sci. 2014, 89, 311–322. [Google Scholar] [CrossRef]
  15. Xue, X.; Liao, J.; Vincze, G.; Pereira, A.B. Control strategy of twist springback for aluminium alloy hybrid thin-walled tube under mandrel-rotary draw bending. Int. J. Mater. Form. 2018, 11, 311–323. [Google Scholar] [CrossRef]
  16. Zhou, Y.; Li, P.; Li, M.; Wang, L. Application and correction of L-shaped thin-wall aluminum in flexible-bending processing. Int. J. Adv. Manuf. Technol. 2017, 92, 981–988. [Google Scholar] [CrossRef]
  17. Yaser, T.; Hassan, M.N.; Roohollah, A.T.; Behrooz, S.B. A strategy to reduce the twist defect in roll-formed asymmetrical-channel sections. Thin. Wall. Struct. 2018, 130, 395–404. [Google Scholar]
  18. Marciniak, Z.; Duncan, J.L.; Hu, S.J. Mechanics of Sheet Metal. Forming; Butterworth-Heinemann: Oxford, UK, 2002. [Google Scholar]
  19. Gandhi, A.H.; Shaikh, A.A.; Raval, H.K. Formulation of springback and machine setting parameters for multi-pass three-roller cone frustum bending with change of flexural modulus. Int. J. Mater. Form. 2009, 2, 45–57. [Google Scholar] [CrossRef]
  20. Liu, Z.; Li, Y.; Anthony, M.P. Experimentl investigation of mechanical properties, formability and force measurement for AA7075-O aluminum alloy sheets formed by incremental forming. Int. J. Precis. Eng. Manuf. 2013, 14, 1891–1899. [Google Scholar] [CrossRef]
  21. Concli, F.; Gilioli, A. Numerical and experimental assessment of the mechanical properties of 3D printed 18-Ni300 steel trabecular structures produced by Selective Laser Melting—A lean design approach. Virt. Phys. Prototyp. 2019, 14, 267–276. [Google Scholar] [CrossRef]
  22. Liu, T.; Wang, Y.; Wang, J.; Wang, S.; Wang, W.; Wu, J.; Xia, X. Springback analysis of Z & T-section 2196-T8511 and 2099-T83 Al–Li alloys extrusions in displacement controlled cold stretch bending. J. Mater. Process. Technol. 2015, 225, 295–309. [Google Scholar]
  23. Hua, M.; Sansome, D.H.; Baines, K. Mathematical modeling of the internal bending moment at the top roll contact in multi-pass four-roll thin-plate bending. J. Mater. Process. Technol. 1995, 52, 425–459. [Google Scholar] [CrossRef]
Figure 1. Z-profiles and its cross-section.
Metals 10 00031 g001
Figure 2. (a) Schematic diagram of four-roll bending. (b) VPR-SPEC-CNC four-roll bending machine.
Metals 10 00031 g002aMetals 10 00031 g002b
Figure 3. Twist phenomenon of profiles after roll bending. (a) Twist phenomenon. (b) Twist displacement and twist angle for section T1-T1 and section T2-T2 respectively.
Metals 10 00031 g003
Figure 4. Supporting reverse force of the side rolls on Z-section.
Metals 10 00031 g004
Figure 5. 3D-FEM of four-roll bending process.
Metals 10 00031 g005
Figure 6. Specimen shape for uniaxial tensile test (Unit: mm).
Metals 10 00031 g006
Figure 7. CSS.44100 electronic universal testing machine.
Metals 10 00031 g007
Figure 8. True stress-strain data of 7075-O for ABAQUS input.
Metals 10 00031 g008
Figure 9. (a) Measuring points. (b) Measuring section distribution. (c) Calculation scheme for twist.
Metals 10 00031 g009
Figure 10. Twist under different loading patterns for Ru = 220 mm: (a) Twist displacement. (b) Twist angle.
Metals 10 00031 g010
Figure 11. Twist under different loading patterns for Ru = 250 mm: (a) Twist displacement. (b) Twist angle.
Metals 10 00031 g011
Figure 12. (a) Measuring section marks before roll bending. (b) Measuring section marks after roll bending.
Metals 10 00031 g012
Figure 13. Experimental results of twist: (a) Twist displacement. (b) Twist angle.
Metals 10 00031 g013
Figure 14. Comparisons of experimental results and simulation results for twist under different loading patterns: (a) Twist displacement for Ru = 220 mm. (b) Twist angle for Ru = 220 mm. (c) Twist displacement for Ru = 250 mm. (d) Twist angle for Ru = 250 mm.
Metals 10 00031 g014
Table 1. Contact interaction between the rolls and profile.
Contact TypeSlip TypeFriction TypeFriction Coefficients
Point and faceLimited slipCoulomb friction0.17
Table 2. Constraint definitions of the model.
ConstraintSpecimenUpper RollLower RollSide Rolls
Displacement (mm)X = 0XYZ = 0XZ = 0Z = 0
Rotation (rad)YZ = 0YZ = 0YZ = 0YZ = 0
X, Y and Z are the coordinate axes of the three-dimensional coordinate system (as can be seen in Figure 5).
Table 3. Chemical compositions of 7075 aluminum alloy [20].
ElementZnMgCuCrFeSiMnTiAl
wt. %5.702.501.700.190.120.080.010.0489.66
Table 4. Mechanical properties of 7075-O aluminum alloy from tension tests.
MaterialYoung’s ModulusYield StrengthTensile StrengthStrength CoefficientHardening IndexPlastic Strain
E ( M P a ) σ s ( M P a ) σ b ( M P a ) K ( M P a ) n ε s
7475-O70289 (5296)88 (6.45)212 (4.08)345 (5.56)0.209 (0.087)0.00295 (0.0003)
Table 5. Process parameters used in the simulation.
Scheme R u   ( mm ) Feed VelocityClamping ForceSide Rolls Stroke (mm)
v   ( mm s 1 ) P (bar) X 1 X 2
12202001.0134.1134.1
2171.5107.2
3107.2171.5
42502001.0119.3119.3
5150.8104.4
6104.4150.8
Table 6. Measured and simulated twist defects at the end of the bending region.
Test Number123456
Twist displacementSimulation (mm)73.4540.7356.4961.5636.8547.75
Experiment (mm)79.4144.3561.3565.9240.1351.73
Error (%)8.118.898.607.088.908.34
Twist angleSimulation (mm)0.3040.1950.2470.2670.1620.218
Experiment (mm)0.3310.2120.2640.2900.1760.235
Error (%)8.888.726.888.498.647.69

