Article

Phase Transformation of a Ti-15Mo-5Zr-3Al Brazed Joint Using Clad Ti-15Cu-15Ni Filler

1
Doctoral Degree Program in Ocean Engineering Technology, National Taiwan Ocean University, Keelung 20224, Taiwan
2
Engineering Training Center, Jiangsu Ocean University, Lianyungang, Jiangsu 222005, China
3
Division of Nuclear Fuels and Materials, Institute of Nuclear Energy Research, Taoyuan 32546, Taiwan
4
Department of Materials Science and Engineering, National Taiwan University, Taipei 10617, Taiwan
5
Department of Optoelectronics and Materials Technology, National Taiwan Ocean University, Keelung 20224, Taiwan
*
Author to whom correspondence should be addressed.
Metals 2020, 10(1), 83; https://doi.org/10.3390/met10010083
Submission received: 23 November 2019 / Revised: 27 December 2019 / Accepted: 2 January 2020 / Published: 3 January 2020

Abstract

:
Furnace brazing of Ti-15Mo-5Zr-3Al (Ti-15-5-3, β-Ti) alloy using clad Ti-15Cu-15Ni foil as the filler in a high vacuum has been carried out. In the brazed joints, the chemical compositions of distinct phases were quantified by electron probe micro-analyzer (EPMA), and the phase structures were identified by electron backscatter diffraction (EBSD). The as-brazed joint composed of α-Ti, retained β-Ti, Ti2Ni, and Ti2Cu. The embrittlement of the brazed joint was correlated mainly with the formation of intermetallics, especially cellular Ti2Ni dendrites in the brazed zone. It was noticed that the molten filler liquated the β-Ti grain boundaries and assisted the eutectic reaction therein, resulting in forming grain boundary Ti2Ni surrounded by the retained β-Ti. The results indicated that proper brazing conditions were able to eliminate all the harmful phases effectively, and increased the shear strength of the Ti-15Mo-5Zr-3Al brazed joint.

1. Introduction

Titanium alloys with excellent specific strength and corrosion resistance are attractive as structural materials used in the aerospace industry [1,2,3,4]. Nowadays, titanium alloys are also applied in many other fields, including the automobile, sport and chemical industries [5,6]. Beta titanium (β-Ti) alloys are known to possess higher cold formability and age-hardening ability than those of alpha + beta (α + β) Ti alloys [7]. It is reported that Ti-15V-3Cr-3Al-3Sn (β-Ti) can be cold-rolled to an 80% reduction in thickness during strip-forming [8]. Ti-15Mo-5Zr-3Al (Ti-15-5-3, β-Ti) alloy with the beta-transus temperature of approximately 1058 K (785 °C) was developed by Kobe Steel [9]. With appropriate thermo- and thermo-mechanical treatments, great changes in the mechanical properties of Ti-15-5-3 alloy can be obtained for different applications [10,11]. Precipitation of the α phase in the β matrix is responsible for the age-hardening of Ti-15-5-3 alloy [10]. Ti-15-5-3 alloy has higher fatigue strength when solution-treated below the beta-transus temperature than when solution-treated above the beta-transus temperature [9]. Excellent fatigue strength of Ti-15-5-3 alloy solution-treated in the alpha/beta region results from higher crack initiation resistance, due to the microstructure, which is composed of primary α phase and a fine β matrix [9]. In addition, Ti-15Mo-5Zr-3Al is reported to be one of the most important biomaterials for orthopaedic implant applications, such as dental implants and artificial hip joints [12,13,14,15,16,17].
The joining of titanium alloys is an important issue for the assembly of different components into devices, and the various joining methods include arc welding, high energy density beam welding, solid state welding and brazing. Traditionally, titanium alloys can be welded by tungsten inert gas arc, laser beam, and electron beam welding processes [18,19,20,21]. Joining the components by brazing is advantageous because it introduces very low distortion into the components when furnace-heating is applied [22,23]. Moreover, brazing is extensively used for joining dissimilar alloys, especially in cases of metallurgical heterogeneity in dissimilar fusion welds, which may cause premature cracking. In the open literature, titanium alloys have been successfully brazed for different applications. For examples, commercially available titanium alloys (Ti2, Ti4, Ti64, Ti6242) are brazed using Ag28Cu as a filler for aeronautic components [24]. Medical titanium and alumina are joined with Au foil for implantable devices [25]. Cu-based amorphous filler is used for brazing TiAl alloy for high temperature applications [26].
The use of Ti-based fillers to braze Ti alloys has become an important issue nowadays, because the brazed joint features with better corrosion resistance and mechanical properties [27]. Ti-Cu-Ni-(Zr) and Ti-Ni-Nb brazed joints have been widely evaluated in previous studies [28,29,30]. It is reported that the formation of Ti-Cu/Ti-Ni intermetallic compounds deteriorates joint strength [28,29,30]. Additionally, these harmful compounds present in the brazed joint is strongly affected by the types of base metals. Because the β-Ti demonstrates higher solubility in dissolving Cu and Ni than α-Ti does, Ti-Cu/Ti-Ni compounds are prone to be dissolved in the β-Ti matrix with increasing the brazing temperature and/or time [28,29,30]. However, the coarse-grained structure of the Ti substrate will exhibit poor mechanical properties of the brazing temperature exceeds 1273 K (1000 °C) [30]. To achieve a reliable brazed joint for industrial application, the brazed temperature is considered to be kept below 1273 K (1000 °C) with a minimum brazing time period
In this study, Ti-15-5-3 alloy was brazed using clad Ti-15Cu-15Ni foil as the filler in a high vacuum furnace (5 × 10⁻⁵ Pa) to avoid contamination by the external atmosphere. In an attempt to achieve a high-strength joint, the impact of brazing time periods was investigated under a fixed brazing temperature of 1243 K (970 °C) in this work. The evolution of the microstructures, particularly the elimination of detrimental intermetallic compounds in the brazed joint, was investigated by using a scanning electron microscope (SEM) and an electron-probe microanalyzer (EPMA). The different phases in the joint were identified by electron backscatter diffraction (EBSD) and high-power X-ray diffractometer (XRD). The fracture features of the shear-fractured samples were examined with an SEM, and the causes of shear fracture were further related to the inherent microstructures of the brazed joint.

2. Materials and Experimental Procedures

The base metal (BM) with dimensions of 10 mm (L), 10 mm (W), and 3 mm (T) used in this study was wire-cut from a Ti-15-5-3 rod with a diameter of 17 mm. The measured composition in wt.% of Ti-15-5-3 was 15.0 Mo, 5.3 Zr, 3.0 Al and Ti balance, or 8.1 Mo, 3.0 Zr, and 5.6 Al in at%. Before the brazing experiments, all brazed surfaces were ground by SiC papers up to grit 600. The brazing filler was clad Ti-15Cu-15Ni (in wt.%) foil with a thickness of 50 μm. All samples were ultrasonically cleaned by ethanol before brazing. The Ti-15Cu-15Ni filler was pre-placed between two Ti-15-5-3 substrates and assembled into a sandwich structure. The liquidus temperature of the Ti-15Cu-15Ni foil is 1233 K (960 °C) [31,32,33]. The brazing temperature of 1243 K (970 °C) was selected with 10 K above its liquidus temperature in order to ensure complete melting of the clad filler during the initial stage of brazing. The brazed joint was placed into the furnace and pre-vacuumed to 5 × 10⁻⁵ Pa. The heating rate was about 20 °C/min, and holding the temperature at 1073 K (800 °C) for 600 s to maintain a uniform sample temperature. A thermocouple was in contact with the graphite fixture during brazing. Brazing was performed under high vacuum at 1243 K (970 °C) for 180 s (3 min), 600 s (10 min), and 1800 s (30 min), respectively. Based on the brazing time, the samples were designated as B3, B10 and B30, accordingly. The purpose of increasing the brazing time period from 180 s to 1800 s was to study the microstructural evolution of brazed joints, and the impact of brazing time was unveiled.
The brazed samples were taken out of the furnace after cooling to ambient temperature. For metallographic examinations, the brazed samples were sliced by a diamond saw, and subjected to a standard metallographic preparation. Microstructures of brazed joints were inspected by using a Hitachi 3400 scanning electron microscope (SEM, Hitachi Ltd., Tokyo, Japan) in backscatter electron (BSE) image mode. The chemical compositions of various phases in brazed joints at selected sites were determined by using the JEOL JXA-8200 superprobe electron probe micro-analyzer (JEOL Ltd., Tokyo, Japan). The minimum spot size is about 1 μm, and it operates at 15 kV. The reaction products in the brazed joint were identified by using an X-ray diffractometer (Panalytical X’Pert Pro MPD, PANalytical, Malvern, UK) with Cu Kα radiation. Selected brazed joints were examined by an SEM (JSM-7100F, JEOL, Tokyo, Japan), which was equipped with the NordlysMax2 electron backscatter diffraction (Oxford Instruments, Abingdon, UK) detector to identify various phases in the brazed joint. The sample for the shear test was in the configuration of a double lap joint, which was held by a graphite fixture during brazing as illustrated in Figure 1a. A light force was applied to clamp the brazed specimen, which could maintain the specimen configuration until the filler metal was solidified. To keep the substrate and filler in tight contact during brazing, low stress approximately below 0.1 MPa at room temperature between the components was applied, which was exerted by a pair of screws. Too high clamping stress would squeeze out a large amount of molten filler out of the brazed zone. Shear tests of brazed joints were performed by using a universal tensile test machine (AG-IS, Shimadzu Crop., Kyoto, Japan) under a compressive crosshead speed of 0.017 mm/s. Figure 1b displayed the schematic diagram of the shear test. Shear strength was obtained from the maximum applied force divided by the total brazed area (two red lines in Figure 1b). Shear strength of a specific sample was the average of at least three tests, and standard deviation of three data was calculated. The fractured surface appearance and cross-sections of the shear test specimens were examined by using the Hitachi 3400 SEM and JEOL JXA-8200 EPMA (JEOL, Tokyo, Japan).

3. Results and Discussion

3.1. Microstructural Observations and Chemical Composition Determinations

Figure 2a shows the sandwich structure of the brazed joint in a cross-section view. There are two different regions, center and edge, in the joint. An optical micrograph displaying the whole joint cross section after brazing is included in Figure 2b. Figure 3a displays the schematic diagram of the clad filler used in this work. The clad filler foil was manufactured by thin cladding layers of Cu and Ni foils on Ti substrate. Figure 3b, c are BSE-SEM micrographs of the clad filler and the corresponding element line-scans, respectively. As shown in Figure 3b, the clad Ti-15Cu-15Ni filler had a sandwich structure (Ni-Cu-Ni) with the cladding of approximately 9 μm in thickness on both sides of the Ti foil. This structure was confirmed by the compositional line scans, shown in Figure 3c.
The brazed sample was sectioned normal to the brazed joint and subjected to metallographic preparations. To highlight the contrast of distinct phases present in the brazed joint, the microstructures were imaged by BSE-SEM. Figure 4 reveals the variation in cross-sectional microstructures around the brazed zone brazed at 1243 K for various time periods. The brazed zone microstructures of distinct samples in the center portion of the brazed joints (as indicated in Figure 2) are shown in Figure 4a–c. The results indicated that increasing the brazing time caused great changes in microstructure in the brazed zone. The bright phase was found to reduce in size and even vanish when the brazing time was increased to 30 min (1800 s). Moreover, the needle-like precipitates in the B3 sample (Figure 4a) became very indistinct in the B10 sample (Figure 4b), and they were difficult to observe in the B30 sample (Figure 4c). It was deduced that increasing the brazing time assisted the uniform distribution of alloying elements in the brazed zone and caused the formation of a homogeneous microstructure in the Ti-15-5-3 brazed joint.
The molten filler foil assisted the dissolution of Ti-15-5-3 substrate into the brazed zone, resulting in causing the dilution of Cu and Ni in the melted braze. As shown in Figure 4a, the cross-sectional thickness of a brazed zone, including the central white phase and the needle-like precipitate region was less than 25 μm. It seemed that the width of the brazed zone was narrower than the thickness of the filler foil. In fact, the brazed zone also contained the region of Ti-rich phase alloyed with Cu, Ni, Al, Mo and Zr. It is noted that the Ti-rich phase lacked a sharp interface between the brazed zone and Ti-15-5-3 substrate. Besides, a certain volume fraction of molten braze was pressed to flow out to the external surface of the joint during brazing. Such event also accounted for the width of the brazed zone was narrower than the thickness of the filler foil. The complex phases present in the narrow brazed zone were hard to be identified by XRD in cross-sectional view. Therefore, the B3 sample was cut parallel and close to the brazed interface. The cut samples were ground gradually to remove the materials and then polished for further XRD structural analysis. Figure 5 displays the XRD pattern of the brazed zone in the B3 sample. The brazed zone consisted of predominantly Ti2Ni mixed with Ti2Cu and β-Ti, along with a little α-Ti. It was deduced that the formation of Ti-Ni and Ti-Cu intermetallic compounds was harmful to the structural reliability of a Ti-15-5-3 joint brazed with the Ti-15Cu-15Ni filler if the detrimental phases were not removed under the proper brazing conditions.
Figure 6 displays the cross-sectional microstructures around the brazed zone in BSE images of the B3 sample; the associated compositions determined by using EPMA at specific sites in Figure 6 are listed in Table 1. The brazed zone, as confirmed by the XRD pattern in Figure 5, composed of several different phases. The bright phase (marked 1) with 26.4 at% Ni was expected to be Ti2Ni intermetallic compound. The dark area marked 2, alloyed with Mo, Zr and Al from the BM, was expected to be retained β-Ti, as later confirmed by EBSD structural analysis. The chemical composition of the weave-like structure (marked 3) contained moderate amounts of Ni (6.2 at%), Cu (7.2 at%) and Mo (3.0 at%). This structure was associated with the eutectoid decomposition of β-Ti into α-Ti and Ti2Cu. The chemical composition of the Ti-15Cu-15Ni in at% was 12.1Cu, 13.1Ni and the balance Ti. The composition of Ti-15Mo-5Zr-3Al in at% was 8.1Mo, 3.0Zr, 5.6Al and the balance Ti. At location 4, approximately 35 μm from the centerline of the brazed zone, the material consisted of slightly lower concentrations of Al, Mo and Zr as compared with the Ti-15-5-3 base metal, but it was alloyed with minor Ni and Cu ingredients from the braze alloy. Moreover, Ni and Cu were not detected at distances greater than 40 μm from the fusion boundary of the brazed joint.
It was noticed that the brazed zone microstructure near the edge (as illustrated in Figure 2) of the B3 sample was different from that in the center portion of the joint. Distinct intermetallic compounds were found at different positions of the brazed zone. In addition to the white phase, there was a grey phase formed in the edges of the brazed zone, as shown in Figure 6b. The chemical composition of the coarse grey phase (marked 5) contained a high Cu concentration. It was identified as Ti2Cu as well be demonstrated below. By contrast, the white phase with 26.2 at% Ni (marked 6) was associated with the Ti2Ni. According to the Cu-Ni-Ti ternary alloy phase diagram, Ti2Cu dissolves more Ni than Ti2Ni dissolves Cu [34]. This is consistent with the experimental result.
Figure 7 shows BSE-SEM micrographs of the brazed zone at different locations in the B3 sample cut parallel to the brazed interface. Table 2 lists the EPMA quantitative analysis of the selected positions indicated in Figure 7. As shown in Figure 7a, many cellular dendrites were observed in the central brazed zone. Its composition (marked 1) was rich in Ni at 27 at% and expected to be Ti2Ni. The gray phase (marked 2) adjacent to the Ti2Ni was alloyed with a low Ni concentration but a high Mo content as compared with the Ti2Ni intermetallic compound (marked 1). It was deduced that the gray phase adjacent to the cellular Ti2Ni dendrites was the retained β-Ti.
A change in microstructure was observed between the center and edge of the brazed zone. As shown in Figure 7b, columnar dendrites mixed with white patches were found mainly at the edge of the brazed zone. According to Table 2, the gray phase (marked 4) could be the solidified Ti2Cu, and the white phase (marked 3) could be the solidified Ti2Ni. Those fine pores, shown in Figure 7b, were likely solidification shrinkage voids. Next to the central brazed zone, the solidified microstructures were coarse patches of white zones mixed with minor patches of gray zones in between, as well as the weave-like structure in Figure 7c. The white zones were confirmed to be rich in Ni (marked 5) and are expected to be Ti2Ni. Meanwhile, the gray zones (marked 6) embedded in Ti2Ni were enriched in Cu and Ni but lean in Mo, Al and Zr. The gray zones were associated with the formation of Ti2Cu. The chemical composition of the weave-like structure (marked 7), consisting of moderate Ni, Cu and Mo, was similar to that of location 3 in Figure 6a. The weave-like structure was related to the eutectoid transformation of β-Ti, as will be proven in the following EBSD structural analyses.
As shown in Figure 7d, chain-island coarse white precipitates were found along all the grain boundaries. The grain boundary precipitate (marked 8) had high Ni content, whereas, the position adjacent to the grain boundary possessed a relatively low Ni concentration. It was deduced that the grain boundary Ti2Ni was surrounded by a thin layer of β-Ti (marked 9). The presence of eutectoid (marked 10) inside the grain likely resulted from eutectoid transformation of β-Ti in the cooling cycle of the brazing.

3.2. EBSD Phase Identifications

Figure 8 shows the EBSD phase maps of brazed zones brazed at 1243 K for different time periods. The bright phase aligned in the center portion of the brazed zone in Figure 6a was identified to be the Ti2Ni compound (yellow phase in Figure 8a). A thin layer of a precipitate-free zone adjacent to the central Ti2Ni (marked 2 in Figure 6a) was confirmed to be the β-Ti (white phase in Figure 8a). The EBSD phase map also revealed that the eutectoid of Ti2Cu and α-Ti in the transformation zone (approximately 10 μm in width) adjacent to the Ti2Ni compound exhibited the weave-like structure, shown in Figure 6a. Moreover, some retained β-Ti in the transformation zone was mixed with the eutectoid. As compared with the B3 sample, the amount of Ti2Ni and the eutectoid of α-Ti and Ti2Cu in the B10 sample decreased greatly when the brazing time was increased. For the B30 sample in Figure 8c, the grain boundary Ti2Ni and eutectoid within the grain almost disappeared from the brazed zone, and the β-Ti dominated the entire brazed joint. It was deduced that the Ti2Ni compound and eutectoid were too fine to be resolved by Kikuchi lines in the EBSD analysis. The eutectoid Ti2Cu (blue phase in Figure 8a) changed into dense but isolated fine precipitates (Figure 8b). Further increasing the brazing time caused most of the Ti2Ni to dissolve into the β-Ti matrix (Figure 8c). This dissolution implied that the rapid diffusion of Ni and Cu in the brazed zone into the Ti-15-5-3 substrate caused the removal of intermetallics when the brazing time was prolonged.

3.3. Shear Strength Measurements and Fracture Feature Observations

Table 3 lists the shear strengths of different samples. It was clear that the shear strength of the brazed joint increased when the brazing time was prolonged. The difference in shear strength values between the B3 (310 MPa) and B30 (427 MPa) samples could be up to 117 MPa, almost 40% of the lowest shear strength. Therefore, proper brazing conditions were able to effectively improve the reliability of the Ti-15-5-3 joint using clad Ti-15Cu-15Ni filler. Yield strength of Ti-15-5-3 was between 870 and 968 MPa [35]. According to maximum-distortion-energy theory [36], shear strength of 427 MPa is equivalent to tensile yield strength of 740 MPa, which is a little lower than that of forged Ti-15-5-3 alloy.
Figure 9a–c present BSE-SEM micrographs showing the microstructures of the fracture zone. Figure 9d–f displays the fracture appearance of various samples in a secondary electron image (SE image). The chemical compositions of selected areas in Figure 9 are listed in Table 4. As shown in Figure 9a, the cracks tended to mainly propagate along the Ti2Ni intermetallics in the brazed zone of the B3 sample. According to the image contrast, the brittle fracture was expected to be associated with the fracture of Ti2Ni in the B3 sample. The fracture surface of the B3 sample displayed predominantly small facets mixed with a flat fracture feature, indicating transgranular fracture, due to intra- and inter-granular Ti2Ni compounds. The facets (zone 1 in Figure 9d) had a high Ni content, which was related to the solidified Ti2Ni. Grain boundary precipitates having a high Ni concentration (zone 2 in Figure 9d) were also expected to be Ti2Ni.
With increased brazing time, the reduced amounts of intermetallics in the B10 sample decreased the possibility of crack growth along the coarse intermetallics, as shown in Figure 9b. It was noticed that thin intermetallic layers were more likely to be found along the β-Ti grain boundaries. The fracture surfaces showed mainly intergranular fracture (Figure 9e), which was related to the presence of grain boundary intermetallics. At zone 3 in Figure 9e, the high Ni concentration at the surface of the intergranular cracks was associated with the precipitation of Ti2Ni along grain boundaries. As mentioned above, all the brittle phases in the B30 sample were nearly dissolved into the β-Ti matrix, as displayed in Figure 4c and Figure 8c. Fracture of the brittle intermetallics was difficult to observe on the fracture surface (Figure 9c). Ductile dimple fracture was noted after shear fracture of the B30 sample (Figure 9f). The chemical composition of the fracture surface (zone 4 in Figure 9f) was consistent with the nominal composition of the Ti-15-5-3 substrate.

3.4. Formation and Dissolution of Ti2Cu/Ti2Ni Intermetallics in the Brazed Joint

The XRD pattern showed that a mixture of predominant Ti2Ni with Ti2Cu and β-Ti and a little α-Ti formed in the brazed zone of the B3 sample, which accounted for its low average shear strength. BSE-SEM micrographs of the microstructures of the brazed zones of the B3 samples revealed the solidification of Ti2Ni cellular dendrites embedded in β-Ti matrix in the center portion of the brazed zone (Figure 7a). By contrast, primary Ti2Cu dendrites, as well as interdendritic Ti2Ni, were more likely to be observed at the edges of a brazed zone (Figure 7b). It was deduced that Ti2Ni intermetallics formed in the early stage of solidification in the brazed zone. After that, higher amounts of Cu and few Ni segregated to the edges of the brazed zone, which led to the formation of greater amounts of dendritic Ti2Cu therein. A few solidification shrinkage voids, as seen in Figure 7b, confirmed the late solidification at the edges relative to the center of the brazed zone.
As shown in Figure 7d, continuous Ti2Ni compounds were observed along the β-Ti grain boundaries. The lowest eutectic temperature in the Ti-Ni binary alloy phase diagram is 1215 K, and the melting point of Ti2Ni is 1257 K [37]. In the sample brazed at 1243 K, the melted braze enriched in Ni preferentially liquated the grain boundaries of the Ti-15-5-3 substrate, resulting in forming Ti2Ni precipitates at the grain boundaries, as shown in Figure 7d. Those Ti2Ni precipitates at the grain boundaries were responsible for the inferior shear strength of the B10 sample relative to that of the B30 one. In this study, the complete dissolution of brittle Ti2Cu/Ti2Ni compounds into the Ti-15-5-3 substrate effectively increased the shear strength of the Ti-15-5-3 joint brazed with clad Ti-15Cu-15Ni foil as the filler.
Evaluation of a Ti-brazed joint cannot simply count on the results of the shear test. The average shear strength of a brazed β-Ti (Ti-15-3), using the clad 40Ti-35Ni-25Nb (wt.%) foil brazed at 1473 K for 600 s, was 575 MPa. It was noticed that the average grain size of Ti-15-3 substrate was greatly coarsening to approximately 250 µm [30]. The brazing temperature should be confined to below 1273 K to avoid excessive grain growth of the base metal. The average grain size of Ti-15-5-3 after brazing at 1243 K for 1800 s was approximately 100 µm, which was much smaller than that of Ti-15-3 in a study. On the other hand, the presence of the intermetallic phase(s) was fatal to the brazed joint under fatigue application in brazing the titanium alloy. Therefore, a longer brazing time is needed to dissolve all the harmful Ti-Ni/Ti-Cu intermetallics into the substrate. However, increasing the brazing temperature and/or time may cause excessive grain growth in the base metal. Therefore, the combinations of proper brazing filler and optimal brazing parameters can make a Ti-brazed joint of reliable quality.

4. Conclusions

Vacuum-brazing of Ti-15Mo-5Zr-3Al alloy with clad Ti-15Cu-15Ni foil as the filler has been performed. Important conclusions are summarized below:
(1)
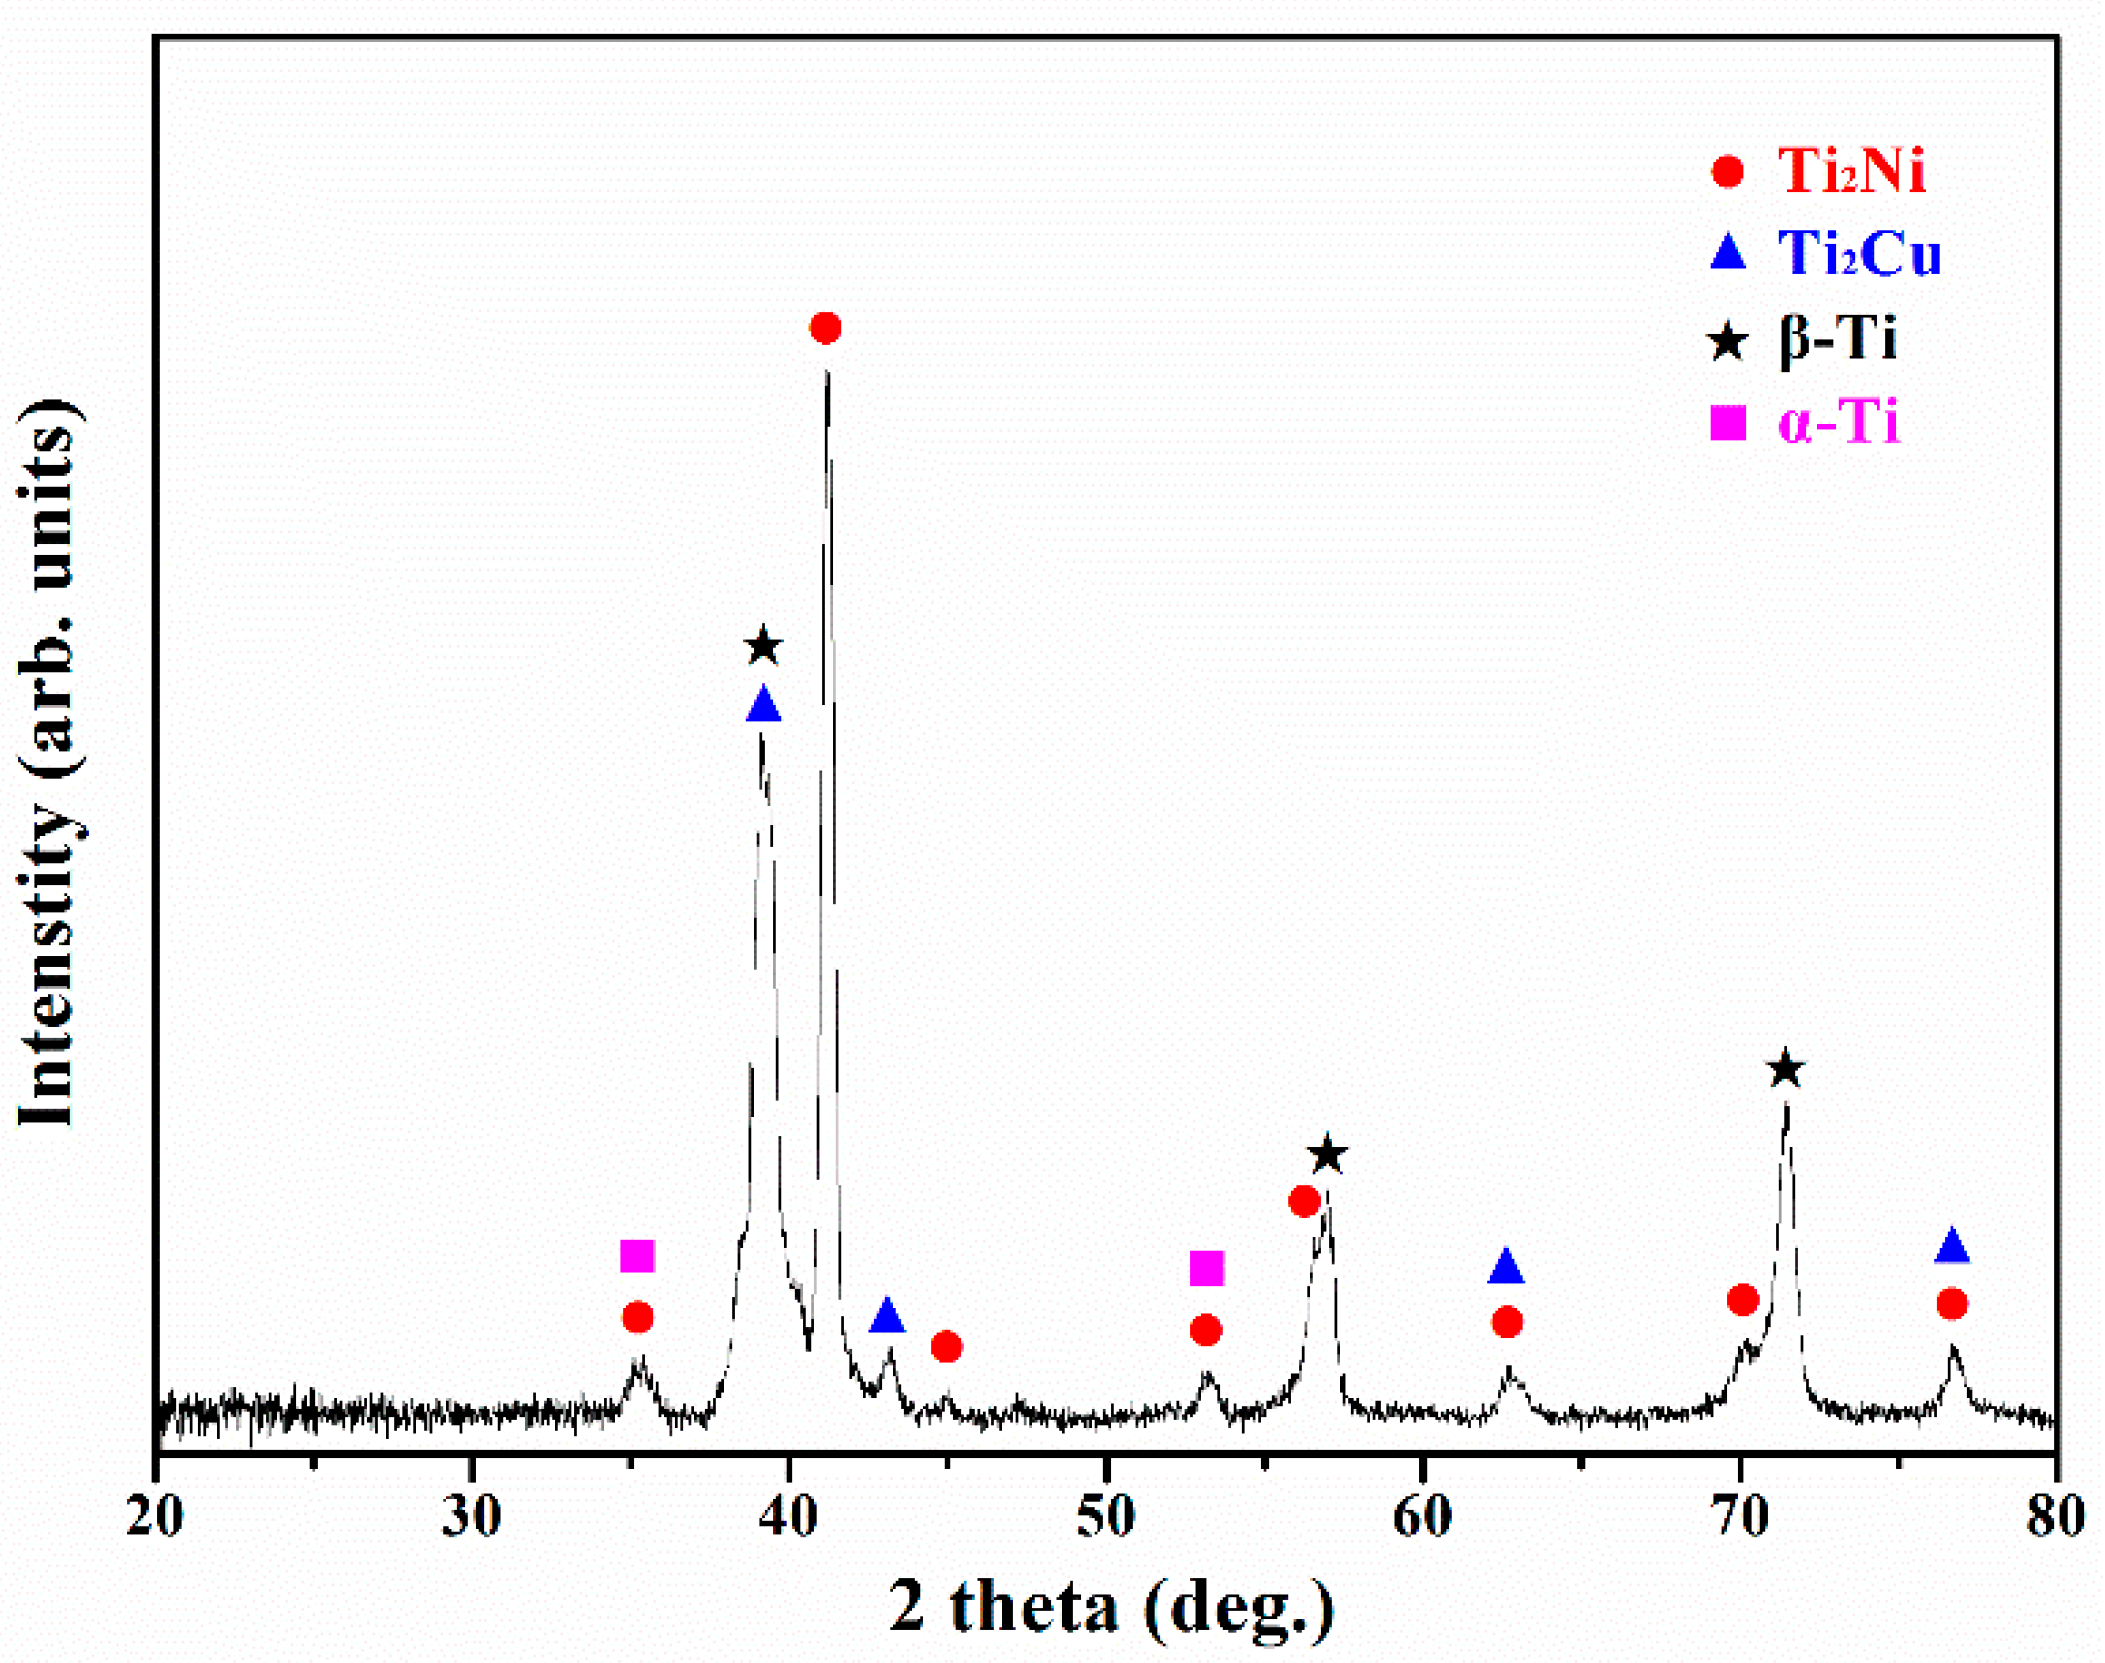
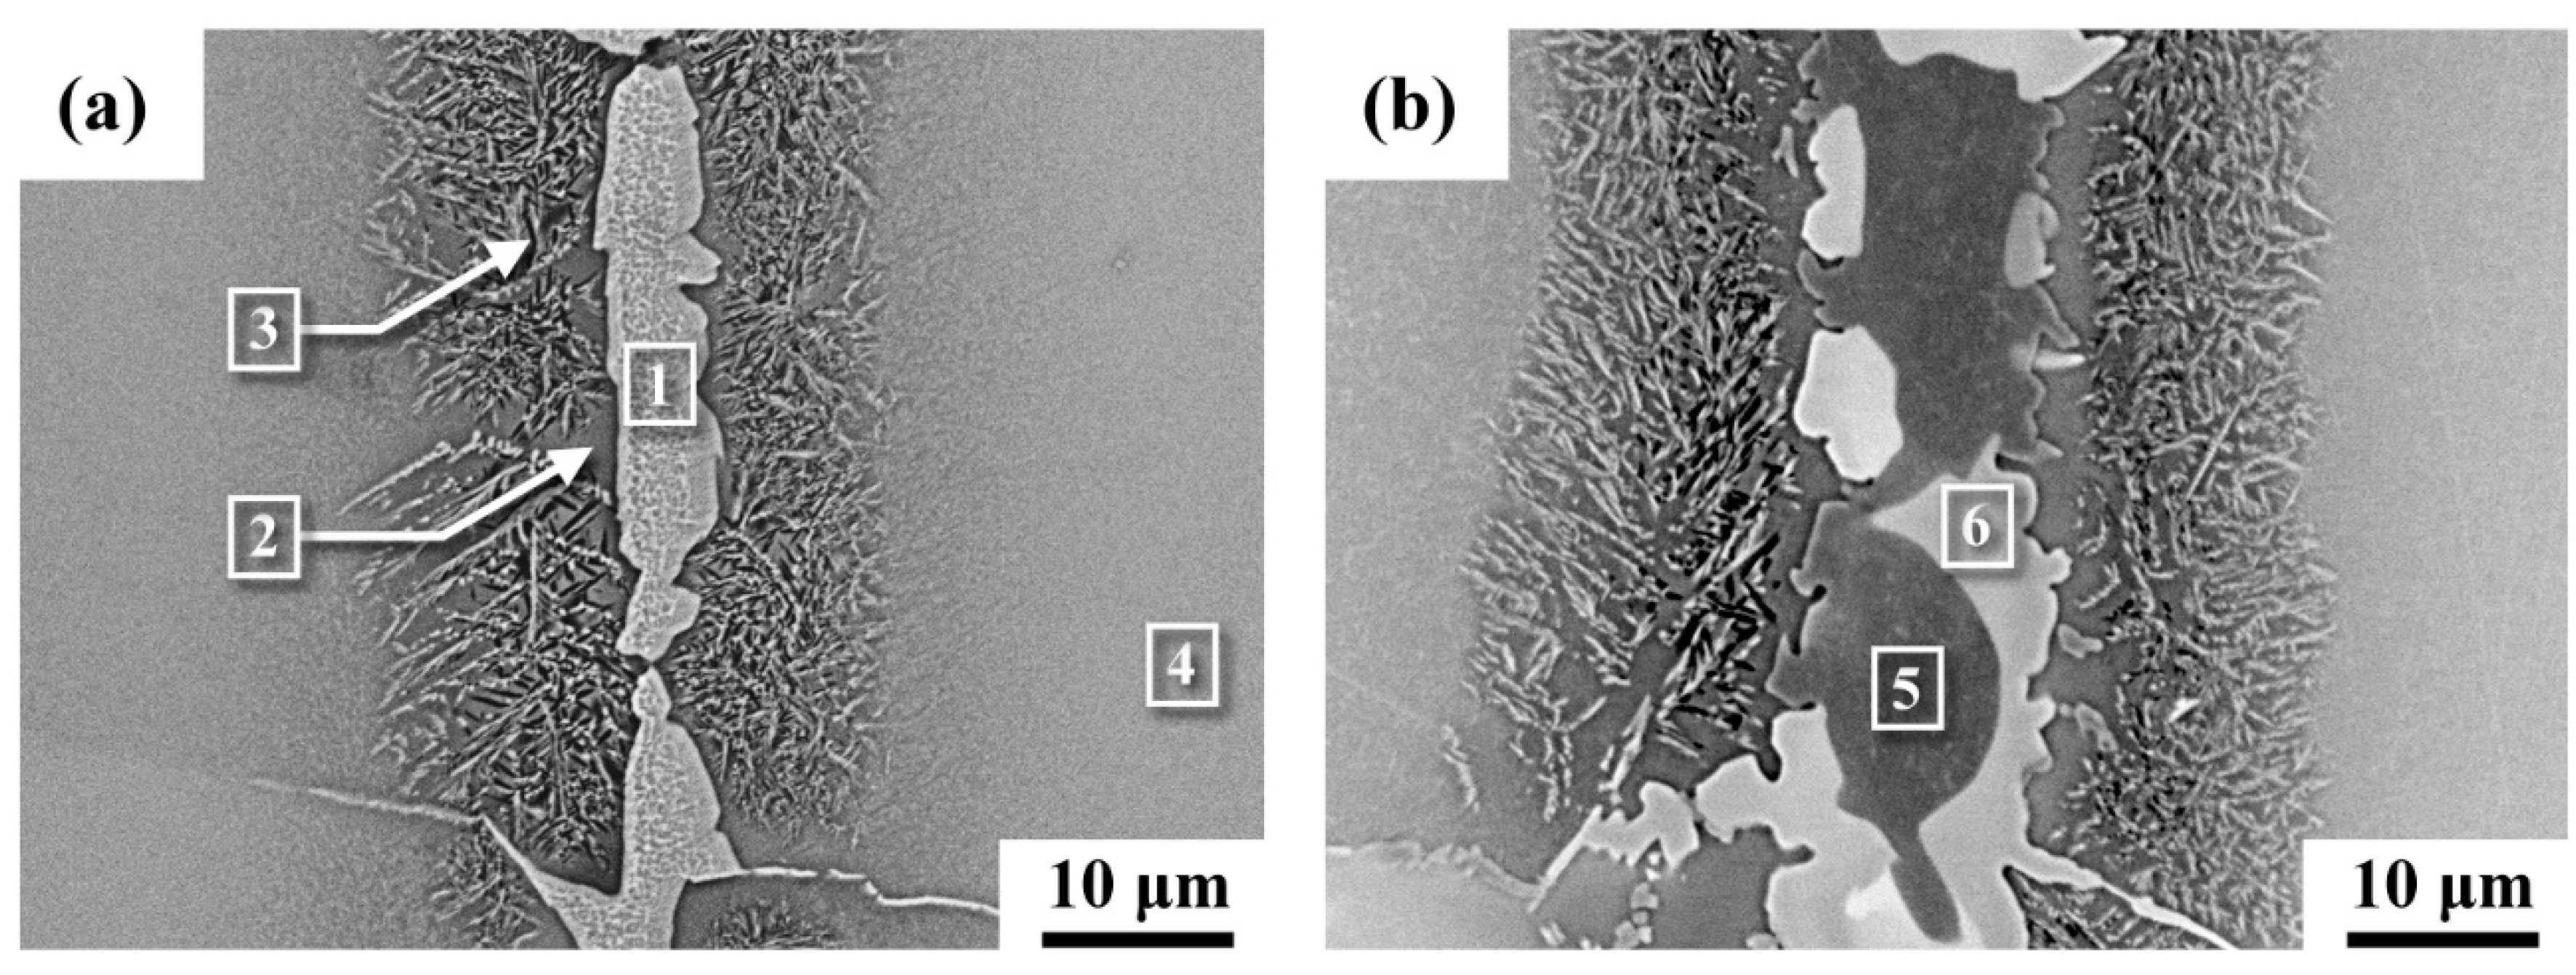
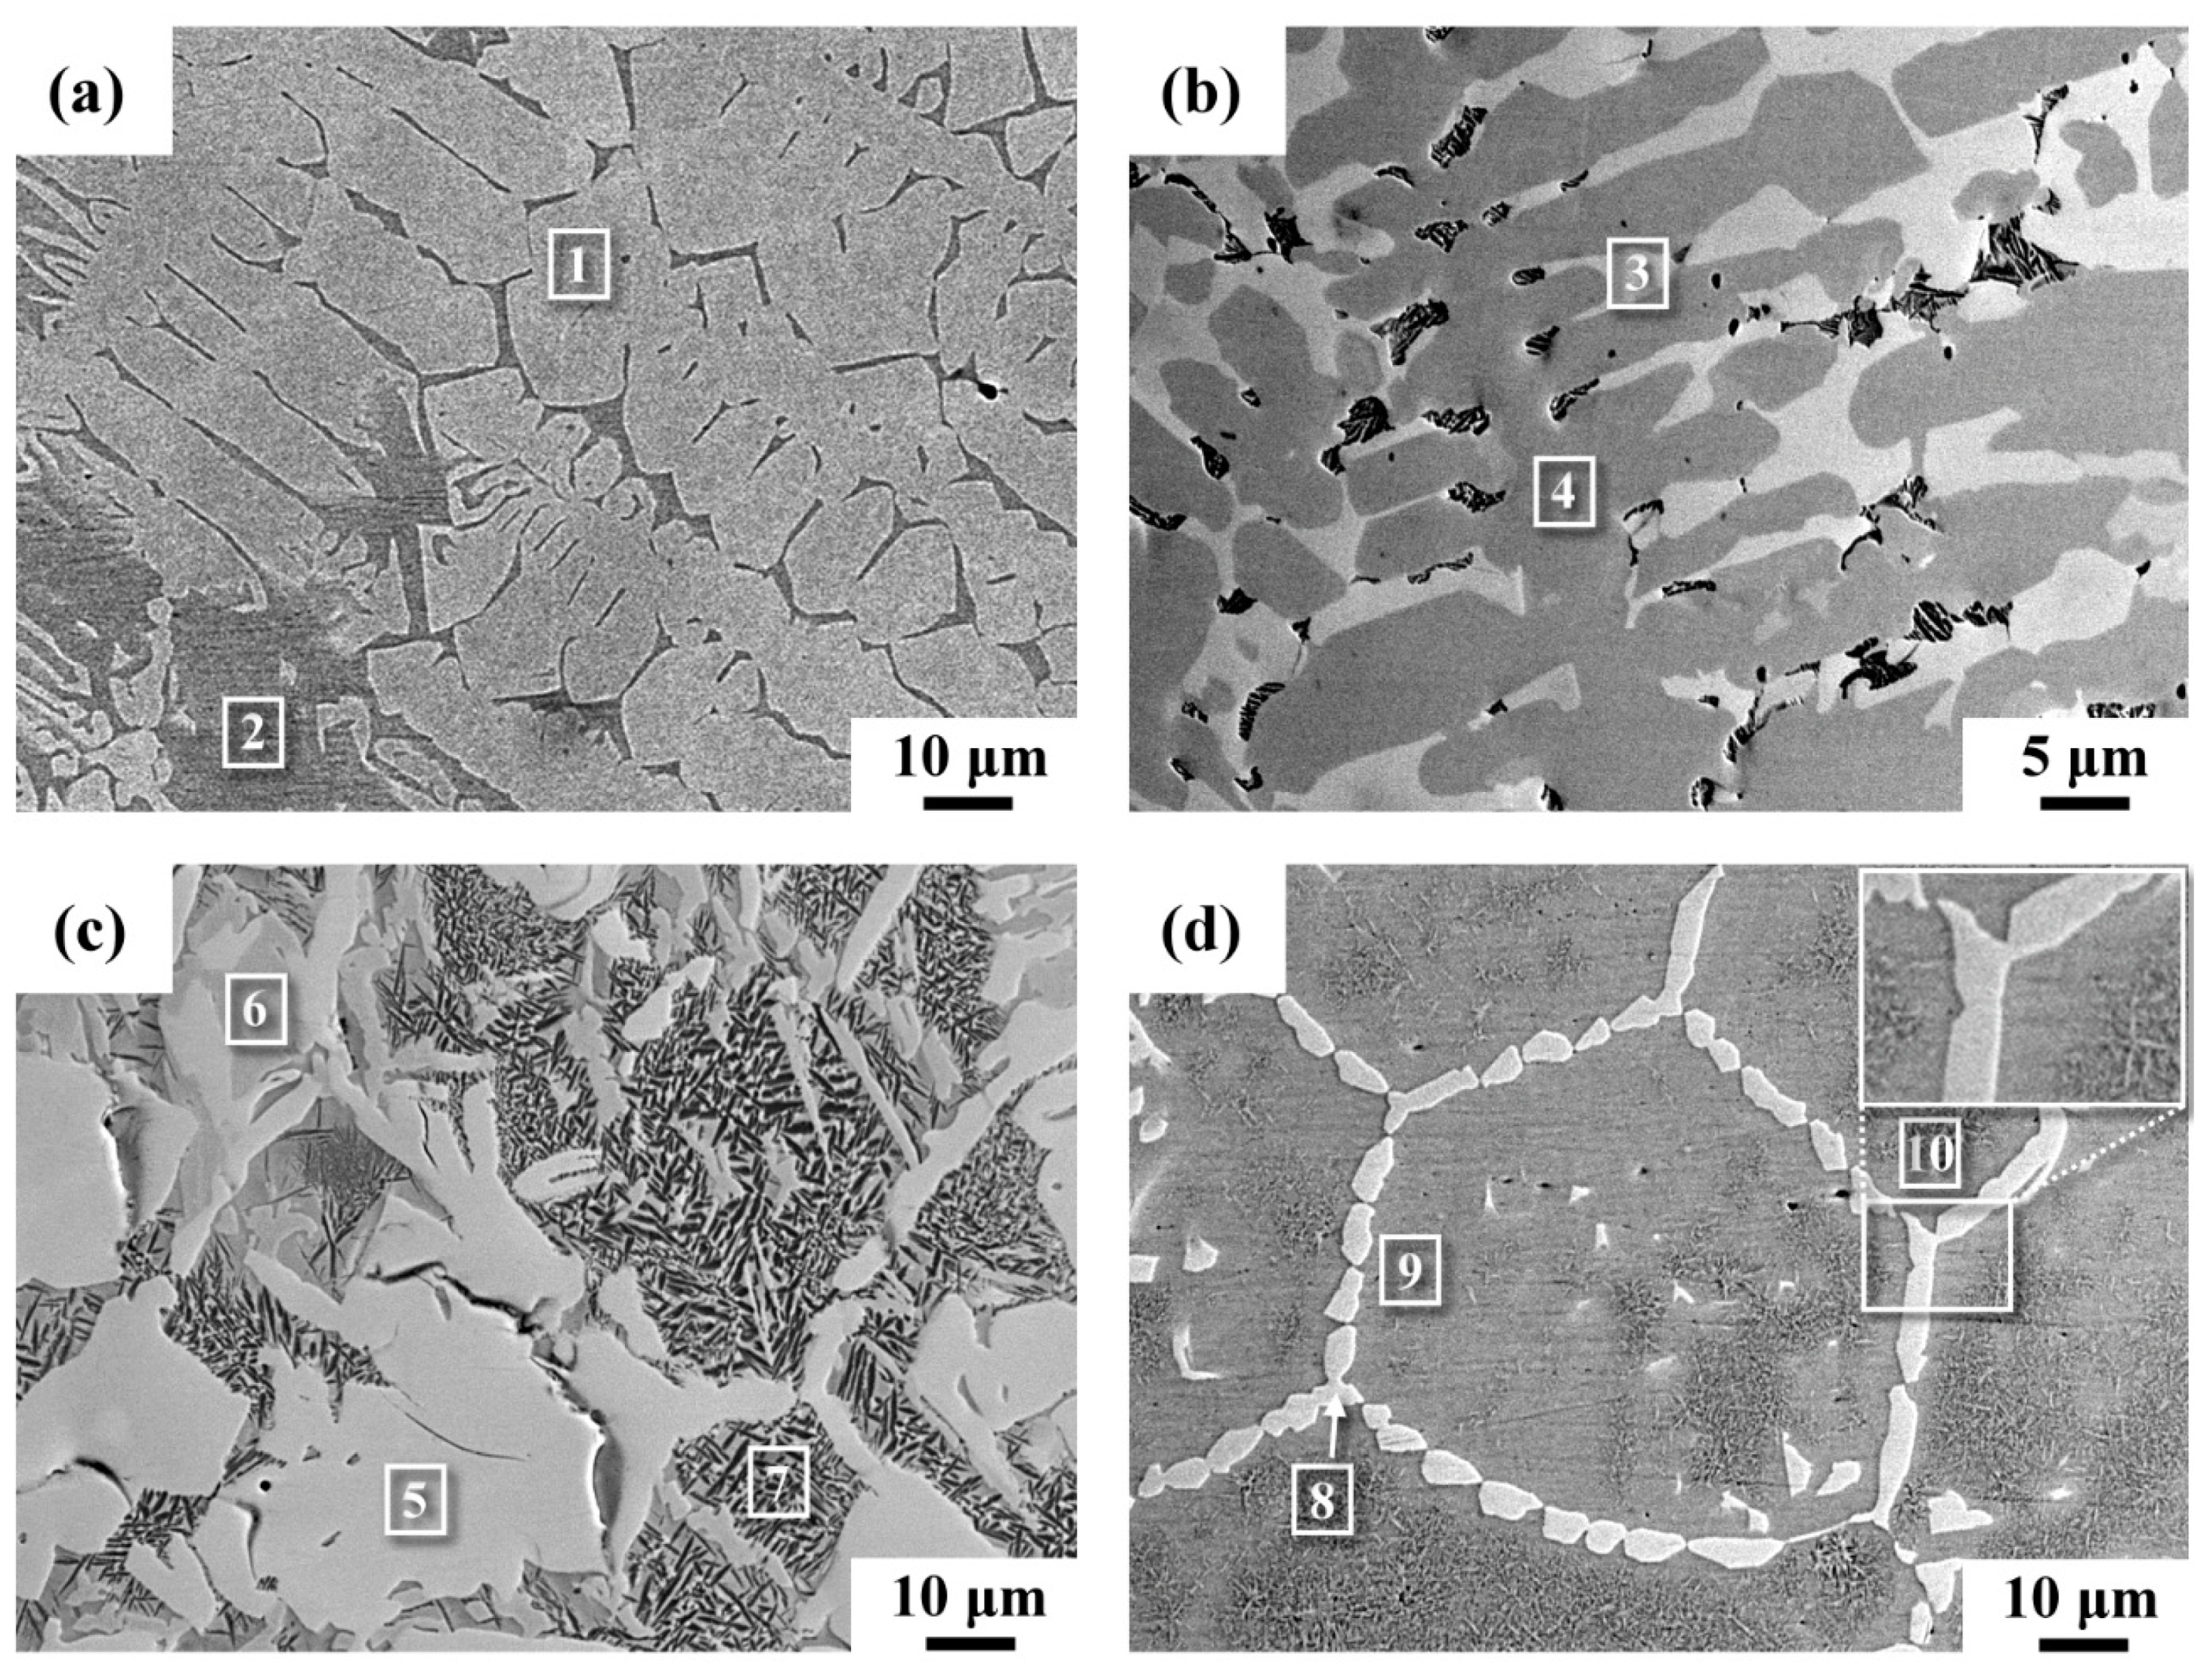
The two major phases found in the brazed zone of the sample brazed at 1243 K for 180 s were Ti2Ni and Ti2Cu intermetallic compounds. The XRD pattern revealed that Ti2Ni mixed with Ti2Cu, β-Ti and scarce α-Ti formed in the brazed zone. Central blocky intermetallics in the brazed zone of the B3 sample were replaced by grain boundary intermetallics when the brazing time was extended to 600 s. The results indicated that there were no intermetallic phases present in the sample brazed at 1243 K for 1800 s.
(2)
The specimens brazed at 1243 K for 180 s had the lowest shear strength of 310 MPa among the tested samples and predominantly showed cleavage fracture after shear tests. Increasing the brazing time to 600 s changed the failure mechanism of the joint into grain boundary separations of Ti2Ni. The sample brazed at 1243 K for 1800 s had the highest shear strength of 427 MPa and exhibited ductile dimple fracture.
(3)
During brazing at 1243 K, the dissolution of brittle Ti2Cu/Ti2Ni compounds in the brazed zone resulted from the rapid diffusion of Ni and Cu into the Ti-15-5-3 substrate. With proper combinations of brazing time and temperature, the harmful phases in the brazed zone can be eliminated thoroughly.

Author Contributions

L.-W.T. planned and organized this study. R.-K.S. assisted with the evaluation of the microstructural characteristics. T.-C.C. assisted with the EBSD. G.-L.Y. carried out the tests in the experiments. All authors were involved in completing the manuscript. All authors have read and agreed to the published version of the manuscript.

Funding

This research was funded by the National Taiwan Ocean University, granted No. 992200001, Taiwan.

Acknowledgments

The authors would like to express their appreciation to Hsin-Chih Lin and Chung-Yuan Kao for the EPMA operations at the Instrumentation Center of National Taiwan University.

Conflicts of Interest

The authors declare no conflict of interest.

References

  1. Boyer, R.; Welsch, G.; Collings, E.W. Materials Properties Handbook: Titanium Alloys; ASM International: Materials Park, OH, USA, 1993; pp. 949–956. [Google Scholar]
  2. Smith, W.F. Structure and Properties of Engineering Alloys; McGraw-Hill Book, Co.: New York, NY, USA, 1993; pp. 433–484. [Google Scholar]
  3. Mouritz, A.P. Introduction to Aerospace Materials: Titanium Alloys for Aerospace Structures and Engines; Woodhead Publishing: Cambridge, UK, 2012; pp. 202–223. [Google Scholar]
  4. Inagaki, I.; Takechi, T.; Shirai, Y.; Ariyasu, N. Application and features of titanium for the aerospace industry. Nippon. Steel Sumitomo Met. Tech. Rep. 2014, 106, 22–27. [Google Scholar]
  5. Donachie, M.J., Jr. Titanium: A Technical Guide; ASM international: Materials Park, OH, USA, 2000; pp. 5–11. [Google Scholar]
  6. Fujii, H.; Takahashi, K.; Yamashita, Y. Application of titanium and its alloys for automobile parts. Nippon. Steel Tech. Rep. 2003, 88, 70–75. [Google Scholar]
  7. Boyer, R.R. An overview on the use of titanium in the aerospace industry. Mater. Sci. Eng. A 1996, 213, 103–114. [Google Scholar] [CrossRef]
  8. Ghaderi, A.; Hodgson, P.D.; Barnett, M.R. Microstructure and texture development in Ti-5Al-5Mo-5V-3Cr alloy during cold rolling and annealing. Key Eng. Mater. 2013, 551, 210–216. [Google Scholar] [CrossRef]
  9. Tokaji, K.; Bian, J.C.; Ogawa, T.; Nakajima, M. The microstructure dependence of fatigue behaviour in Ti-15Mo-5Zr-3Al alloy. Mater. Sci. Eng. A 1996, 213, 86–92. [Google Scholar] [CrossRef]
  10. Tokaji, K.; Shiota, H.; Bian, J.C. Fatigue crack propagation in β Ti–15Mo–5Zr–3Al alloy. Mater. Sci. Eng. A 1998, 243, 155–162. [Google Scholar] [CrossRef]
  11. Ikeda, M.; Komatsu, S.Y.; Sugimoto, T.; Hasegawa, M. Effect of two phase warm rolling on aging behavior and mechanical properties of Ti–15Mo–5Zr–3Al alloy. Mater. Sci. Eng. A 1998, 243, 140–145. [Google Scholar] [CrossRef]
  12. Inamura, T.; Hosoda, H.; Wakashima, K.; Miyazaki, S. Anisotropy and temperature dependence of Young’s modulus in textured TiNbAl biomedical shape memory alloy. Mater. Trans. 2005, 46, 1597–1603. [Google Scholar] [CrossRef] [Green Version]
  13. Niinomi, M. Mechanical biocompatibilities of titanium alloys for biomedical applications. J. Mech. Behav. Biomed. Mat. 2008, 1, 30–42. [Google Scholar] [CrossRef]
  14. Wang, K. The use of titanium for medical applications in the USA. Mater. Sci. Eng. A 1996, 213, 134–137. [Google Scholar] [CrossRef]
  15. Brozek, C.; Sun, F.; Vermaut, P.; Millet, Y.; Lenain, A.; Embury, D.; Jacques, P.J.; Prima, F. A β-titanium alloy with extra high strain-hardening rate: Design and mechanical properties. Scr. Mater. 2016, 114, 60–64. [Google Scholar] [CrossRef]
  16. Ishimoto, T.; Hagihara, K.; Hisamoto, K.; Sun, S.H.; Nakano, T. Crystallographic texture control of beta-type Ti–15Mo–5Zr–3Al alloy by selective laser melting for the development of novel implants with a biocompatible low Young’s modulus. Scr. Mater. 2017, 132, 34–38. [Google Scholar] [CrossRef]
  17. Niinomi, M.; Nakai, M.; Hieda, J. Development of new metallic alloys for biomedical applications. Acta Biomater. 2012, 8, 3888–3903. [Google Scholar] [CrossRef] [PubMed]
  18. Balachandar, K.; Sarma, V.S.; Pant, B.; Phanikumar, G. Microstructure and mechanical properties of gas-tungsten-arc–welded Ti-15-3 beta titanium alloy. Metall. Mater. Trans. A 2009, 40, 2685–2693. [Google Scholar] [CrossRef]
  19. Babu, N.K.; Raman, S.G.S.; Mythili, R.; Saroja, S. Correlation of microstructure with mechanical properties of TIG weldments of Ti–6Al–4V made with and without current pulsing. Mater Charact. 2007, 58, 581–587. [Google Scholar] [CrossRef]
  20. Xu, P.Q.; Li, L.J.; Zhang, C.B. Microstructure characterization of laser welded Ti-6Al-4V fusion zones. Mater. Charact. 2014, 87, 179–185. [Google Scholar] [CrossRef]
  21. Gouret, N.; Dour, G.; Miguet, B.; Ollivier, E.; Fortunier, R. Assessment of the origin of porosity in electron-beam-welded TA6V plates. Metall. Mater. Trans. A 2004, 35, 879–889. [Google Scholar] [CrossRef]
  22. Messler, R.W., Jr. Joining of Materials and Structures: From Pragmatic Process to Enabling Technology; Elsevier Butterworth-Heinemann: New York, NY, USA, 2004; pp. 349–355. [Google Scholar]
  23. Jacobson, D.M.; Humpston, G. Principles of Brazing; ASM International: Materials Park, OH, USA, 2005; pp. 1–45. [Google Scholar]
  24. Gussone, J.; Kasperovich, G.; Haubrich, J.; Requena, G. Interfacial Reactions and Fracture Behavior of Ti Alloy-Ag28Cu Brazing Joints: Influence of Titanium Alloy Composition. Metals 2018, 8, 830. [Google Scholar] [CrossRef] [Green Version]
  25. Bian, H.; Song, X.G.; Hu, S.P.; Lei, Y.Z.; Jiao, Y.D.; Duan, S.T.; Feng, J.C.; Long, W.M. Microstructure evolution and mechanical properties of titanium/alumina brazed joints for medical implants. Metals 2019, 9, 664. [Google Scholar] [CrossRef] [Green Version]
  26. Wang, G.; Wu, P.; Wang, W.; Zhu, D.D.; Tan, C.W.; Su, Y.S.; Shi, X.Y.; Cao, W. Brazing Ti-48Al-2Nb-2Cr Alloys with Cu-Based Amorphous Alloy Filler. Appl. Sci. 2018, 8, 920. [Google Scholar] [CrossRef] [Green Version]
  27. Shapiro, A.; Rabinkin, A. State of the art of titanium-based brazing filler metals. Weld. J. 2003, 82, 36–43. [Google Scholar]
  28. Yeh, T.Y.; Shiue, R.K.; Chang, C.S. Microstructural observation of brazed Ti-15-3 alloy using the clad Ti-20Zr-20Cu-20Ni foil. ISIJ Int. 2013, 53, 726–728. [Google Scholar] [CrossRef] [Green Version]
  29. Wang, S.B.; Kao, C.S.; Tsay, L.W.; Shiue, R.K. The Application of 40Ti-35Ni-25Nb filler foil in brazing commercially pure titanium. Metals 2018, 8, 154. [Google Scholar] [CrossRef] [Green Version]
  30. Kao, C.S.; Tsay, L.W.; Wang, S.B.; Shiue, R.K. Vacuum brazing Ti-15-3 with a TiNiNb braze alloy. Metals 2019, 9, 1085. [Google Scholar] [CrossRef] [Green Version]
  31. Chang, C.T.; Shiue, R.K. Infrared brazing of Ti-6Al-4V using the Ti-15Cu-15Ni braze alloy. J. Mater. Sci. 2006, 41, 2145–2150. [Google Scholar] [CrossRef]
  32. Ren, H.S.; Xiong, H.P.; Chen, B.; Pang, S.J.; Wu, X.; Cheng, Y.Y.; Chen, B.Q. Transient liquid phase diffusion bonding of Ti–24Al–15Nb–1Mo alloy to TiAl intermetallics. Mater. Sci. Eng. A 2016, 651, 45–54. [Google Scholar] [CrossRef]
  33. Zhu, W.J.; Duarte, L.I.; Leinenbach, C. Experimental study and thermodynamic assessment of the Cu–Ni–Ti system. Comput. Coupling Phase Diagr. Thermochem. 2014, 47, 9–22. [Google Scholar] [CrossRef]
  34. Villars, P.; Prince, A.; Okamoto, H. Handbook of Ternary Alloy Phase Diagrams; ASM International: Materials Park, OH, USA, 1995. [Google Scholar]
  35. Steubenann, S.G.; Mausli, P.A.; Moncler, S.S.; Semlitsch, M.; Pohler, O.; Hinter-mann, H.R.; Perren, S.M. Titanium’92 Science and Technology; The Minerals, Metals and Materials Society: Warrendale, MI, USA, 1993; pp. 2689–2696. [Google Scholar]
  36. Hibbeler, R.C. Mechanics of Materials; Pearson Education Inc.: Upper Saddle River, NJ, USA, 2003; pp. 526–527. [Google Scholar]
  37. Massalski, T.B. Binary alloy Phase Diagrams; ASM International: Materials Park, OH, USA, 1990; pp. 2874–2876. [Google Scholar]
Figure 1. Schematic diagram of (a) assembled sample by using graphite fixture; (b) shear test experiment.
Metals 10 00083 g001
Figure 2. (a) The schematic diagram of a brazed joint before brazing illustrating center and edge locations of the joint; (b) an optical micrograph displaying the cross section of a whole joint after brazing.
Metals 10 00083 g002
Figure 3. (a) Schematic cross section of the clad Ti-15Cu-15Ni foil, (b) BSE-SEM micrograph showing the cross section of area I in (a) for the clad filler foil, (c) compositional line scan of (b).
Metals 10 00083 g003
Figure 4. BSE-SEM micrographs of (a) B3, (b) B10 and (c) B30 samples.
Metals 10 00083 g004
Figure 5. XRD pattern of B3 sample.
Metals 10 00083 g005
Figure 6. BSE-SEM micrographs of cross-sectional view of the B3 sample: (a) the center of the brazed zone, (b) the edge of the brazed zone as displayed in Figure 2.
Metals 10 00083 g006
Figure 7. BSE-SEM micrographs of the B3 sample cut parallel to the joint interface, (a) the center of the brazed zone, (b) the edge of the brazed zone as displayed in Figure 2, (c) near the central brazed zone, (d) grain boundary liquation zone.
Metals 10 00083 g007
Figure 8. EBSD phase maps of (a) B3 joint in Figure 6a; (b) B10 joint in Figure 4b; (c) B10 joint in Figure 4c.
Metals 10 00083 g008
Figure 9. (ac) BSE images showing the cross sections of the fractured B3, B10 and B30 joints; (df), SE image fractographs revealing the fracture features of the B3, B10 and B30 samples.
Metals 10 00083 g009
Table 1. Chemical compositions in at% of marked sites in Figure 6.
LocationElementPhase/Structure
AlMoNiZrCuTi
10.40.126.42.14.966.1Ti2Ni
23.13.94.01.63.583.9β-Ti
32.23.06.21.57.279.9Eutectoid
44.37.53.22.31.581.2β-Ti
50.30.211.90.719.167.8Ti2Cu
60.60.126.20.86.465.9Ti2Ni
Table 2. Chemical compositions in at% of marked sites in Figure 7.
LocationElementPhase/Structure
AlMoNiZrCuTi
11.10.127.02.04.165.7Ti2Ni
23.64.24.11.54.282.4β-Ti
30.50.127.20.44.367.5Ti2Ni
40.10.113.50.318.467.6Ti2Cu
50.40.126.40.55.067.6Ti2Ni
60.30.112.00.619.867.2Ti2Cu
73.22.64.11.03.785.4Eutectoid
81.00.524.81.85.166.8Ti2Ni
93.54.34.21.74.481.9β-Ti
103.23.64.81.84.881.8Eutectoid
Table 3. Average shear strengths of distinct brazed samples.
SpecimenBrazing TemperatureBrazing TimeAverage Shear Strength
B31243 K 180 s310 ± 40 MPa
B10600 s381 ± 21 MPa
B301800 s427 ± 20 MPa
Table 4. Electron probe micro-analyzer (EPMA) chemical compositions in at% of marked sites in Figure 9.
LocationElement
AlMoNiZrCuTi
10.40.225.01.35.168.0
21.00.721.90.95.070.5
30.80.823.01.04.669.8
45.17.30.01.50.186.0

