Article

Novel Mechanical Characterization of Austenite and Ferrite Phases within Duplex Stainless Steel

by
Hossein Besharatloo
1,2,
Marcel Carpio
3,
José-María Cabrera
3,4,
Antonio Manuel Mateo
1,2,
Gemma Fargas
1,2,
Jeffrey Martin Wheeler
5,
Joan Josep Roa
1,2 and
Luis Llanes
1,2,*
1
CIEFMA(Centro de Integridad Estructural, Fiabilidad y Micromecánica de los Materiales)-Department of Materials Science and Engineering, EEBE, Universitat Politècnica de Catalunya-BarcelonaTech, 08019 Barcelona, Spain
2
Barcelona Research Centre in Multiscale Science and Engineering, Universitat Politècnica de Catalunya-BarcelonaTech, 08019 Barcelona, Spain
3
PROCOMAME—Department of Materials Science and Engineering, EEBE, Universitat Politècnica de Catalunya-BarcelonaTech, 08019 Barcelona, Spain
4
Institute of Research in Metallurgy and Materials, Universidad Michoacana de San Nicolás de Hidalgo, 58030 Morelia, Mexico
5
Laboratory for Mechanics of Materials and Nanostructures, Department of Materials, ETH Zürich, 8093 Zürich, Switzerland
*
Author to whom correspondence should be addressed.
Metals 2020, 10(10), 1352; https://doi.org/10.3390/met10101352
Submission received: 5 September 2020 / Revised: 30 September 2020 / Accepted: 8 October 2020 / Published: 10 October 2020
(This article belongs to the Special Issue Mechanical Properties of Deformed Alloys and Compounds)

Abstract

:
The microstructure and micromechanical properties of the constitutive phases of a particular duplex stainless steel in various processing conditions have been characterized. Hardness (H), elastic modulus (E) and H/E cartography maps were obtained by using a high-speed nanoindentation mapping technique. Small-scale H and E evolution at different processing conditions has been investigated by statistical analysis of a large number of nanoindentations (10,000 imprints per sample). Two mechanically distinct phases, ferrite (α) and austenite (γ), were deconvoluted from this dataset using Ulm and Constantinides’ method, with the remaining values assigned to a third mechanical phase linked to composite-like (containing α/γ interphase boundaries) regions. These mechanical property phase assessments were supplemented by overlaying crystallographic phase maps obtained by electron backscattered diffraction. An excellent correlation between microstructure and small-scale mechanical properties was achieved, especially when considering the ratio H/E.

1. Introduction

Duplex stainless steel (DSS) is a two-phase alloy in which the proportion of constitutive elements (chemical composition) modifies the volume fraction and properties of austenite (γ phase) and ferrite (α phase). DSSs are typically twice as strong as single-phase austenitic or ferritic stainless steels. The combination of mechanical properties (high yield strength and ductility) and corrosion resistance of DSSs demonstrates better overall performance than expected from a simple average of the two phases and surpasses those exhibited by γ and α phases separately. It makes DSSs suitable for many industrial applications involving stringent service conditions, e.g. offshore, chemical, oil industries, etc. [1,2,3,4,5]. The content of individual elements, such as Cr, Mo and N, within DSSs results in an elevated pitting corrosion resistance. Nitrogen plays a similar role as carbon, i.e. an effective solid solution strengthening agent. In this regard, it is intentionally added to DSSs, as it can significantly increase the strength of austenitic alloys [6,7,8,9].
It is well known that, for a given chemical composition, the mechanical properties of DSSs are primarily modified by microstructural parameters, such as the phase fraction and crystallographic texture of each phase. These microstructural parameters can be regulated by the processing conditions [10,11,12,13,14,15,16,17,18]. Due to the two-phase nature of these alloys and the distinct mechanical behaviour between austenite and ferrite, some damage and failure (edge cracks) may be induced during the processing of DSS components. Hence, studies of the plastic compatibility between the constitutive phases become necessary [19].
Although the mechanical properties of DSSs have been extensively studied from a macroscopic perspective, the number of works involving small-scale characterization is quite limited for these materials. In this regard, the reported results of micromechanical properties of constitutive phases (γ or α) are diverse. Austenitic phase could have higher, lower or equal hardness/elastic modulus compared with ferritic phase, depending on different variables such as specific processing route under consideration [20,21], chemical compositions (N content) [22,23,24,25,26], and microstructural/crystallographic texture of the individual phases [27,28,29].
It is evident that the mechanical behaviour of constitutive phases at the micro-scale is a key parameter for optimising the microstructural design of DSSs. In order to attain reliable values of the hardness and elastic modulus of each constitutive phase, massive nanoindentation combined with statistical analysis [30,31,32,33] is here proposed as a methodology for assessing small-scale mechanical properties. This method can assess the mechanical properties of predefined constitutive phases. Alternatively, it may provide information about the content and distribution of constitutive phases by linking different discerned responses exhibited by distinct mechanical phases [30,31,32,33]. Recently, this methodology has been validated for several multiphase systems [34,35,36,37,38,39,40], where indentations were performed to determine the mechanical properties of predefined phases [34,36,39], and/or constitutive phases were distinguished on the basis of obtained mechanical properties maps [37,38,40]. In both cases, mechanical properties of each phase were inherently constant and had significant difference with those assessed for the other phases. However, applying this methodology on DSS is challenging since, as mentioned before, mechanical properties (i.e. hardness (H) and elastic modulus (E)) of –α and –γ phases within DSS) are not stable and can be tailored by different factors. Therefore, austenite or ferrite could not be defined by massive indentation technique, unless those phases were already determined by microstructural characterization techniques. On the other hand, in some cases, depending on alloying elements and processing conditions, austenite and ferrite show relatively similar mechanical properties (H and E) [21,22,23,24,25,26,27,28,29]; thus, assigning/correlating the obtained H or E to/with an austenite or ferrite phase would be complicated. Attempting to address satisfactorily this challenge for DSSs, a novel high-speed nanoindentation mapping technique in conjunction with microstructural characterization techniques were here employed. This led us to acquire a persistent correlation between microstructure and micromechanical properties (hardness H, elastic modulus E, and H/E) as a function of the processing conditions in a particular DSS.

2. Materials and Methods

2.1. Materials and Sample Preparation

The material used in this study is a commercial EN 1.4462 DSS, equivalent to AISI S31803, provided by UGINE and ALZ (ArcelorMittal Group, Luxembourg C, Luxembourg). Three different specimens were supplied after each industrial processing step (schematically illustrated in Figure 1). They are designated as: S1–hot rolled (HR), S2–cold rolled (CR) and S3–final product (FP). More information about the industrial processes employed and the resulting microstructures in terms of texture can be found elsewhere [23]. The chemical composition of the DSS studied is summarized in Table 1.
Prior to microstructural and micromechanical characterization, the different specimens were initially ground using silicon carbide paper, followed by sequential polishing with diamond suspensions, with decreasing particle size down to 1 µm. Finally, all the samples were polished for 4 h with a 0.03 silica suspension using a vibratory polisher unit (VibroMet 2, Buehler, Lake Bluff, IL, USA). This last step was taken in order to achieve a high-quality polished surface and diminish the work hardening induced during the grinding and polishing process.
The microstructures of the processed samples were characterized using electron backscatter diffraction (EBSD) in a field emission scanning electron microscope (FESEM, 7100F model, JEOL, Tokyo, Japan). EBSD maps were collected with a 250 nm scanning step size at an acceleration voltage of 20 kV and probe current of 9 nA. Various parameters, such as image quality (IQ) (Figure 2), phase map, volume fraction and grain size of each phase were evaluated using Channel 5.0 software (Oxford instruments PLC, Abingdon, UK).

2.2. Assessment of Small-Scale Mechanical Properties and Statistical Analysis

Hardness and indentation elastic modulus measurements were performed using an iNano® nanoindenter (KLA, Milpitas, CA, USA) equipped with a diamond, Berkovich indenter. H and E cartography maps were acquired using a high-speed mechanical property mapping technique called NanoBlitz. In doing so, each test can be accomplished in less than a second, which includes positioning the testing region under the indenter, surface approach, loading, unloading and retracting process of the indenter. This relatively new technique can provide mechanical mapping over relatively large (within the micrometric range) areas by performing arrays of thousands of imprints, each evaluated by the Oliver and Pharr method [41,42]. Three large maps of 30,000 imprints (10,000 per specimen) were performed under load control mode at 4 mN, which corresponded to an indentation penetration depth ranging between 180 and 200 nm. This minimum required penetration depth was evaluated on the basis of the dependence of the ratio between the applied load and the stiffness squared on the penetration depth, by applying 16 imprints under an applied load of 45 mN (see Section 3.2.1). Indentations were spaced at an interval of 2 µm to avoid any overlapping effect from neighbouring indentations, according to the indentation depth/spacing ratio of 10 suggested by Phani and Oliver [43]. This margin allows each imprint to be treated as an independent statistical value to assess the micromechanical properties. The Poisson ratio was fixed at 0.3, which is representative of DSS and various other metals [44].
The statistically analysis proposed by Ulm and co-workers [30,31,32,33] was employed to evaluate the H and E response of each phase. In this statistical method, it is considered that the investigated samples contain different constitutive phases (i) with distinct mechanical properties. Furthermore, the Ulm method assumes that the distribution of mechanical properties of each constitutive phase (Pi) follows a Gaussian distribution:
P i = 1 2 π σ i 2 e ( [ P P i ] 2 2 σ i 2 )
where Pi is the arithmetic mean for number of indentations exerted on different constitutive phases (i), and σi is the standard deviation. The obtained H or E values (P) were plotted by cumulative distribution function (CDF), while density functions were fitted by Gaussian distributions. Consequently, the corresponding CDF using a sigmoidal shaped error function could be fitted by the following equation:
C D F = i n 1 2 f i e r f [ P P i 2 σ i ]
where fi is the relative volume fraction occupied by each individual phase. The total volume fraction of constitutive phases was fixed at 1. The fitting process was set to finalize when the χ2 tolerance was less than 1 × 10⁻¹⁵. Finally, experimental CDFs were deconvoluted, yielding then mean and standard deviation of hardness and elastic modulus for each mechanical phase. Details of the statistical method employed on different system may be found elsewhere [30,31,32,33,34,35,36,37,38].

3. Results and Discussions

3.1. Microstructural Characterization

The mean grain size and distribution of each constitutive phase (γ and α) were measured in each processing condition using the linear intercept method [45]. In doing so, four separate micrographs obtained by means of FESEM/EBSD were analysed per condition. Grain boundaries as well as both γ and α phases are shown in Figure 3a,b respectively. In addition, the volume fraction of each constitutive phase for all studied samples was measured—Figure 3c.
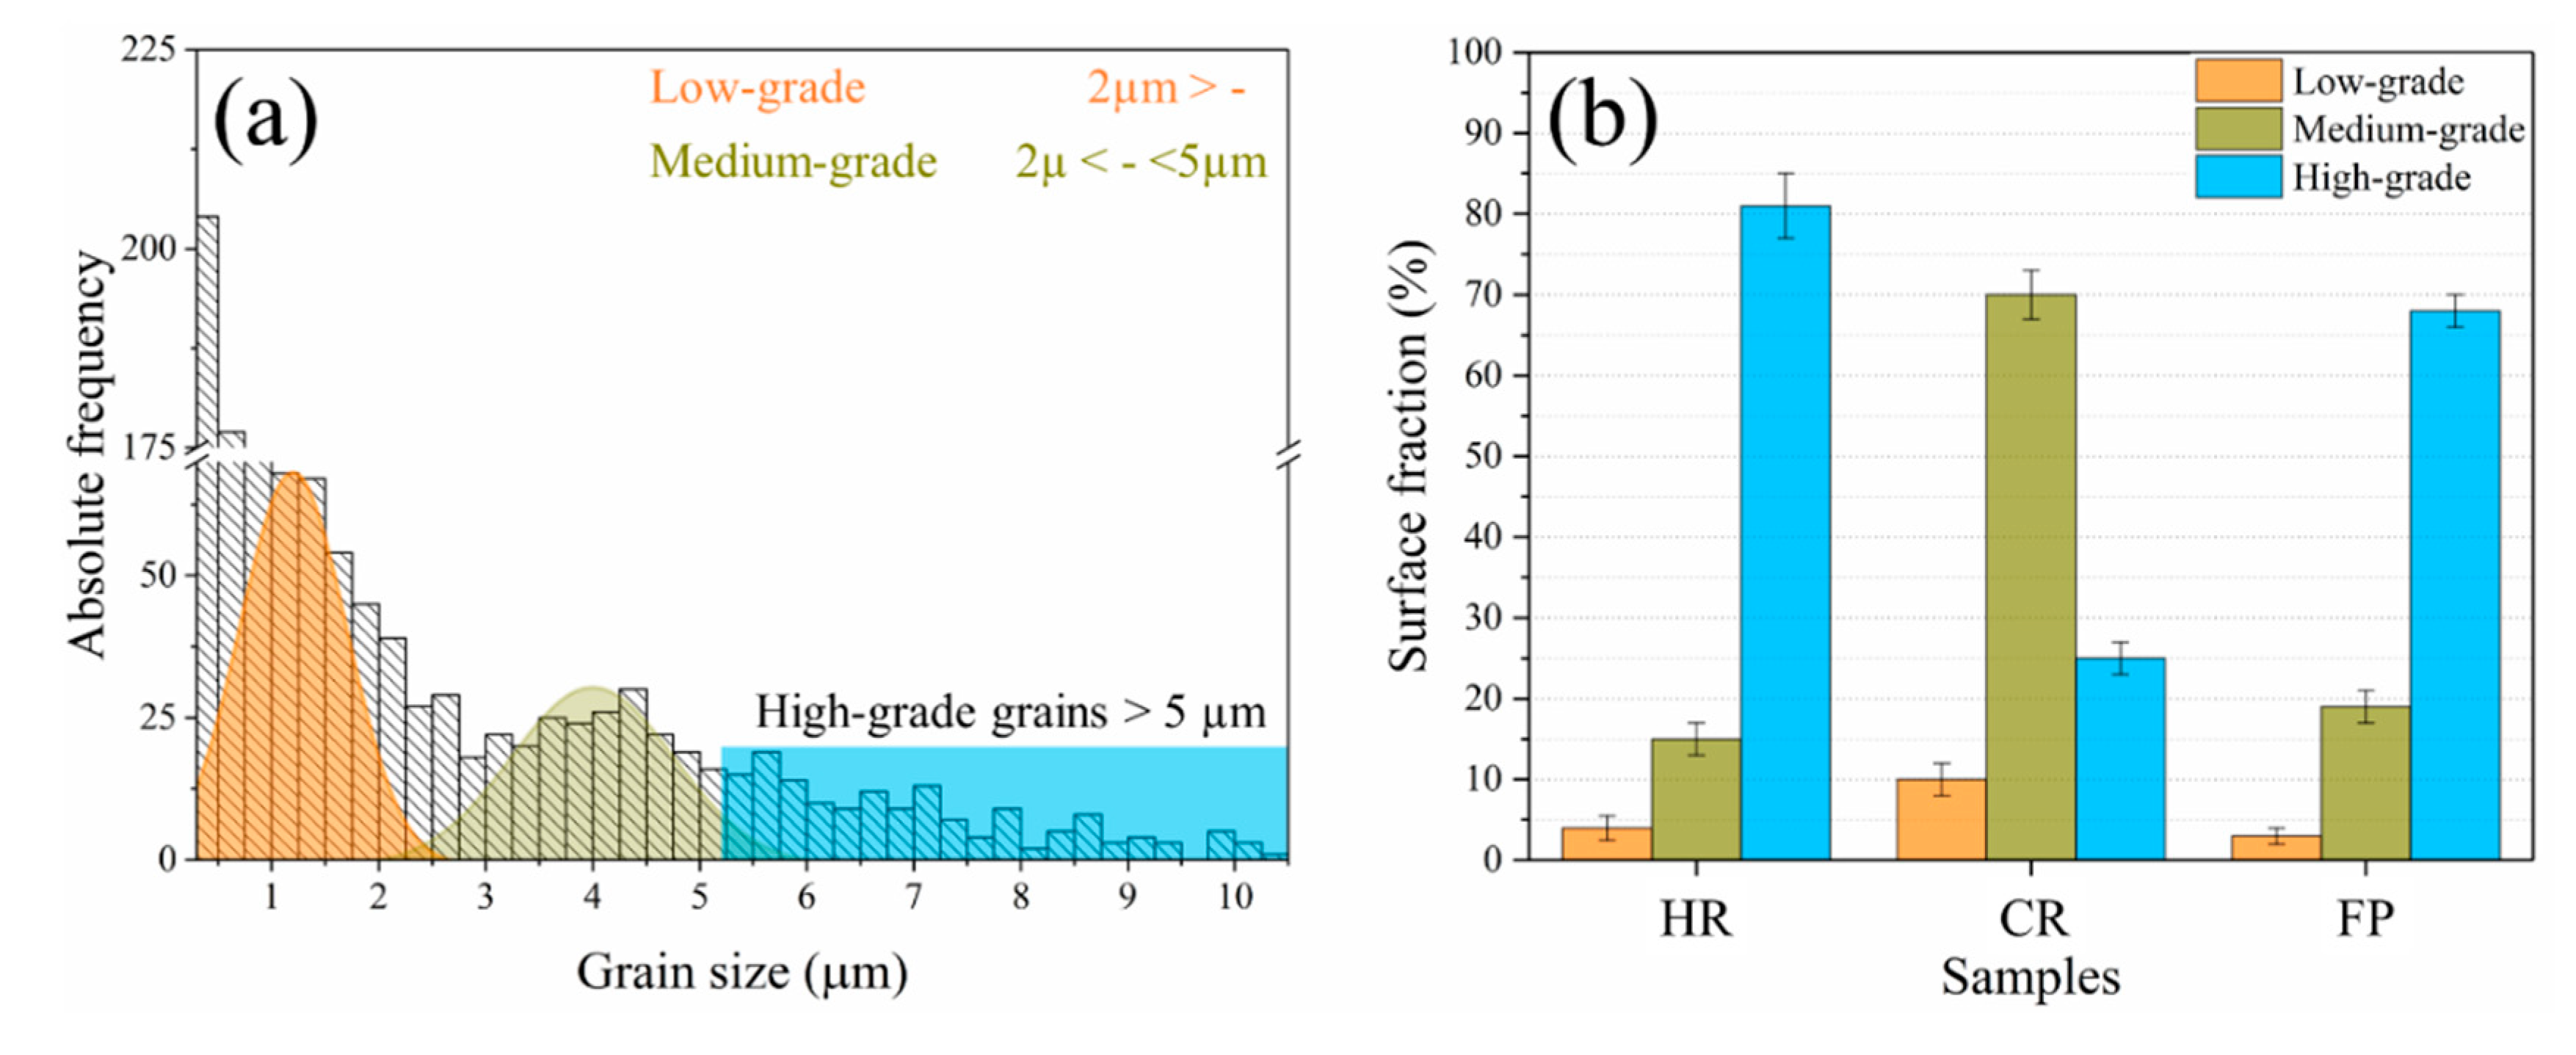
According to the general literature observation, for DSSs with medium and high N contents (i.e. above 0.15%), the γ phase is harder than the α phase [23,24,46,47,48,49]. It is clear that the overall hardness of the DSS depends on the volume fraction and intrinsic hardness of each constitutive phase within the bulk material. This work focuses on the evaluation of the intrinsic mechanical properties of each phase after each processing step. Hence, it may be expected that grain boundary strengthening would also play a relevant role. In this regard, grain sizes were measured for both constitutive phases. Figure 4a displays the histogram of the measured grain sizes with a constant bin size of 250 nm, obtained from an average of at least 2000 grains from the HR sample (Figure 2). Qualitatively similar histograms were obtained for the other studied samples and are not shown here. The measured grain sizes for both phases were found to be effectively the same, with no statistically significant differences. Therefore, the obtained histograms show the combined results from both phases. Three main distributions illustrate the accumulation of grains within the defined ranges (see Figure 4a), which relatively can be classified in low, medium and high ranges. The first peak corresponds to a relatively lower range (less than 2 µm), the second one corresponds to a medium-range (between 2 and 5 µm), and the final rectangular region represents the higher range (greater than 5 µm). The reason behind this classification is given in Section 3.2.1.
Despite the number of high-range (coarser) grains being relatively small compared with the measured low-range ones, the surface fraction occupied by the former is larger (see Figure 4b). Grain refinement occurred during the cold rolling process. It consequently raised the surface fraction of medium-sized grains dramatically. This resulted from the elongation and fragmentation of grains during cold work induced at room temperature [49,50,51]. Finally, significant grain growth took place after the final annealing process in the FP sample, as a result of the recrystallization and recovery of deformed grains of both phases in the CR sample [23,47,52,53,54,55,56,57].

3.2. Micromechanical Properties

3.2.1. Micromechanical Properties–Microstructure Correlation: Cartography Maps

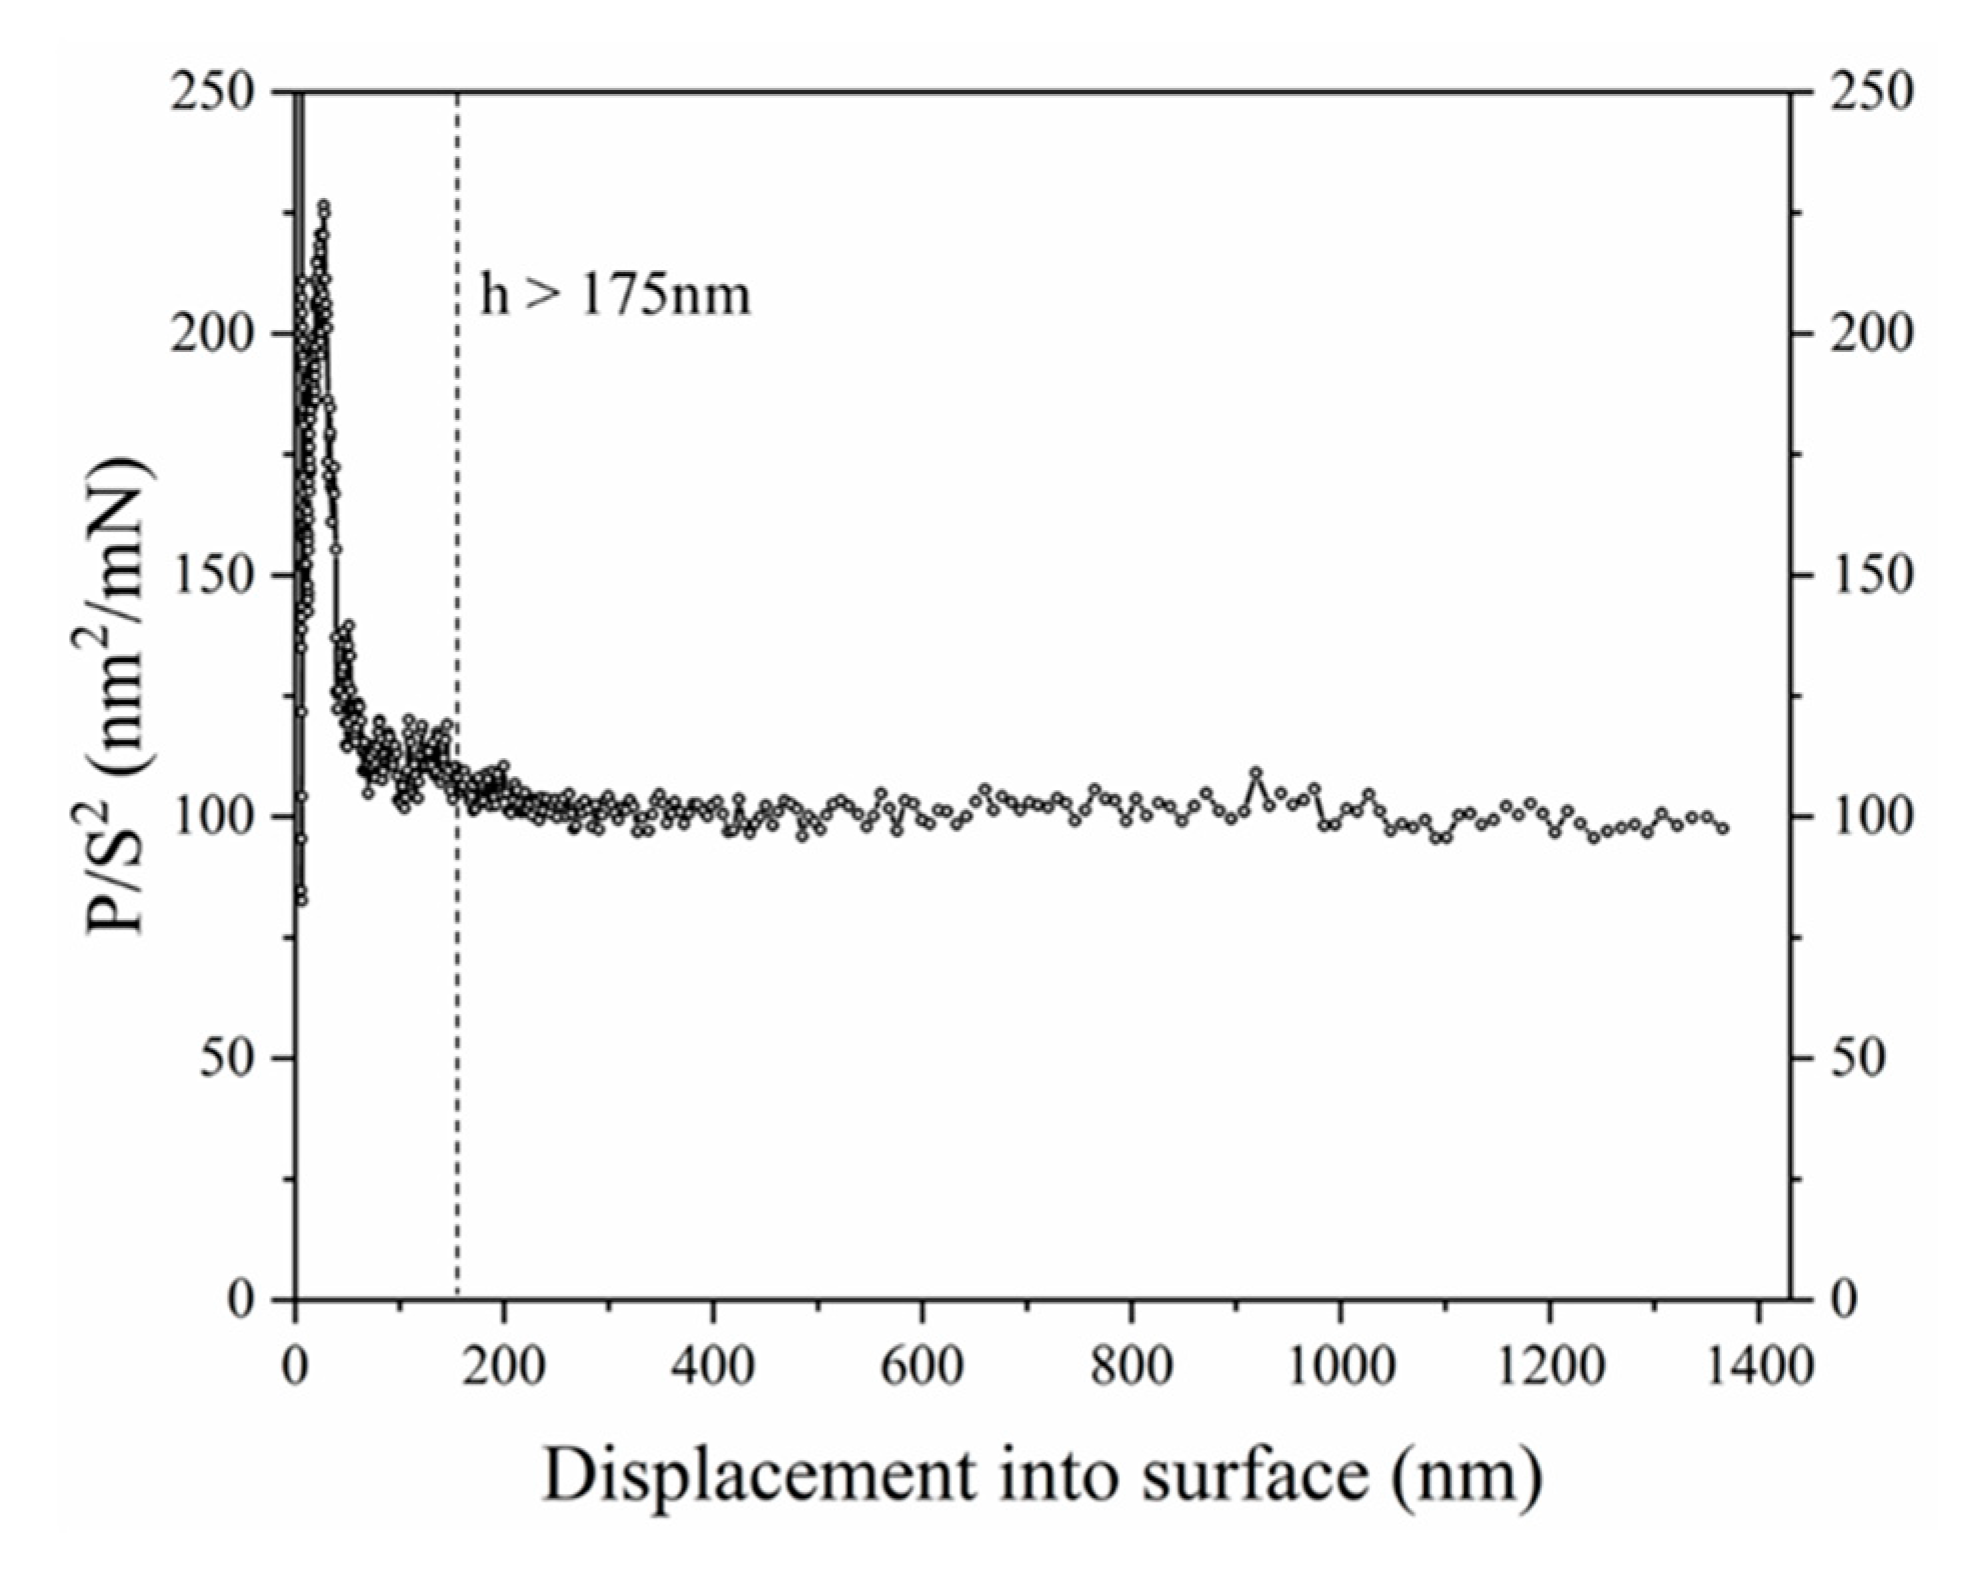
Prior to performing the indentation mapping, testing conditions such as penetration depth and spacing parameters were assessed and analysed. These parameters were optimized to achieve nanoindentation results independent of both indentation size (ISE) and overlapping effects. In order to attain this, 16 imprints were performed under an applied load of 45 mN. Figure 5 displays the ratio between the applied load and the stiffness squared (P/S2) as a function of penetration depth (h). It shows the minimum penetration depth, where the micromechanical properties will remain constant and unaffected by ISE, tip defect or scale effect. As evidenced in Figure 5, P/S2 reaches a plateau as penetration depth reaches values greater than 175 nm. This implies that for h ≥ 175 nm, it is possible to assess the intrinsic H and E for each constitutive phase. Thus, in the current study, the penetration depth was fixed at ≈200 nm. On the other hand, plastic flow induced by the indentation is known to be about 10 times the penetration depth [43]. Hence, for indentations performed on grains smaller than 2 µm, the plastic flow might not be confined within them, and it might be affected by the surrounding ones. However, as mentioned before, surface fractions occupied by grains finer than 2 µm are very small compared with those of grains whose size is within the medium and large ranges defined previously. Therefore, the effect of obtained hardness values from imprints performed in fine grains on the results are statistically negligible.
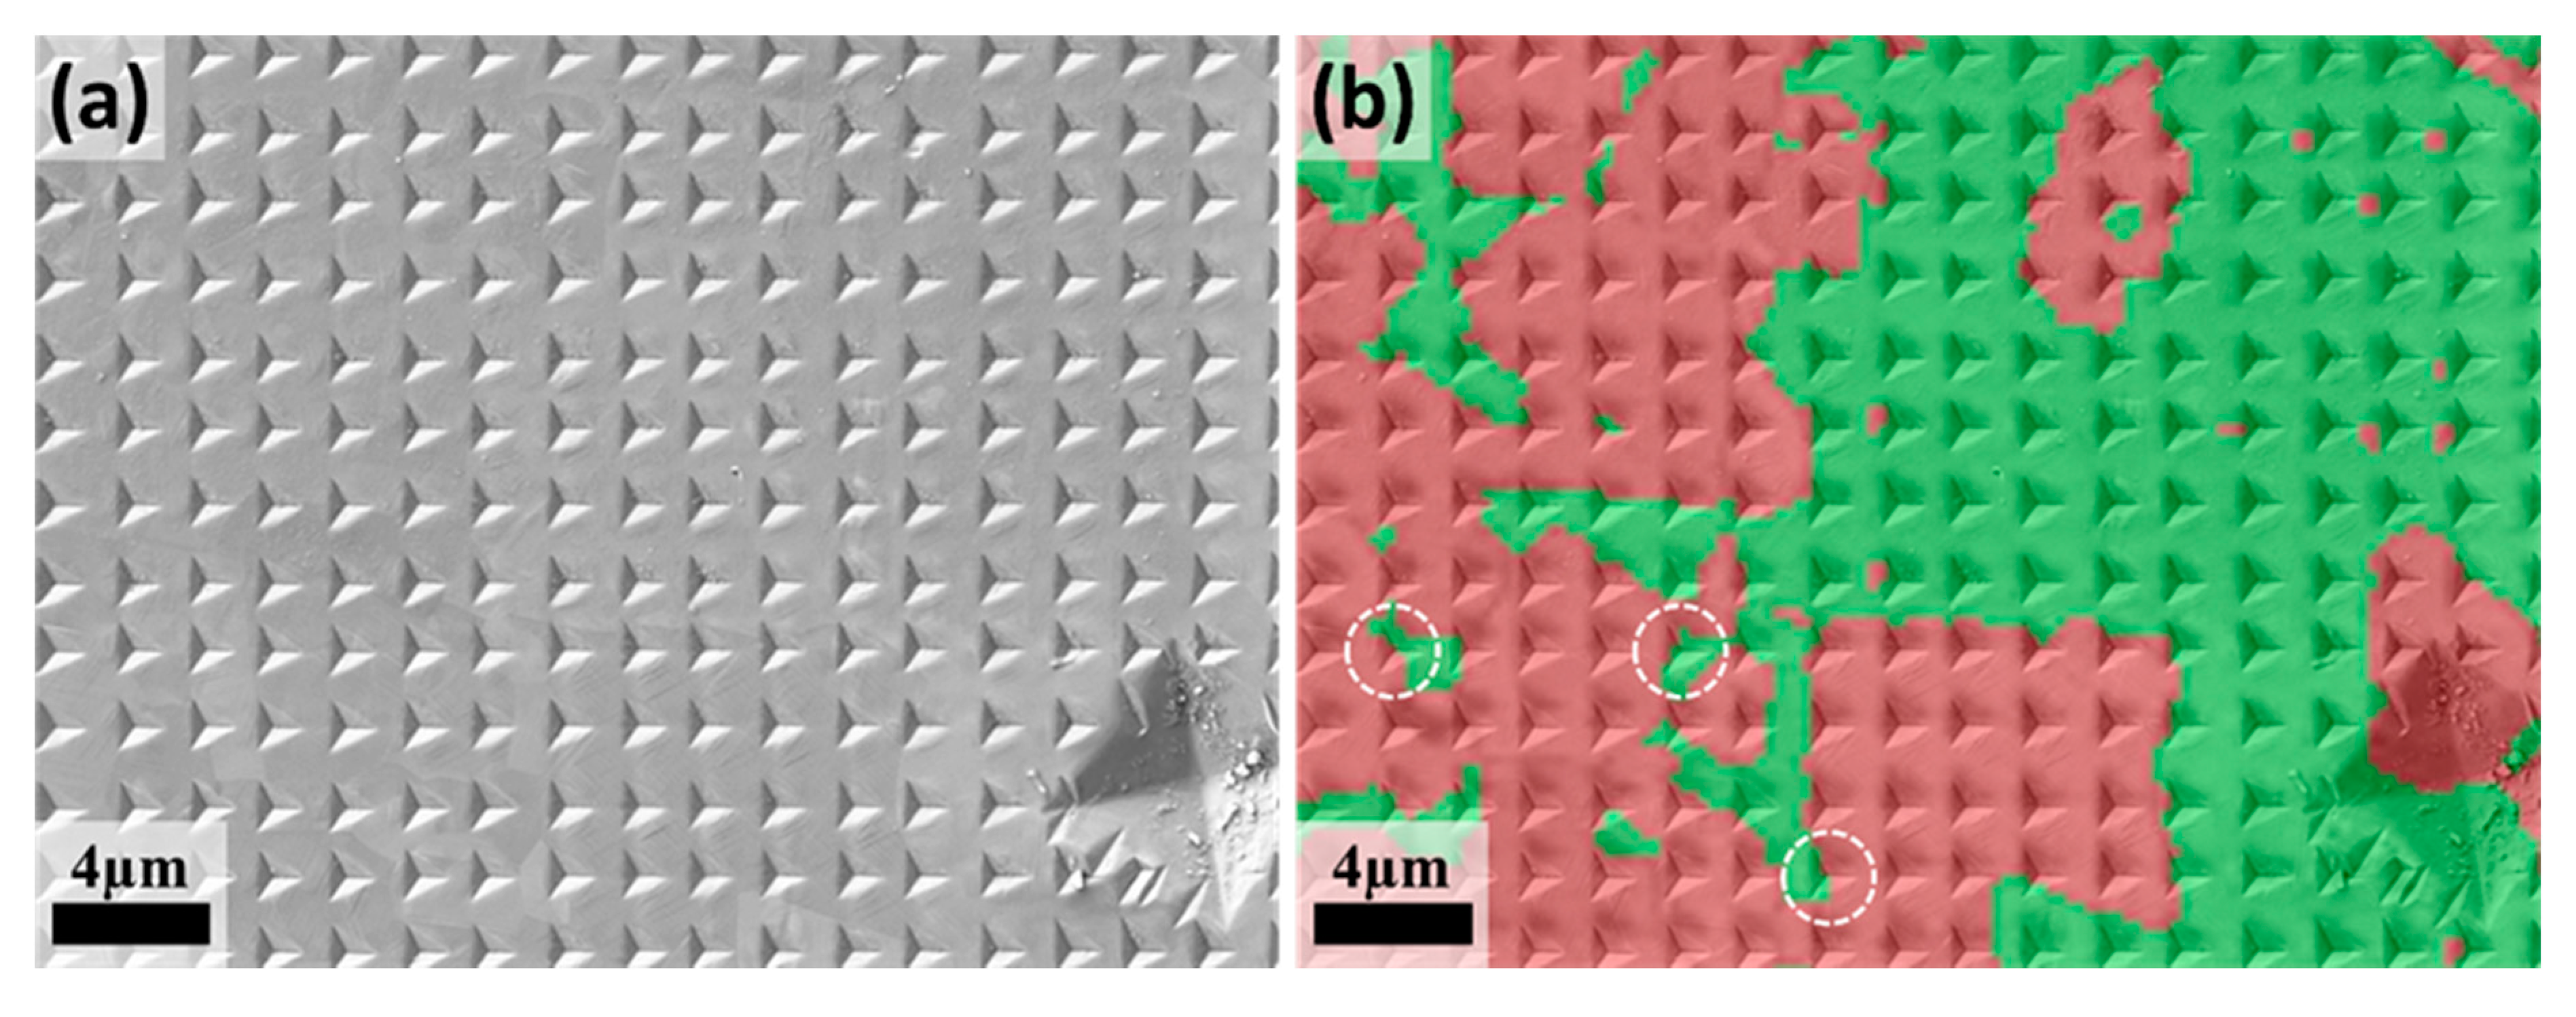
A high magnification EBSD micrograph of one indented area and the corresponding phase map is given in Figure 6. Similarly, another (at lower magnification) EBSD micrograph and the corresponding property maps: H, E and H/E ratio, obtained from the 10,000 (matrix of 100 by 100) imprints are shown in Figure 7 for HR and CR samples. Both γ (red) and α (green) phases are clearly differentiated in the EBSD maps of the indented regions. Meanwhile, within Figure 7, three distinct colour gradients (red, green and yellow) may be seen in the cartography maps. A qualitative visual comparison between EBSD and H-cartography maps demonstrates that red shades (ranges of 3.9–4.1 and 5.6–5.8 GPa for HR and CR respectively) correspond to the γ phase, while green tones (ranges of 3.5–3.7 GPa and 4.5–4.9 GPa for HR and CR respectively) are related to the α phase. From the obtained H-maps, it is evidenced that, as expected for the DSS studied, γ is harder than α. This might be related to the lower stacking fault energy (SFE) of γ phase, which in turn, promotes dislocation multiplication and more uniform dislocation distribution [22,23,49,58]. Moreover, it could be associated with the influence of the nitrogen on stabilizing the γ phase and promoting the deformation by planar glide, which strengthens γ grains [24,46].
This situation is different for elastic modulus. In Figure 7, α and γ are shown by red and green shades, respectively, in the E cartography map. It is observed that α phase has a higher elastic modulus than γ one. Moreover, yellow tinges (in both H and E maps) between γ and α phases can be considered as a composite response. It results from the indentations whose plastic zones include both α and γ phases; thus, α/γ interphase boundaries (see white dashed circles in Figure 6b).
As shown in Figure 7, limits between γ and α phases can only be faintly discerned from the H- and E-maps. On the other hand, phase contrast is more pronounced in the H/E ratio map. Although H and E represent different mechanical phenomena, the H and E values are interrelated in such a way that the corresponding H/E ratio demonstrates more consistent values. It highlights the differences of crystal structure and partition of chemical elements for each phase. Therefore, the H/E ratio yields a clearer map of γ and α phases [40], in which the austenitic phase manifests a higher plasticity ratio compared with the ferritic one.

3.2.2. Small-Scale Mechanical Properties of Each Constitutive Phase: Statistical Analysis

The evaluation of the mechanical properties of each constitutive phase in the studied DSS specimens under different processing conditions is quite challenging, since conventional nanoindentation results show only slight differences in hardness between the phases. Moreover, it has been reported that the hardness of each phase is anisotropic [29]. In order to overcome these challenges, statistical sampling was employed by the effective implementation of novel high-speed nanoindentation techniques. This allowed the collection of significant amounts of H and E data for each condition. Such a large amount of data enhances the accuracy of statistical analysis and enables one to discriminate relative differences for the mechanical properties of each phase.
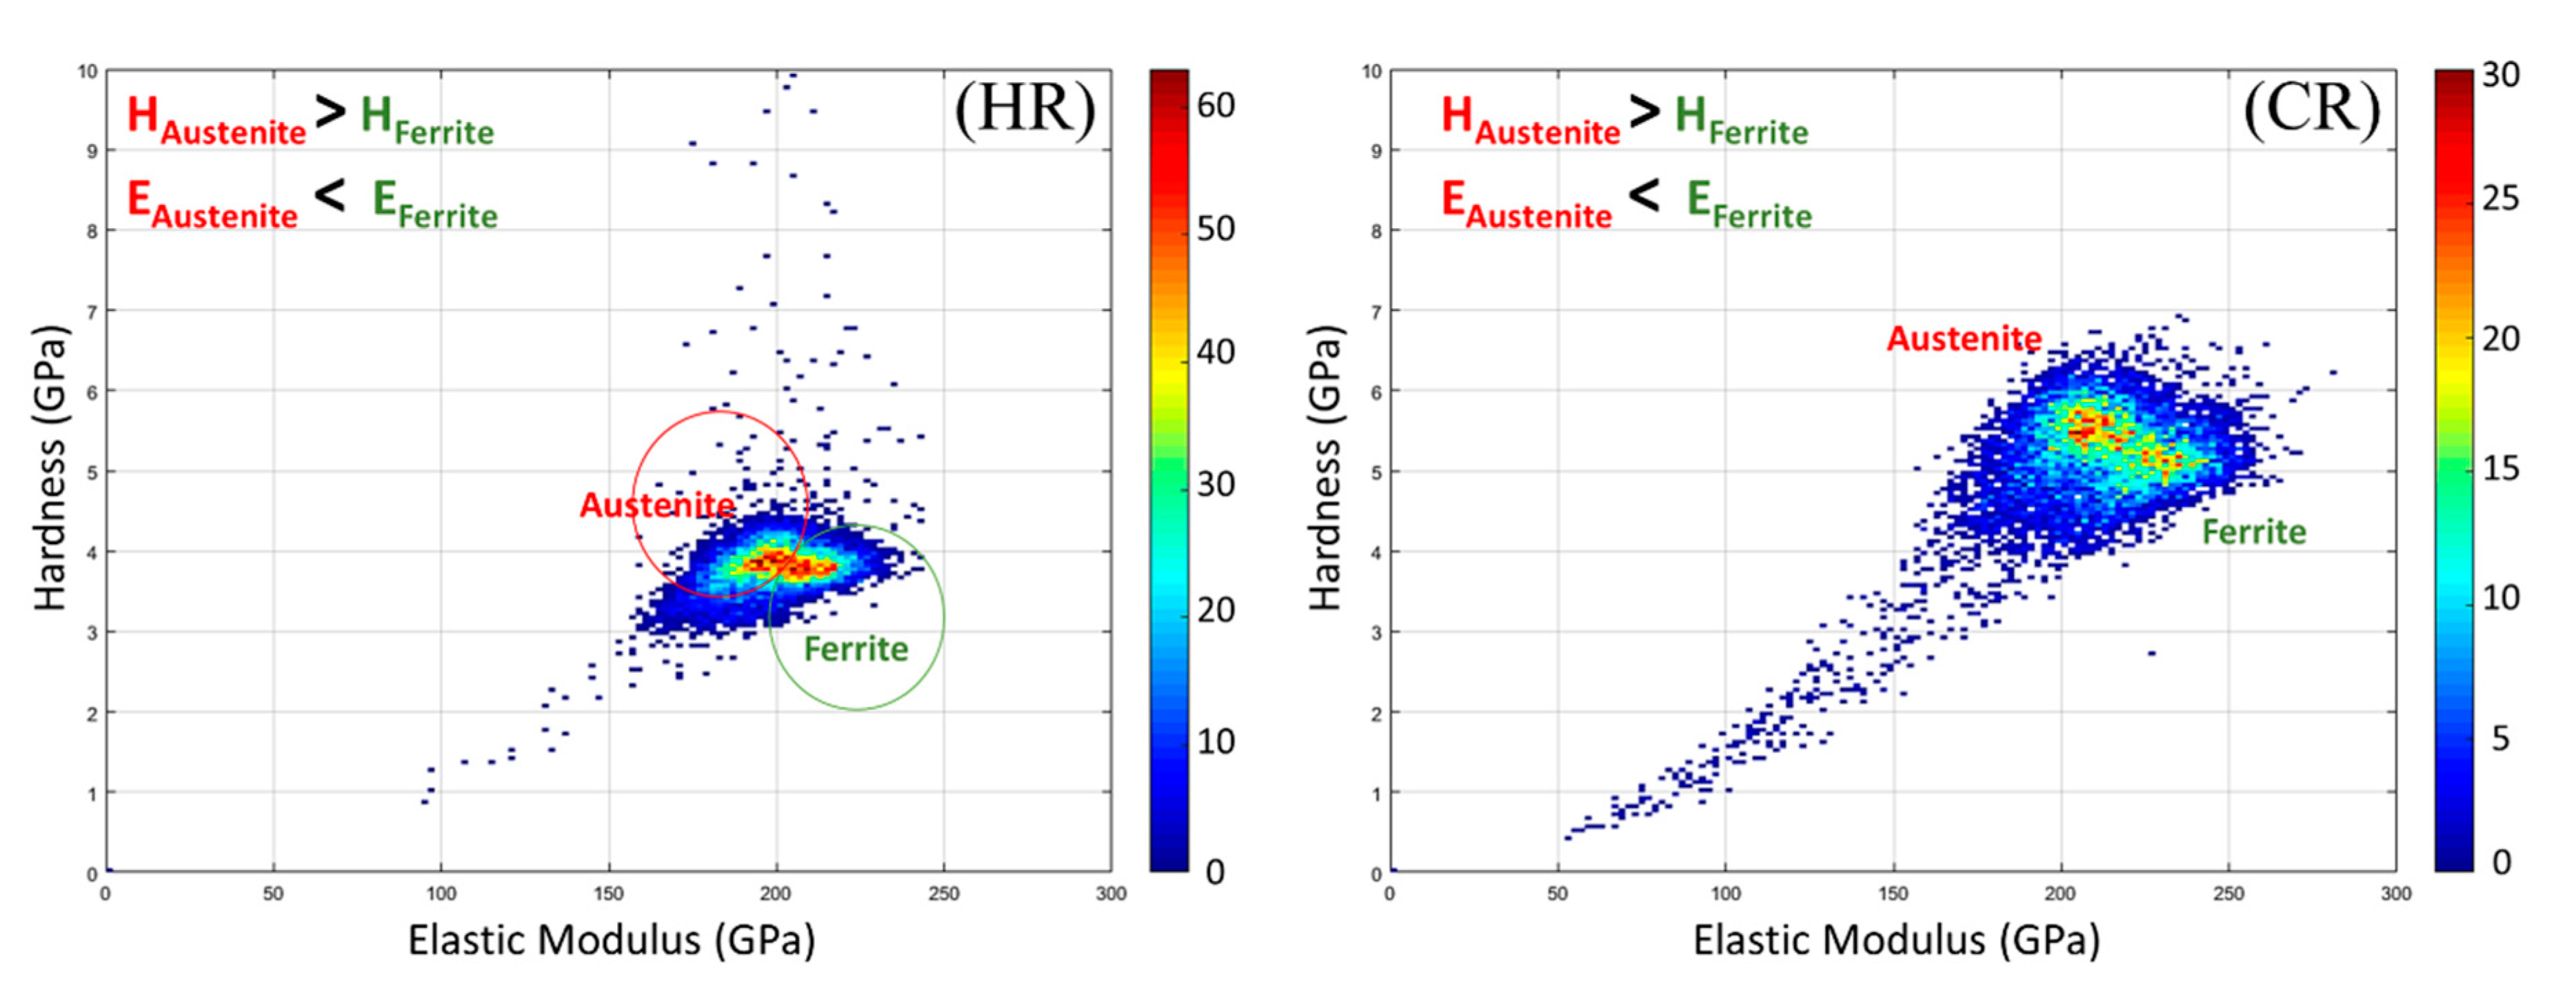
As was indicated above, the H/E ratio offers higher accuracy for discrimination of mechanical response of the constitutive phases of DSSs, as shown in Figure 7. Aiming to sustain this statement, a novel data analysis graph where H and E values are simultaneously displayed as a 2D histogram [40] is shown in Figure 8. It includes the H and E values obtained from 10,000 imprints performed on each HR and CR sample (a similar trend is also observed in FP condition, not shown here). In this image, the colour of each pixel represents the number of indentations that are included within a range of H and E, which is defined as a 2D bin size. Particularly, for CR, two clear peaks can be immediately identified in these plots. They correspond to the two major phases: one located at H~5.5 GPa and E~210 GPa, and another at H~5.0 GPa and E~240 GPa. The tail of pixels below these main peaks corresponds to blue and white traces within the H/E cartography map (Figure 7). It resulted from indentations into surface contamination that effectively reduce the penetration depth of the indentation, yielding lower values along the same H/E ratio as the underlying material. As depicted in Figure 7, the γ phase has a higher H/E ratio than the α phase. Therefore, the peaks with higher H (~3.8 GPa for HR and 5.5 GPa for CR) and lower E (~190 and 210 GPa for HR and CR respectively) values are attributed to the γ phase (FCC peak within Figure 8). Meanwhile, the other peaks with lower H (~3.6 GPa for HR and ~5.0 GPa for CR) and higher E (~210 GPa for HR and 240 GPa for CR) are attributed to the α phase (BCC peak in Figure 8). These peaks have overlapping property distributions. If the distributions were Gaussian and sufficiently separated, it would be expected to produce a saddle between the two peaks in the 2D histogram. However, the intensity of values between the two peaks is higher than might be expected—producing rather a ridgeline between them. This additional intensity may be rationalised by considering the indentations performed on the phase boundaries, and whose plastic zones included both phases (Figure 6), then yielding a composite-like (containing α/γ interphase boundaries) response.
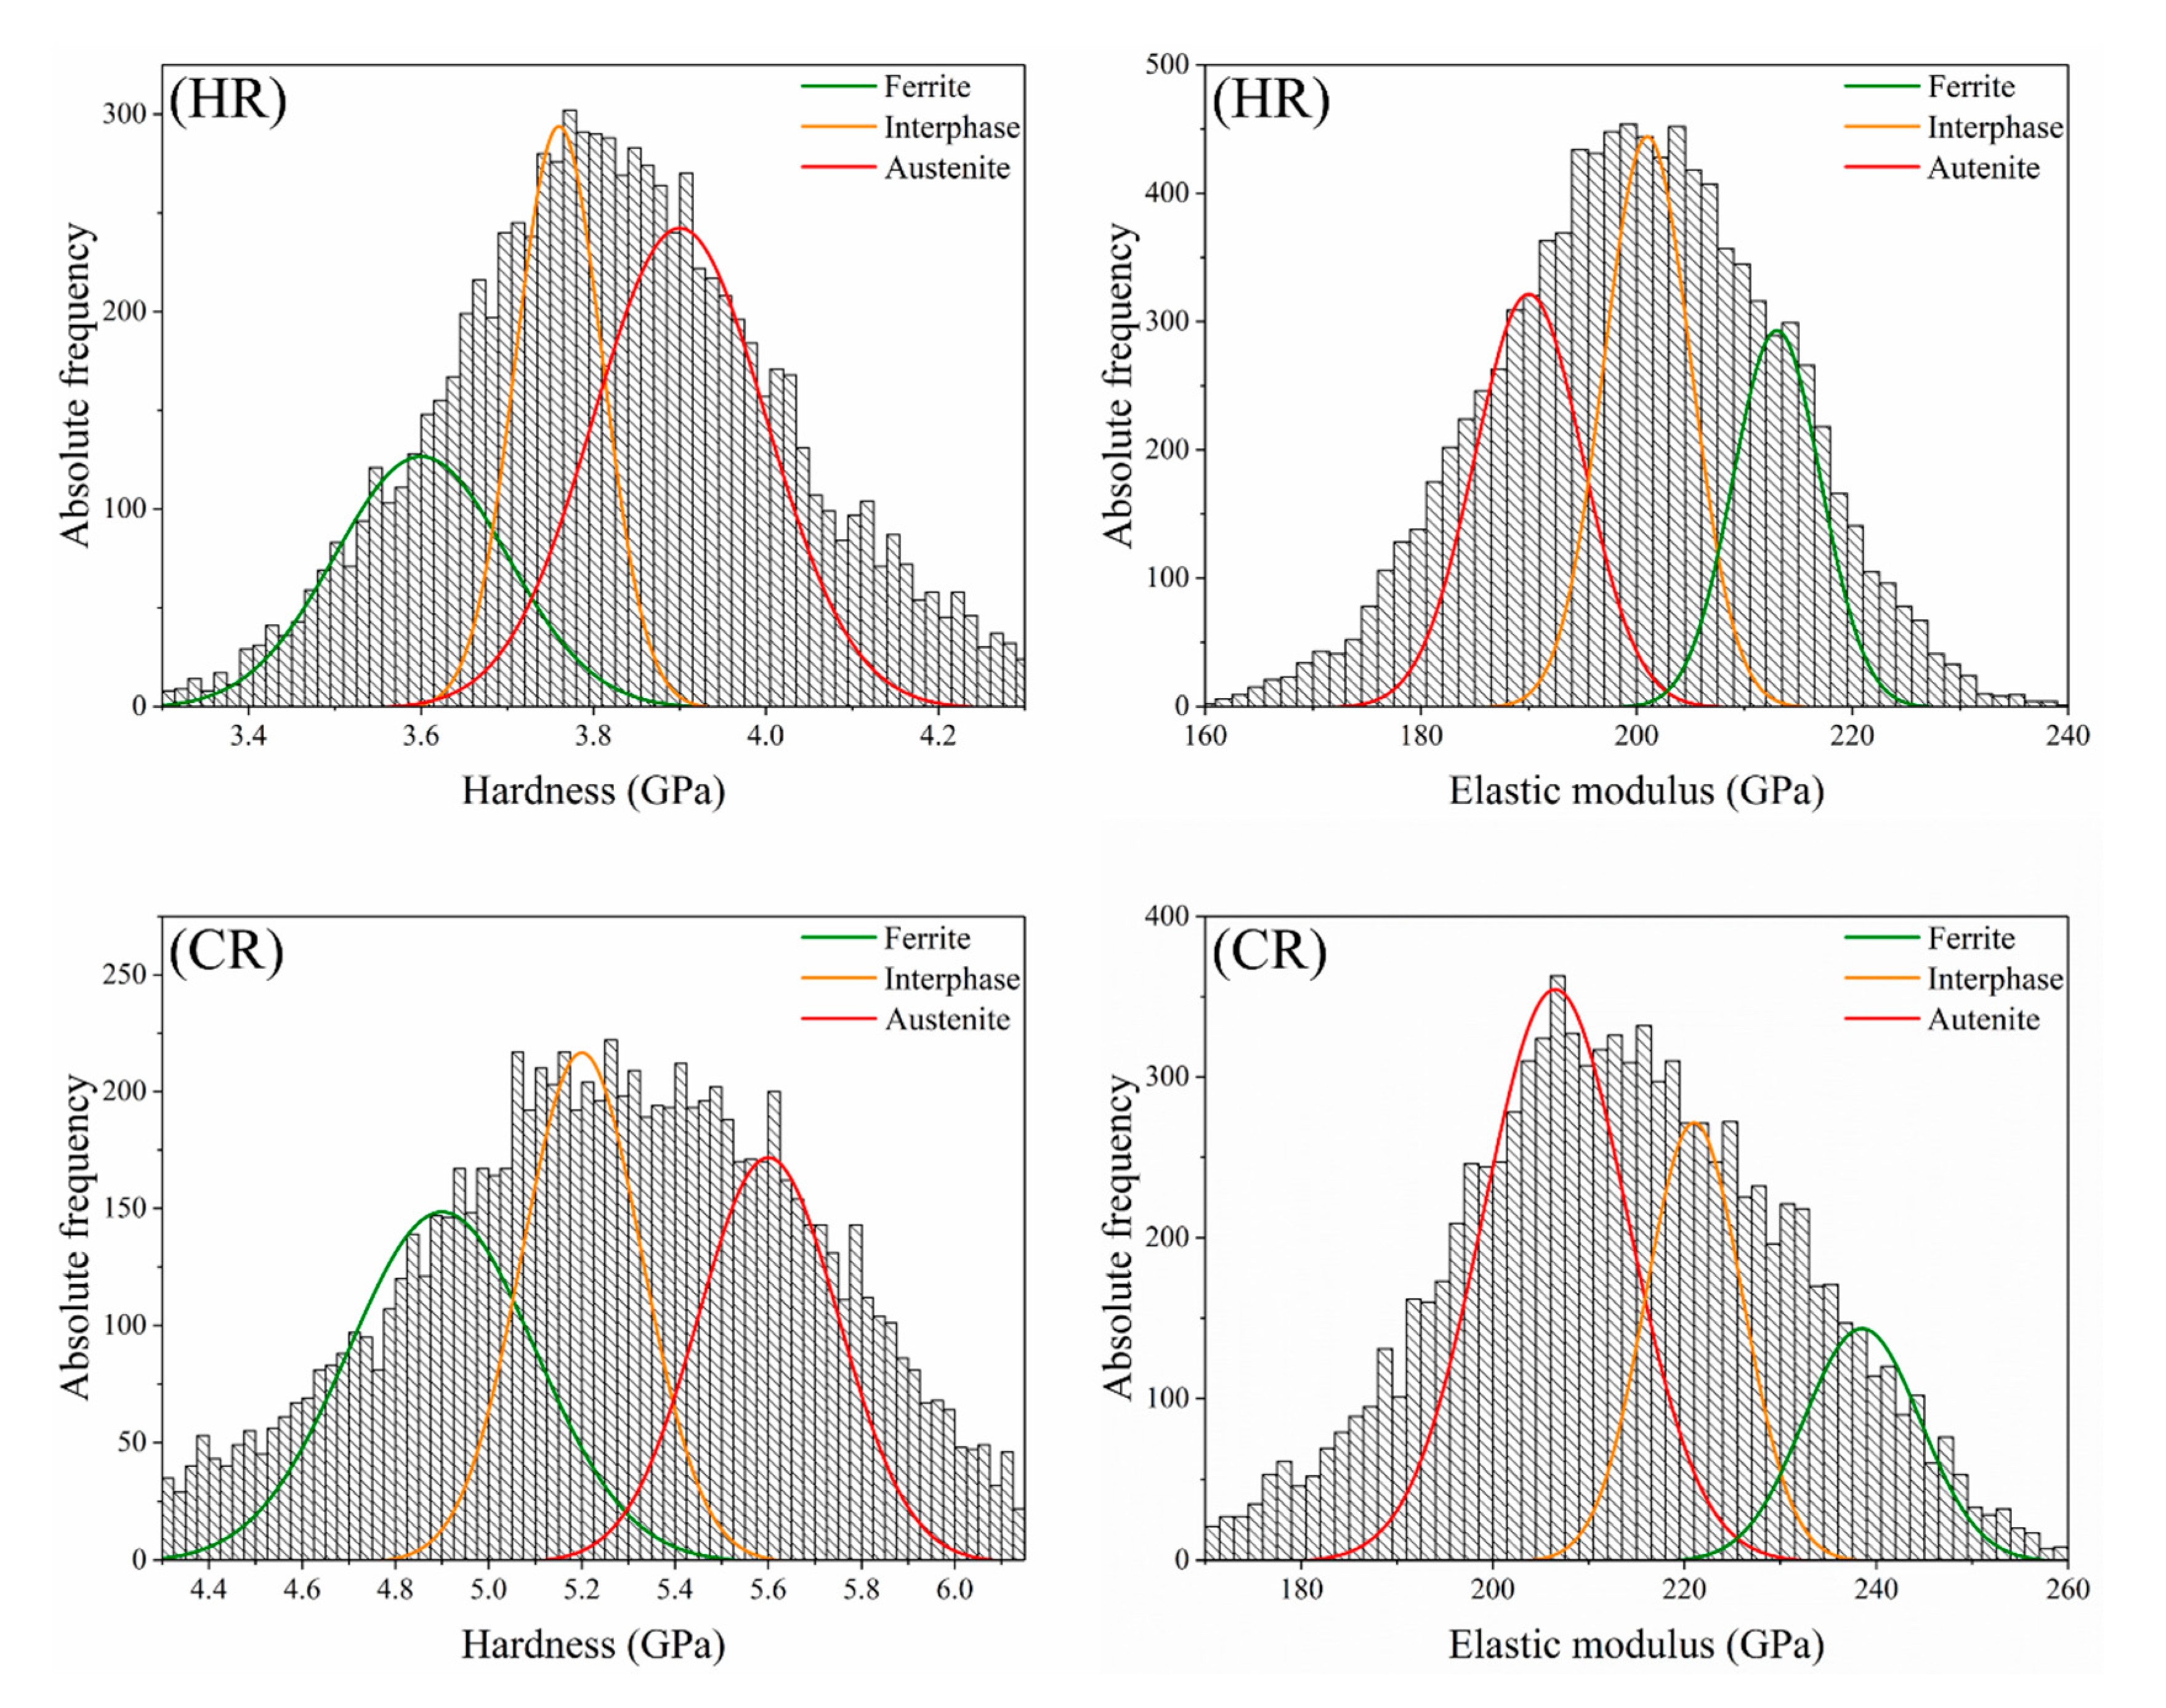
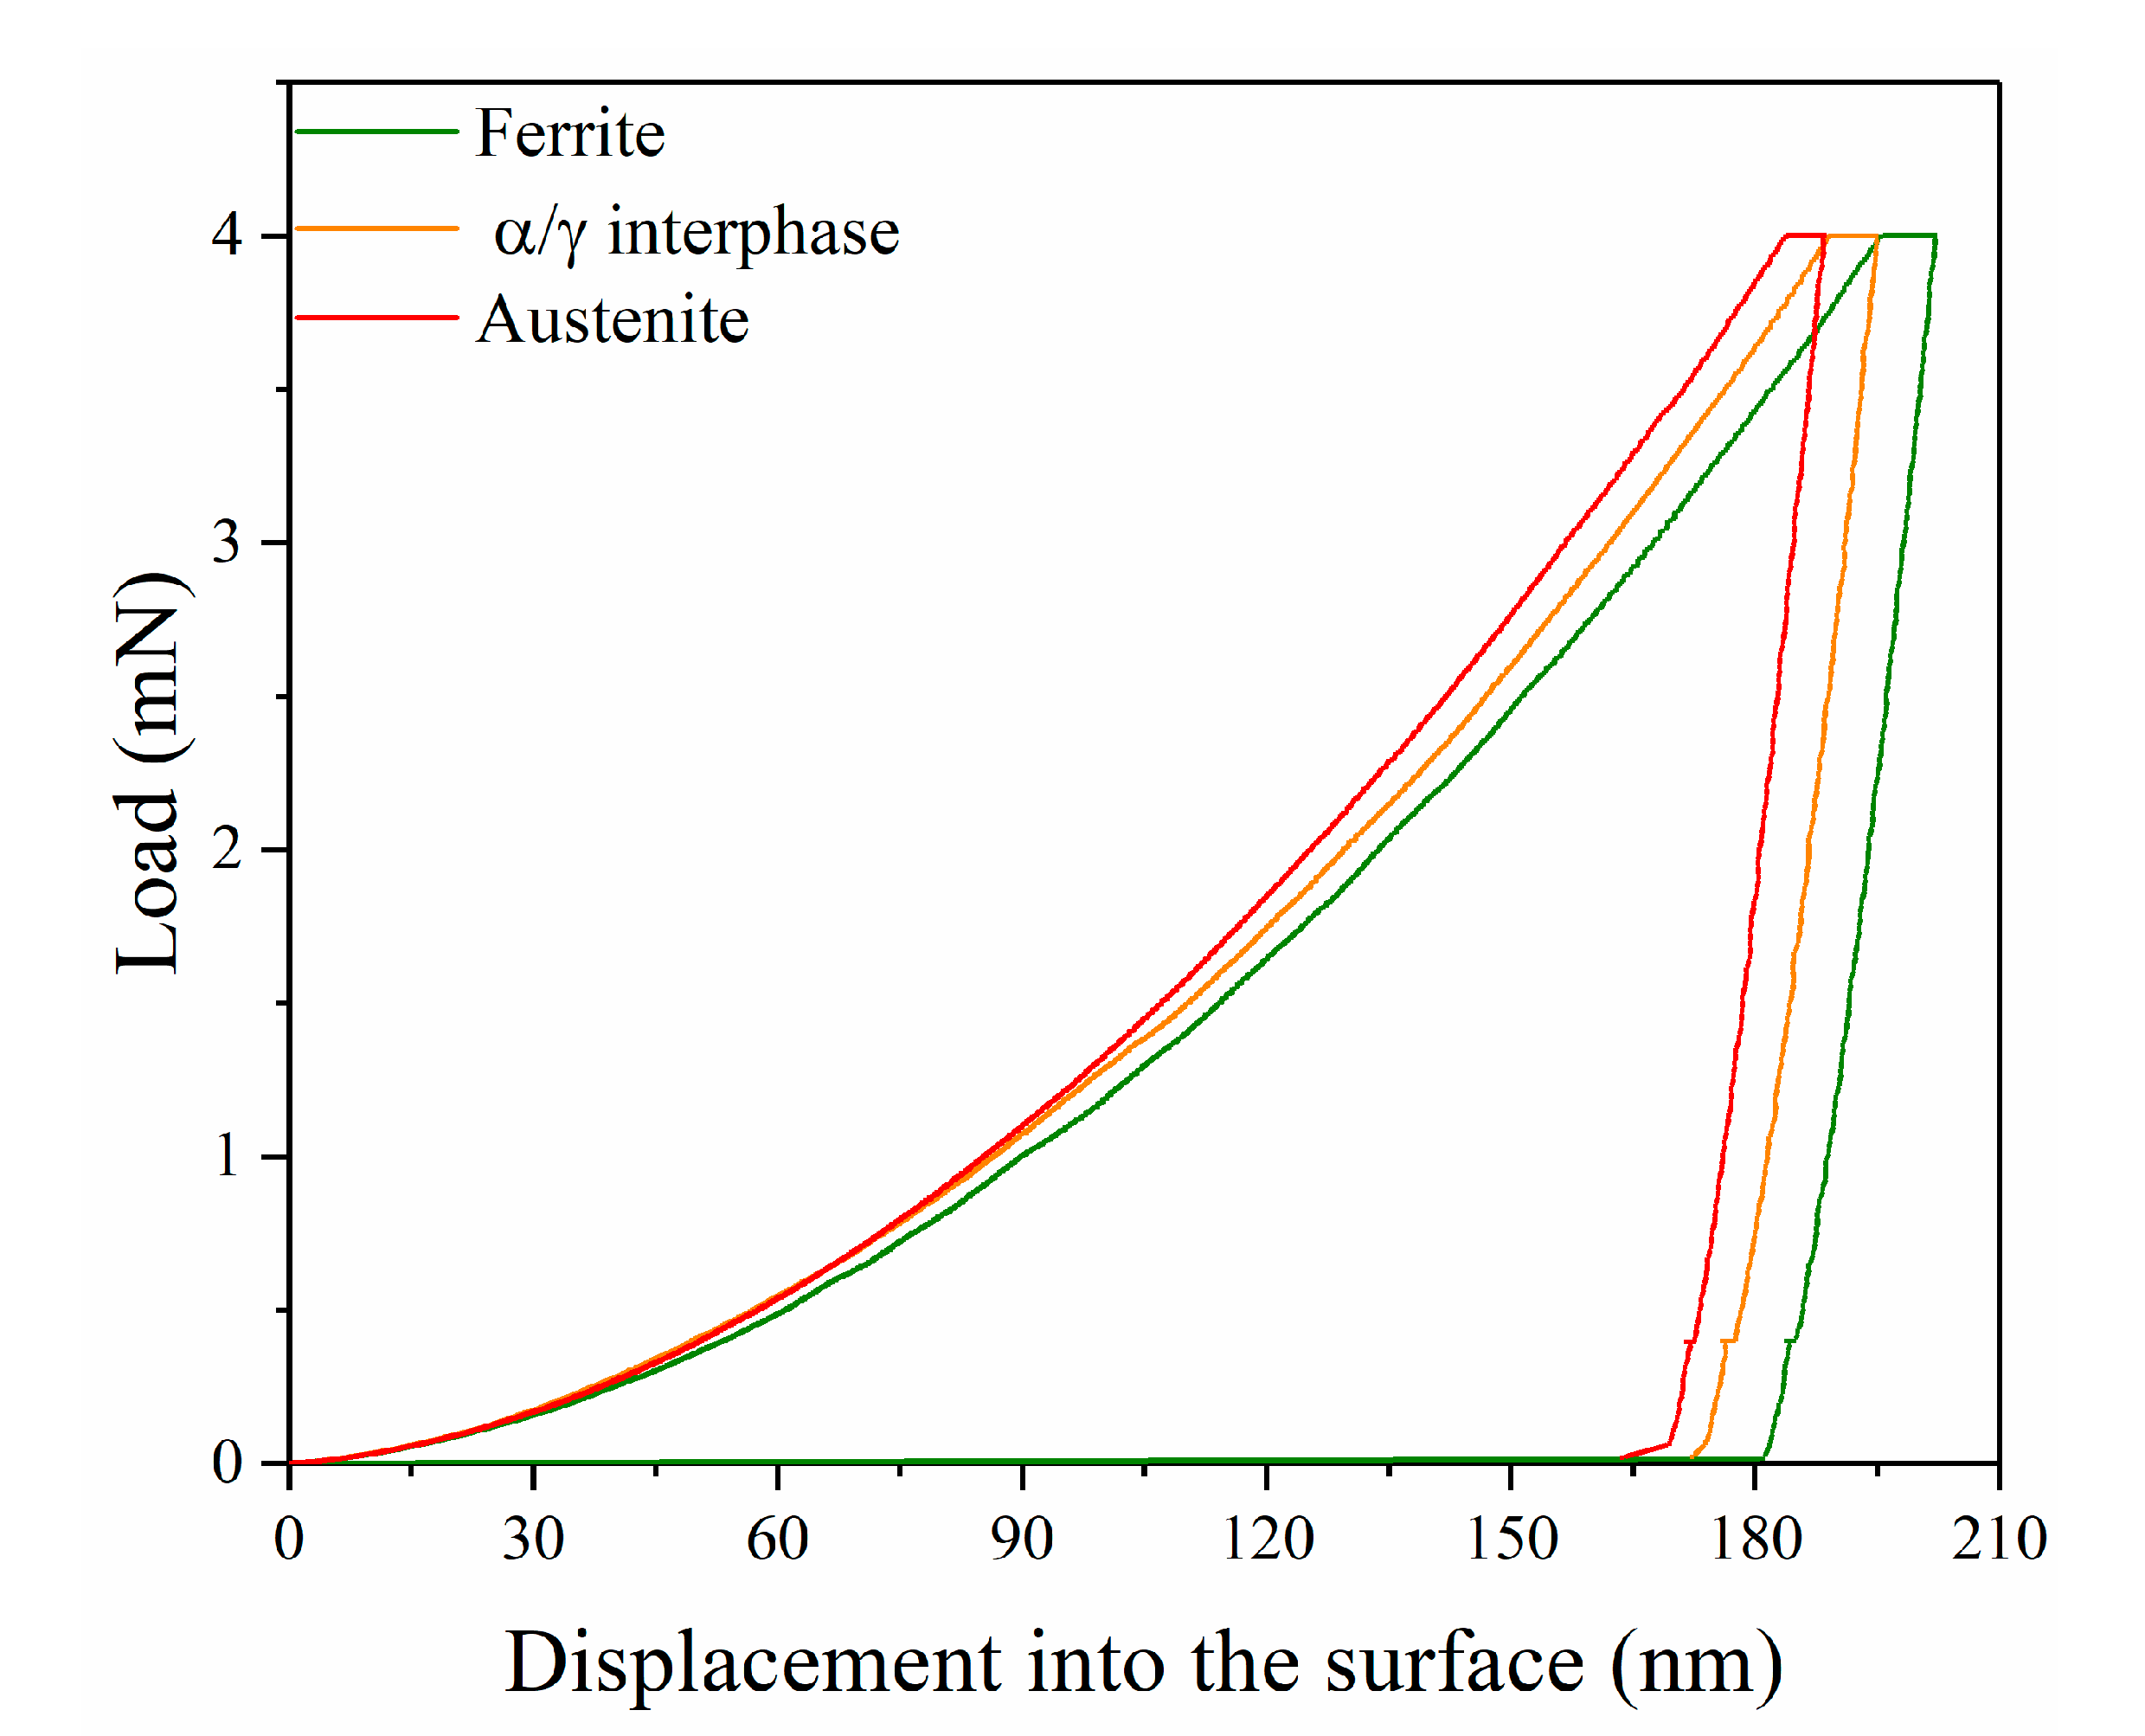
In order to obtain the mean values of H and E for each constitutive phase, the statistical analysis proposed by Ulm and co-workers [30,31,32,33] was implemented. Figure 9 shows separate H and E histograms calculated from the experimental data from HR and CR samples. Three peaks were fitted on each histogram. They correspond to γ, α, and composite-like (interphase) phases. By using the phase information from EBSD mapping (Figure 7), the different peaks could be clearly assigned to their respective phases for each investigated sample. These findings were further supported by relative differences discerned among experimental p-h curves. Representative examples of them are given in Figure 10, corresponding to discrete imprints examined and located within individual phase grains (ferrite and austenite) and regions containing phase boundaries.
These statistically derived results are in agreement with values previously reported in the literature, for DSSs with similar chemical compositions [22,23,24]. The obtained values for each constitutive phase for each processing condition are summarized in Table 2.
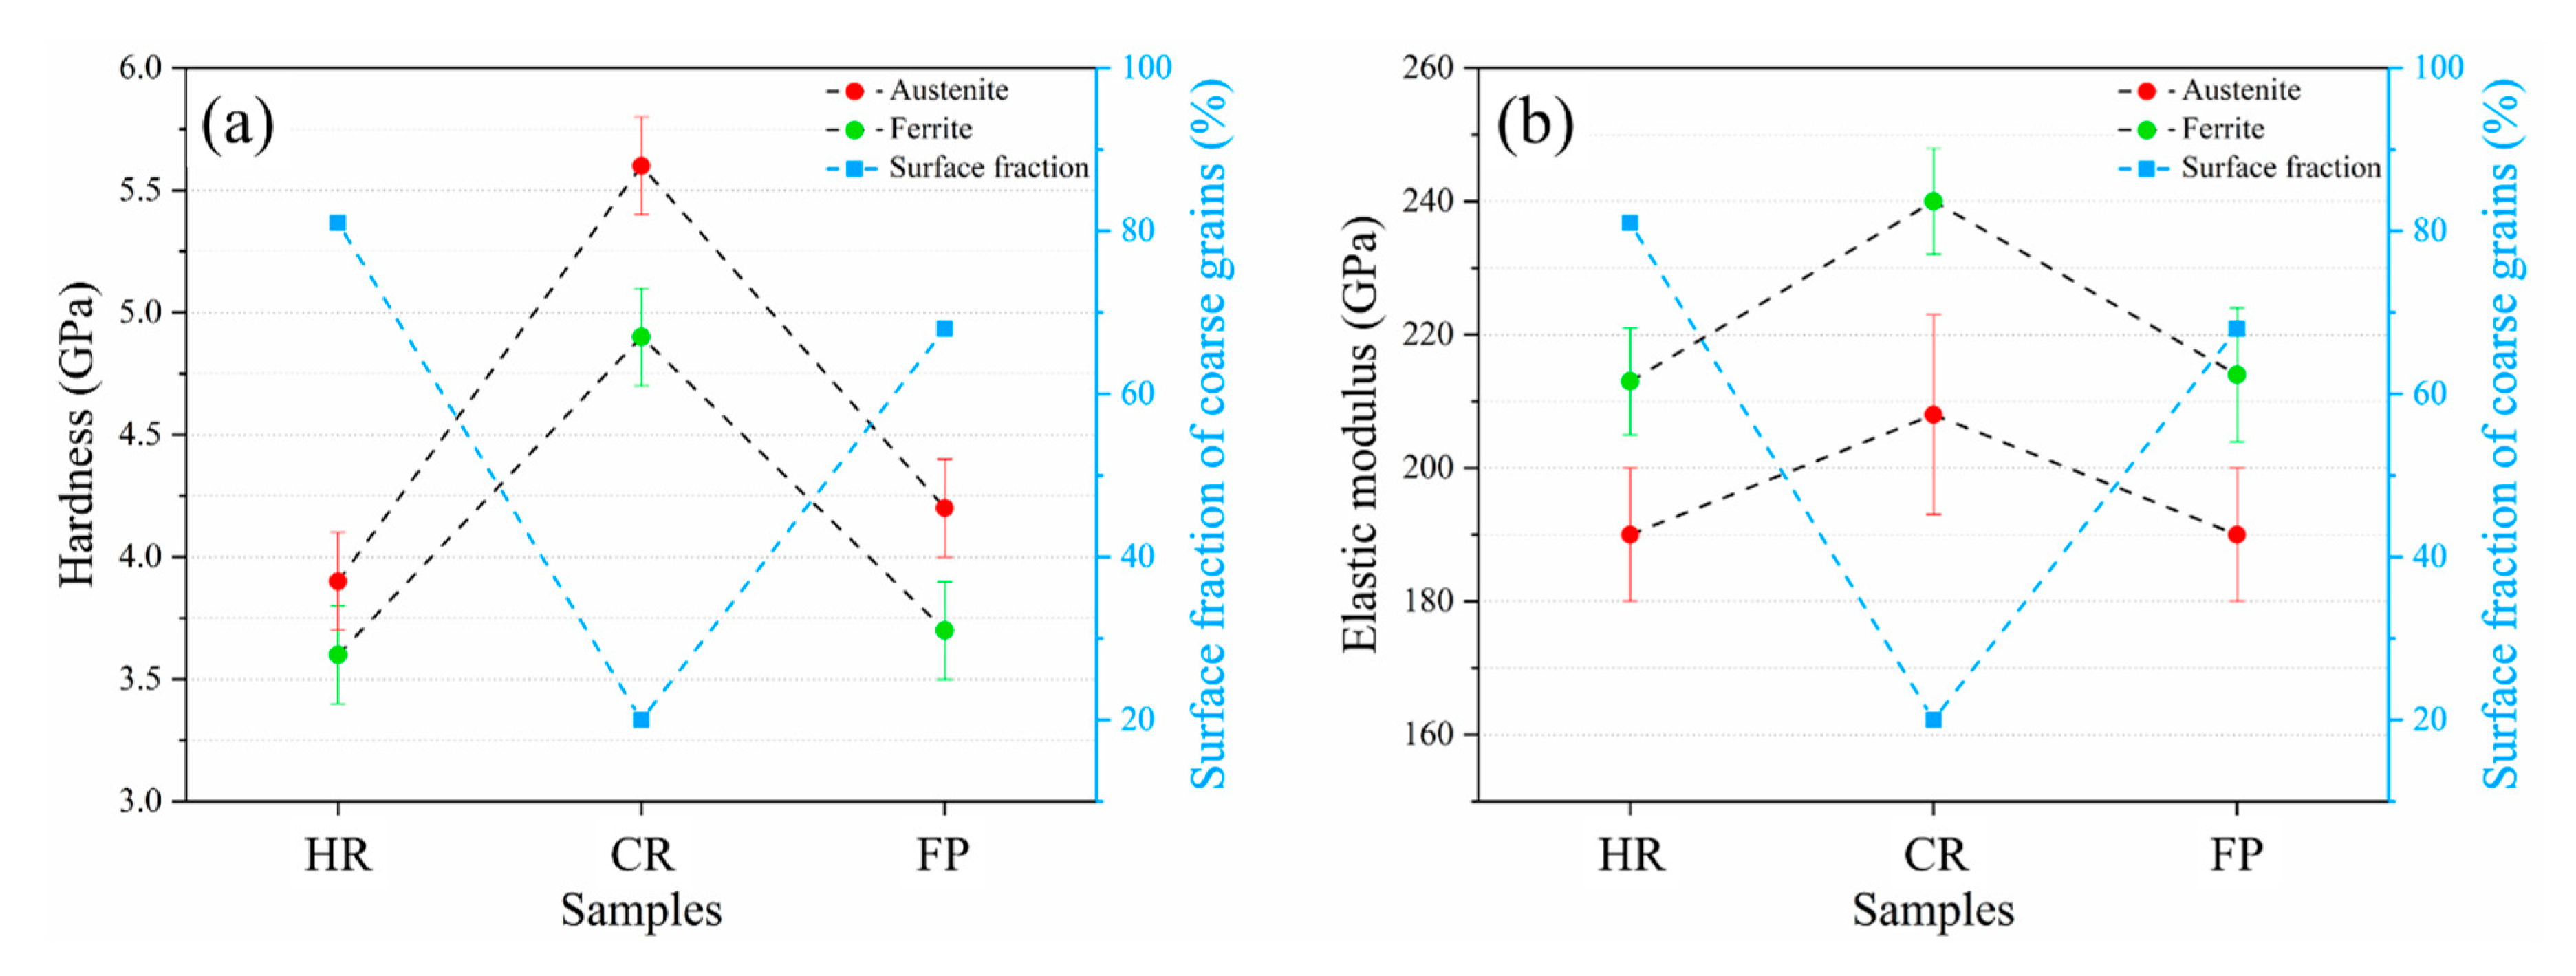
Figure 11a illustrates the influence of the processing conditions on the hardness of each constitutive phase, as well as on the surface fraction of coarse grains. As expected, H increased dramatically after cold working (CR) in both phases, due to dislocation glide, which in turn promoted an increment in the dislocation densities within the grains causing strain hardening [49,50]. Finally, after the annealing treatment (FP), the hardness value decreases as a consequence of the recovery and recrystallization mechanism within the deformed microstructure formed during the cold rolling step [59,60,61].
As shown in Table 2 and Figure 11b, the α phase exhibits a higher E (20 GPa) due to its BCC crystal structure, which has a lower interatomic distance (smaller lattice parameter) than the FCC crystal structure of the γ phase [22]. Hardness and elastic modulus differences must be taken into account to prevent crack appearance after intense plastic forming. More interestingly, and partially unexpected, the elastic modulus E of both phases changed after the cold-rolling step. Traditionally, the elastic modulus is considered a characteristic parameter, which remains constant irrespective of the grain size, phase morphology and chemical composition. For instance, the elastic modulus of plain carbon steels is assumed to be 210 GPa, while this value is 200 GPa in an AISI-304 (i.e., a highly alloyed steel). However, recent studies [62,63,64,65,66] carried out at macro-scale have shown that the elastic modulus has a minor but not irrelevant dependence on strain hardening. Account of this phenomenon allows having better predictions of the spring back character of most metallic alloys, which is indeed of enormous industrial interest. Although a detailed explanation of the observed response is out of the scope of this study, besides the strain hardening effect commented, crystallographic texture induced by the deformation itself could also be recalled as possible reason for explaining the above experimental findings. This hypothesis is supported by the fact that, once work hardening and deformation texture are removed by annealing (FP sample), elastic modulus values recover those assessed for the HR condition (Figure 11b).

4. Conclusions

The microstructure and micromechanical properties of each constitutive phase of a duplex stainless steel were investigated as a function of processing condition. According to the obtained results, the following conclusions may be drawn:
  • The surface fraction occupied by medium- and large-sized grains demonstrated a high sensitivity to cold work. Grains were significantly refined during cold work via the elongation and fragmentation of grains. Subsequent annealing treatment activated recovery and recrystallization of the grains, which caused a higher surface fraction of coarser grains.
  • Hardness and elastic modulus cartography maps provided a satisfactory correlation between micromechanical properties and constitutive phases (confirmed by EBSD analysis). The accuracy and definition of such a relationship were increased by using H/E maps. Therefore, the H/E ratio is proposed as an appropriated and reliable parameter for mechanically distinguishing between phases with relatively similar properties.
  • The different processing routes investigated here have similar effects on the mechanical properties of both phases. For the DSS here studied (with an intermediate N content of 0.15 in %wt), the austenitic phase demonstrated higher hardness and lower elastic modulus compared with the ferritic one.
  • Cold work resulted in higher values of hardness and elastic modulus for both austenite and ferrite phases, as compared to the hot-rolled as well as the annealed (final product) ones. Such relative changes assessed in the small-scale properties are expected to be related to work hardening and deformation texture effects. Further research is here recalled for a deeper understanding of these correlations.

Author Contributions

H.B.: conceptualization, investigation, writing—original draft, writing—review and editing. M.C.: Investigation, writing—review and editing. J.-M.C.: writing—review and editing. A.M.M.: writing—review and editing. G.F.: resources. J.M.W.: conceptualization, writing—review and editing. J.J.R.: writing—review and editing. L.L.: conceptualization, supervision, writing—review and editing. All authors have read and agreed to the published version of the manuscript.

Funding

This research was funded by the Spanish Ministerio de Economía y Competitividad through grant MAT2015-70780-C4-3-P (MINECO-FEDER).

Acknowledgments

Authors want to express their special thanks to Jose Antonio Benito for his time and scientific support. J.J.R acknowledges the Serra Hunter programme of the Generalitat de Catalunya. M.C. and J.-M.C. acknowledge the CONACyT Mexico for his Ph.D. grant and the partial funding of his sabbatical leave, respectively.

Conflicts of Interest

The authors declare no conflict of interest.

References

  1. Solomon, H.D.; Devine, T.M., Jr. Proc. Conf. on duplex stainless steels. Am. Soc. Met. Met. Park. 1983, 1, 693–756. [Google Scholar]
  2. Guha, P.; Clark, C. Properties and applications of high-chromium duplex stainless steels. In Duplex Stainless Steels; Lula, R.A., Ed.; American Society for Metals: Ceauga, OH, USA, 1983; pp. 355–369. [Google Scholar]
  3. Nilsson, J.-O. Super duplex stainless steels. Mater. Sci. Technol. 1992, 8, 685–700. [Google Scholar] [CrossRef]
  4. Olsson, J.; Snis, M. Duplex—A new generation of stainless steels for desalination plants. Desalination 2007, 205, 104–113. [Google Scholar] [CrossRef]
  5. Sotomayor, M.; De Kloe, R.; Levenfeld, B.; Varez, A. Microstructural study of duplex stainless steels obtained by powder injection molding. J. Alloys Compd. 2014, 589, 314–321. [Google Scholar] [CrossRef]
  6. Gunn, R.N. Duplex Stainless Steels; Elsevier: Amsterdam, The Netherlands, 1997. [Google Scholar]
  7. Tahchieva, A.B.; Llorca-Isern, N.; Cabrera-Marrero, J.-M. Duplex and Superduplex Stainless Steels: Microstructure and Property Evolution by Surface Modification Processes. Metals 2019, 9, 347. [Google Scholar] [CrossRef] [Green Version]
  8. Hertzman, S.; Charles, J. On the effect of nitrogen on duplex stainless steels. Rev. De Métallurgie 2011, 108, 413–425. [Google Scholar] [CrossRef]
  9. Horvath, W.; Prantl, W.; Stroißnigg, H.; Werner, E. Microhardness and microstructure of austenite and ferrite in nitrogen alloyed duplex steels between 20 and 500 °C. Mater. Sci. Eng. A 1998, 256, 227–236. [Google Scholar] [CrossRef]
  10. Malta, P.O.; Dias, F.L.; De Souza, A.C.M.; Santos, D.B. Microstructure and texture evolution of duplex stainless steels with different molybdenum contents. Mater. Charact. 2018, 142, 406–421. [Google Scholar] [CrossRef]
  11. Song, J.; Bate, P. Plastic Anisotropy in A Superplastic Duplex Stainless Steel. Acta Mater. 1997, 45, 2747–2757. [Google Scholar] [CrossRef]
  12. Sarkar, A.; Sanyal, S.; Bandyopadhyay, T.; Mandal, S. Influence of annealing parameters on phase evolution and recrystallization kinetics of a Mn-Al-Si alloyed duplex steel. Mater. Charact. 2017, 134, 213–224. [Google Scholar] [CrossRef]
  13. Fargas, G.; Anglada, M.; Mateo, A. Effect of the annealing temperature on the mechanical properties, formability and corrosion resistance of hot-rolled duplex stainless steel. J. Mater. Process. Technol. 2009, 209, 1770–1782. [Google Scholar] [CrossRef]
  14. Martins, M.; Casteletti, L.C. Heat treatment temperature influence on ASTM A890 GR 6A super duplex stainless steel microstructure. Mater. Charact. 2005, 55, 225–233. [Google Scholar] [CrossRef]
  15. Hutchinson, W.B.; Ushioda, K.; Runnsjö, G. Anisotropy of tensile behaviour in a duplex stainless steel sheet. Mater. Sci. Technol. 1985, 1, 728–736. [Google Scholar] [CrossRef]
  16. Rodrigues, D.G.; Maria, G.G.B.; Viana, N.A.L.; Santos, D. Effect of low cold-rolling strain on microstructure, texture, phase transformation, and mechanical properties of 2304 lean duplex stainless steel. Mater. Charact. 2019, 150, 138–149. [Google Scholar] [CrossRef]
  17. Mateo, A. Anisotropy effects on the fatigue behaviour of rolled duplex stainless steels. Int. J. Fatigue 2003, 25, 481–488. [Google Scholar] [CrossRef]
  18. Ren, L.; Xiao, W.; Han, W.; Ma, C.; Zhou, L. Influence of duplex ageing on secondary α precipitates and mechanical properties of the near β-Ti alloy Ti-55531. Mater. Charact. 2018, 144, 1–8. [Google Scholar] [CrossRef]
  19. Cabrera-Marrero, J.-M. Hot deformation of duplex stainless steels. J. Mater. Process. Technol. 2003, 143, 321–325. [Google Scholar] [CrossRef]
  20. Hosseini, A.; Karlsson, V.; Örnek, L.; Reccagni, C.; Wessman, P.; Engelberg, D.S. Microstructure and functionality of a uniquely graded super duplex stainless steel designed by a novel arc heat treatment method. Mater. Charact. 2018, 139, 390–400. [Google Scholar] [CrossRef]
  21. Moallemi, M.; Zarei-Hanzaki, A.; Kim, S.J.; Alimadadi, H. On the microstructural-textural characterization and deformation analysis of a nano/ultrafine grained Fe-20Cr-8Mn-0.3N duplex alloy with superior mechanical properties. Mater. Charact. 2019, 156, 109878. [Google Scholar] [CrossRef]
  22. Wang, X.F.; Yang, X.P.; Guo, Z.D.; Zhou, Y.C.; Song, H.W. Nanoindentation Characterization of Mechanical Properties of Ferrite and Austenite in Duplex Stainless Steel. Adv. Mater. Res. 2007, 26, 1165–1170. [Google Scholar] [CrossRef]
  23. Fargas, G.; Akdut, N.; Anglada, M.; Mateo, A. Microstructural Evolution during Industrial Rolling of a Duplex Stainless Steel. ISIJ Int. 2008, 48, 1596–1602. [Google Scholar] [CrossRef] [Green Version]
  24. Tao, P.; Gong, J.; Wang, Y.-F.; Jiang, Y.; Li, Y.; Cen, W.-W. Characterization on stress-strain behavior of ferrite and austenite in a 2205 duplex stainless steel based on nanoindentation and finite element method. Results Phys. 2018, 11, 377–384. [Google Scholar] [CrossRef]
  25. Zhang, Q.; Singaravelu, A.S.S.; Zhao, Y.; Jing, T.; Chawla, N. Mechanical properties of a thermally-aged cast duplex stainless steel by nanoindentation and micropillar compression. Mater. Sci. Eng. A 2019, 743, 520–528. [Google Scholar] [CrossRef]
  26. Olanipekun, A.T.; Nthabiseng, M.; Ayodele, O.O.; Mphahlele, M.; Mampuya, B.M.; Olubambi, P.A. Datasets on the measurement of mechanical properties of ferrite and austenite constitutive phases using nanoindentation and micro hardness techniques. Data Brief. 2019, 27, 104551. [Google Scholar] [CrossRef]
  27. Tromas, C.; Stinville, J.; Templier, C.; Villechaise, P. Hardness and elastic modulus gradients in plasma-nitrided 316L polycrystalline stainless steel investigated by nanoindentation tomography. Acta Mater. 2012, 60, 1965–1973. [Google Scholar] [CrossRef]
  28. Taylor, M.; Choi, K.; Sun, X.; Matlock, D.; Packard, C.E.; Xu, L.; Barlat, F. Correlations between nanoindentation hardness and macroscopic mechanical properties in DP980 steels. Mater. Sci. Eng. A 2014, 597, 431–439. [Google Scholar] [CrossRef]
  29. Roa, J.; Fargas, G.; Mateo, A.; Jimenez-Pique, E. Dependence of nanoindentation hardness with crystallographic orientation of austenite grains in metastable stainless steels. Mater. Sci. Eng. A 2015, 645, 188–195. [Google Scholar] [CrossRef]
  30. Constantinides, G.; Ulm, F.-J.; Van Vliet, K. On the use of nanoindentation for cementitious materials. Mater. Struct. 2003, 36, 191–196. [Google Scholar] [CrossRef]
  31. Constantinides, G.; Chandran, K.R.; Ulm, F.-J.; Van Vliet, K. Grid indentation analysis of composite microstructure and mechanics: Principles and validation. Mater. Sci. Eng. A 2006, 430, 189–202. [Google Scholar] [CrossRef]
  32. Constantinides, G.; Ulm, F.-J. The nanogranular nature of C–S–H. J. Mech. Phys. Solids 2007, 55, 64–90. [Google Scholar] [CrossRef]
  33. Ulm, F.-J.; Vandamme, M.; Bobko, C.; Ortega, J.A.; Tai, K.; Ortiz, C. Statistical Indentation Techniques for Hydrated Nanocomposites: Concrete, Bone, and Shale. J. Am. Ceram. Soc. 2007, 90, 2677–2692. [Google Scholar] [CrossRef] [Green Version]
  34. Roa, J.; Jimenez-Pique, E.; Verge, C.; Tarragó, J.; Mateo, A.; Fair, J.; Llanes, L. Intrinsic hardness of constitutive phases in WC–Co composites: Nanoindentation testing, statistical analysis, WC crystal orientation effects and flow stress for the constrained metallic binder. J. Eur. Ceram. Soc. 2015, 35, 3419–3425. [Google Scholar] [CrossRef]
  35. De Bono, D.M.; London, T.; Baker, M.; Whiting, M. A robust inverse analysis method to estimate the local tensile properties of heterogeneous materials from nano-indentation data. Int. J. Mech. Sci. 2017, 123, 162–176. [Google Scholar] [CrossRef] [Green Version]
  36. Besharatloo, H.; De Nicolas, M.; Roa, J.; Dios, M.; Mateo, A.; Ferrari, B.; Gordo, E.; Llanes, L. Assessment of mechanical properties at microstructural length scale of Ti(C,N)–FeNi ceramic-metal composites by means of massive nanoindentation and statistical analysis. Ceram. Int. 2019, 45, 20202–20210. [Google Scholar] [CrossRef]
  37. Besharatloo, H.; Gordon, S.; Rodriguez-Suarez, T.; Can, A.; Oliver, W.; Llanes, L.; Roa, J. Small-scale mechanical properties of constitutive phases within a polycrystalline cubic boron nitride composite. J. Eur. Ceram. Soc. 2019, 39, 5181–5189. [Google Scholar] [CrossRef]
  38. Besharatloo, H.; De Nicolas, M.; Wheeler, J.; Mateo, A.; Ferrari, B.; Gordo, E.; Llanes, L.; Roa, J. Carbon addition effects on microstructure and small-scale hardness for Ti(C.,N)-FeNi cermets. Int. J. Refract. Met. Hard Mater. 2019, 85, 105064. [Google Scholar] [CrossRef]
  39. De Nicolás, M.; Besharatloo, H.; Wheeler, J.; De Dios, M.; Alvaredo, P.; Roa, J.; Ferrari, B.; Llanes, L.; Gordo, E. Influence of the processing route on the properties of Ti(C,N)-Fe15Ni cermets. Int. J. Refract. Met. Hard Mater. 2020, 87, 105046. [Google Scholar] [CrossRef]
  40. Xiao, Y.; Besharatloo, H.; Gan, B.; Maeder, X.; Spolenak, R.; Wheeler, J.M. Combinatorial investigation of Al–Cu intermetallics using small-scale mechanical testing. J. Alloy. Compd. 2020, 822, 153536. [Google Scholar] [CrossRef]
  41. Oliver, W.; Pharr, G. An improved technique for determining hardness and elastic modulus using load and displacement sensing indentation experiments. J. Mater. Res. 1992, 7, 1564–1583. [Google Scholar] [CrossRef]
  42. Oliver, W.; Pharr, G. Measurement of hardness and elastic modulus by instrumented indentation: Advances in understanding and refinements to methodology. J. Mater. Res. 2004, 19, 3–20. [Google Scholar] [CrossRef]
  43. Phani, P.S.; Oliver, W. A critical assessment of the effect of indentation spacing on the measurement of hardness and modulus using instrumented indentation testing. Mater. Des. 2019, 164, 107563. [Google Scholar] [CrossRef]
  44. Callister, W.D.; Rethwisch, D.G. Materials Science and Engineering; John Wiley & Sons: Hoboken, NY, USA, 2011. [Google Scholar]
  45. Metallographic determination of microstructure. Part 2: Measurement of WC grain size, in: ISO 4499-2 2008, Hardmetals, Geneva, 2008.
  46. Gadelrab, K.R.; Li, G.; Chiesa, M.; Souier, T. Local characterization of austenite and ferrite phases in duplex stainless steel using MFM and nanoindentation. J. Mater. Res. 2012, 27, 1573–1579. [Google Scholar] [CrossRef] [Green Version]
  47. Shamanth, V.; Kumar, P.; Ravishankar, K. Effect of Heat Treatment on the High Cycle Fatigue Behaviour of S2205 Duplex Stainless Steels. Mater. Today Proc. 2017, 4, 10798–10802. [Google Scholar] [CrossRef]
  48. Schwarm, S.C.; Kolli, R.P.; Aydogan, E.; Mburu, S.; Ankem, S. Characterization of phase properties and deformation in ferritic-austenitic duplex stainless steels by nanoindentation and finite element method. Mater. Sci. Eng. A 2017, 680, 359–367. [Google Scholar] [CrossRef] [Green Version]
  49. Malta, P.O.; Condé, B.L.; Assumpção, R.F.; Perasoli, D.B.; Sicupira, D.C.; Santos, D.B. Effect of Annealing Temperature on Mechanical Behavior, Pitting Resistance and Grain Boundary Character of a 2304 Lean Duplex Stainless Steel. Met. Mater. Trans. A 2019, 50, 2665–2677. [Google Scholar] [CrossRef]
  50. Breda, M.; Brunelli, K.; Grazzi, F.; Scherillo, A.; Calliari, I. Effects of Cold Rolling and Strain-Induced Martensite Formation in a SAF 2205 Duplex Stainless Steel. Met. Mater. Trans. A 2014, 46, 577–586. [Google Scholar] [CrossRef]
  51. Zhou, T.; Xiong, Y.; Yue, Y.; Lu, Y.; Chen, Y.-N.; He, T.-T.; Ren, F.-Z.; Singh, H.; Kömi, J.; Huttula, M.; et al. Controlled cold rolling effect on microstructure and mechanical properties of Ce-modified SAF 2507 super duplex stainless steel. Mater. Sci. Eng. A 2019, 766, 138352. [Google Scholar] [CrossRef]
  52. Cooke, B.A.; Jones, A.R.; Ralph, B. Recrystallization of microduplex steels. Met. Sci. 1979, 13, 179–186. [Google Scholar] [CrossRef]
  53. Blicharski, M. Structure of deformed ferrite–Austenite stainless steel. Met. Sci. 1984, 18, 92–98. [Google Scholar] [CrossRef]
  54. Padilha, A.F.; Plaut, R.L.; Rios, P.R. Annealing of Cold-worked Austenitic Stainless Steels. ISIJ Int. 2003, 43, 135–143. [Google Scholar] [CrossRef]
  55. Johannsen, D.L.; Kyröläinen, A.; Ferreira, P. Influence of annealing treatment on the formation of nano/submicron grain size AISI 301 Austenitic stainless steels. Met. Mater. Trans. A 2006, 37, 2325–2338. [Google Scholar] [CrossRef]
  56. Ghosh, S.K.; Mahata, D.; Roychaudhuri, R.; Mondal, R. Effect of rolling deformation and solution treatment on microstructure and mechanical properties of a cast duplex stainless steel. Bull. Mater. Sci. 2012, 35, 839–846. [Google Scholar] [CrossRef] [Green Version]
  57. Moura, A.; Favarato, L.; Filho, A.I.; Alcântara, C.M.; Cunha, M.; Oliveira, T.; Machado, M. Study of the recrystallization and crystallographic texture evolution during final annealing of UNS S32304 Lean Duplex stainless steel. Mater. Charact. 2017, 130, 39–49. [Google Scholar] [CrossRef]
  58. Farnoush, H.; Momeni, A.; Dehghani, K.; Mohandesi, J.A.; Keshmiri, H. Hot deformation characteristics of 2205 duplex stainless steel based on the behavior of constituent phases. Mater. Des. 2010, 31, 220–226. [Google Scholar] [CrossRef]
  59. Zhang, X.; Wen, Z.; Dou, R.; Zhou, G.; Li, Z. Evolution of microstructure and mechanical properties of cold-rolled SUS430 stainless steel during a continuous annealing process. Mater. Sci. Eng. A 2014, 598, 22–27. [Google Scholar] [CrossRef]
  60. Rezaei, H.; Ghazani, M.S.; Eghbali, B. Effect of post deformation annealing on the microstructure and mechanical properties of cold rolled AISI 321 austenitic stainless steel. Mater. Sci. Eng. A 2018, 736, 364–374. [Google Scholar] [CrossRef]
  61. Sun, G.; Du, L.; Hu, J.; Zhang, B.; Misra, R.D.K. On the influence of deformation mechanism during cold and warm rolling on annealing behavior of a 304 stainless steel. Mater. Sci. Eng. A 2019, 746, 341–355. [Google Scholar] [CrossRef]
  62. Fonseca, I.; Benito, J.; Mejía, I.; Jorba, J.; Roca, A. Variación del módulo de Young en el acero C45E (norma EN 10083) tratado térmicamente. Rev. De Met. 2002, 38, 249–255. [Google Scholar] [CrossRef] [Green Version]
  63. Pérez, R.; Benito, J.; Prado, J.M. Study of the Inelastic Response of TRIP Steels after Plastic Deformation. ISIJ Int. 2005, 45, 1925–1933. [Google Scholar] [CrossRef] [Green Version]
  64. Mejía, I.; Maldonado, C.; Benito, J.A.; Jorba-Peiro, J.; Vallmajor, A.R. Determination of the Work Hardening Exponent by the Hollomon and Differential Crussard-Jaoul Analyses of Cold Drawn Ferrite-Pearlite Steels. Mater. Sci. Forum 2006, 509, 37–42. [Google Scholar] [CrossRef]
  65. Yamada, Y.; Kuwabara, T. Materials for Springs; Springer Science & Business Media: Berlin, Germany, 2007. [Google Scholar]
  66. Kizu, T.; Okuda, K.; Nagataki, Y.; Urabe, T.; Seto, K. Influence of Tensile Strain on Young’s Modulus in High-strength Cold-rolled Steel Sheets. ISIJ Int. 2015, 55, 1502–1511. [Google Scholar] [CrossRef] [Green Version]
Figure 1. Schematic diagram of industrial processing steps associated with the duplex stainless steel (DSS) specimens investigated in this study.
Metals 10 01352 g001
Figure 2. Image quality (IQ) of the different DSS samples studied.
Metals 10 01352 g002
Figure 3. (a) Microstructure of the hot rolled (HR) sample illustrated by IQ; (b) phase map which illustrates the surface fraction of the γ and α phases; and (c) volume fractions of both constitutive phases for all the studied samples.
Metals 10 01352 g003
Figure 4. (a) Grain size histogram for HR sample, with 250 nm of bin size, computed from at least 2000 counted grains. (b) Surface fraction occupied by grains with different size ranges for all the studied samples.
Metals 10 01352 g004
Figure 5. P/S2 ratio versus displacement into the surface for indentations on cold rolled (CR) sample.
Metals 10 01352 g005
Figure 6. (a) Field emission scanning electron microscope (FESEM) micrograph of a region of the indented surface. (b) Phase map of the same region overlaid with the original micrograph.
Metals 10 01352 g006
Figure 7. Electron backscatter diffraction (EBSD) maps of indented surfaces and corresponding cartography maps of indicated region for HR and CR samples.
Metals 10 01352 g007
Figure 8. 2D histograms of Hardness (y-axis) vs. Elastic Modulus (x-axis) acquired from 10,000 indentations on each HR and CR sample.
Metals 10 01352 g008
Figure 9. H and E histograms with bin sizes of 25 MPa and 1.5 GPa respectively, evaluated from 10,000 indentations for HR and CR samples studied.
Metals 10 01352 g009
Figure 10. Load-displacement curves obtained from different imprints performed on austenite, ferrite and interphase.
Metals 10 01352 g010
Figure 11. Intrinsic mechanical properties [(a)-H and (b)-E] evolution of both ferritic and austenitic phases and surface fraction of coarse grains during the DSS processing.
Metals 10 01352 g011
Table 1. Chemical composition of the studied DSS (wt. %).
CMnPSSiCrNiMoNFe
0.0232.550.0260.0060.4522.625.923.020.158Bal.
Table 2. Summary of H and E values of the defined phases in each processing condition of DSS determined from statistical analysis.
SamplesHardness, H (GPa)Elastic modulus, E (GPa)
αα/γ Interphaseγαα/γ Interphaseγ
HR3.6 ± 0.23.8 ± 0.13.9 ± 0.2213 ± 8201 ± 8190 ± 10
CR4.9 ± 0.25.2 ± 0.25.6 ± 0.2240 ± 8220 ± 10208 ± 15
FP3.7 ± 0.23.9 ± 0.24.2 ± 0.2215 ± 10202 ± 7190 ± 10