Electrodeposition of NiSn-rGO Composite Coatings from Deep Eutectic Solvents and Their Physicochemical Characterization


 ,
,  ,
,  , and
, and
Abstract
:1. Introduction
2. Materials and Methods
2.1. Chemicals and Electrolyte Preparation
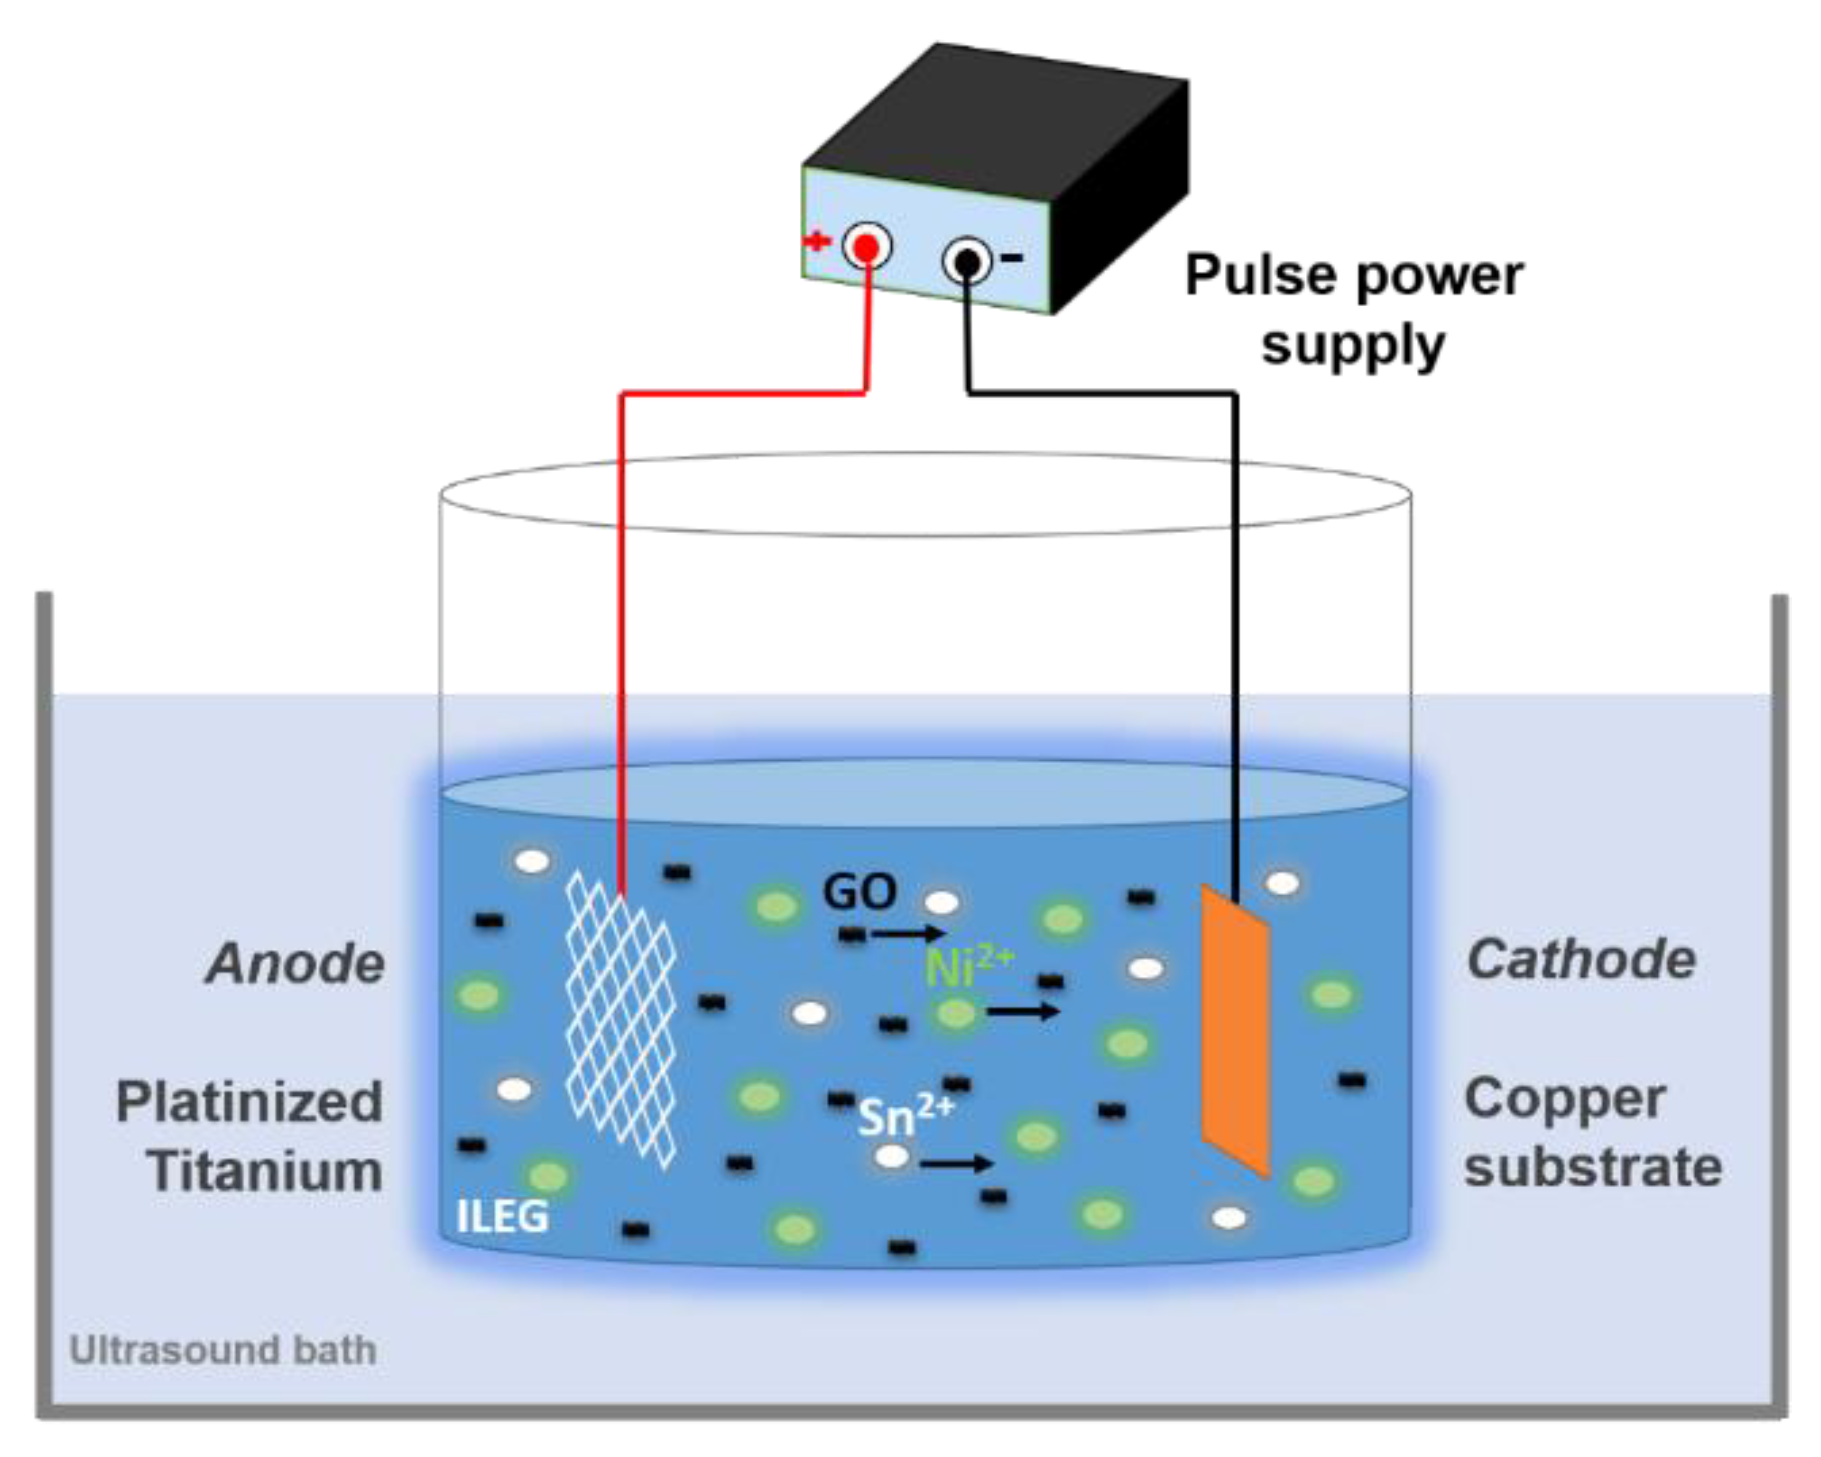
2.2. Electrodeposition Experiments
2.3. Cyclic Voltammetry and Corrosion Experiments
2.4. Surface Characterization
3. Results and Discussion
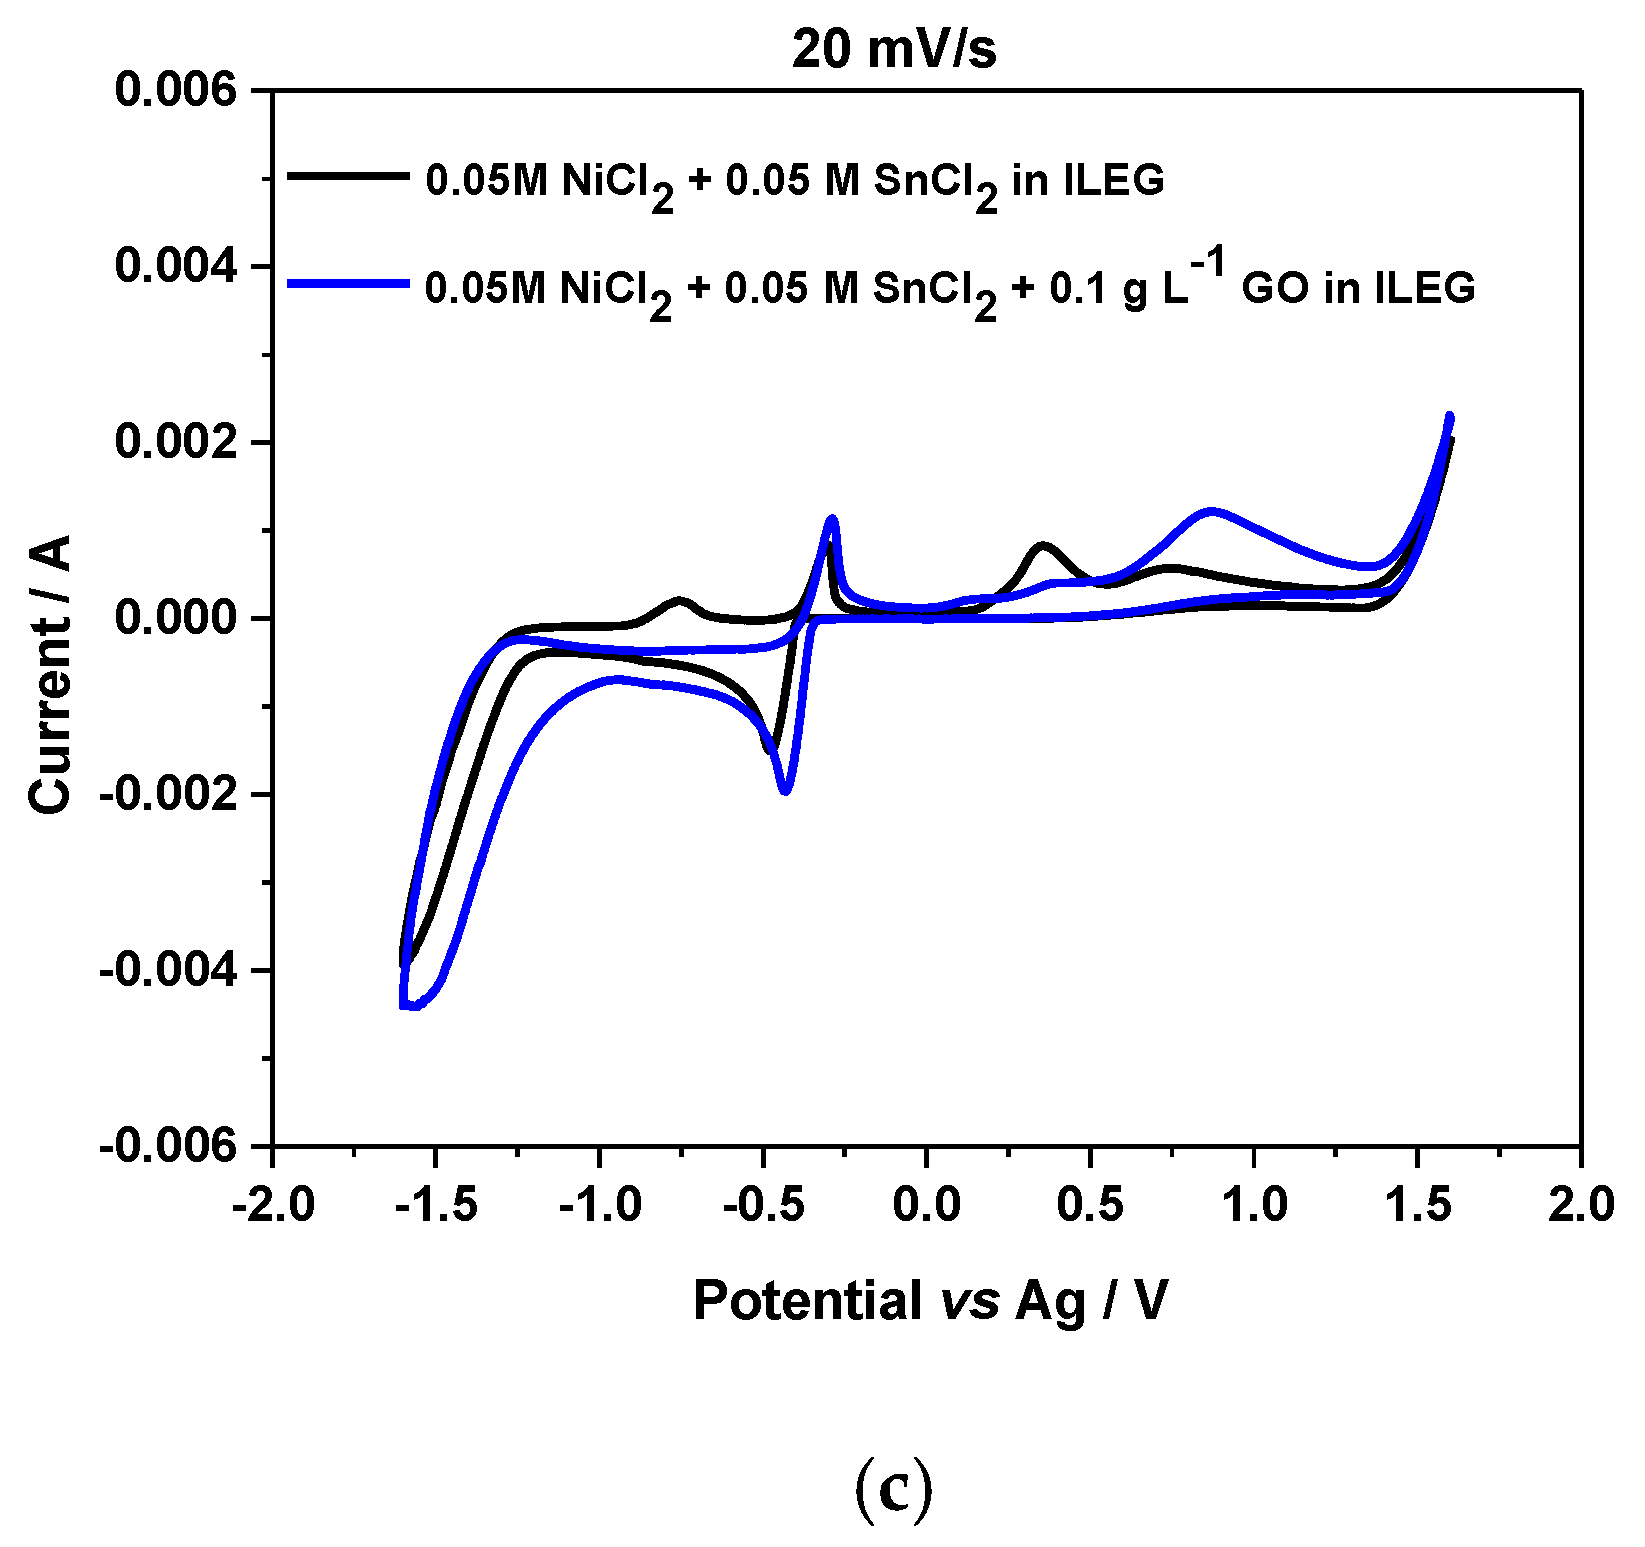
3.1. Cyclic Voltammetry Experiments
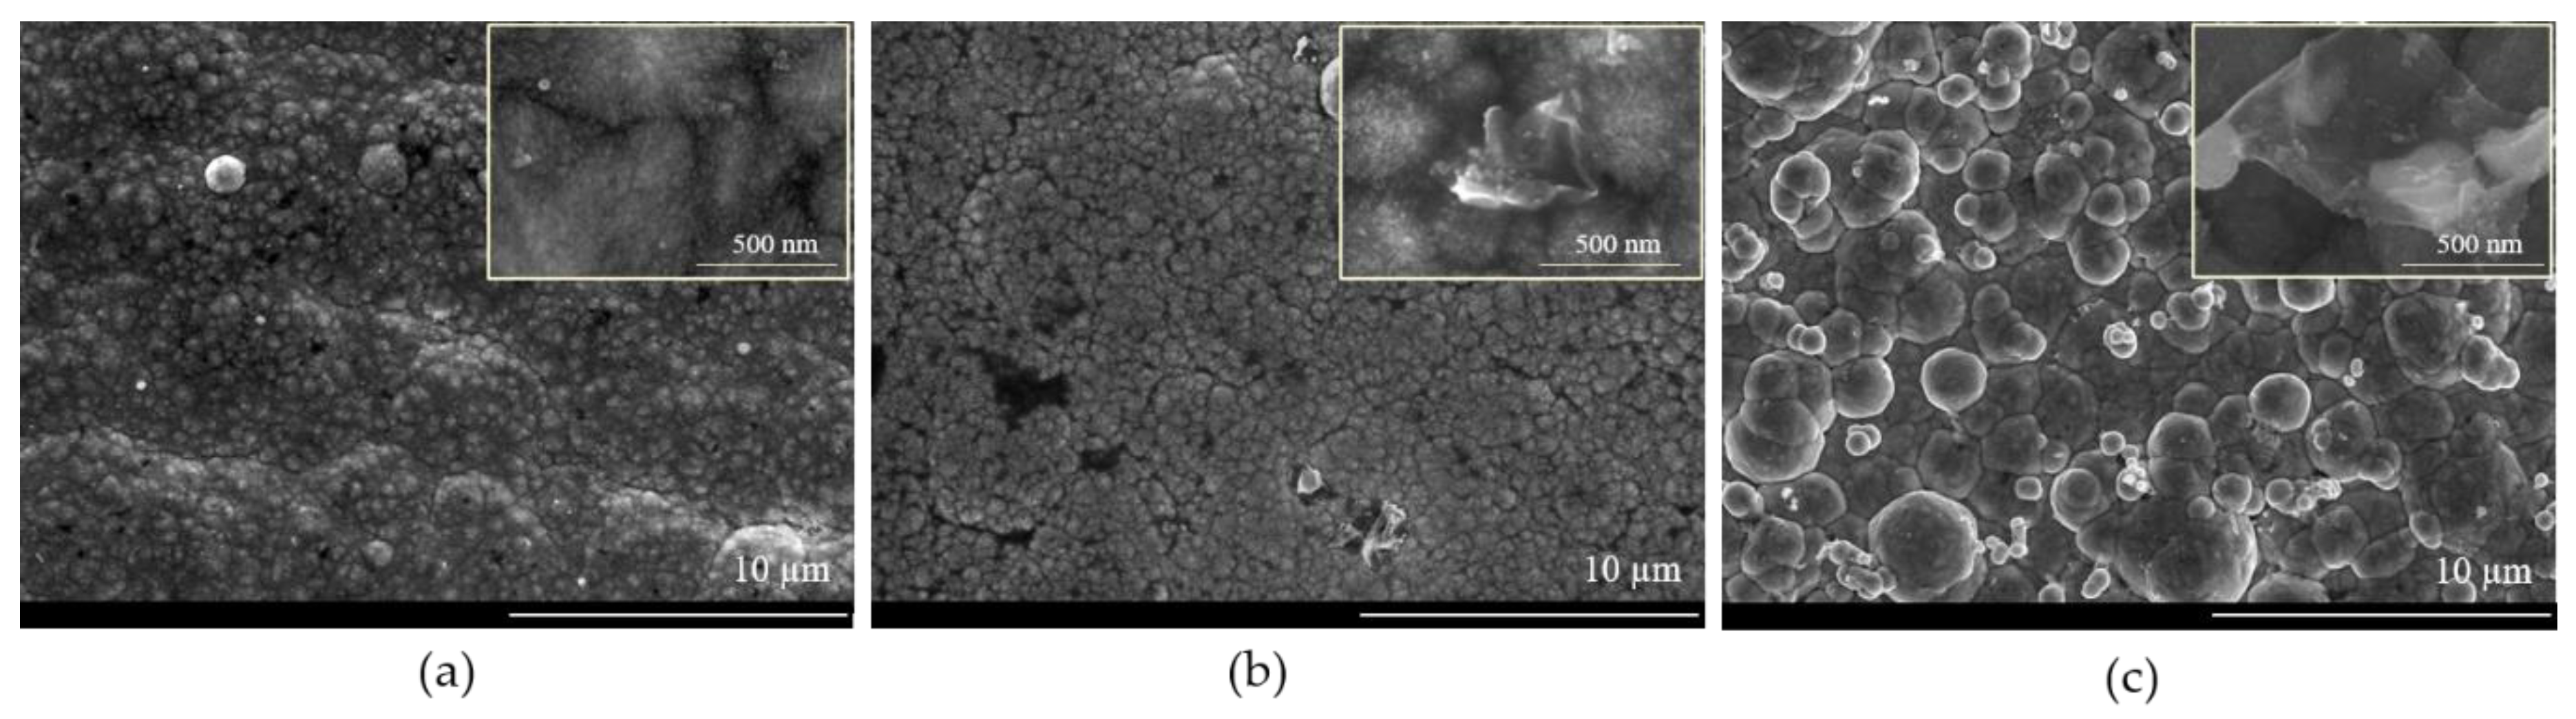
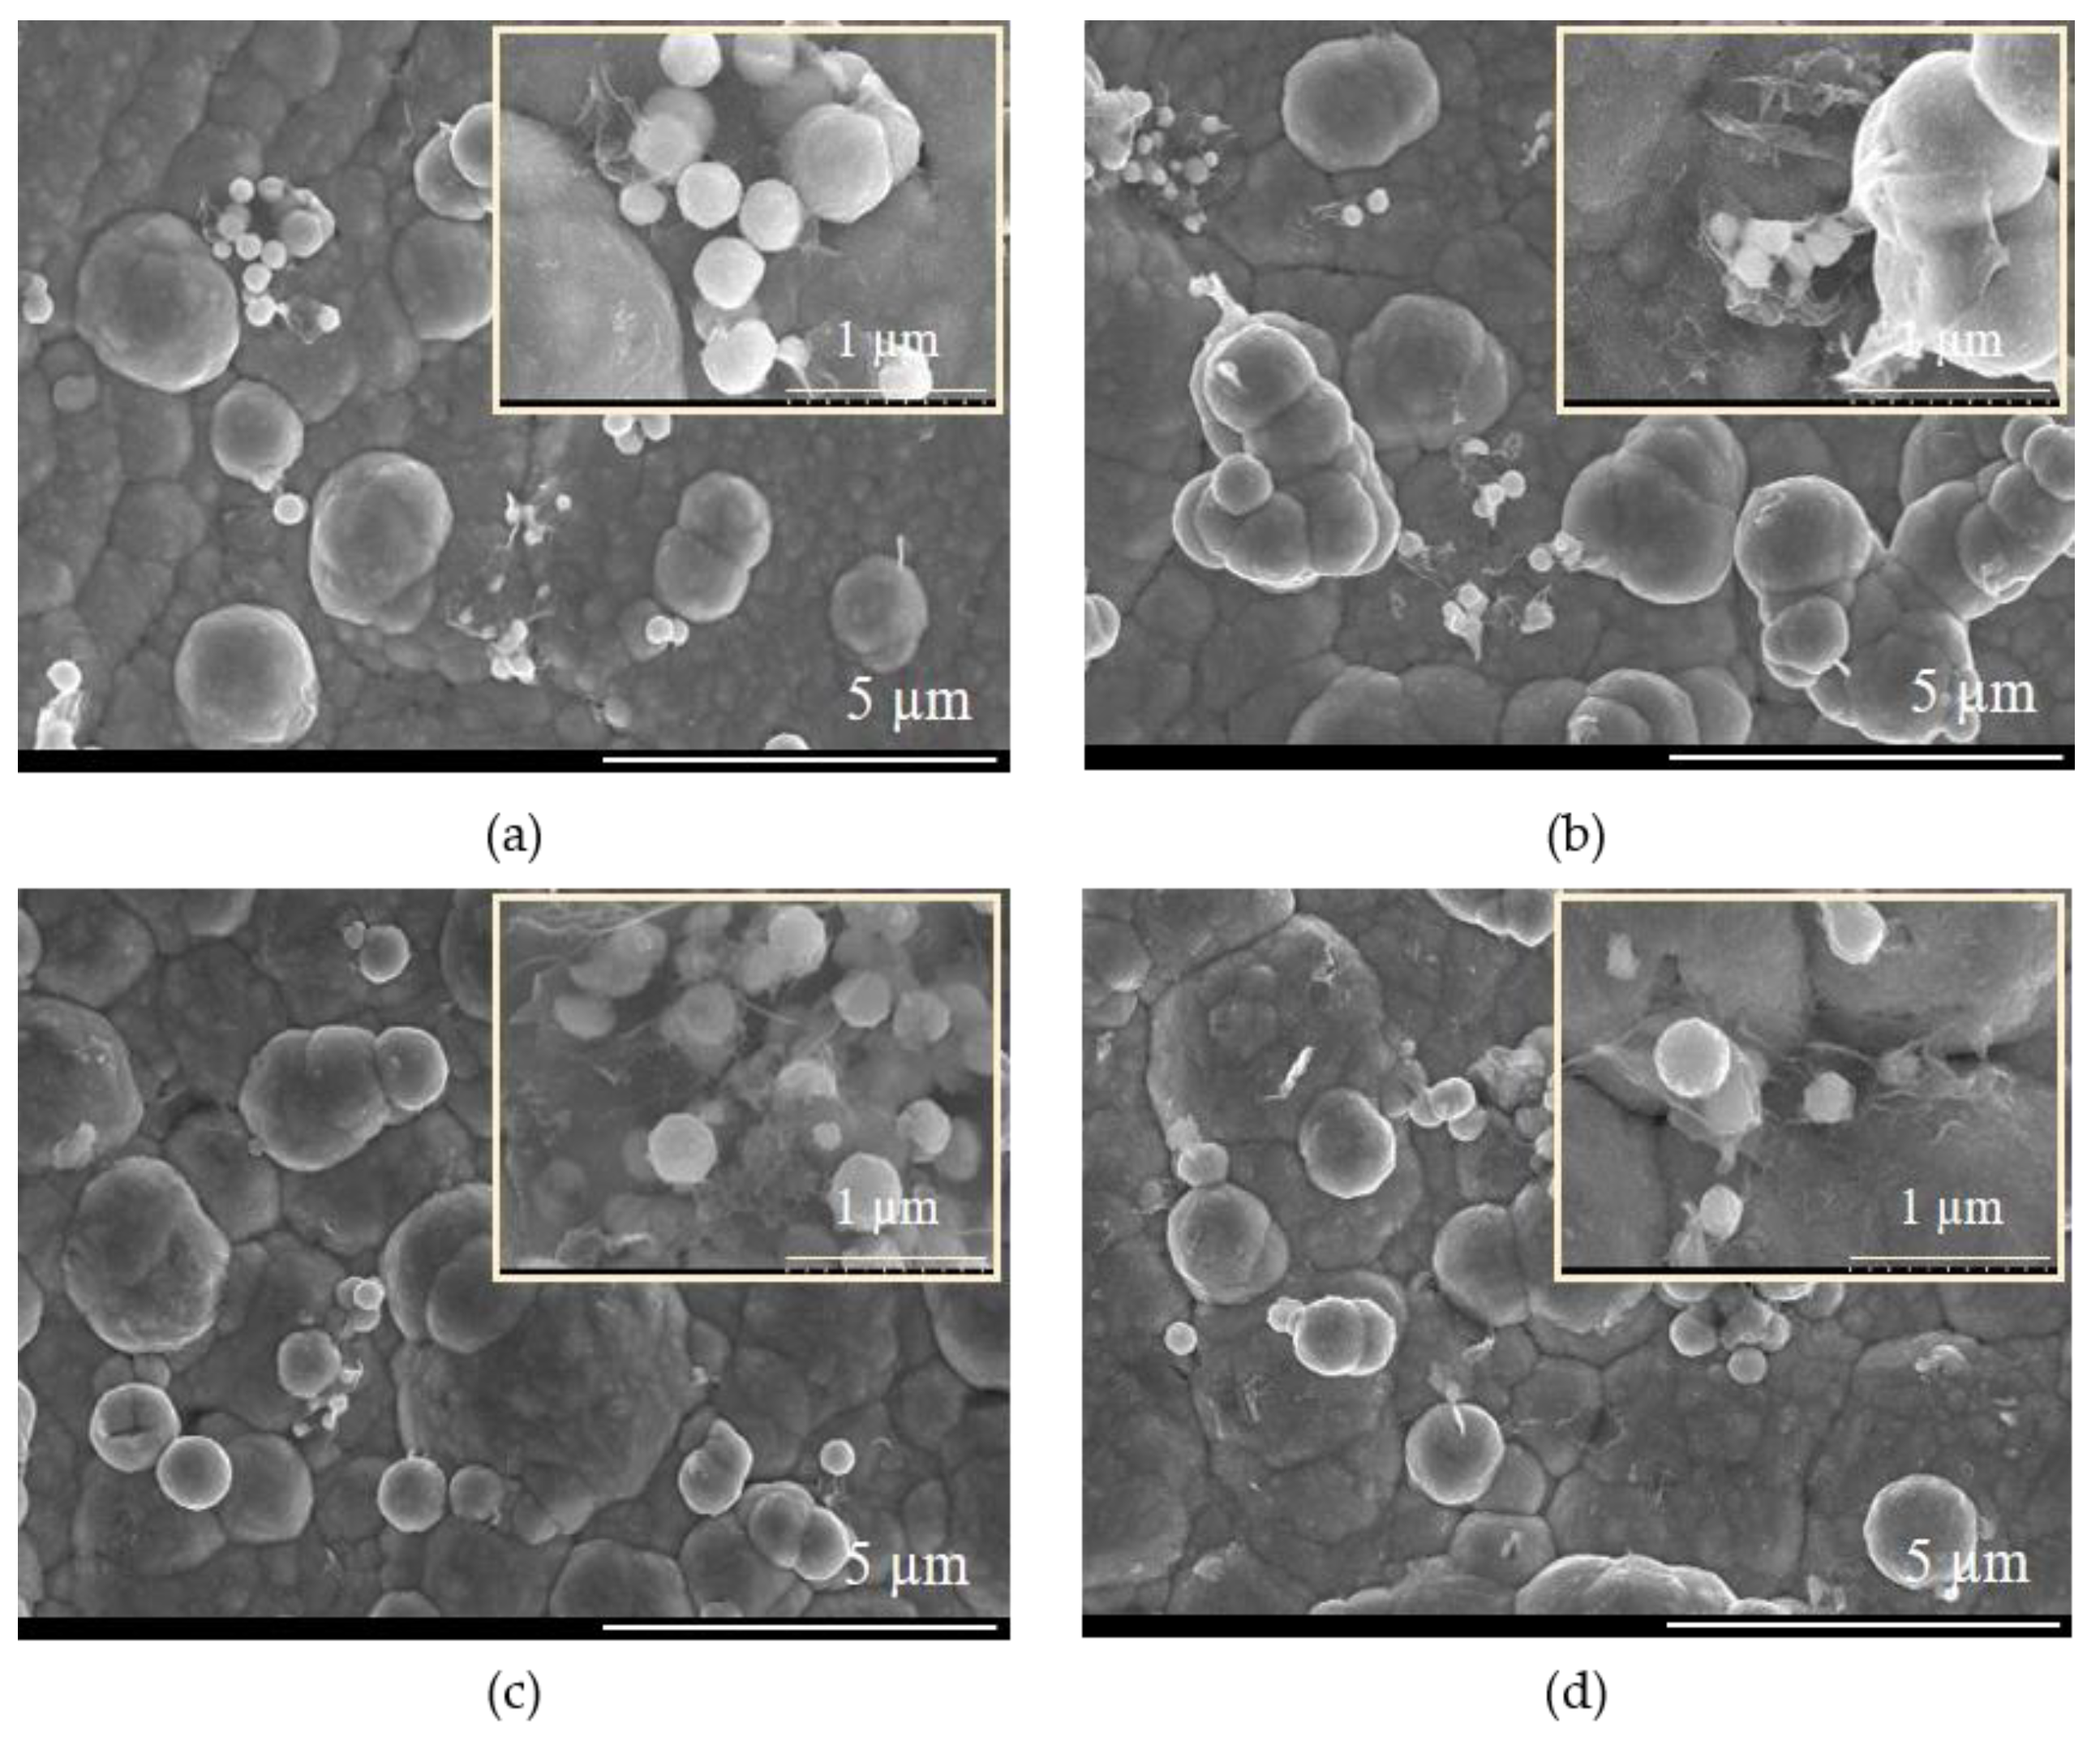
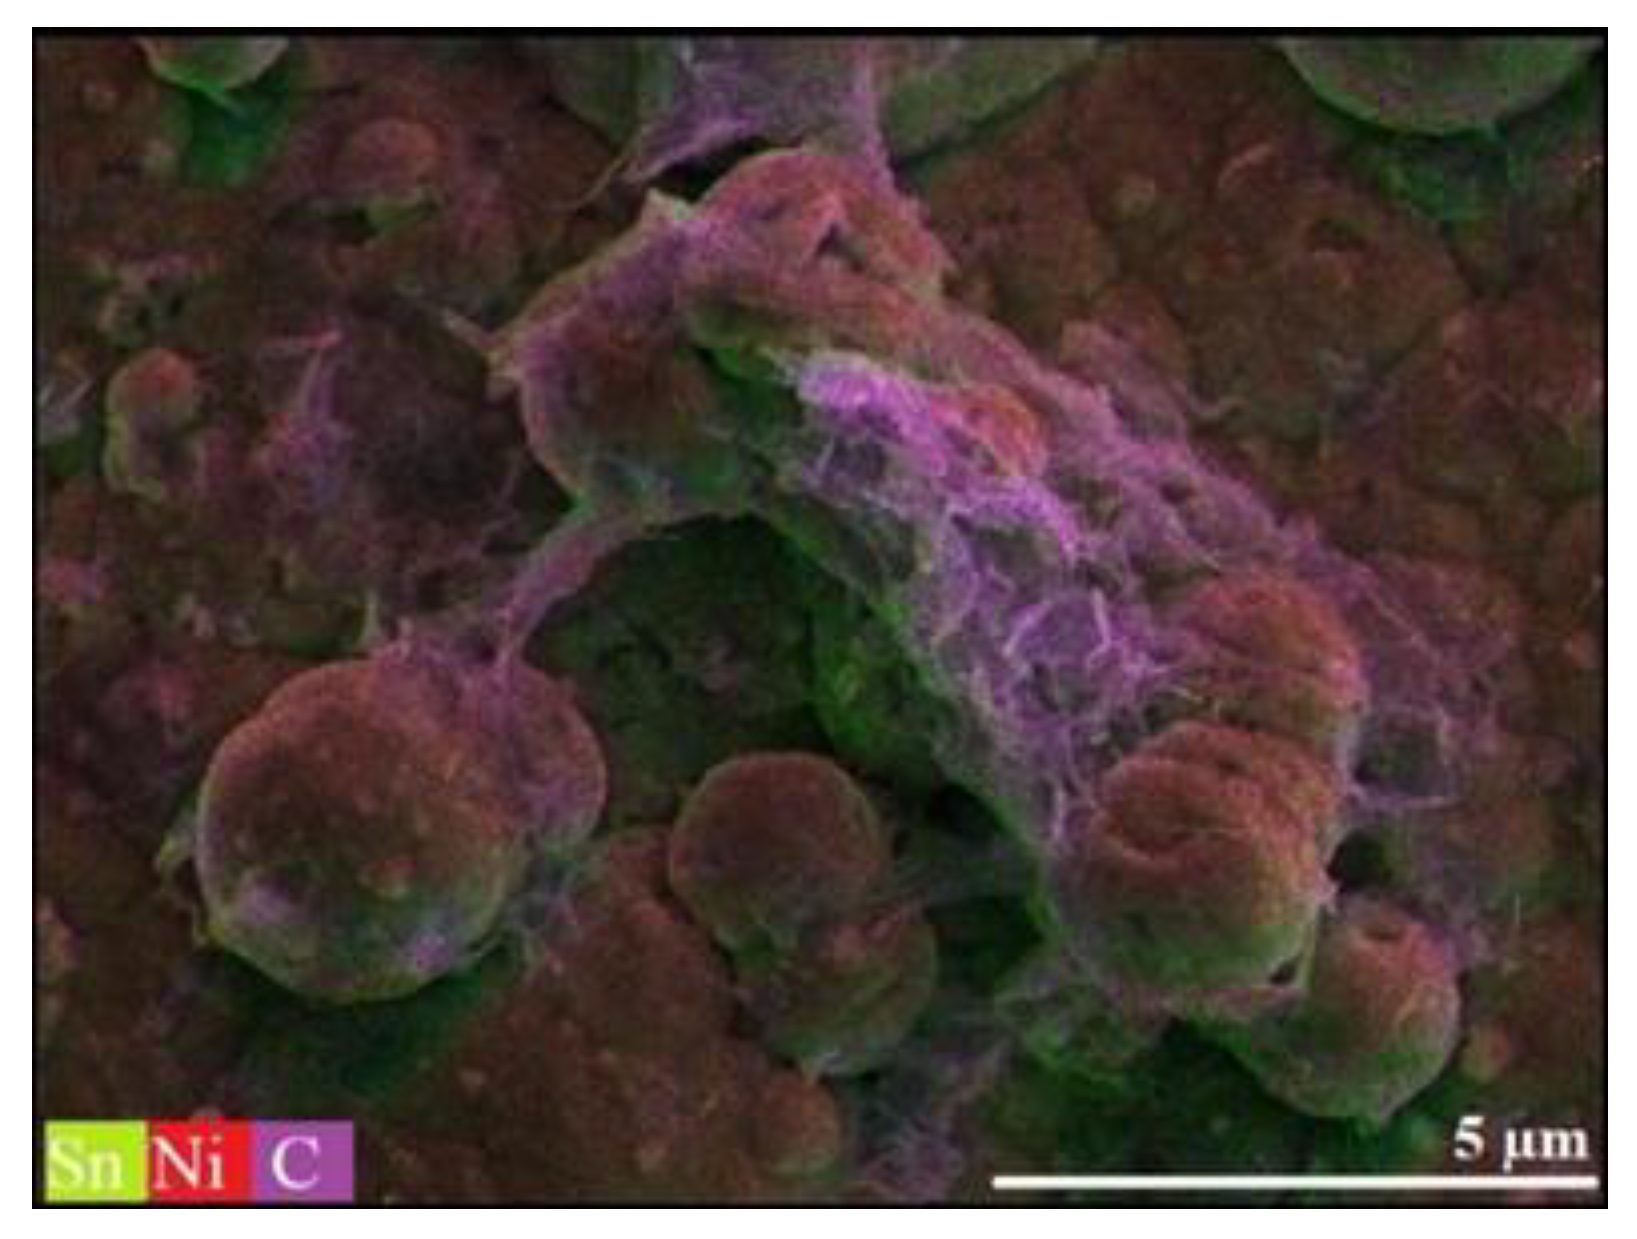
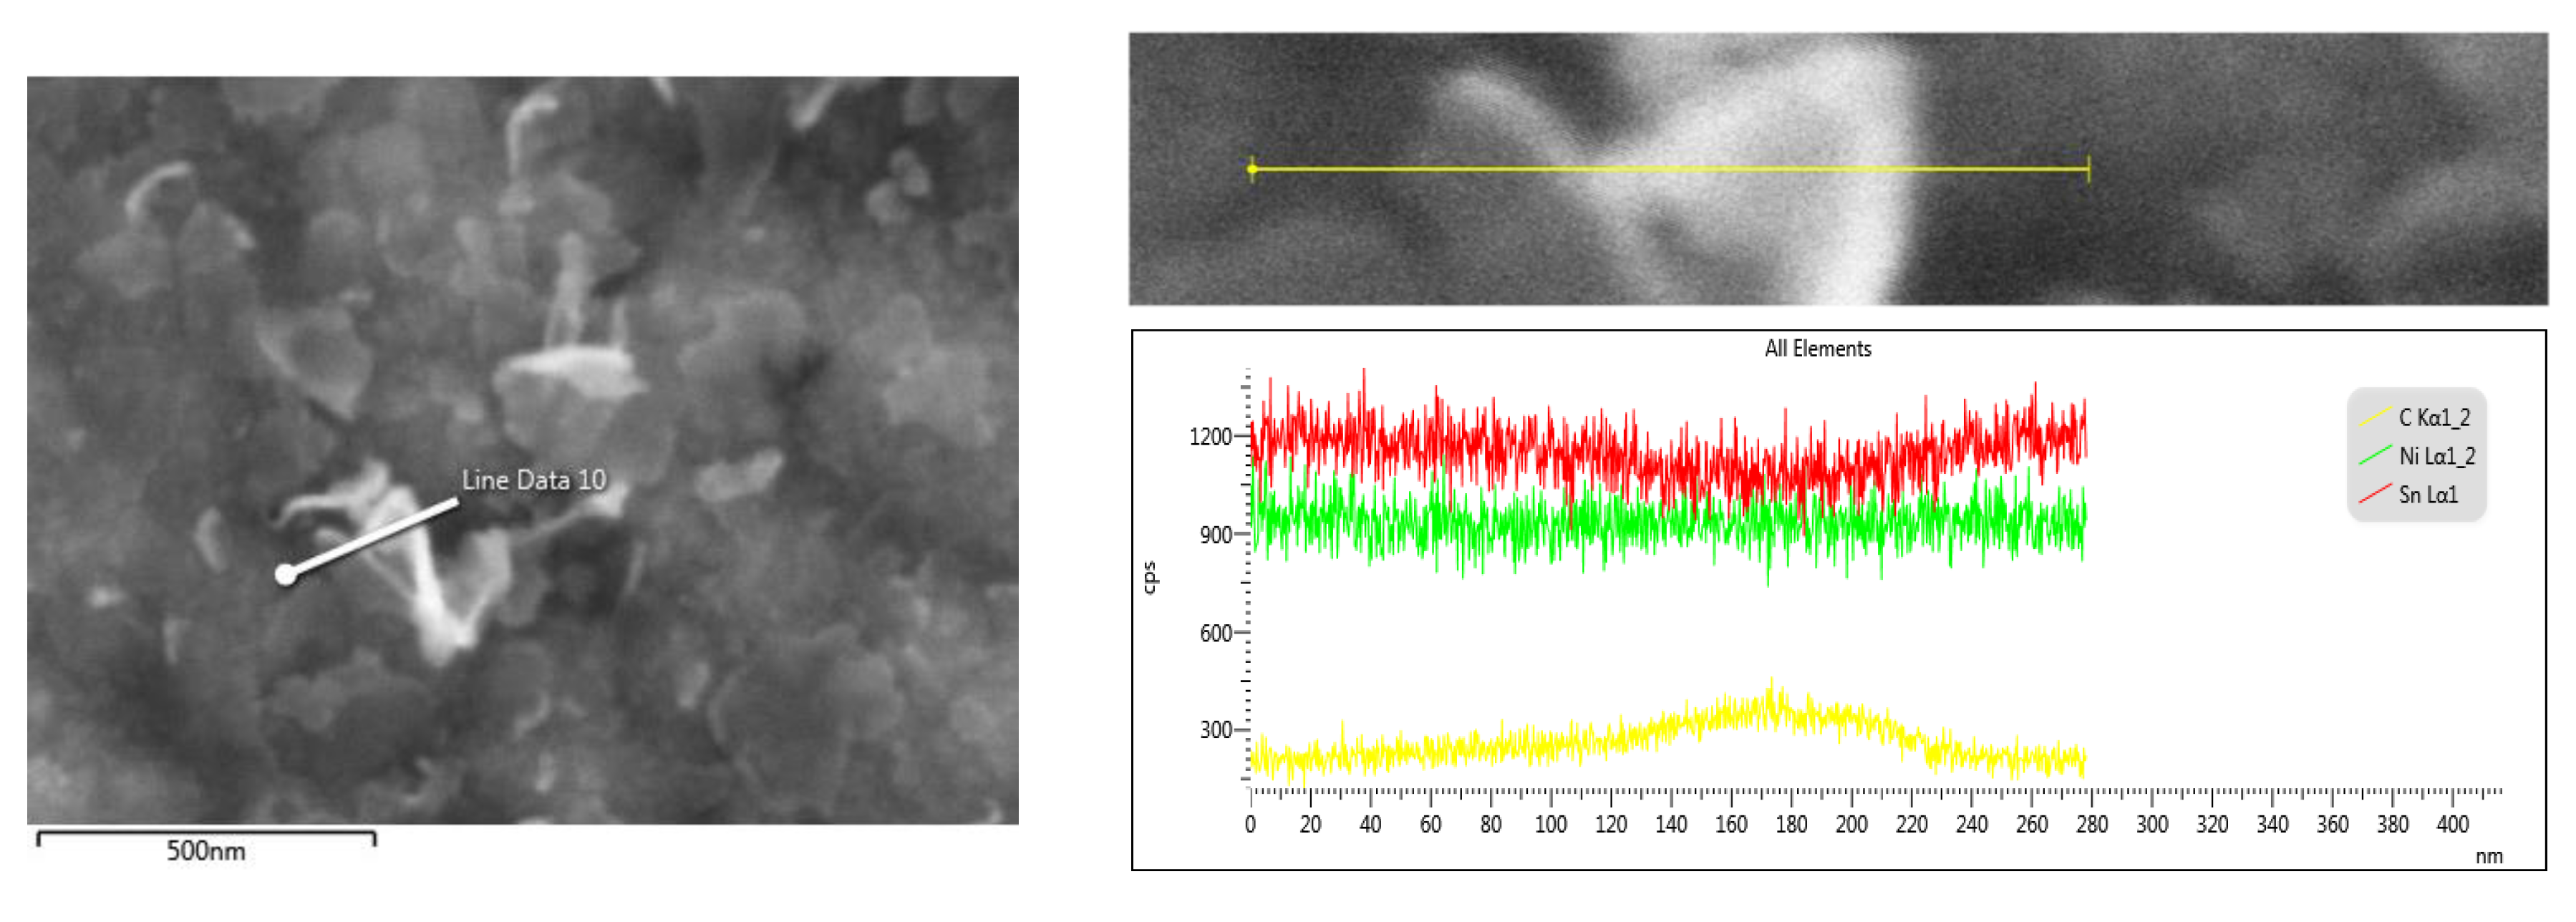
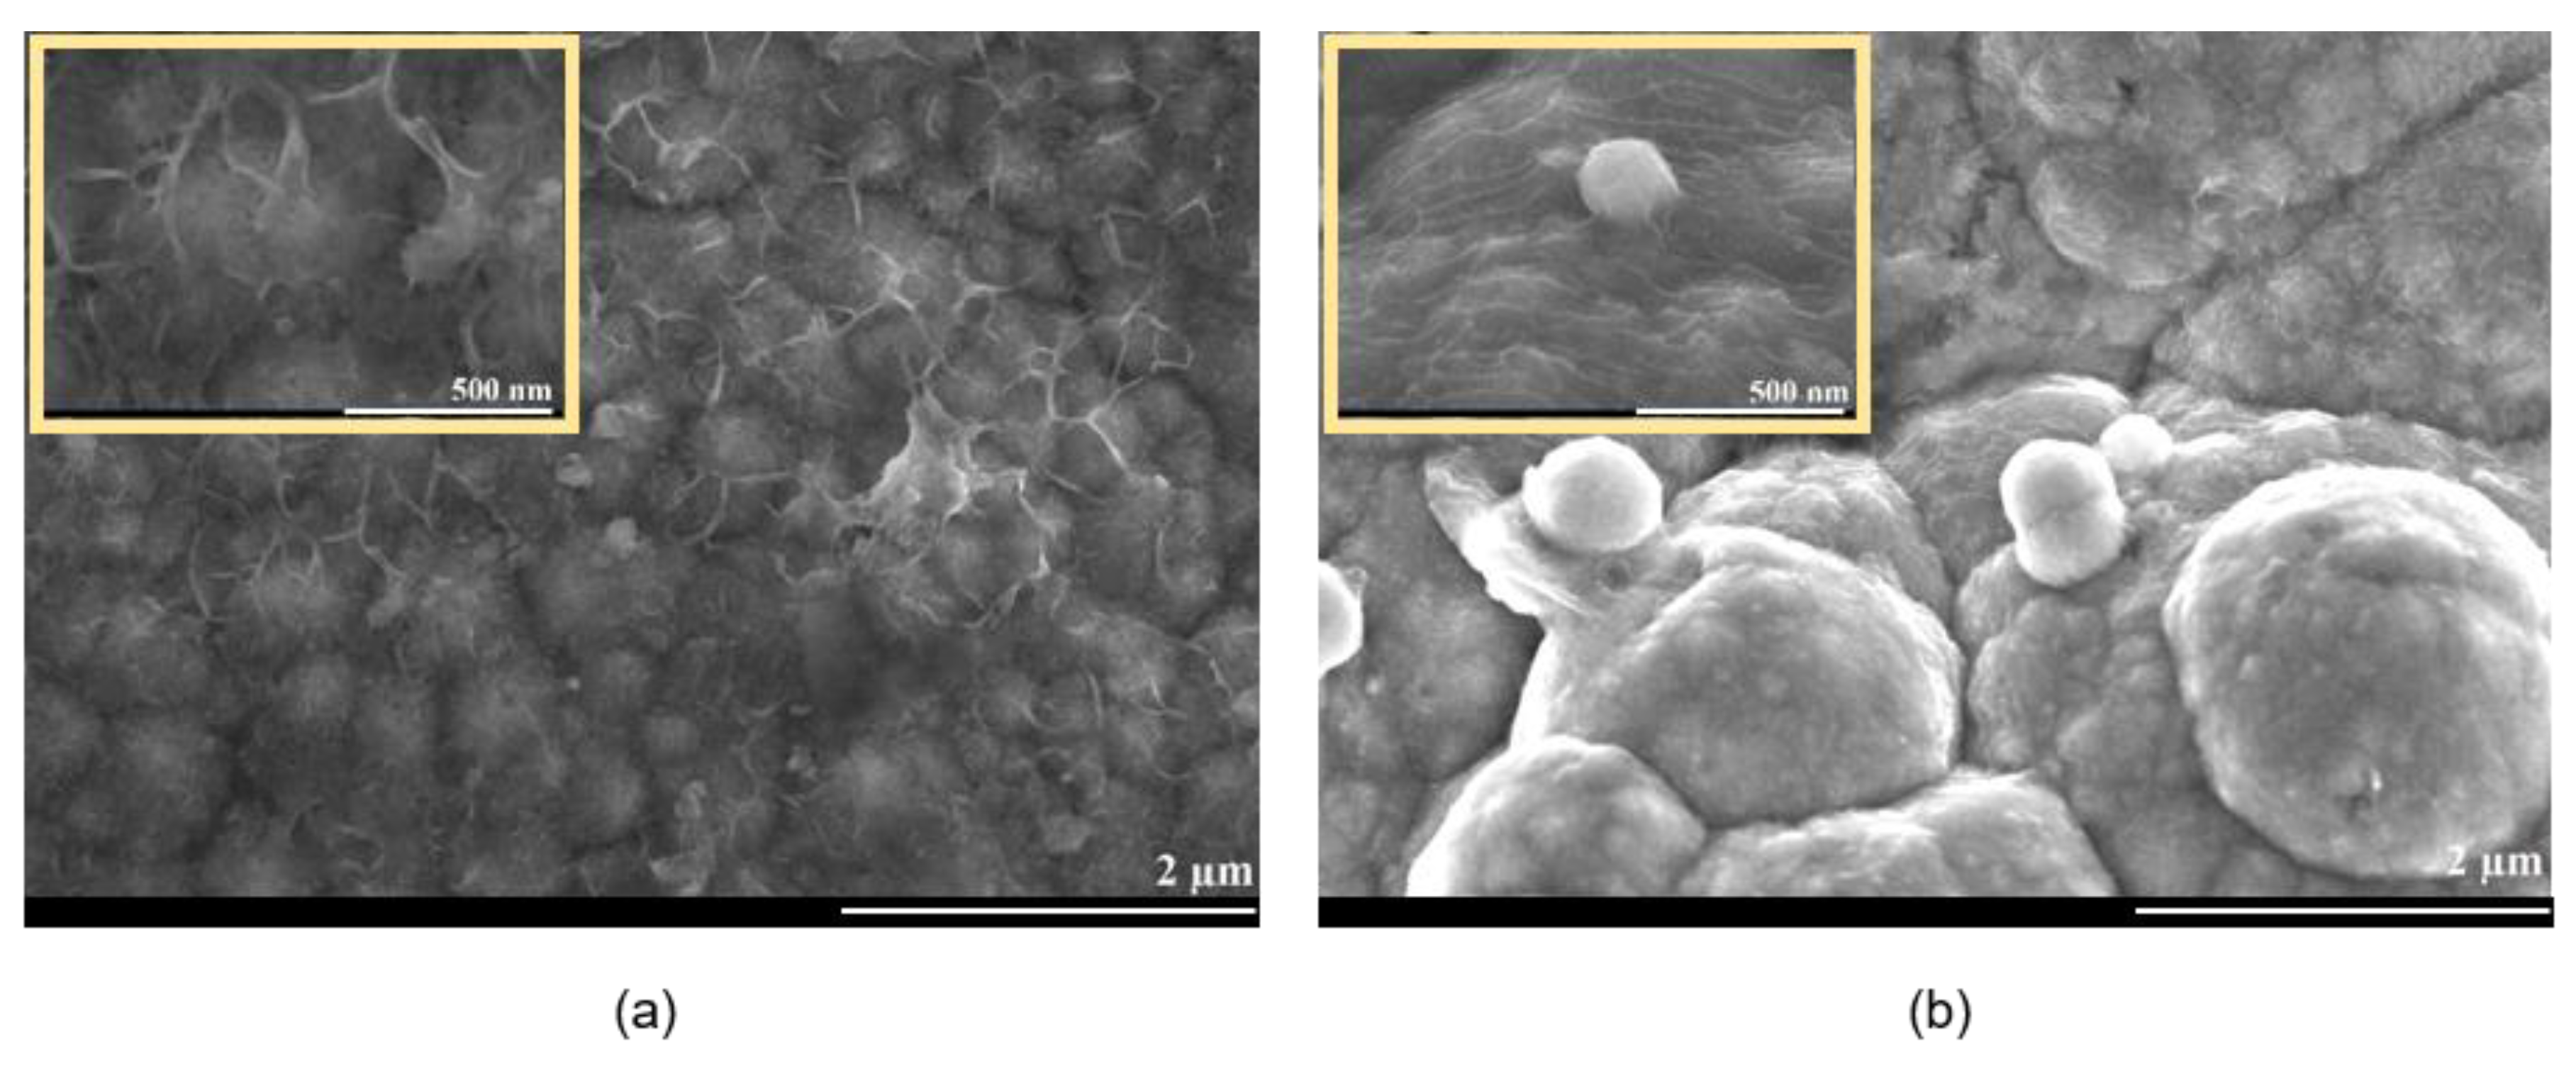
3.2. Pulse Current Electrodeposition of NiSn-rGO Composite and Surface Characterization
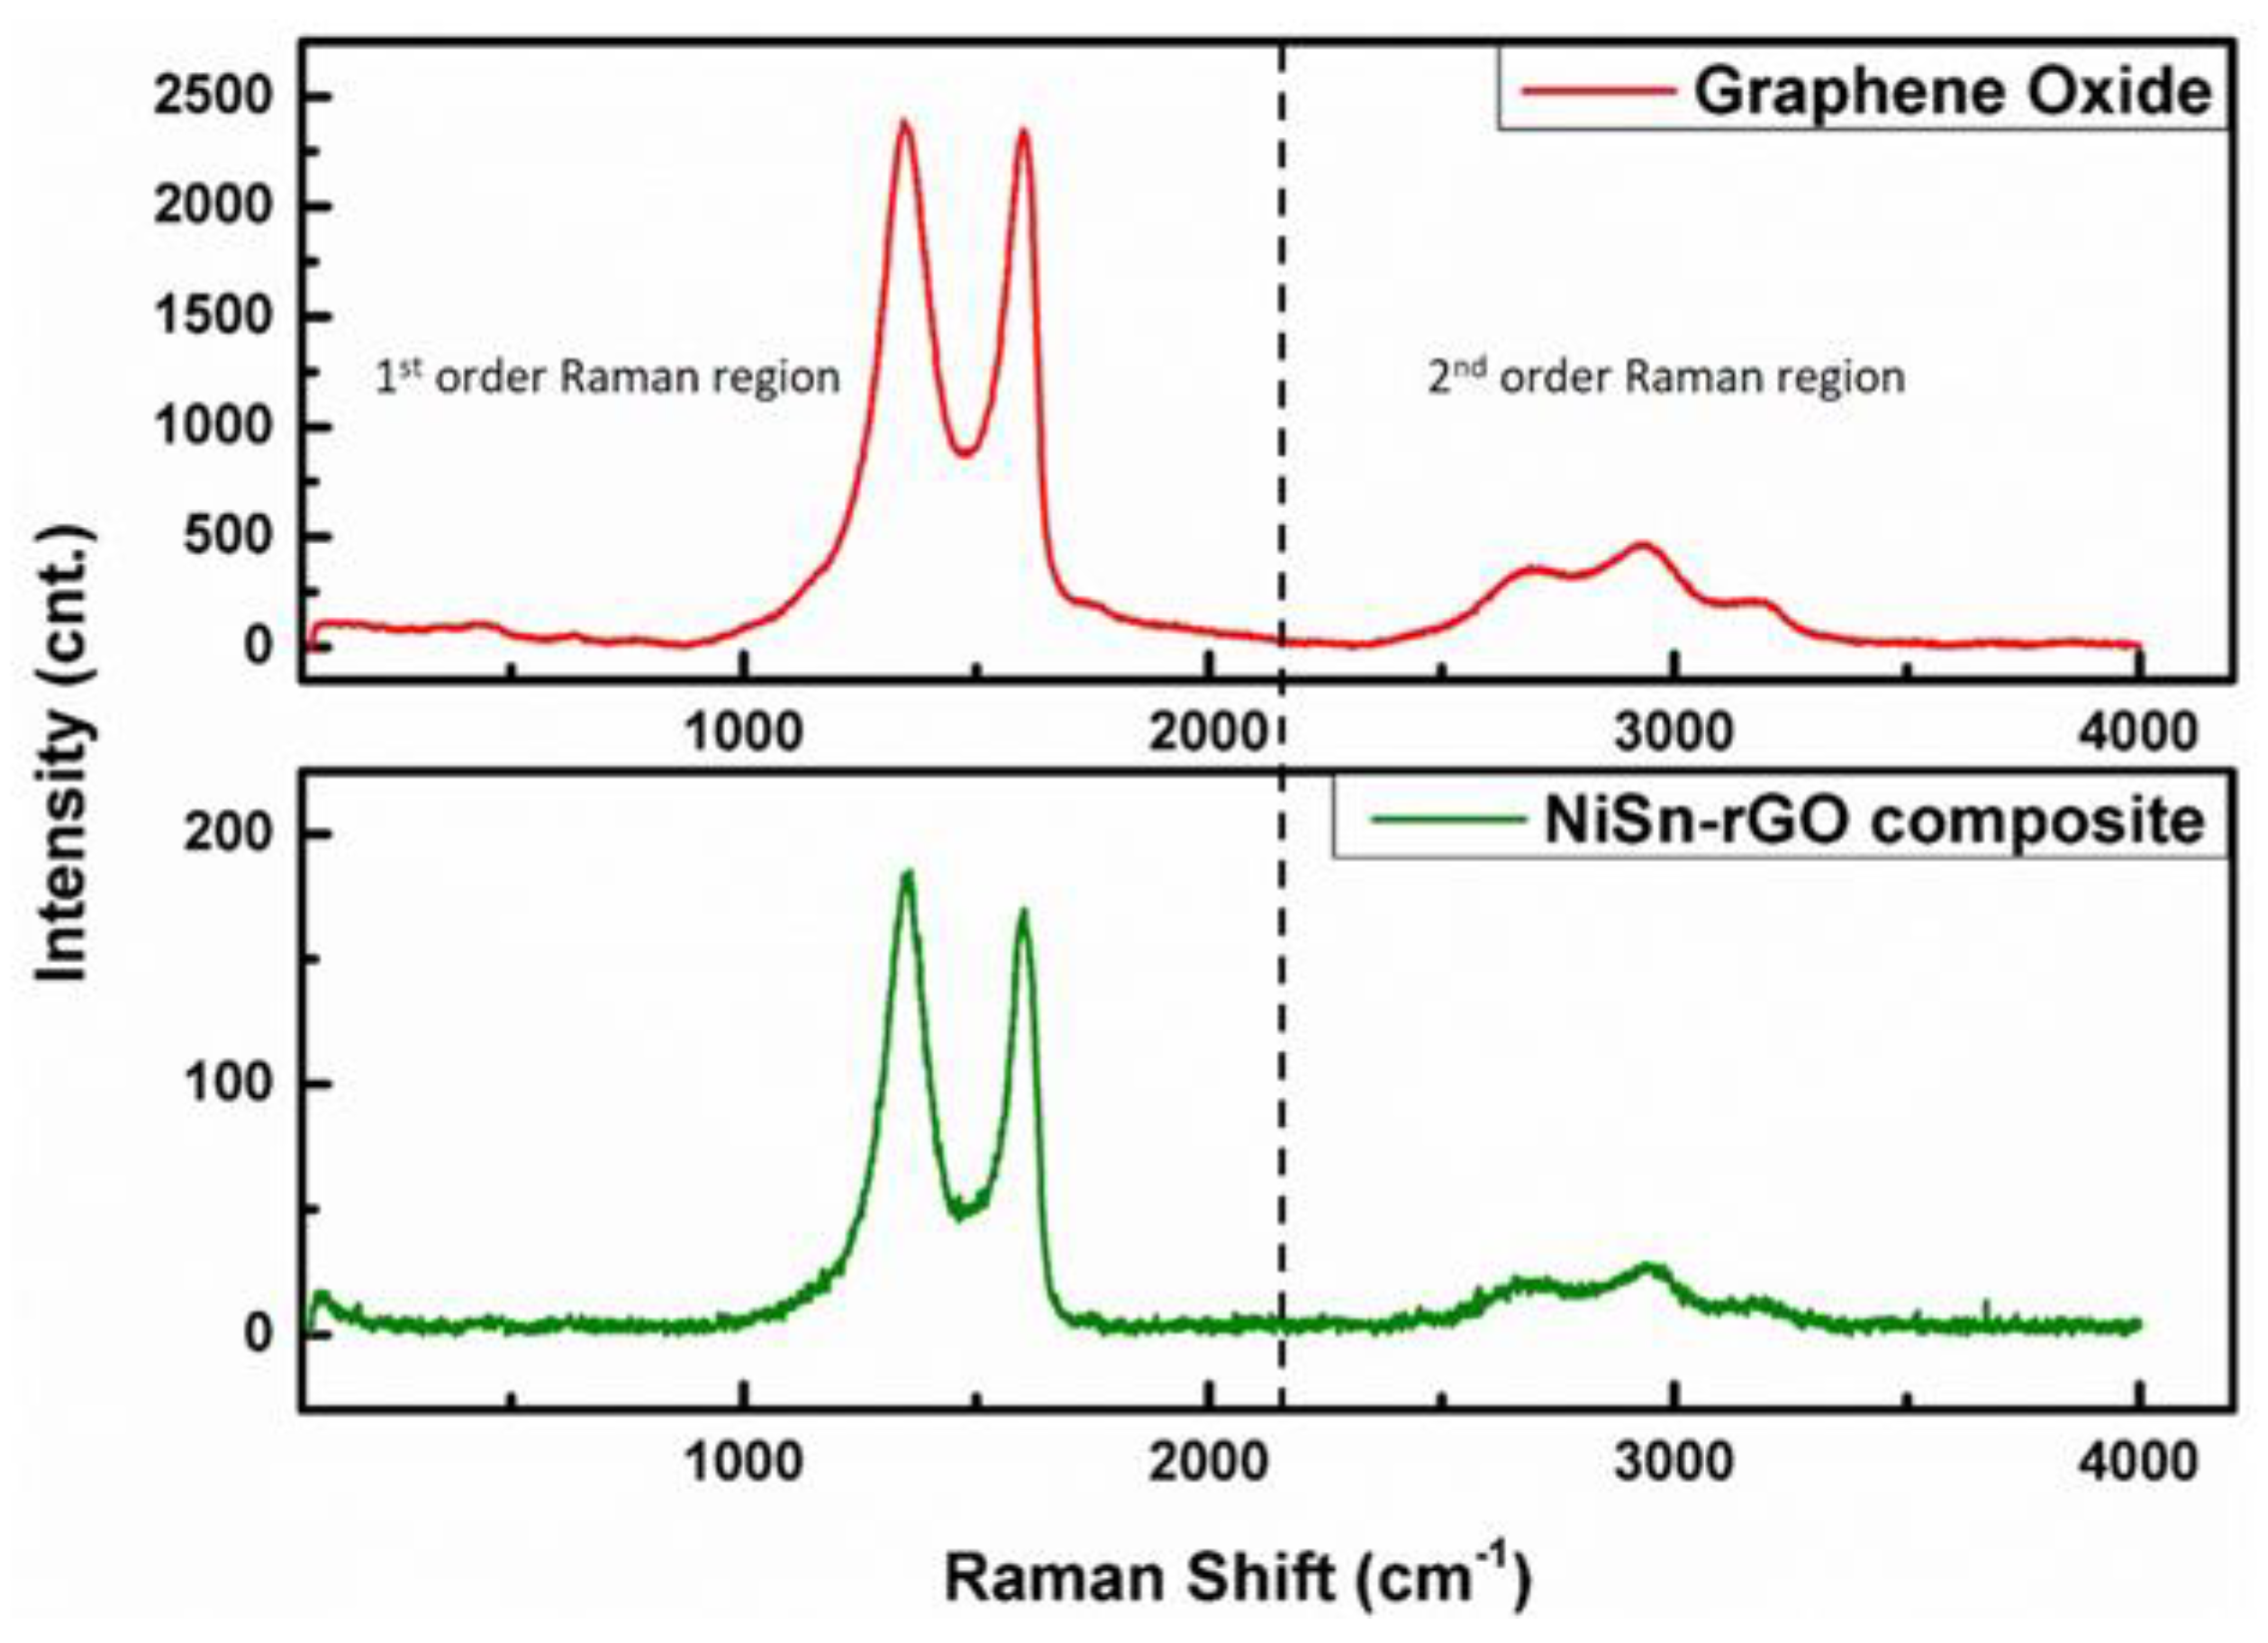
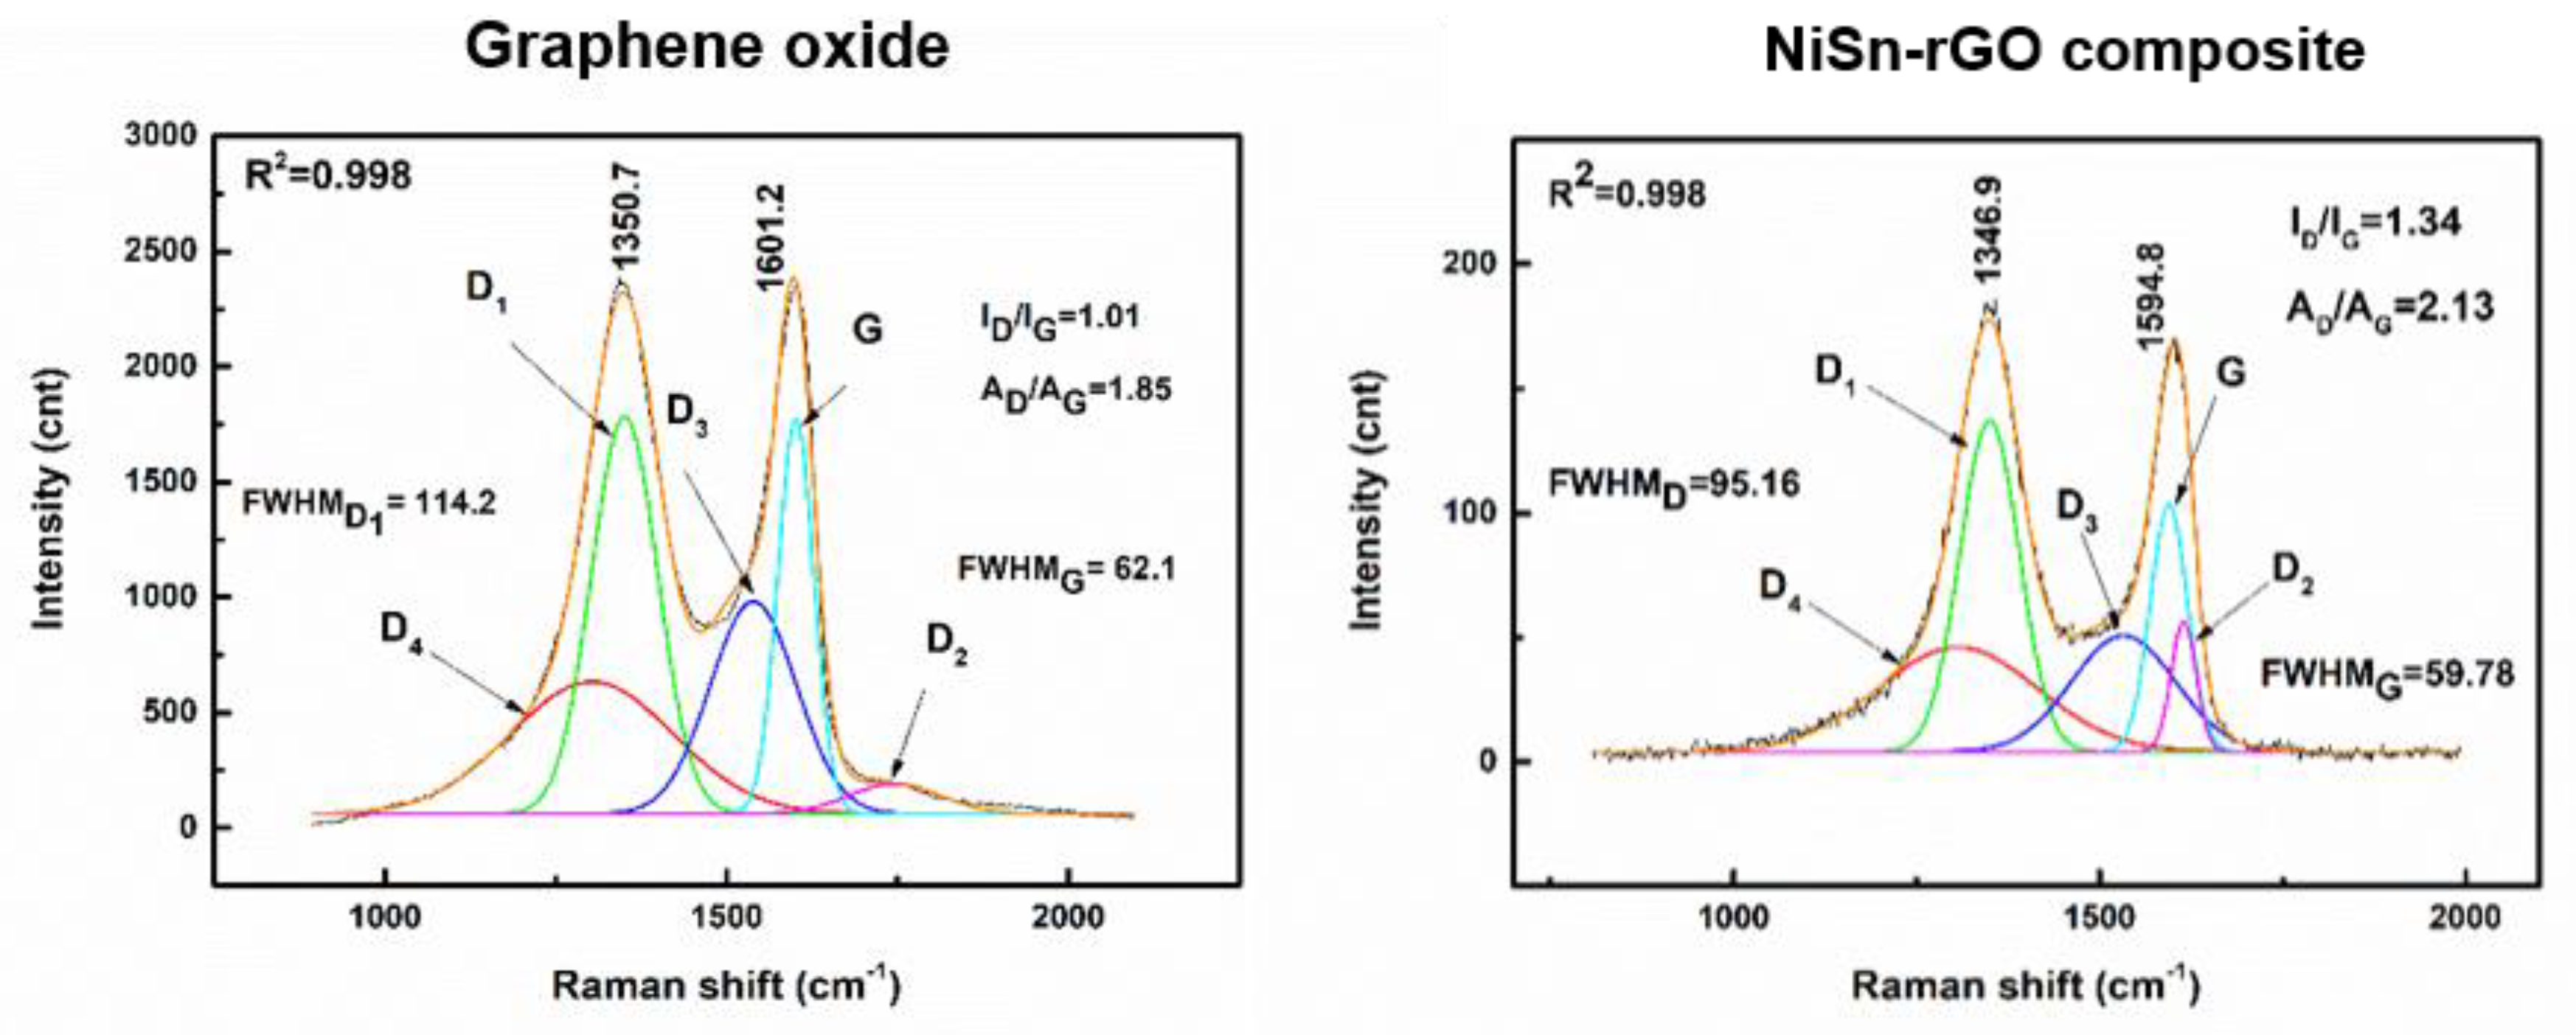
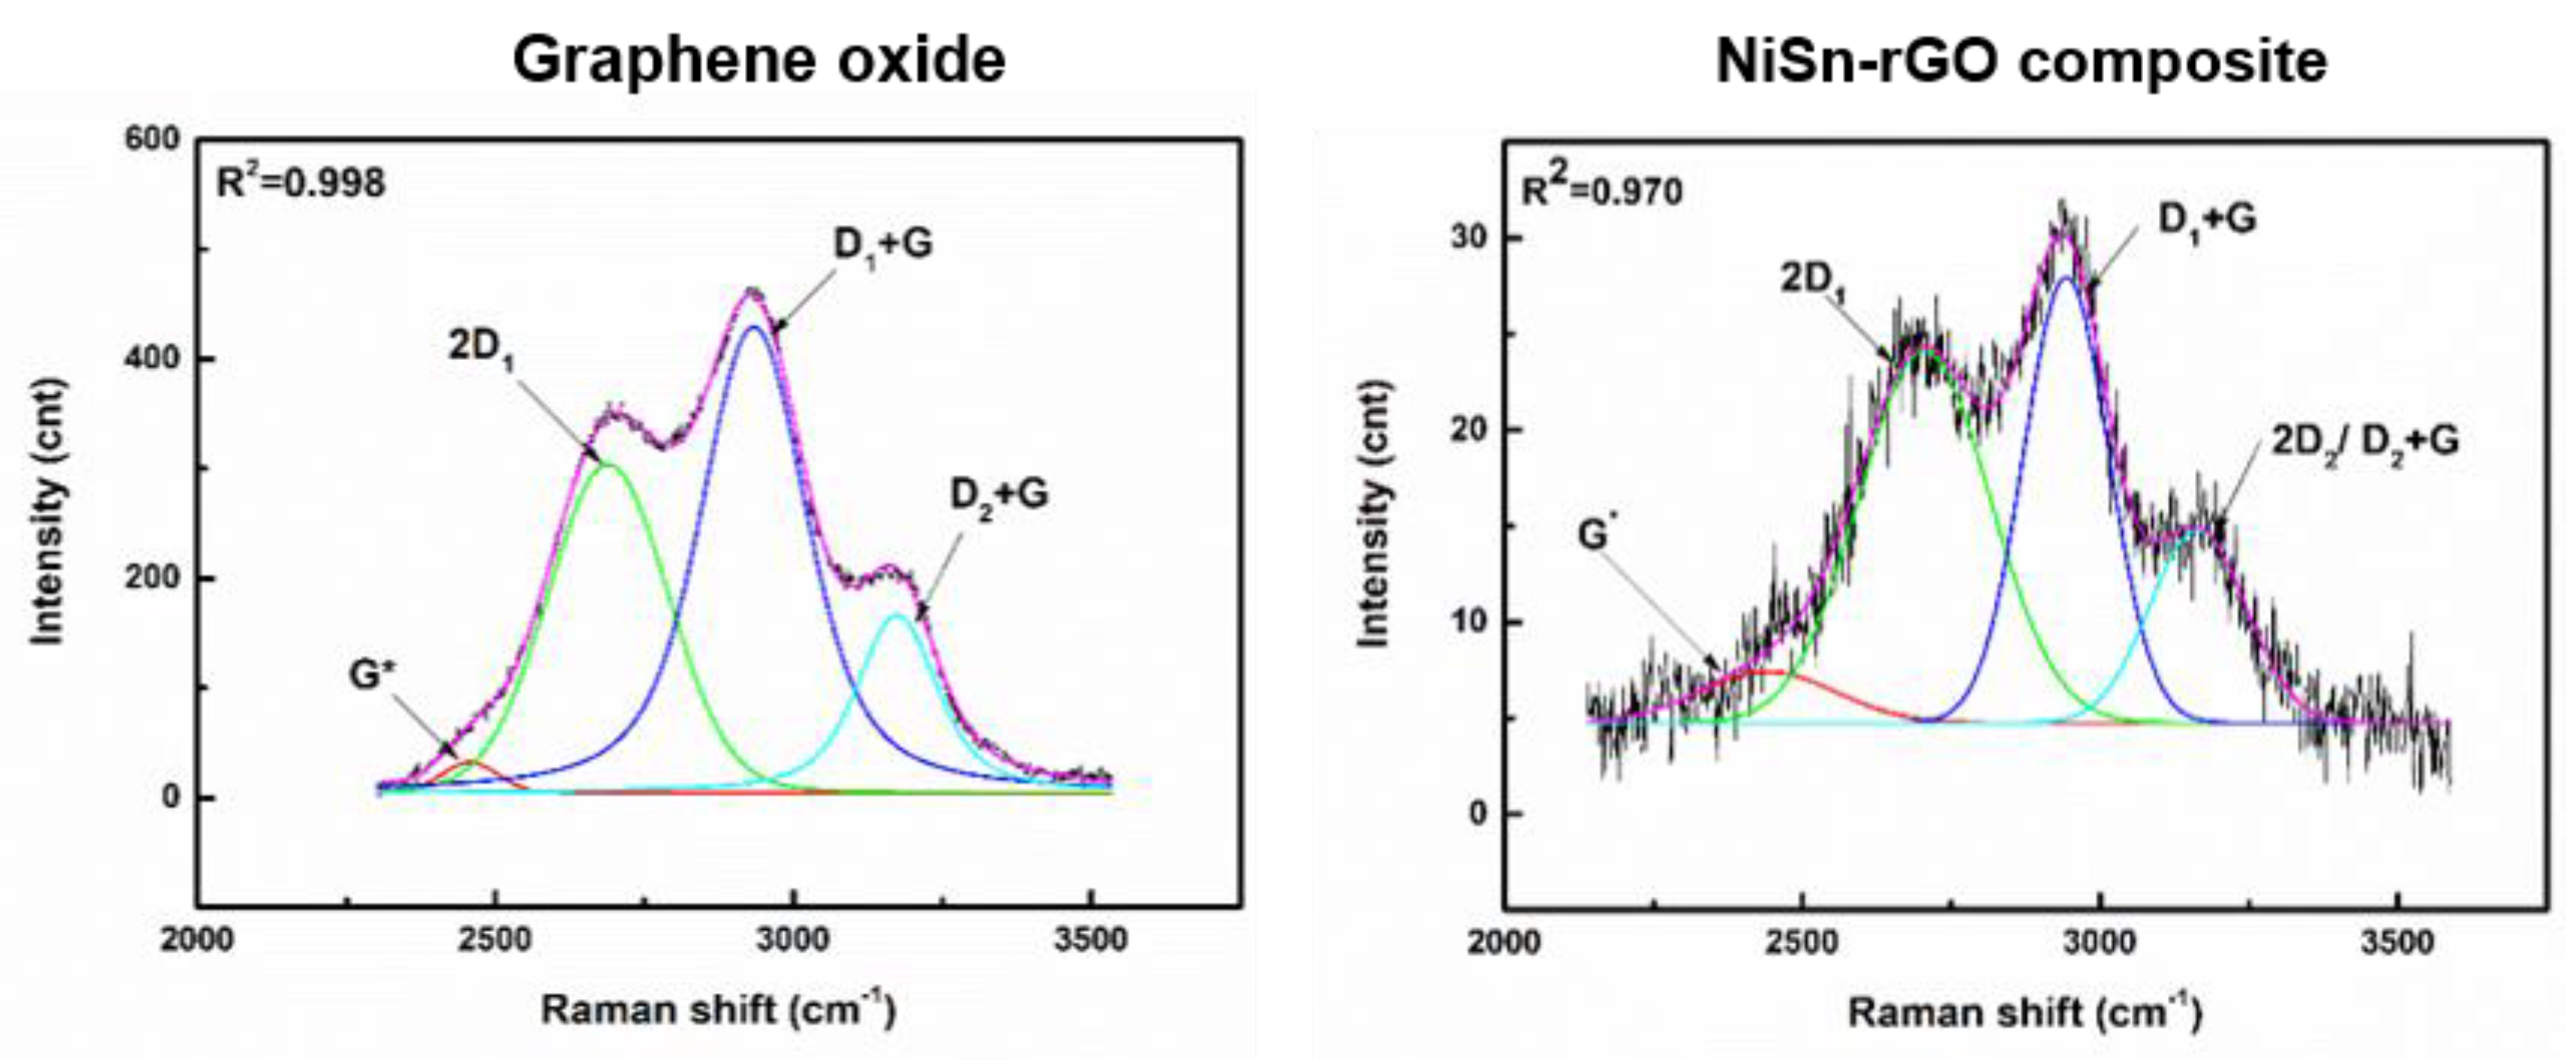
3.3. Characterization of NiSn-rGO Composite by Raman Spectroscopy
3.4. XRD Analysis
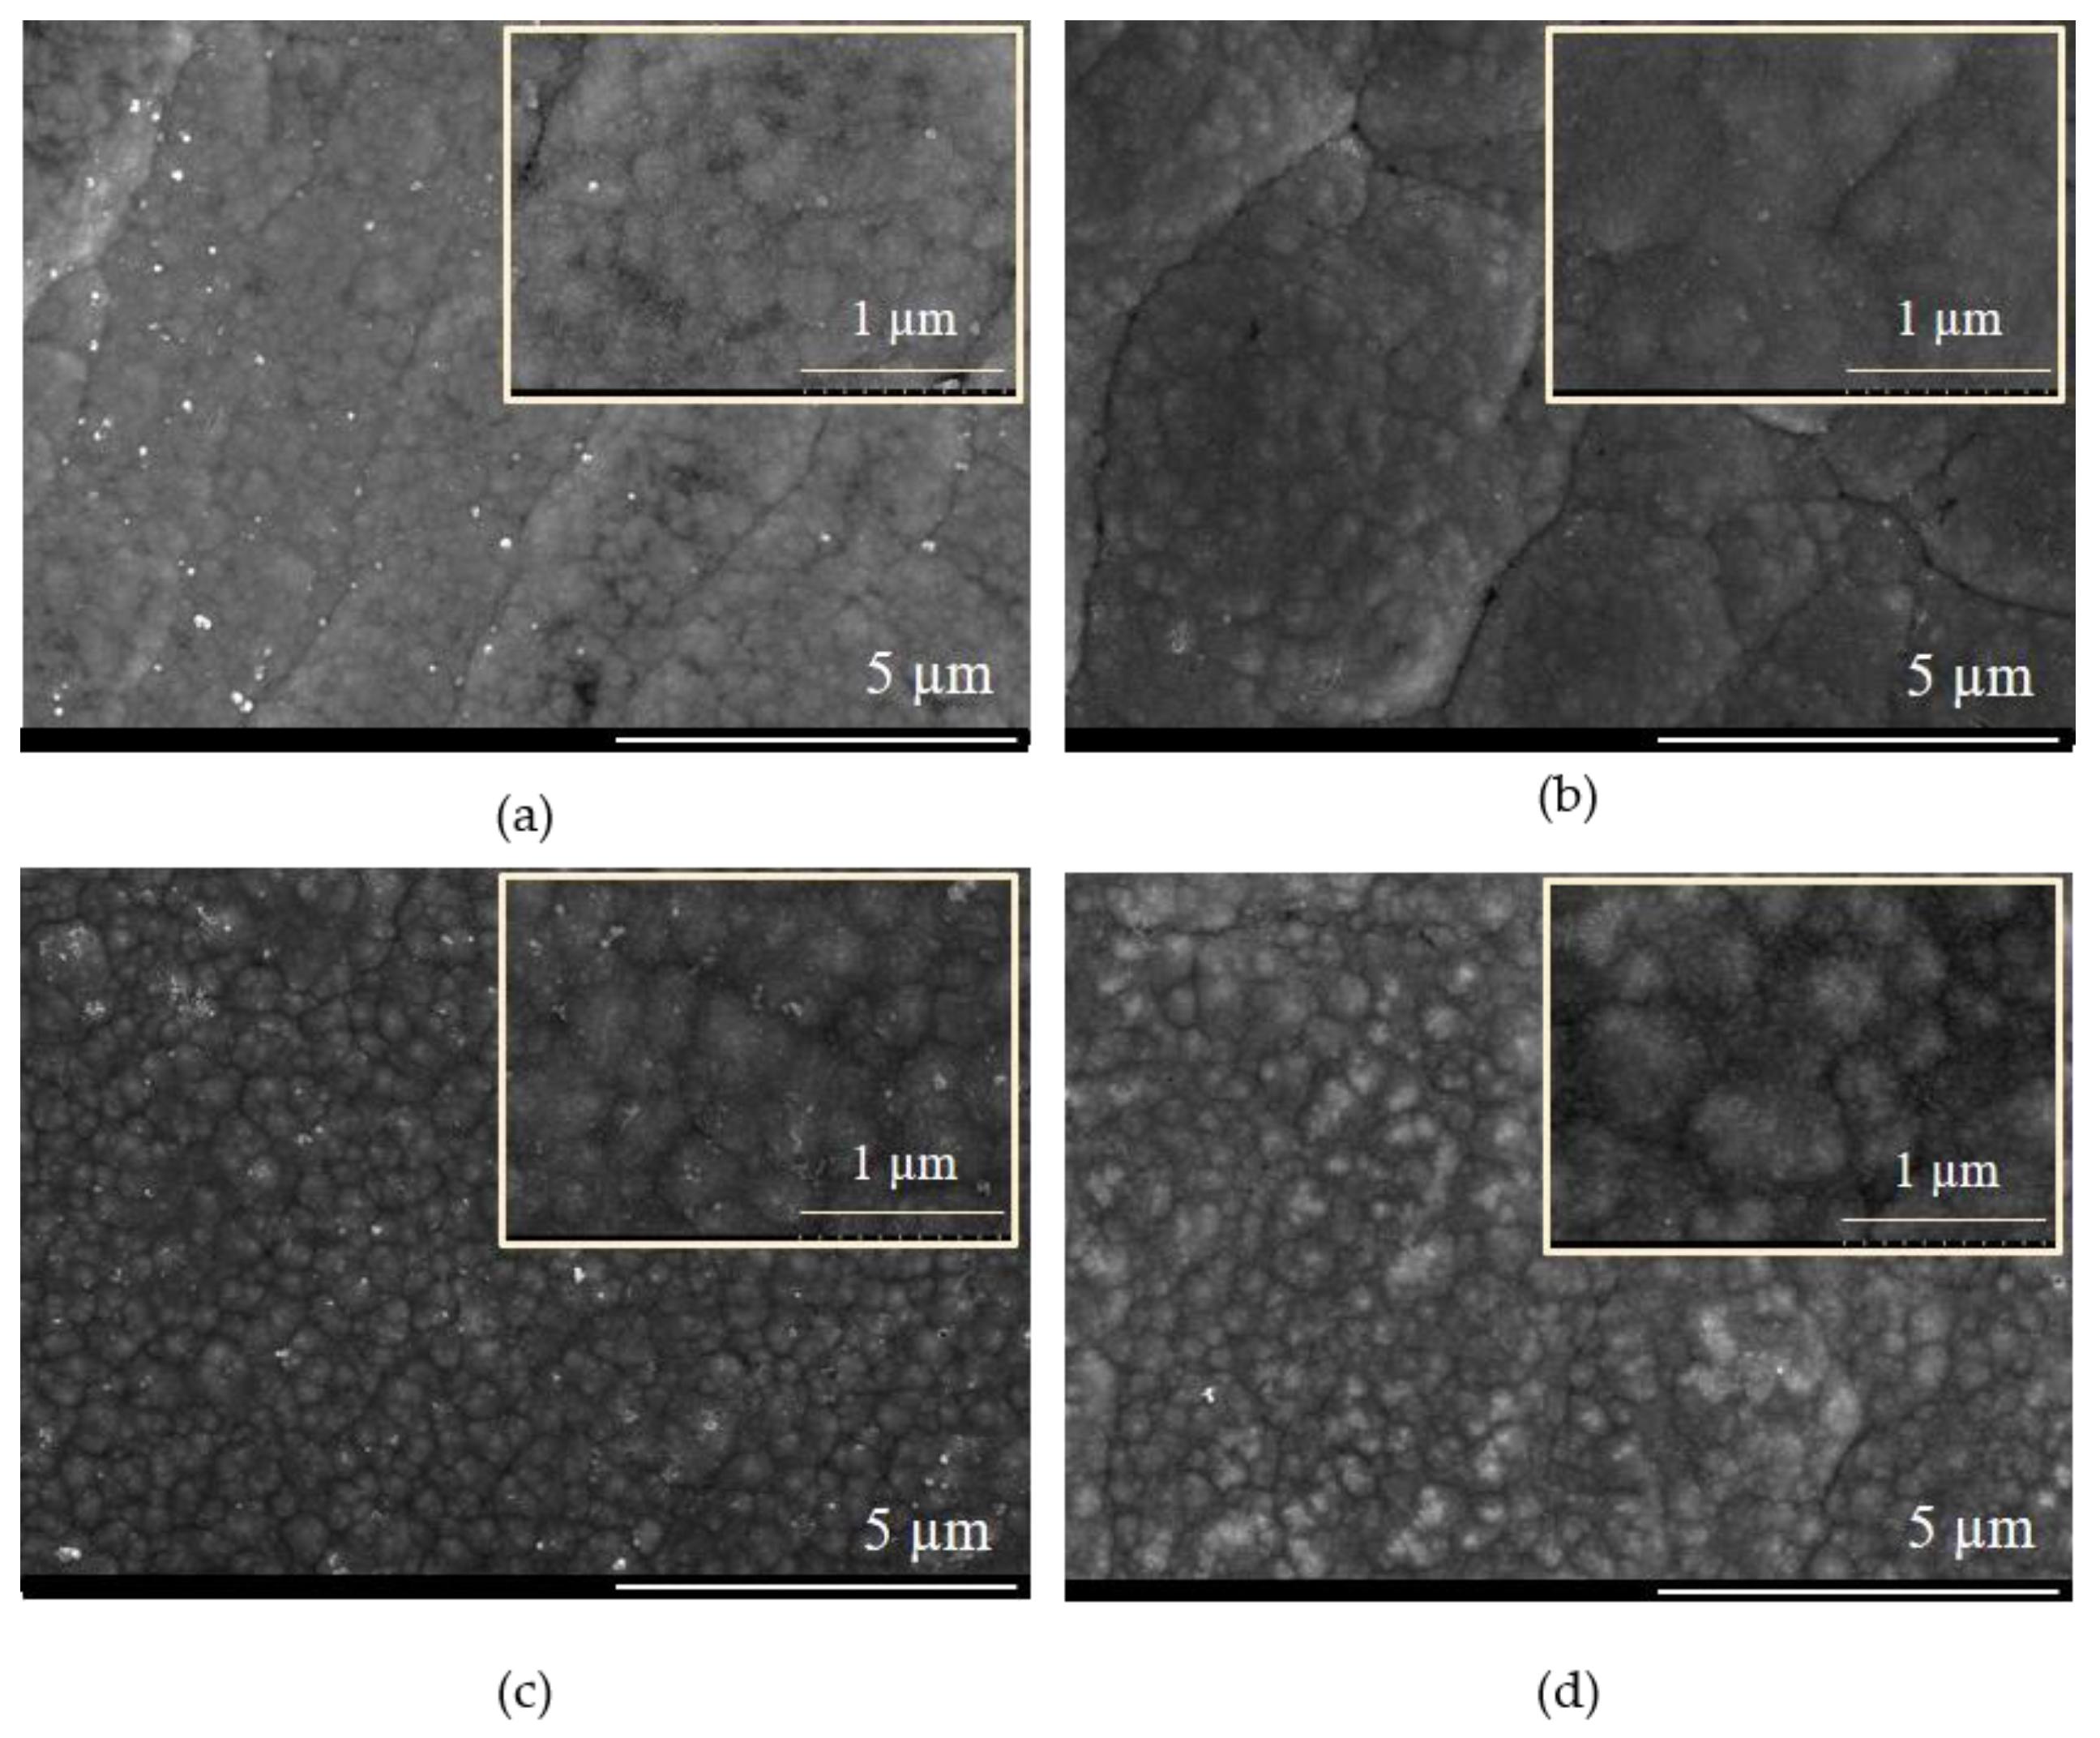
3.5. AFM Studies
3.6. Corrosion Behavior of the NiSn Alloy and NiSn-rGO Composite Coatings
4. Conclusions
Author Contributions
Funding
Acknowledgments
Conflicts of Interest
References
- Ray, S.C. Applications of Graphene and Graphene-Oxide Based Nanomaterials, 1st ed.; Elsevier Inc.: Amsterdam, The Netherlands; William Andrew Publishing: Waltham, MA, USA, 2015; pp. 1–38. [Google Scholar]
- Johnson, D.; Dobson, B.; Coleman, K. A manufacturing perspective on graphene dispersions. Curr. Opin. Colloid Interface Sci. 2015, 20, 367–382. [Google Scholar] [CrossRef] [Green Version]
- Hussain, A.K.; Al Naib, U.M.B. Recent developments in graphene based metal matrix composite coatings for corrosion protection application: A review. J. Met. Mater. Miner. 2019, 29, 1–9. [Google Scholar]
- Li, R.; Liang, J.; Hou, Y.; Chu, Q. Enhanced corrosion performance of Zn coating by incorporating graphene oxide electrodeposited from deep eutectic solvent. RSC Adv. 2015, 5, 60698–60707. [Google Scholar] [CrossRef]
- Ambrosi, A.; Pumera, M. The structural stability of graphene anticorrosion coating materials is compromised at low potentials. Chem. Eur. J. 2015, 21, 7896–7901. [Google Scholar] [CrossRef] [PubMed]
- Dideikin, A.T.; Vul, A.Y. Graphene oxide and derivatives: The place in graphene family. Front. Phys. 2019, 6, 149. [Google Scholar] [CrossRef]
- Smith, A.; La Chance, A.; Zeng, S.; Liu, B.; Sun, L. Synthesis, properties, and applications of graphene oxide/reduced graphene oxide and their nanocomposites. Nano Mater. Sci. 2019, 1, 31–47. [Google Scholar] [CrossRef]
- Stankovich, S.; Dikin, D.; Piner, R.; Kohlhaas, K.; Kleinhammes, A.; Jia, Y.; Wu, Y.; Nguyen, S.; Ruoff, R. Synthesis of graphene-based nanosheets via chemical reduction of exfoliated graphite oxide. Carbon 2007, 45, 1558–1565. [Google Scholar] [CrossRef]
- Ping, J.; Wang, Y.; Fan, K.; Wu, J.; Ying, Y. Direct Electrochemical Reduction Of Graphene oxide on ionic liquid doped screen-printed electrode and its electrochemical biosensing application. Biosens. Bioelectron. 2011, 28, 204–209. [Google Scholar] [CrossRef]
- Toh, S.; Loh, K.; Kamarudin, S.; Daud, W. Graphene production via electrochemical reduction of graphene oxide: Synthesis and characterisation. Chem. Eng. J. 2014, 251, 422–434. [Google Scholar] [CrossRef]
- Chen, L.; Tang, Y.; Wang, K.; Liu, C.; Luo, S. Direct electrodeposition of reduced graphene oxide on glassy carbon electrode and its electrochemical application. Electrochem. Commun. 2011, 13, 133–137. [Google Scholar] [CrossRef]
- Jana, A.; Scheer, E.; Polarz, S. Synthesis of graphene–transition metal oxide hybrid nanoparticles and their application in various fields. Beilstein J. Nanotechnol. 2017, 8, 688–714. [Google Scholar] [CrossRef] [PubMed] [Green Version]
- Kuang, D.; Xu, L.; Liu, L.; Hu, W.; Wu, Y. Graphene–nickel composites. App. Surf. Sci. 2013, 273, 484–490. [Google Scholar] [CrossRef]
- Kumar, C.M.P.; Venkatesha, T.V.; Shabadi, R. Preparation and corrosion behavior of Ni and Ni–graphene composite coatings. Mater. Res. Bull. 2013, 48, 1477–1483. [Google Scholar] [CrossRef]
- Yu, Q.Y.; Zhang, Y.X.; Liu, Z.Z.; Zeng, Z.X.; Wu, X.D.; Xue, Q.J. Effect of N2H4 on electrodeposition of Ni-graphene composite coatings and their corrosion resistance property. Mater. Sci. Forum 2015, 816, 192–199. [Google Scholar] [CrossRef]
- Szeptycka, B.; Gajewska-Midzialek, A.; Babul, T. Electrodeposition and corrosion resistance of Ni-graphene composite coatings. J. Mater. Eng. Perform. 2016, 25, 3134–3138. [Google Scholar] [CrossRef] [Green Version]
- Jabbar, A.; Yasin, G.; Khan, W.Q.; Anwar, M.Y.; Korai, R.M.; Nizamb, M.N.; Muhyodinb, G. Electrochemical deposition of nickel graphene composite coatings: Effect of deposition temperature on its surface morphology and corrosion resistance. RSC Adv. 2017, 7, 31100–31109. [Google Scholar] [CrossRef] [Green Version]
- Ding, S.; Xiang, T.; Li, C.; Zheng, S.; Wang, J.; Zhang, M.; Dong, C.; Chan, W. Fabrication of self-cleaning super-hydrophobic nickel/graphene hybrid film with improved corrosion resistance on mild steel. Mater. Des. 2017, 117, 280–288. [Google Scholar] [CrossRef]
- Singh, S.K.; Samanta, S.; Das, A.K.; Sahoo, R.R. Tribological investigation of Ni-graphene oxide composite coating produced by pulsed electrodeposition. Surf. Interfaces 2018, 12, 61–70. [Google Scholar] [CrossRef]
- Karimi, M.A.; Tavallali, H. Corrosion resistance of nickel-zinc/graphene composite coating on mild steel. IJASEAT 2018, 6, 5–8. [Google Scholar]
- Yasin, G.; Khan, M.A.; Arif, M.; Shakeel, M.; Mehtab, T.; Khan, W.Q.; Koral, R.M.; Zuo, Y.; Abbas, Z. Synthesis of spheres-like Ni/graphene nanocomposite as an efficient anti-corrosive coating; effect of graphene content on its morphology and mechanical properties. J. Alloy Compd. 2018, 755, 79–88. [Google Scholar] [CrossRef]
- Singh, S.K.; Samanta, S.; Das, A.K.; Sahoo, R.R. Electrodeposited SiC-graphene oxide composite in nickel matrix for improved tribological applications. Surf. Topogr. Metrol. 2019, 7, 035004. [Google Scholar] [CrossRef]
- Singh, S.K.; Samanta, S.; Das, A.K.; Sahoo, R.R. Hydrophobic reduced graphene oxide-based Ni coating for improved tribological application. J. Mater. Eng. Perform. 2019, 28, 3704–3713. [Google Scholar] [CrossRef]
- Xu, L.; Wang, R.; Gen, M.; Lu, L.; Han, G. Preparation and properties of graphene/nickel composite coating based on textured surface of aluminum alloy. Materials (Basel) 2019, 12, 3240. [Google Scholar] [CrossRef] [PubMed] [Green Version]
- Luo, Y.; Sun, Y.; Gu, Y.; Zhao, J.; Liang, J.; Yue, W. Enhanced tribological performance of a Ni/GO-coated 2024 alloy. J. Mater. Eng. Perform 2020, 29, 2947–2956. [Google Scholar] [CrossRef]
- Berlia, R.; Punith Kumar, M.K.; Srivastava, C. Electrochemical behavior of Sn–graphene composite coating. RSC Adv. 2015, 5, 71413–71418. [Google Scholar] [CrossRef]
- Endres, F.; Abbott, A.P.; MacFarlane, D.R. Electrodeposition of Metals Using Ionic Liquids; Wiley-VCH: Weinheim, Germany, 2008. [Google Scholar]
- Martis, P.; Dilimon, V.S.; Delhalle, J.; Mekhalif, Z. Electro-generated nickel/carbon nanotube composites in ionic liquid. Electrochim. Acta 2010, 55, 5407–5410. [Google Scholar] [CrossRef]
- Abbott, A.; McKenzie, K. Application of ionic liquids to the electrodeposition of metals. Phys. Chem. Chem. Phys. 2006, 8, 4265. [Google Scholar] [CrossRef]
- Haerens, K.; Matthijs, E.; Chmielarz, A.; Van der Bruggen, B. The use of ionic liquids based on choline chloride for metal deposition: A green alternative? J. Environ. Manag. 2009, 90, 3245–3252. [Google Scholar] [CrossRef]
- Brandão, A.T.S.C.; Anicai, L.; Lazar, O.A.; Rosoiu, S.; Pantazi, A.; Costa, R.; Enachescu, M.; Pereira, C.M.; Silva, A.F. Electrodeposition of Sn and Sn composites with carbon materials using choline chloride-based ionic liquids. Coatings 2019, 9, 798. [Google Scholar] [CrossRef] [Green Version]
- Jalota, S. Tin-nickel alloy plating. Met. Fin. 2002, 100, 307–310. [Google Scholar] [CrossRef]
- Cojocaru, A.; Costovici, S.; Anicai, L.; Visan, T. Studies of cathodic processes during NiSn alloy deposition using choline chloride based ionic liquids. Metal. Int. 2009, 14, 1–11. [Google Scholar]
- Vijayakumar, J.; Mohan, S.; Kumar, S.; Suseendiran, S.; Pavithra, S. Electrodeposition of Ni–Co–Sn alloy from choline chloride-based deep eutectic solvent and characterization as cathode for hydrogen evolution in alkaline solution. Int. J. Hydrog. Energ. 2013, 38, 10208–10214. [Google Scholar] [CrossRef]
- Anicai, L.; Petica, A.; Costovici, S.; Prioteasa, P.; Visan, T. Electrodeposition of Sn and NiSn alloys coatings using choline chloride based ionic liquids—Evaluation of corrosion behavior. Electrochim. Acta 2013, 114, 868–877. [Google Scholar] [CrossRef]
- Fashu, S.; Mudzingwa, L.; Khan, R.; Tozvireva, M. Electrodeposition of high corrosion resistant Ni–Sn–P alloy coatings from an ionic liquid based on choline chloride. T. I. Met. Finish. 2018, 96, 20–26. [Google Scholar] [CrossRef]
- Rosoiu, S.P.; Pantazi, A.G.; Petica, A.; Cojocaru, A.; Costovici, S.; Zanella, C.; Visan, T.; Anicai, L.; Enachescu, M. Comparative study of Ni-Sn alloys electrodeposited from choline chloride-based ionic liquids in direct and pulsed current. Coatings 2019, 9, 801. [Google Scholar] [CrossRef] [Green Version]
- Rekha, M.Y.; Kamboj, A.; Srivastava, C. Electrochemical behavior of SnNi-graphene oxide composite coatings. Thin Solid Films 2018, 653, 82–92. [Google Scholar] [CrossRef]
- Al-Gahouari, T.; Bodkhe, G.; Sayyad, P.; Ingle, N.; Mahadik, M.; Shirsat, S.M.; Deshmukh, M.; Musahwar, N.; Shirsat, M. Electrochemical sensor: L-Cysteine induced selectivity enhancement of electrochemically reduced graphene oxide–multiwalled carbon nanotubes hybrid for detection of lead (Pb2+) ions. Front. Mater. 2020, 7, 1–13. [Google Scholar] [CrossRef] [Green Version]
- Badea, M.L.; Cojocaru, A.; Anicai, L. Electrode processes in ionic liquid solvents as mixtures of choline chloride with urea, ethylene glycol or malonic acid. UPB Sci. Bull. Ser. B 2014, 76, 21–32. [Google Scholar]
- Vieira, L.; Burt, J.; Richardson, P.; Schloffer, D.; Fuchs, D.; Moser, A.; Bartlett, P.; Reid, G.; Gollas, B. Tin, Bismuth, and tin-bismuth alloy electrodeposition from chlorometalate salts in deep eutectic solvents. Chem. Open 2017, 6, 393–401. [Google Scholar] [CrossRef]
- Saito, R.; Hofmann, M.; Dresselhaus, G.; Jorio, A.; Dresselhaus, M. Raman spectroscopy of graphene and carbon nanotubes. Adv. Phys. 2011, 60, 413–550. [Google Scholar] [CrossRef]
- Claramunt, S.; Varea, A.; López-Díaz, D.; Velázquez, M.; Cornet, A.; Cirera, A. The importance of interbands on the interpretation of the Raman spectrum of graphene oxide. J. Phys. Chem. C 2015, 119, 10123–10129. [Google Scholar] [CrossRef]
- Kaniyoor, A.; Ramaprabhu, S. A Raman spectroscopic investigation of graphite oxide derived graphene. AIP Adv. 2012, 2, 032183. [Google Scholar] [CrossRef] [Green Version]
- Ferrari, A. Raman spectroscopy of graphene and graphite: Disorder, electron–phonon coupling, doping and nonadiabatic effects. Solid State Commun. 2007, 143, 47–57. [Google Scholar] [CrossRef]
- Mahmood, A. Laser based fabrication of graphene. In Advances in Graphene Science; InTech: Rijeka, Croatia, 2014; p. 84. [Google Scholar]
- Eckmann, A.; Felten, A.; Mishchenko, A.; Britnell, L.; Krupke, R.; Novoselov, K.; Casiraghi, C. Probing the nature of defects in graphene by Raman spectroscopy. Nano Lett. 2012, 12, 3925–3930. [Google Scholar] [CrossRef] [Green Version]
- Marrani, A.; Zanoni, R.; Schrebler, R.; Dalchiele, E. Toward graphene/silicon interface via controlled electrochemical reduction of graphene oxide. J. Phys. Chem. C 2017, 121, 5675–5683. [Google Scholar] [CrossRef]
- Pimenta, M.; Dresselhaus, G.; Dresselhaus, M.; Cançado, L.; Jorio, A.; Saito, R. Studying disorder in graphite-based systems by Raman spectroscopy. Phys. Chem. Chem. Phys. 2007, 9, 1276–1290. [Google Scholar] [CrossRef] [PubMed]
- Rooksby, H. An X-Ray study of tin-nickel electrodeposits. Trans. IMF 1950, 27, 153–169. [Google Scholar] [CrossRef]
- Chen, J.; Li, J.; Xiong, D.; He, Y.; Ji, Y.; Qin, Y. Preparation and tribological behavior of Ni-graphene composite coating under room temperature. Appl. Surf. Sci. 2016, 361, 49–56. [Google Scholar] [CrossRef]
- Hu, C.; Wang, C. Effects of composition and reflowing on the corrosion behavior of Sn–Zn deposits in brine media. Electrochim. Acta 2006, 51, 4125–4134. [Google Scholar] [CrossRef]
- Osório, W.; Spinelli, J.; Afonso, C.; Peixoto, L.; Garcia, A. Microstructure, corrosion behaviour and microhardness of a directionally solidified Sn–Cu solder alloy. Electrochim. Acta 2011, 56, 8891–8899. [Google Scholar] [CrossRef]
- Zheng, D.; Li, M.; Li, Y.; Qin, C.; Wang, Y.; Wang, Z. A Ni(OH)2 nanopetals network for high-performance supercapacitors synthesized by immersing Ni nanofoam in water. Beilstein J. Nanotechnol. 2019, 10, 281–293. [Google Scholar] [CrossRef]


| System Type | Metal Salt/GO Content |
|---|---|
| ILEG-GO | ILEG + 0.1 g/L GO |
| Sn-GO | ILEG + 0.05 M SnCl2 · 2H2O + 0.1 g/L GO |
| Ni-GO | ILEG + 0.05 M NiCl2 · 6H2O + 0.1 g/L GO |
| NiSn-GO | ILEG + 0.05 M SnCl2 · 2H2O + 0.05 M NiCl2 · 6H2O + 0.1 g/L GO |
| Electrolysis Parameter | NiSn-rGO-P1 | NiSn-rGO-P2 | NiSn-rGO-P3 |
|---|---|---|---|
| On- and off-time duration of the pulse | TON = 500 ms | TON = 500 ms | TON = 500 ms |
| TOFF = 250 ms | TOFF = 500 ms | TOFF = 1000 ms | |
| Frequency (f) | f = 1.33 Hz | f = 1 Hz | f = 0.67 Hz |
| Duty cycle (θ) | θ = 0.67 | θ = 0.5 | θ = 0.33 |
| Peak current density (ip) | ip = 20 mA/cm2 | ip = 20 mA/cm2 | ip = 20 mA/cm2 |
| Coatings | Electrodeposition Parameters | Peak Current Density | |||
|---|---|---|---|---|---|
| NiSn-alloys | TON = 500 ms TOFF = 1000 ms F = 0. 67 Hz θ = 0.33 | NiSn-P3.1 | NiSn-P3.2 | NiSn-P3.3 | NiSn-P3.4 |
| ip = 10 mA/cm2 | ip = 15 mA/cm2 | ip = 20 mA/cm2 | ip = 25 mA/cm2 | ||
| NiSn-rGO | NiSn-rGO-P3.1 | NiSn-rGO-P3.2 | NiSn-rGO-P3.3 | NiSn-rGO-P3.4 | |
| ip = 10 mA/cm2 | ip = 15 mA/cm2 | ip = 20 mA/cm2 | ip = 25 mA/cm2 | ||
| Roughness | NiSn-P3.3 Alloy | NiSn-rGO-P3.3 |
|---|---|---|
| RRMS | 60.75 nm | 117.03 nm |
| Ra | 48.63 nm | 91.12 nm |
| Sample | Scan Area (µm2) | Electrical Conductivity Expressed as Electric Current | |
|---|---|---|---|
| IRMS (nA) | Ia (nA) | ||
| NiSn-P3.3 alloy | 3 × 3 | 3.17 | 2.87 |
| NiSn-rGO-P3.3 composite | 4.29 | 3.09 | |
| Immersion Period | NiSn-P3.3 Alloy | NiSn-rGO-P3.3 Composite | ||
|---|---|---|---|---|
| Ecorr, V/Ag/AgCl | icorr, μA/cm2 | Ecorr, V/Ag/AgCl | icorr, μA/cm2 | |
| Initial | −0.84 ± 0.002 | 170 ± 2.16 | −0.57 ± 0.001 | 10.6 ± 0.16 |
| 168 h | −0.86 ± 0.001 | 11.2 ± 0.31 | −0.76 ± 0.003 | 9.5 ± 0.22 |
| 336 h | −0.61 ± 0.01 | 31.6 ± 0.28 | −0.67 ± 0.001 | 34 ± 0.87 |
| Immersion Period | NiSn-P3.3 Alloy | NiSn-rGO-P3.3 Composite | ||
|---|---|---|---|---|
| Rct, Ω | RF, Ω | Rct, Ω | RF, Ω | |
| Initial | 29 | 8715 | 13 | 23,707 |
| 168 h | 33 | 20,160 | 35 | 25,142 |
| 336 h | 38 | 5890 | 40 | 6055 |
Publisher’s Note: MDPI stays neutral with regard to jurisdictional claims in published maps and institutional affiliations. |
© 2020 by the authors. Licensee MDPI, Basel, Switzerland. This article is an open access article distributed under the terms and conditions of the Creative Commons Attribution (CC BY) license (http://creativecommons.org/licenses/by/4.0/).
Share and Cite
Rosoiu, S.P.; Pantazi, A.G.; Petica, A.; Cojocaru, A.; Costovici, S.; Zanella, C.; Visan, T.; Anicai, L.; Enachescu, M. Electrodeposition of NiSn-rGO Composite Coatings from Deep Eutectic Solvents and Their Physicochemical Characterization. Metals 2020, 10, 1455. https://doi.org/10.3390/met10111455
Rosoiu SP, Pantazi AG, Petica A, Cojocaru A, Costovici S, Zanella C, Visan T, Anicai L, Enachescu M. Electrodeposition of NiSn-rGO Composite Coatings from Deep Eutectic Solvents and Their Physicochemical Characterization. Metals. 2020; 10(11):1455. https://doi.org/10.3390/met10111455
Chicago/Turabian StyleRosoiu, Sabrina Patricia, Aida Ghiulnare Pantazi, Aurora Petica, Anca Cojocaru, Stefania Costovici, Caterina Zanella, Teodor Visan, Liana Anicai, and Marius Enachescu. 2020. "Electrodeposition of NiSn-rGO Composite Coatings from Deep Eutectic Solvents and Their Physicochemical Characterization" Metals 10, no. 11: 1455. https://doi.org/10.3390/met10111455
APA StyleRosoiu, S. P., Pantazi, A. G., Petica, A., Cojocaru, A., Costovici, S., Zanella, C., Visan, T., Anicai, L., & Enachescu, M. (2020). Electrodeposition of NiSn-rGO Composite Coatings from Deep Eutectic Solvents and Their Physicochemical Characterization. Metals, 10(11), 1455. https://doi.org/10.3390/met10111455