Article

Microstructure and Properties of Copper–Graphite Composites Fabricated by Spark Plasma Sintering Based on Two-Step Mixing

1
Faculty of Materials Metallurgy and Chemistry, Jiangxi University of Science and Technology, Ganzhou 341000, China
2
State Key Laboratory of Advanced Power Transmission Technology, Beijing 102209, China
*
Author to whom correspondence should be addressed.
Metals 2020, 10(11), 1506; https://doi.org/10.3390/met10111506
Submission received: 29 September 2020 / Revised: 4 November 2020 / Accepted: 9 November 2020 / Published: 11 November 2020

Abstract

:
The microstructure and properties of Copper-Graphite Composites (CGC) prepared by spark plasma sintering (SPS) based on two-step mixing and wet milling were investigated. The results showed that Cu powders were rolled into Cu flakes during milling, and their size significantly decreased from 23.2 to 10.9 μm when the graphite content increased from 1.0 wt.% to 2.5 wt.%. The oxidation of Cu powder was avoided during two-step mixing and wet milling. After spark plasma sintering, the graphite powders of the composites were mainly distributed at Cu grain boundaries in granular and flake shapes. The mean size of Cu grains was 9.4 um for 1.0 wt.% graphite content and reduced slightly with the increasing of graphite content. Compared with other conventional methods, the composite prepared by two-step mixing and SPS achieved higher relative density, electrical conductivity, and micro-hardness, which, respectively, reduced from 98.78%, 89.7% IACS (International annealed copper standard), and 64 HV (Vickers-hardness) to 96.56%, 81.3% IACS, and 55 HV when the graphite content increased from 1.0 wt.% to 2.5 wt.%. As the graphite content increases, the friction coefficient and wear rate of the composite decreases. When the graphite content of CGC is 1.0 wt.%, the main wear mechanism was plastic deformation, delamination, adhesive, and fatigue wear. The adhesive and fatigue wear disappeared gradually with the increasing of graphite content.

1. Introduction

Due to high thermal and electrical conductivity, copper matrix composites are extensively applied in many areas, such as machinery, electronics, rail transit, and aerospace [1]. Graphite with self-lubrication and superior thermal and electrical conductivity is usually added into copper as an ideal second phase. Until now, many researchers have tried to fabricate copper graphite composites (CGC) by casting or powder metallurgy [2,3,4]. Because of poor wettability and a high specific gravity difference between graphite and copper, it is very hard to add graphite particles into copper liquid through casting, and they can’t distribute uniformly in copper matrix, instead agglomerating together. Therefore, the powder metallurgy (PM) technique has become a popular method to prepare CGC. Ball milling, compaction, and sintering are the three main procedures during PM and the former is very important for the uniform distribution of graphite particles. Dry milling is a common way to mix these different composite powders together [5]. Some reports introduced different times for mixing, such as 3 min and 30 min [6,7]. Prolonged milling can promote the uniform distribution of graphite particles. Liu et al. [8] mixed the graphites and Cu powders for 20 h. However, prolonged milling may lead to excessive work hardening and fracture of copper powder due to repeated plastic deformation. At the same time, some heat would be produced and lead to the oxidation of copper powders. To reduce the excess heat, the container of the composite powders rotated for some time intervals in both clockwise and anticlockwise directions, or in a special direction [9,10]. However, even stopping for 30 min after every 1 h of milling, these copper powders would be oxidized after 5 h [11]. The ethanol is always used as the liquid medium to avoid the heat creation as much as possible during milling [12,13,14,15]. For the powders in the liquid medium, the ultrasonic and magnetic stirring can provide the energy to move from one position to another. Therefore, it would shorten the time of dispersing different kinds of composite powders uniformly. For very tiny size particles such as carbon nanotube [16], graphene powder [17,18], and nanosized CuO powder [19], some researchers had already used ultrasonic and magnetic stirring technology to separate them completely and make them distribute homogeneously. For example, Singh et al. [18] found that the graphene, even up to 1.5%, can be homogenously dispersed in Cu-matrix by ultrasonic vibration and magnetic stirring. For slightly bigger graphite particles, the ultrasonic and magnetic stirring should also provide enough energy to stir and disperse them. However, we are not aware of any studies that aim to raise the uniform distribution of graphite particles in copper matrix by using ultrasonic and magnetic stirring technology up to now.
Besides conventional sintering, several other powder metallurgy techniques, such as microwave sintering and friction stir processing, have been used to prepare the composites [20,21]. Recently, spark plasma sintering (SPS), as a new and advanced technique, has been extensively applied to fabricate ceramics (ZrO2-bearing lithium-silicate glass-ceramics), metals, alloys (nickel and nickel-based alloys, CuCrFeTiNi) and composites (Cu–Al2O3, Aluminu-carbon nanotubes) because of its many advantages, such as low sintering temperature, short sintering time, high relative density, and excellent mechanical properties [22,23,24,25,26]. During SPS of composites, the current can pass through particles and generate heat directly in the sample by Joule effect. Furthermore, under high temperatures, applying pressure can reduce the distance between particles and increase plastic deformation [27]. Therefore, the composite prepared by SPS would show good mechanical properties because of high bonding ability between particles and low porosity [22].
In this work, the aim is to mix copper and graphite powders uniformly by using ultrasonic and magnetic stirring technology, and to prepare CGC with good properties by wet milling and SPS. Firstly, in order to separate the graphite particles, the beaker containing some graphite powders and liquid medium will be put into an ultrasonic device. Then, the beaker will be put into a magnetic stirrer to make these powders further disperse uniformly. Simultaneously, the properties and microstructure of the CGC with different graphite content will be discussed.

2. Experiment

2.1. Materials and Preparation of Composites Powder

CGC contains two kinds of raw materials used in this work. One is electrolytic copper powder (99.9% purity, Nangong Xindun alloy welding and spraying Co., Ltd., Xingtai, China), and the other is flake graphite powder (99.9% purity, Qingdao Huatai lubricating sealing technology Co., Ltd., Qingdao, China). The average size of copper powders and graphite powders are about 15 μm and 30 μm, respectively.
According to mass fraction of graphite in CGC, 1.0%, 1.5%, 2.0%, and 2.5%, four different amounts of graphite were, respectively, added into four beakers with 200 mL ethanol and stirred with a glass rod for 10 min. In order to separate graphite powders further, the beakers were put into an ultrasonic device with 120 W power at 40 kHz frequency for 60 min until the suspensions were obtained. In total, four different amounts of electrolytic copper powders were added into the corresponding beakers with suspensions and then the beakers were put into magnetic stirrer at 800 rmp for 180 min. The mixed powder suspensions were poured into a tank for ball grinding mixing. The ratio between ball and powder is 10:1. To avoid the ferrous, the materials of ball and tank are made of zirconia and polytetrafluoroethylene (PTFE). The grinding speed is 200 r/min for 480 min. After that, a sieve was used to separate the suspension and balls and the former was put into a thermostatic air-blower-driver drying closets at 60 °C for drying.

2.2. Fabrication of Copper and Graphite Composite

The SPS method was adopted to fabricate copper and graphite composites. The composite powder was fed into a cylindrical graphite container with 35 mm diameter and 30 mm height. After that, the container was placed in the sintering furnace (LABOX-1575F, Sinter Land Inc., Niigata Prefecture, Japan) and then the vacuum pump was open until the vacuum value was below 5 Pa. The temperature for SPS was 750 °C at a heating rate of 100 °C/min and the pressure was 45 MPa for 5 min.

2.3. Characterization of CGC

X-ray diffractometer (XRD, Empyrean, Netherland) with Cu kα radiation (λ = 1.54 Å) was used to analyze the phase of composite powders. The scanning speed and range are 10°/min and 20°~90°, respectively. The friction test was carried out by using a ball-on-disc reciprocating sliding tribometer (MFT-4000, Lanzhou Huahui Instrument Technology Co. Ltd., Lanzhou, China) at room temperature. The GCr15 steel balls with a diameter of 5 mm were used as friction pairs. All tests were performed at a sliding frequency of 5 Hz under a load of 5 N, a reciprocating amplitude of 5 mm and a test duration of 20 min, and two samples for each graphite content were subjected to the tribological test. The wear rate was calculated through the two-dimensional contour map from a three-dimensional profiler (NanoMap 500LS, AEP Technology Inc., Silicon Valley, CA, USA). These sintered samples were polished with different sand papers and diamond paste (0.25 mm size), etched by a solution of 5 g FeCl3 and 50 mL HCl in 100 mL distilled water and then thoroughly washed with deionized water and dried. The distribution of graphite, the microstructure of CGC and the morphology of the worn surface was characterized using scanning electron microscope (SEM, MLA650F, FEI Inc., Hillsboro, OR, USA). The energy-dispersive spectroscopy (EDS) attached with SEM was used to analyse the distribution of Cu and C. The electrical conductivity of CGC is measured using eddy conductivity meter (Sigma2008-B/C, Xiamen Tianyan Instrument Co. Ltd. Xiamen, China). The average values of electrical conductivity were obtained by measuring ten different positions on each sample surface and its unit is % IACS. The micro-hardness values of all these samples were examined by Vickers hardness tester (200HVS-5, Laizhou Huayin Test Instrument Co. Ltd., Laizhou, China) with a load of 0.2 kg for a dwelling time of 15 s. The average value of hardness was obtained by testing seven different locations.
The densification of all the specimens was measured by using the Archimedes principle and the average value was obtained by measuring three times for each sample. The theoretical values of density were calculated by using the following formula.
1 ρ c   =   M G r 1 ρ G r   +   M C u 1 ρ C u
where M G r is the mass fraction of graphite, ρ G r is the density of graphite (2.07 g/cm3), M C u is the mass fraction of copper and ρ C u is the density of copper (8.96 g/cm3).

3. Results and Discussion

3.1. Characterization of CGC Powder

Figure 1 shows the morphologies and mean diameter of CGC powders with different graphite contents. After ball milling, Cu powders with 1% graphite content were rolled into Cu flakes with a 2-D planar morphology and their average value was 23.2 μm. The shape of Cu flakes is formed due to shearing and rolling from ball-to-powder repeated collision. When the graphite content is 2%, the size of Cu flakes significantly decreases to 11.9 um. This phenomenon is considered to be a good self-lubricating effect of graphite in ball milling process, which can partly prevent the cold-welding between Cu powders, resulting in the decreasing size of the Cu powders. Additionally, more graphite particles would fill the voids and interfaces, which can also prevent excessive cold-welding, further refining the size of CGC powder. As shown in Figure 1e, just like the copper coating process on graphite powders by chemical plating, some very small copper particles about 0.4 um attached the surface of flake graphite after ball milling, which may be helpful to increase the bonding quality between copper and graphite.
Figure 2 indicates the XRD pattern of raw Cu powder and milled CGC powders. As shown in the XRD pattern, the graphite phase is observed in the CGC powders and CuO phase would not be detected in the CGC powder, which implies that the oxidation of Cu powder is avoided during two-step mixing and wet ball milling. Compared to the original Cu powder, the broadening of diffraction peaks is indicative of lattice strain and grain size refinement. During the ball milling process, a large number of dislocations may appear in the severely deformed Cu powders due to the impact force and shear stress. Various dislocation activities may be motivated, including sliding, accumulation, interaction, tangling, and spatial rearrangement. In this way, the original grains are subdivided into refined blocks via formation and evolution of dislocation cells.

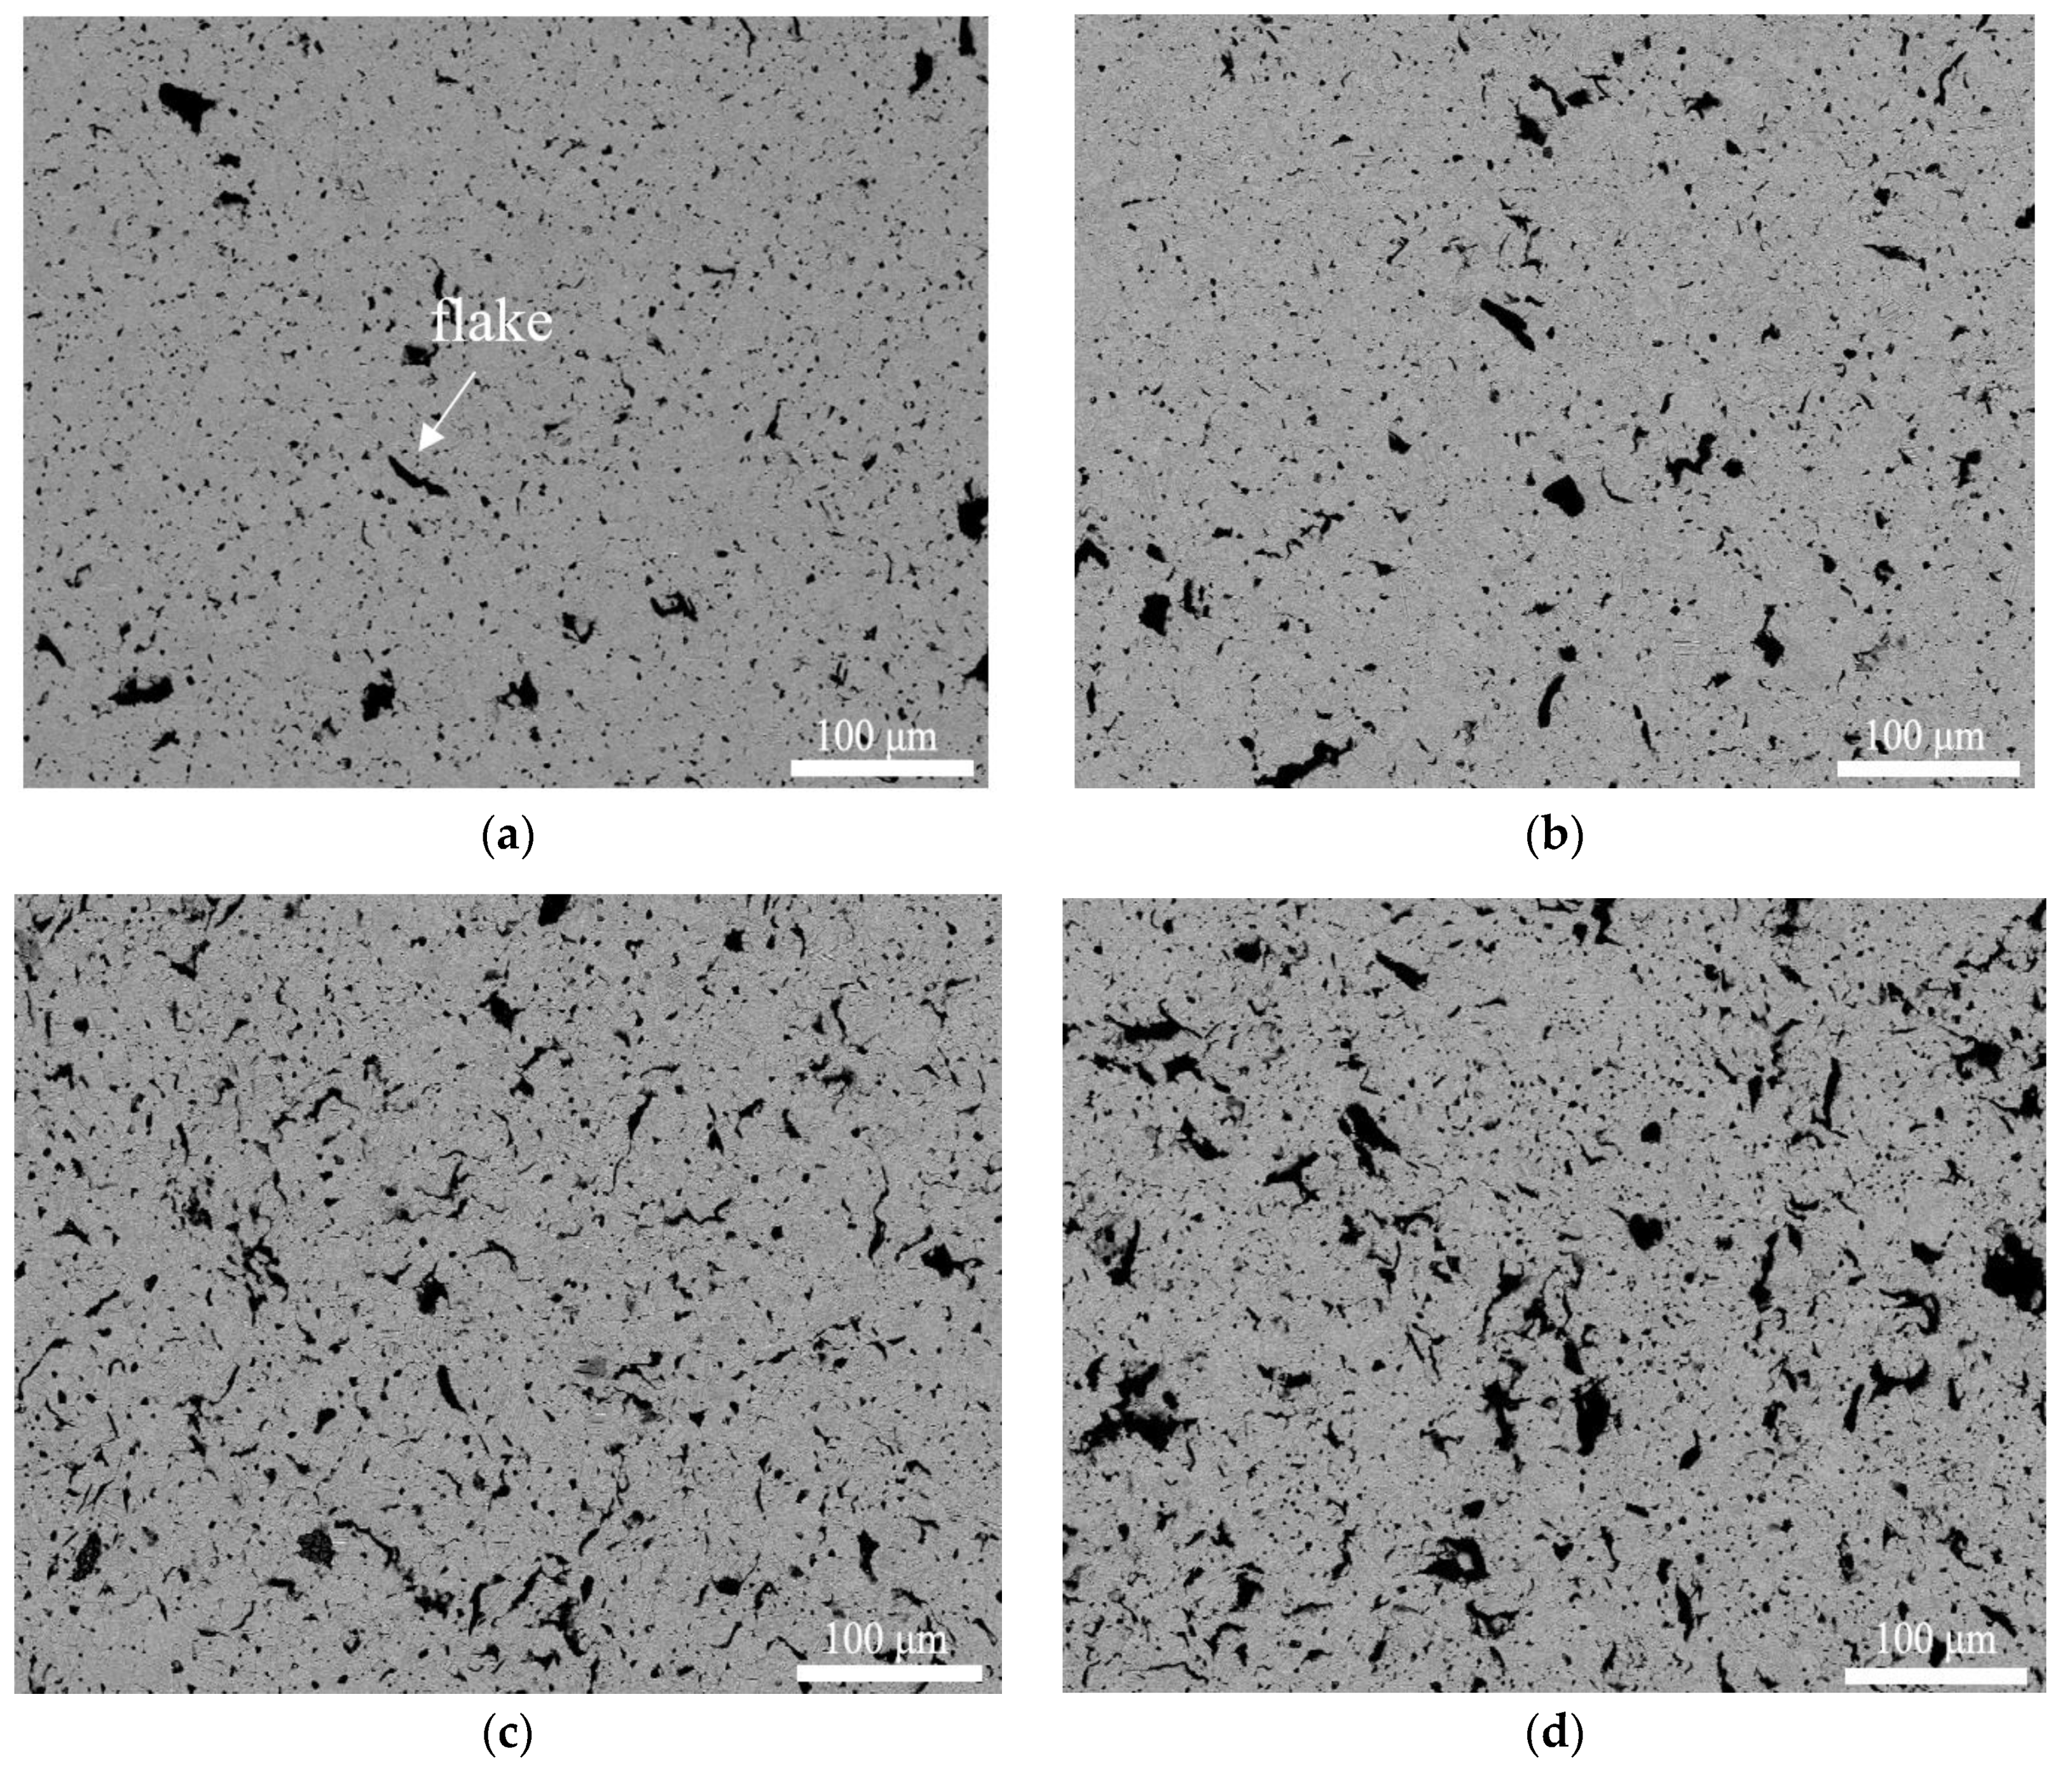
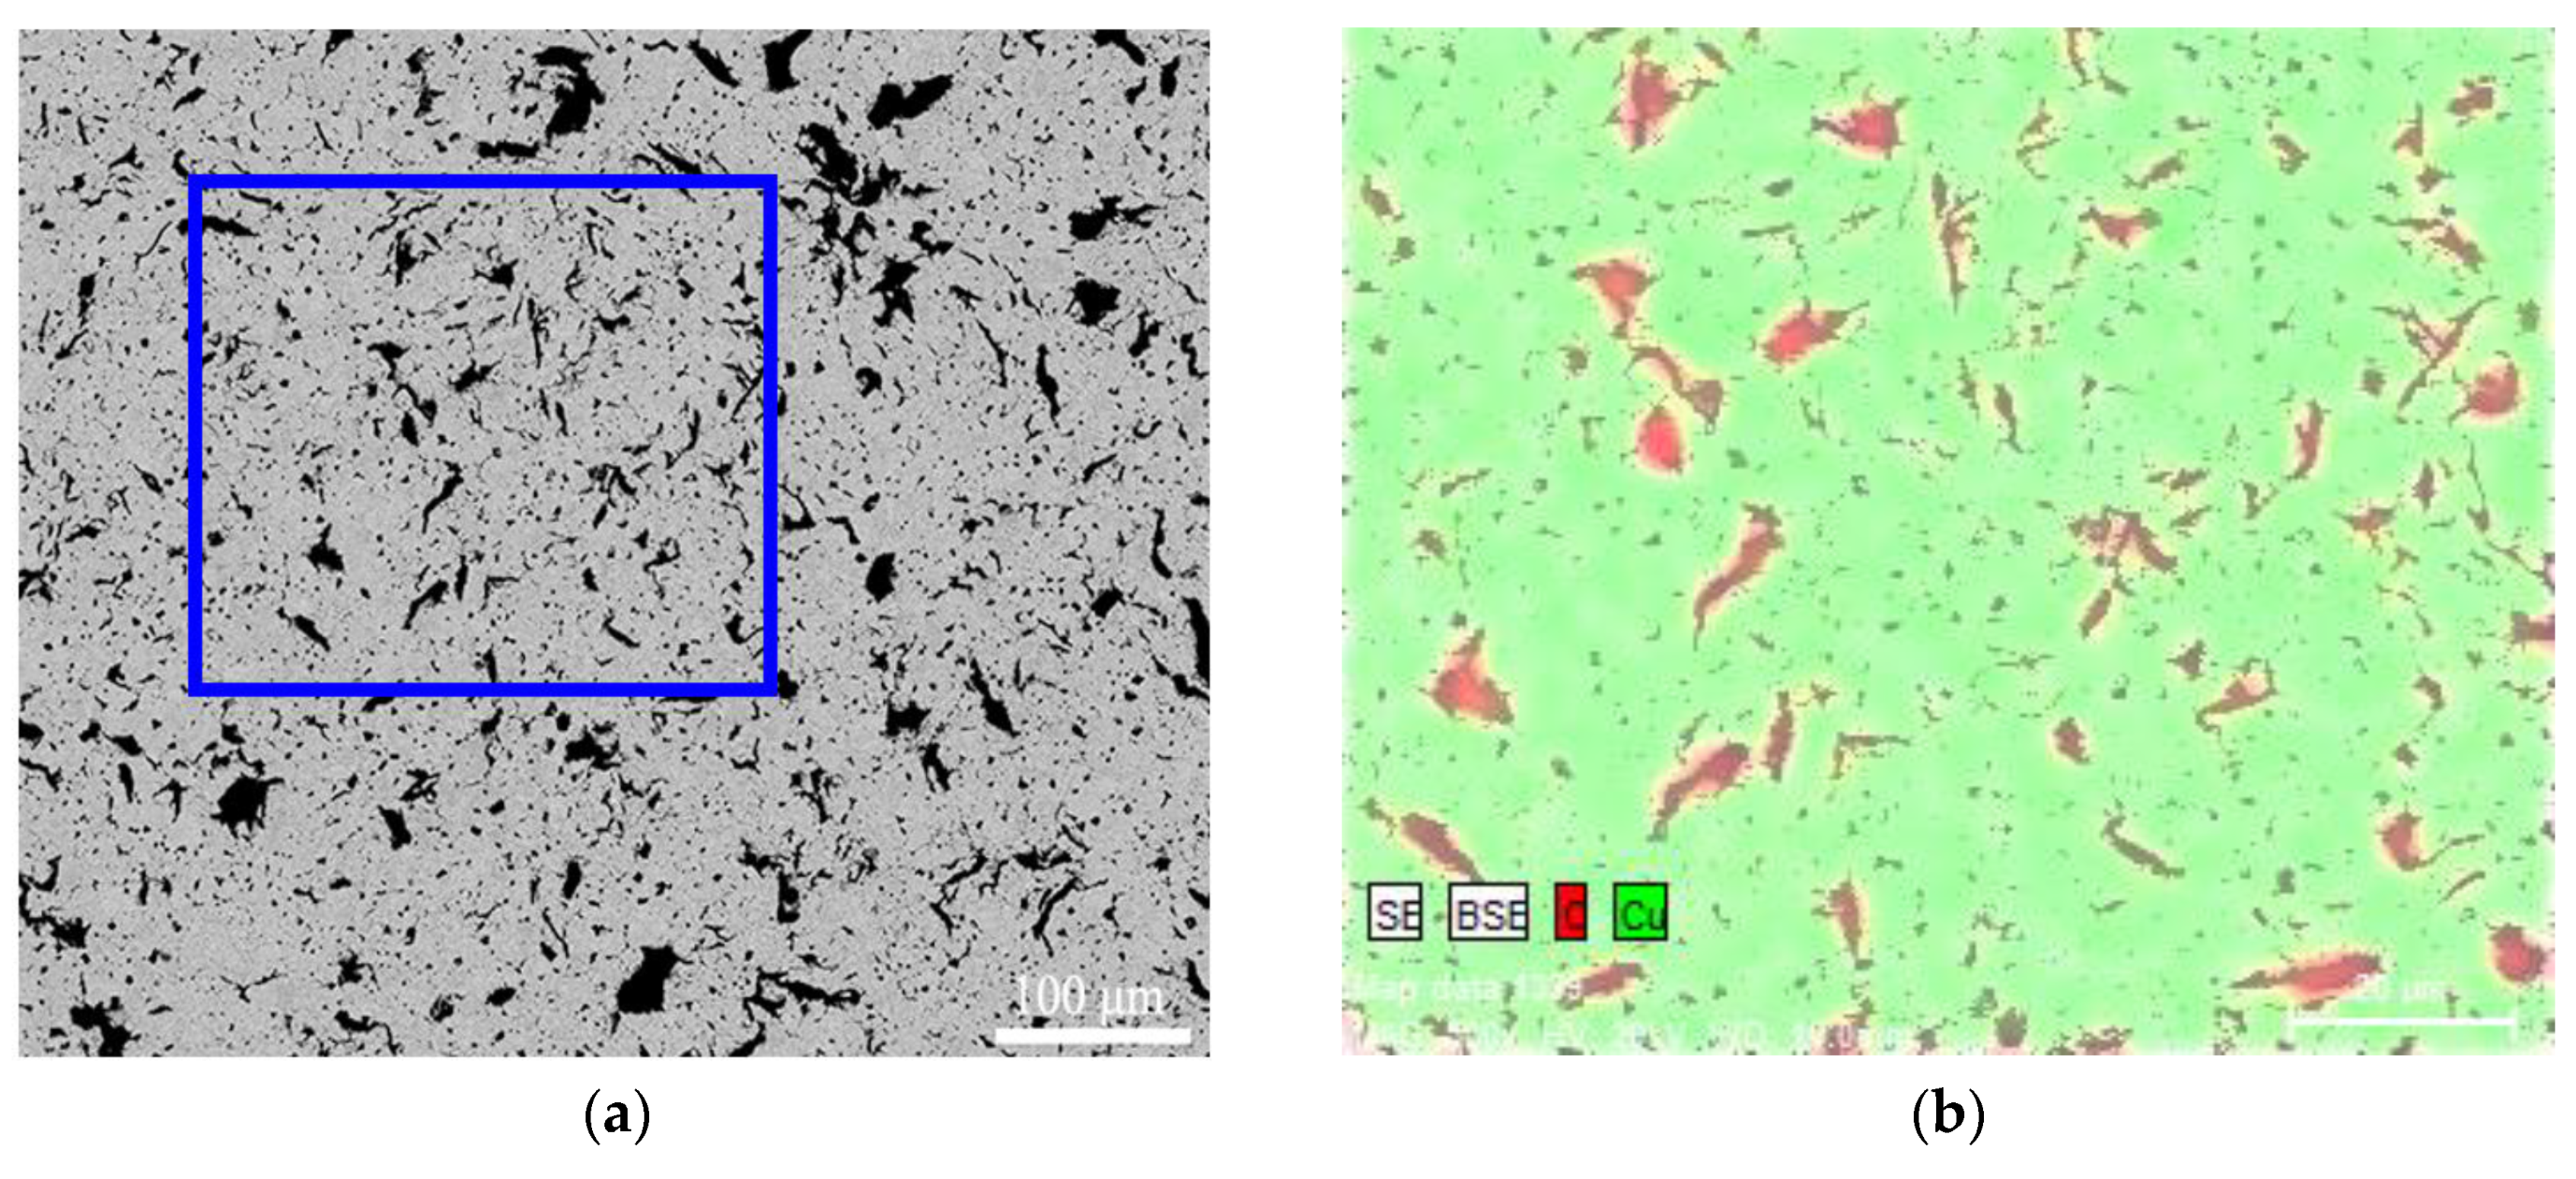
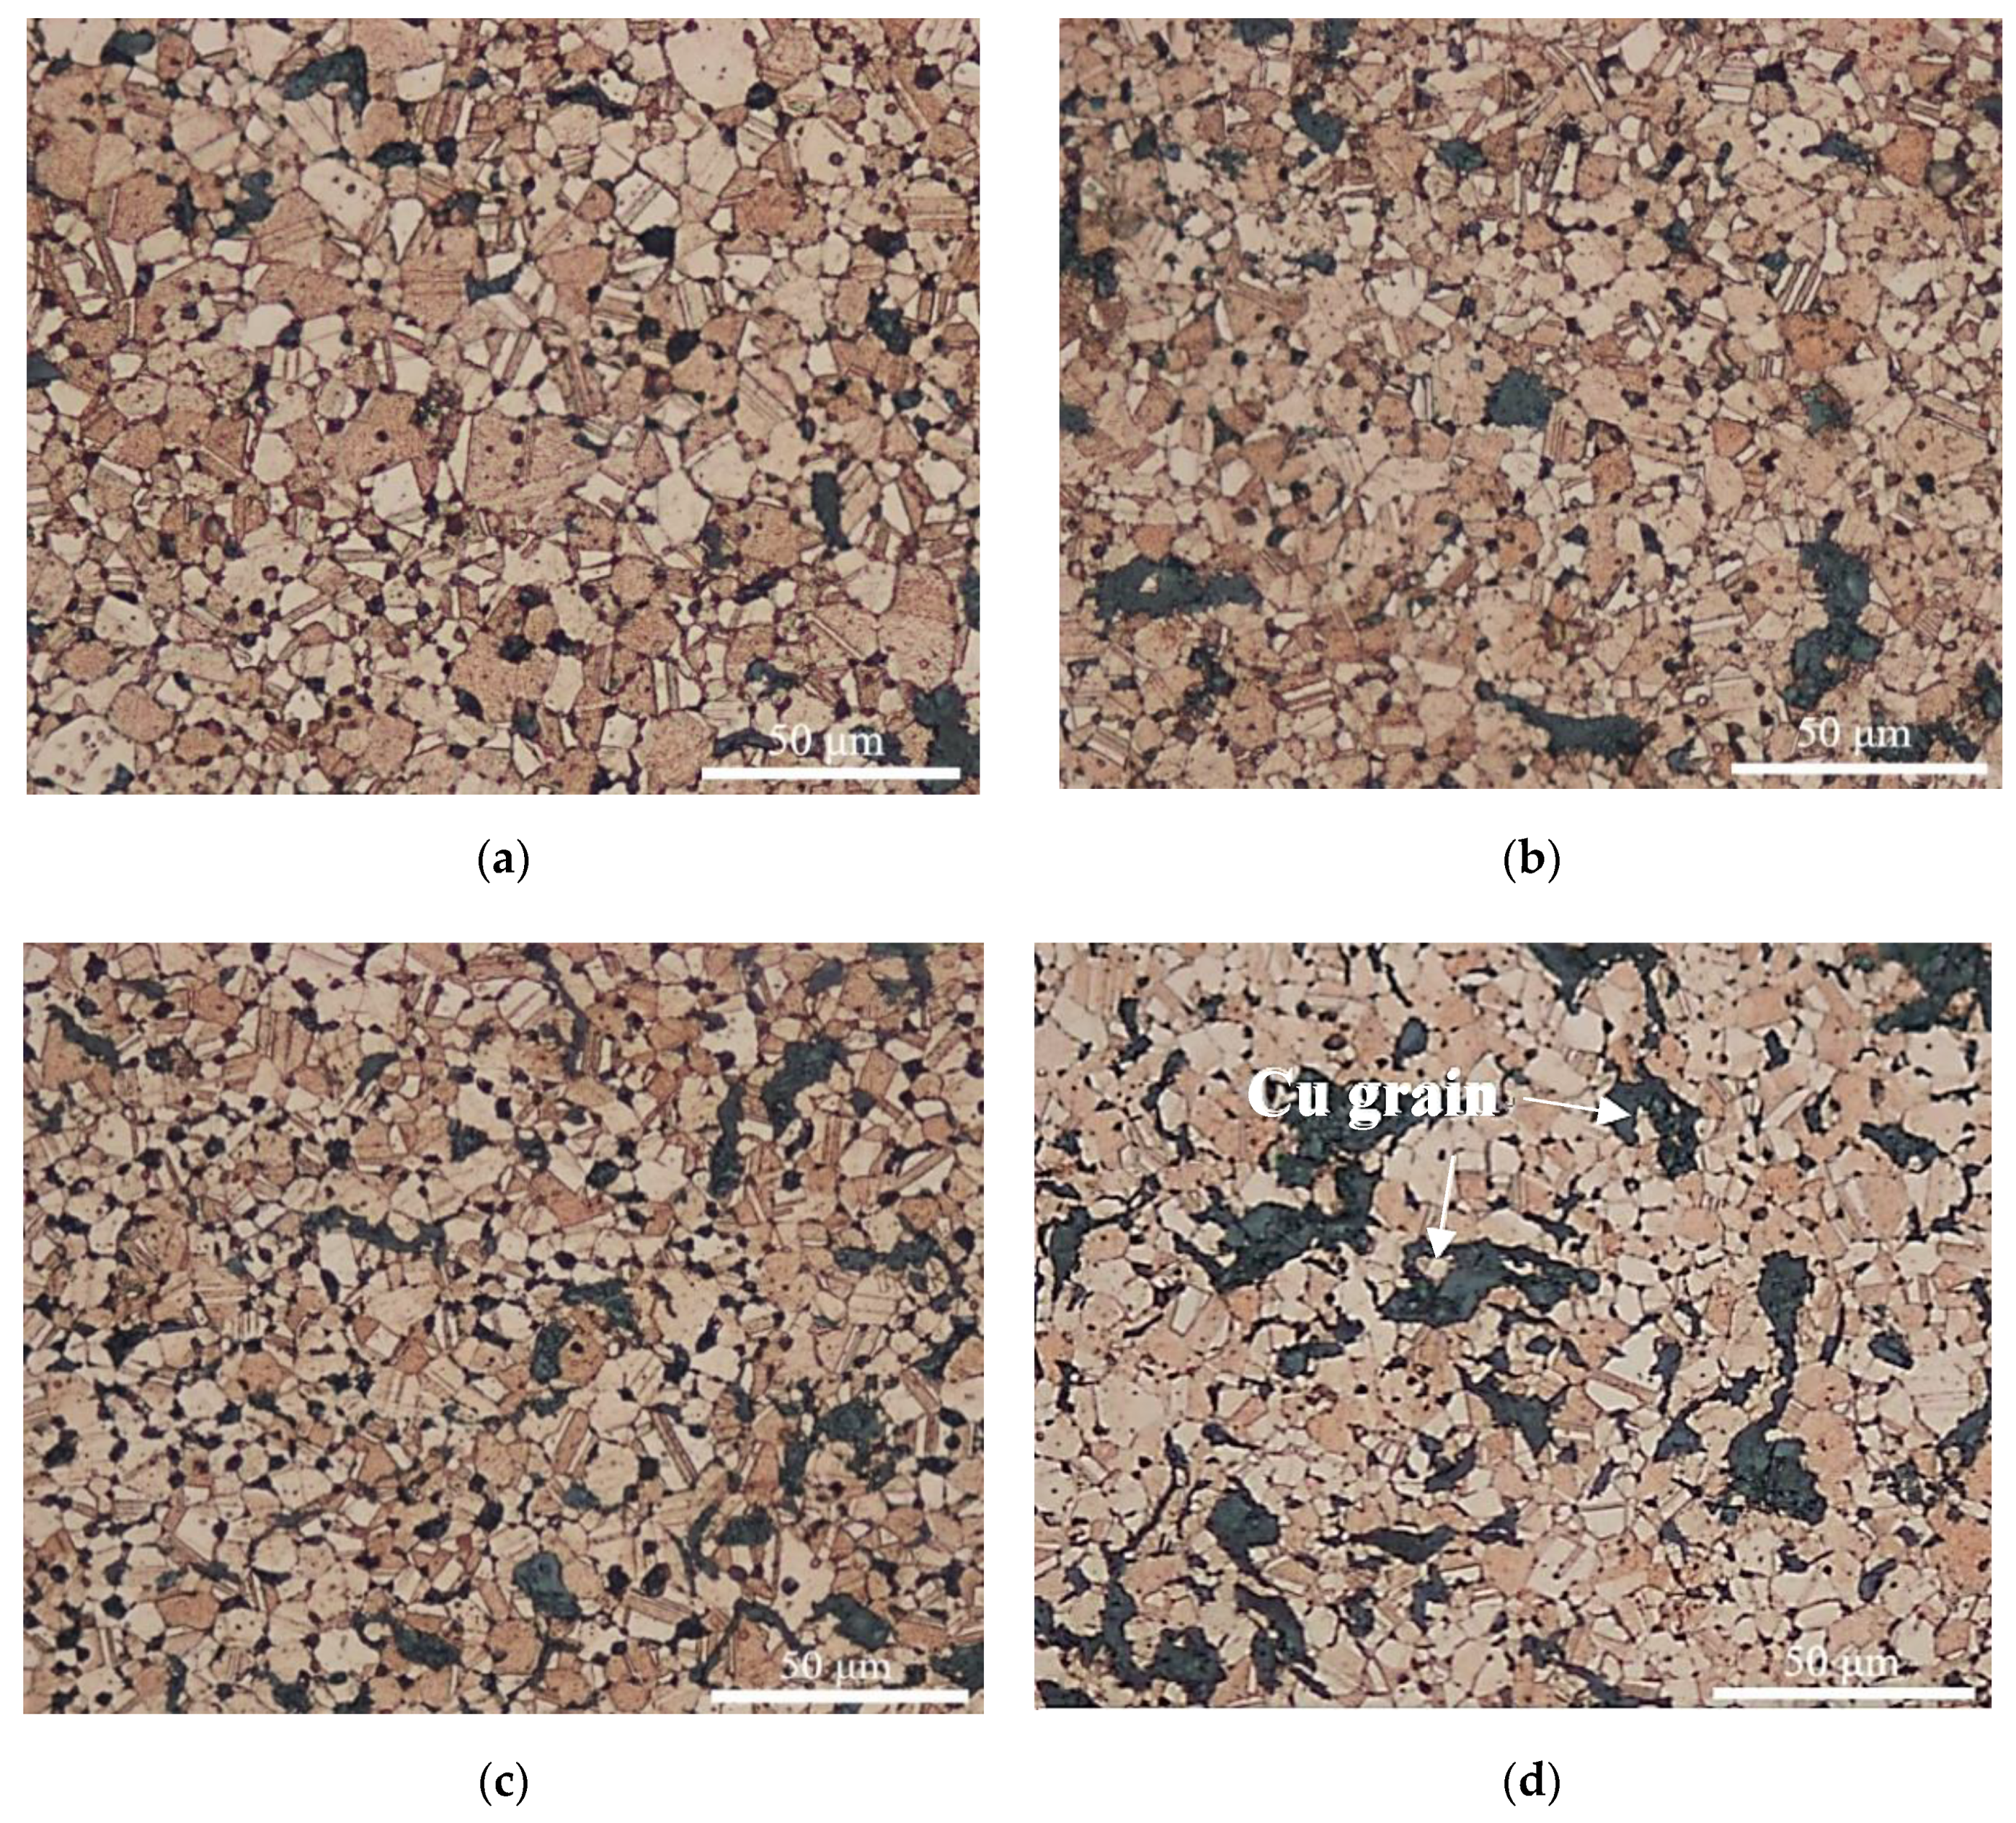
3.2. Microstructure of CGC

To investigate the dispersion and morphology of graphite in CGC, SEM characterization was performed on CGC with different graphite content. SEM-BSE (Back scattering electron) images of CGC for different graphite contents (1.0%, 1.5%, 2.0%, and 2.5%) are shown in Figure 3, where the dark phase is graphite and the white phase is Cu matrix. As shown in Figure 3a, the graphite uniformly dispersed by two kinds of graphite shape in Cu matrix. One is granular and the other is flake (arrow in Figure 3). Most graphite granulars are very small due to repeated impact among balls and few graphite flakes keep their original shape. When the graphite content is low, such as 1.0%, most graphite flakes are rolled into granular shapes by ball milling. The transformation of the graphite shape would result in the increase in the surface energy of graphite particles. However, when the graphite content increased to 2.0% or 2.5%, the amount of flake graphite clearly increased. This phenomenon may be attributed to good lubrication with many graphite particles, which can weaken the impact effect and easily keep the flake shape of graphite.
In order to further investigate the details of graphite, the EDS image of CGC with graphite contents 2.5% was shown in Figure 4. The graphite appeared in red color and copper in green color. Most large graphite particles uniformly distributed in composite and few were dropped off during grinding sample by sand papers. According to the results, two-step mixing was favorable to the uniform dispersion of graphite particles in Cu matrix.
Figure 5a–d were OM (Optical microscope) images of CGC with different graphite content. The graphite was mainly distributed at equiaxed grain boundaries. A total of one hundred grains from every image in Figure 5 had been selected randomly and then measured. The mean sizes of grains are 9.4, 8.1, 7.6 and 7.1 um for graphite content 1.0%, 1.5%, 2.0%, and 2.5%, respectively. The average grain size reduced slightly with the increasing of graphite content, indicating that the graphite particles may suppress the growing of copper grain during sintering process. When the graphite content was above 1.5%, a few graphite particles were agglomerated and some tiny Cu grains (arrows in Figure) can be found in graphite clusters.

3.3. Effect of the Graphite Content on Properties of CGC

3.3.1. Relative Density

From the Formula (1), the theoretical values of density for CGC with 1.0%, 1.5%, 2.0, and 2.5% are 8.67, 8.53, 8.40, and 8.27 g/cm3, respectively. Table 1 shows the relative density of CGC with different graphite content. In this work, the relative density decreased with increasing graphite content, corresponding to a similar tendency in previous studies [9,28]. For the CGC with 1.0% graphite content, the graphite particles were small and distribute uniformly. The relative density may also be improved due to the high surface energy from these small graphite particles. When the graphite content increased, some graphite particles agglomerated at grain boundaries (Figure 5b) due to poor wettability, which may cause the formation of micro-voids, leading to the decline of relative density [9]. Compared with previous studies [9,28,29], this work presented higher relative-density, exhibiting an advantage of two-step mixing and SPS. Two-step mixing can make graphite particles distribute more uniformly and is beneficial to eliminate the micro-voids in CGC. Moreover, there was a pulse current that can generate heat among composite powders during SPS and lead to high densification under compressive pressure [22]. Additionally, when the processing temperature is low, such as 750 °C during SPS, the CGC can obtain a higher relative density than those obtained from conventional sintering or vacuum-hot-press sintering with higher temperature (Table 1).

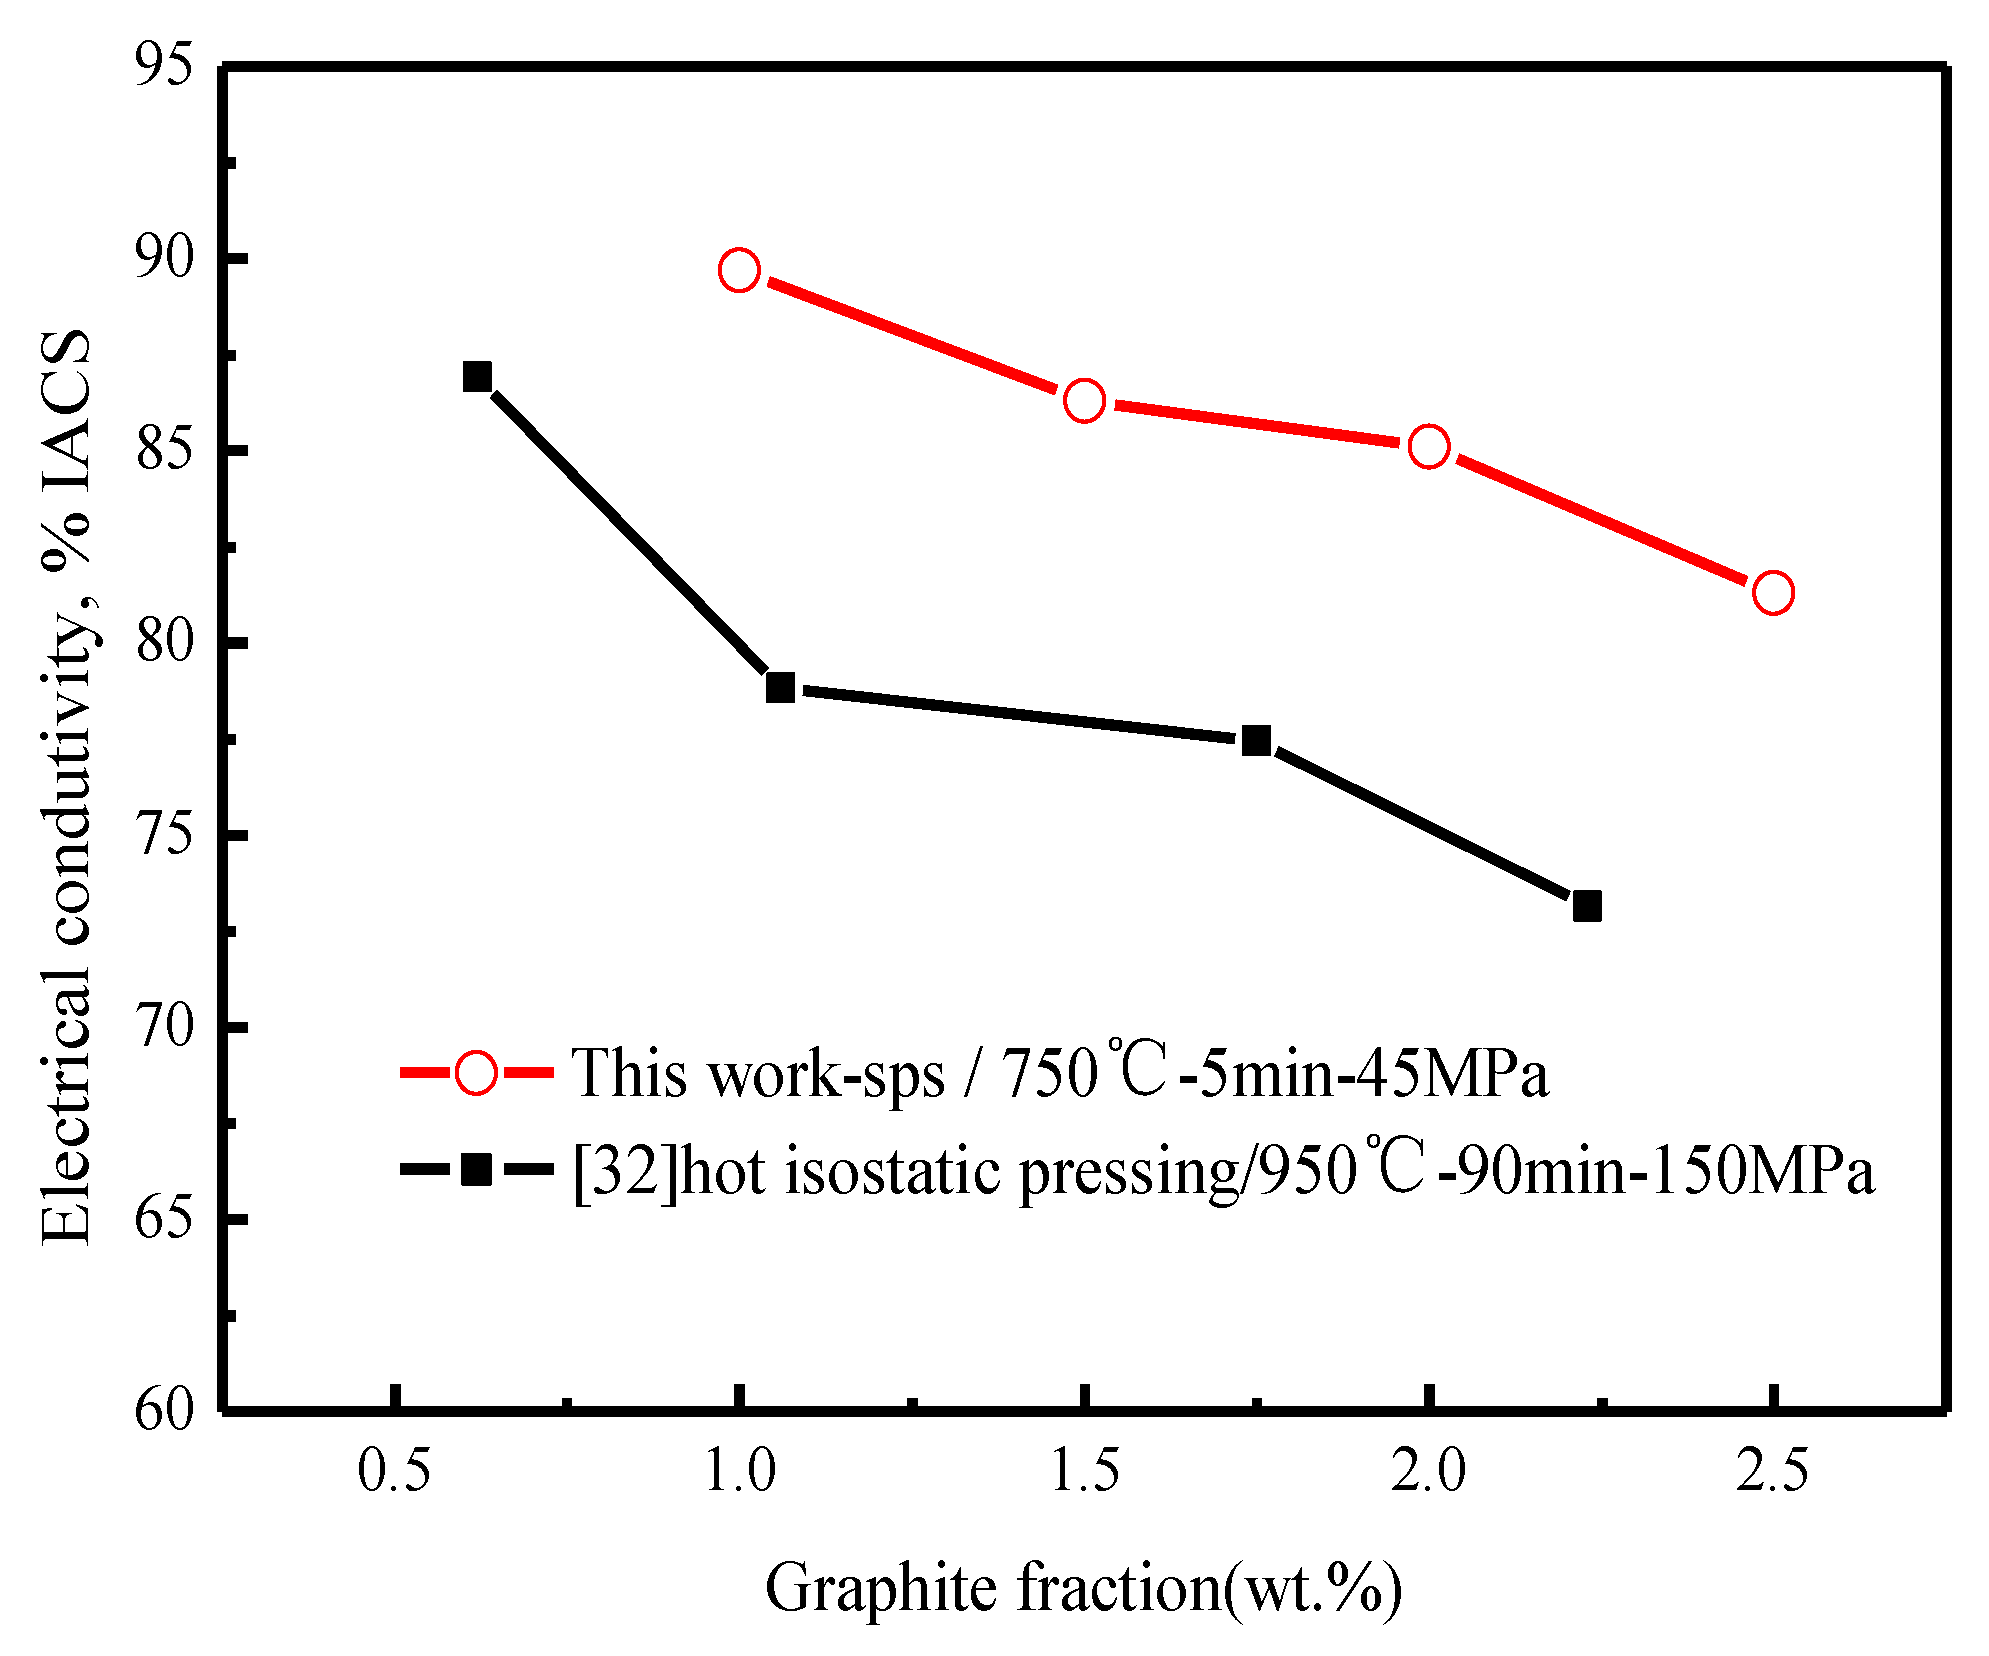
3.3.2. Electrical Conductivity

Figure 6 shows the electrical conductivity of CGC with different graphite contents. It can be seen that the electrical conductivity of CGC decreases with the increase in graphite content. Since the electrical conductivity of graphite is lower than pure Cu, the electrical conductivity of CGC decreased with the increase in graphite content. Further, the addition of graphite may increase the lattice defects and grain boundary density (Figure 5) in the Cu matrix, which can reduce the electrical conductivity by blocking the electrical conductive path. Furthermore, the addition of graphite may increase the lattice defects in the Cu matrix, which can reduce the electrical conductivity by blocking the electrical conductive path. The electrical conductivity, decreasing near linearly with different graphite content (1.0%, 1.5%, 2.0%, and 2.5%), are 89.7% IACS, 86.3% IACS, 85.1% IACS, and 81.3% IACS, respectively. Some researchers pointed out that a near linear dependence between the electric conductivity and graphite content is observed when the graphite content was below 20 vol% (5.02 wt.%) [30,31]. Compared with the previous studies [32], this work obtained a higher electric conductivity, and it may be attributed to good interfacial bonding and negligible porosity, which is convenient to move for free electron in the composite [33].

3.3.3. Micro-Hardness

The micro-hardness values of CGC with different graphite content are presented in Figure 7. The hardness was 64 HV when the graphite content was 1.0%. These small graphite particles dispersing uniformly can prevent the movement of dislocation and improve the hardness due to the high surface energy. Graphite, as a soft material added into copper, may lead to a reduction in hardness. In addition, some porosity may occur because of the agglomeration of graphite, making the hardness decrease. Therefore, the hardness decreased with the increasing of graphite content, showing the same relationship as the literature [9]. Compared with the conventional sintering, the CGC prepared by SPS can obtain greater hardness, which may be associated with the higher relative density and finer grain size. Nayak et al. [34] prepared the CGC containing 1.06% graphite by conventional sintering and its hardness and relative density was 52 HV and 93.16%, respectively. This work got a CGC with higher hardness, 64 HV by SPS and its relative density was 98.78% when the graphite content was 1.0%. Furthermore, even though the graphite content was higher, for example 2.5%, the hardness value of CGC was still high at 55 HV.

3.3.4. Friction and Wear Characteristics

Figure 8 showed the average friction coefficient and wear rate of CGC with different graphite content. It can be seen that both the friction coefficient and the wear rate showed the same tendency. As compared with pure copper, they reduced significantly for the composite with 1% graphite and then decreased slowly and near linearly with the increase in graphite content. This is mainly due to the excellent lubricating effect of graphite. During the friction process, the graphite particles embedded in the copper matrix were extruded by the steel balls and gradually cut off under the shear force. At the same time, the copper chips would also drop and mix with these small graphite particles. After a period of friction, the lubricating film containing small graphite particles and copper chips was formed on the contact surface of composite, which effectively avoided the direct contact between the steel balls and the CGC, and significantly reduced the friction coefficient and wear rate [21,35]. Furthermore, the more graphite in CGC, the more graphite in the lubricating film, and the lower friction coefficient and wear rate [36].
Figure 9 showed the worn surface morphologies of CGC with different graphite content. When the graphite content is 1.0%, the worn surface contained many obvious delaminated scars, deep ploughing grooves, large graphite particles, and wear debris. During sliding, a certain plastic deformation of the matrix will appear due to shearing stress and normal pressure. As a result of frequent sliding, some heat will be generated by friction and deformation, making the matrix soft. It is easy to create obvious delamination by severe deformation for the soft matrix. Some graphite particles would be exposed to the contact surface due to the plastic deformation. When the ball met these particles, some of them would be pressed into the soft matrix by the normal pressure and produced deep ploughing grooves with the moving of the ball on the surface. Additionally, due to shear stress and normal pressure, some cracks may initiate at the weaker bonding interface between graphite and matrix in the sub-surface. After some time of sliding, these cracks will grow to the contact surface, and eventually join together to detach a layer from the sliding surface and form spalling pits due to fatigue wear. A few fine wear debris and adhesives can also be seen on the worn surface. These means that the main wear mechanisms were plastic deformation, delamination, adhesive, and fatigue wear. When the graphite content increased to 1.5%, more graphite particles would reduce the friction coefficient and hinder severe plastic deformation of the matrix. The worn surface showed evident changes. The deep ploughing grooves disappeared but few shallow grooves still occurred. Further, the number and size of spalling pits decreased significantly. Many delaminated layers still clearly existed and its size became larger as compared to 1.0% graphite content. Additionally, many adhesives can be found on the worn surface. These showed that the adding of graphite would improve the adhesion situation between composite and balls. The adhesive and delamination were the main wear mechanism. With the increase to 2.5% of graphite content, the SEM pictures showed that the worn surfaces were very smooth and few grooves and delamination can still be found. A graphite lubricant layer may form on the sliding surface of sample with high graphite content. Rajkumar [20] pointed out that 2.2% graphite addition was enough to create the self-lubricating effect at the contact surface owing to formation of continuous thick graphite layer that prevents the direct contact between ball and composites. Therefore, the friction stability of composites was improved and the adhesive wear may not cause. The main wear mechanism was plastic deformation and delamination.

4. Conclusions

(1)
During ball milling, Cu powders were rolled into Cu flakes and its size decreased with the increase in graphite content.
(2)
The equiaxed grain size of CGC prepared by SPS reduced slightly when adding more graphite powders and the graphite powders were mainly distributed at grain boundaries with the shape of granular and flake.
(3)
Compared with other conventional methods, the CGC prepared by two-step mixing and SPS achieved higher relative density, electrical conductivity, and micro-hardness.
(4)
As the graphite content increases, the friction coefficient and wear rate of the composite decreases. When the graphite content of CGC was low, the main wear mechanism was plastic deformation, delamination, adhesive and fatigue wear. The adhesive and fatigue wear disappeared gradually with the increasing of graphite content.

Author Contributions

Conceptualization, J.L. (Jinping Liu) and J.W.; methodology, J.L. (Jinping Liu); validation, L.Z., X.X. and Y.D.; formal analysis, X.X. and J.L. (Jinming Liu); investigation, K.S.; resources, J.L. (Jinming Liu); data curation, X.X.; writing—original draft preparation, J.L. (Jinping Liu); writing—review and editing, L.Z.; visualization, J.W., C.G. and K.S.; supervision, J.L. (Jinming Liu); project administration, J.L. (Jinming Liu); funding acquisition, J.L. (Jinping Liu), L.Z. and X.X. All authors have read and agreed to the published version of the manuscript.

Funding

This work was supported by the National Natural Science Foundation of China (No. 51761013, 51561008 and 51961014), the Projects in Science and Technique Plans of Ningbo City (No.2019B10083) and the Natural Science Foundation of Jiangxi Province (No. GJJ160605).

Conflicts of Interest

The authors declare no conflict of interest.

References

  1. Zhang, P.; Zhang, L.; Wei, D.B.; Wu, P.F.; Cao, J.W.; Shijia, C.R.; Qu, X.H.; Fu, K.X. Effect of graphite type on the contact plateaus and friction properties of copper-based friction material for high-speed railway train. Wear 2019, 432, 202927. [Google Scholar]
  2. Singh, M.K.; Gautam, P.K. Mechanical and electrical behaviour of developed copper based hybrid composites. Mater. Today Proc. 2018, 5, 5692–5700. [Google Scholar]
  3. Kumar, R.A.; Kumar, K.K.; Radhika, N. Mechanical and wear properties of functionally graded Cu-11Ni-4Si/graphite composite. Silicon 2019, 11, 2613–2624. [Google Scholar]
  4. Nageswaran, G.; Natarajan, S.; Ramkumar, K.R. Synthesis, structural characterization, mechanical and wear behaviour of Cu-TiO2-Gr hybrid composite through stir casting technique. J. Alloys Compd. 2018, 768, 733–741. [Google Scholar]
  5. Mahdi, F.M.; Razooqi, R.N.; Irhayyim, S.S. The influence of graphite content and milling time on hardness, compressive strength and wear volume of copper-graphite composites prepared via powder metallurgy. Tikrit J. Eng. Sci. 2017, 24, 47–54. [Google Scholar]
  6. Zhu, Y.B.; Bai, H.; Xue, C.; Zhou, R.; Xu, Q.F.; Tao, P.F.; Wang, C.; Wang, J.W.; Jiang, N. Thermal conductivity and mechanical properties of a flake graphite/Cu composite with a silicon nanolayer on a graphite surface. RSC Adv. 2016, 6, 98190–98196. [Google Scholar]
  7. Meher, A.; Chaira, G. Effect of graphite and SiC addition into Cu and SiC particle size effect on fabrication of Cu–Graphite–SiC MMC by powder metallurgy. Trans. Indian Inst. Met. 2017, 70, 2047–2057. [Google Scholar]
  8. Liu, B.; Zhang, D.Q.; Li, X.F.; He, Z.; Guo, X.H.; Liu, Z.J.; Guo, Q.G. Effect of graphite flakes particle sizes on the microstructure and properties of graphite flakes/copper composites. J. Alloys Compd. 2018, 766, 382–390. [Google Scholar]
  9. Dixit, M.; Srivastava, R. The effect of copper granules on interfacial bonding and properties of the copper-graphite composite prepared by flake powder metallurgy. Adv. Powder Technol. 2019, 30, 3067–3078. [Google Scholar]
  10. Kumar, J.; Mondal, S. Microstructure and properties of graphite-reinforced copper matrix composites. J. Brazil. Soc. Mech. Sci. Eng. 2018, 40, 196–205. [Google Scholar]
  11. Pragatheeswaran, A.; Ravi, R.; Bakshi, S.R. Microstructural and morphological changes during ball milling of Copper-Silver-Graphite flake mixtures. Adv. Powder Technol. 2019, 30, 2759–2767. [Google Scholar]
  12. Zhao, Q.; Gan, X.; Zhou, K. Enhanced properties of carbon nanotube-graphite hybrid-reinforced Cu matrix composites via optimization of the preparation technology and interface structure. Powder Technol. 2019, 355, 408–416. [Google Scholar]
  13. Chen, J.; Ren, S.; Qu, X. Properties and microstructure of nickel-coated graphite flakes/copper composites fabricated by spark plasma sintering. Carbon 2017, 121, 25–34. [Google Scholar]
  14. Zhang, R.; He, X.; Chen, H.; Qu, X. Effect of alloying element Zr on the microstructure and properties of graphite flake/Cu composites fabricated by vacuum hot pressing. J. Alloys Compd. 2019, 770, 267–275. [Google Scholar]
  15. Kovacik, J.; Emmer, S.; Bielek, J. Thermal conductivity of Cu-graphite composites. Int. J. Ther. Sci. 2015, 90, 298–302. [Google Scholar]
  16. Araia, S.; Osaki, T.; Hirota, M.; Uejima, M. Fabrication of copper/single-walled carbon nanotube composite film with homogeneously dispersed nanotubes by electroless deposition. Mater. Today Commun. 2016, 7, 101–107. [Google Scholar]
  17. Li, J.; Zhang, L.; Zhou, K. Sliding wear behavior of copper-based composites reinforced with graphene nanosheets and graphite. Trans. Nonferrous Met. Soc. China 2015, 25, 3354–3362. [Google Scholar]
  18. Singh, G.; Pandey, P.M. Topological ordered copper graphene composite foam: Fabrication and compression properties study. Mater. Lett. 2019, 257, 126712. [Google Scholar]
  19. Mallakpour, S.; Jarahiyan, A. Utilization of ultrasonic irradiation as a green and effective strategy to prepare poly(N-vinyl-2-pyrrolidone)/modified nano-copper (II) oxide nanocomposites. Ultrason. Sonochem. 2017, 37, 128–135. [Google Scholar]
  20. Rajkumar, K.; Aravindan, S. Tribological behavior of microwave processed copper-nanographite composites. Tribol. Int. 2013, 57, 282–296. [Google Scholar]
  21. Sarmadi, H.; Kokabi, A.H.; Reihani, S.M. Seyed Reihani. Friction and wear performance of copper–graphite surface composites fabricated by friction stir processing (FSP). Wear 2013, 304, 1–12. [Google Scholar]
  22. Dash, K.; Ray, B.C.; Chaira, D. Synthesis and characterization of copper-alumina metal matrix composite by conventional and spark plasma sintering. J. Alloys Compd. 2012, 516, 78–84. [Google Scholar]
  23. Ogunbiyia, O.F.; Jamiru, T.; Sadiku, E.R.; Adesina, O.T.; Beneke, L.; Adegbola, T.A. Spark plasma sintering of nickel and nickel based alloys: A Review. Proc. Manuf. 2019, 35, 1324–1329. [Google Scholar]
  24. Chen, B.; Li, Z.; Shen, J.; Li, S.; Jia, L.; Umeda, J.; Kondoh, K.; Li, J.S.; Umeda, K.; Kondoh, J.S. Mechanical properties and strain hardening behavior of aluminum matrix composites reinforced with few-walled carbon nanotubes. J. Alloys Compd. 2020, 826, 154075. [Google Scholar]
  25. Shkodich, N.F.; Spasova, M.; Farle, M.; Kovalev, D.Y.; Nepapushev, A.A.; Kuskov, K.V.; Vergunova, Y.S.; Scheck, Y.B.; Rogachev, A.S. Structural evolution and magnetic properties of high-entropy CuCrFeTiNi alloys prepared by high-energy ball milling and spark plasma sintering. J. Alloys Compd. 2020, 816, 152611. [Google Scholar]
  26. Ghayebloo, M.; Alizadeh, P.; Melo, R.M. Fabrication of ZrO2-Bearing lithium-silicate glass-ceramics by pressureless sintering and spark plasma sintering. J. Mech. Behav. Biomed. Mater. 2020, 105, 103709. [Google Scholar]
  27. Zhang, L.; Zhang, Y.Q.; Jiang, Y.H.; Zhou, R. Mechanical behaviors of porous Ti with high porosity and large pore size prepared by one-step spark plasma sintering technique. Vacuum 2015, 122, 187–194. [Google Scholar]
  28. Moustafa, S.F.; EI-Badry, S.A.; Sanad, A.M.; Kieback, B. Friction and wear of copper-graphite composites made with Cu-coated and uncoated graphite powders. Wear 2002, 253, 699–710. [Google Scholar]
  29. Zou, H.H.; Ran, X.; Zhu, W.W.; Wang, Y.; Zhan, S.Q.; Hao, Z.K. Tribological behavior of copper–graphite composites reinforced with Cu-coated or uncoated SiO2 particles. Materials 2018, 11, 2414. [Google Scholar]
  30. Kovacik, J.; Bielekt, J. Electrical conductivity of Cu/Graphite composite material as a funtion of structural characteristics. Scr. Matm. 1996, 35, 151–156. [Google Scholar]
  31. Kirkpatrick, S. Percolation ancl Conduction. Rev. Mod. Phys. 1973, 45, 574–598. [Google Scholar]
  32. Mazloum, A.; Kovacik, J.; Zagrai, A.; Sevostianov, I. Copper-graphite composite: Shear modulus, electrical resistivity, and cross-property connections. Int. J. Eng. Sci. 2020, 149, 103232. [Google Scholar]
  33. Ayyappadas, C.; Muthuchamy, A.; Raja Annamalai, A.; Agrawal, D.K. An investigation on the effect of sintering mode on various properties of copper-graphene metal matrix composite. Adv. Powder Technol. 2017, 28, 1760–1768. [Google Scholar]
  34. Nayak, D.; Debata, M. Effect of composition and milling time on mechanical and wear performance of copper-graphite composites processed by powder metallurgy route. Powder Metal. 2014, 57, 265–273. [Google Scholar]
  35. Mahdi, F.M.; Razooqi, R.N.; Irhayyim, S.S. Effcet of graphite content and milling time on physical properties of copper-graphite composites prepared by powder metallurgy route. Aust. J. Basic Appl. Sci. 2013, 7, 245–255. [Google Scholar]
  36. Blau, P.J.; Yust, C.S. Microfriction studies of model self-lubricating surfaces. Surf. Coat. Technol. 1993, 62, 380–387. [Google Scholar]
Figure 1. SEM images of the CGC powder with different graphite content after ball milling: (a) 1.0 wt.% (b) 1.5 wt.% (c) 2.0 wt.% (d) 2.5 wt.% (e) 2.5 wt.% (high magnification) (f) Average size of CGC powders with different graphite content.
Metals 10 01506 g001
Figure 2. XRD pattern of raw Cu powder and milled CGC powders with different graphite content.
Metals 10 01506 g002
Figure 3. SEM-BSE images of CGC for different graphite contents: (a) 1.0 wt.%, (b) 1.5 wt.%, (c) 2.0 wt.%, (d) 2.5 wt.%.
Metals 10 01506 g003
Figure 4. The images of CGC with graphite contents 2.5 wt.% (a) SEM, (b) EDS.
Metals 10 01506 g004
Figure 5. OM images of the CGCs containing different graphite content: (a) 1.0 wt.%; (b) 1.5 wt.%; (c) 2.0 wt.%; (d) 2.5 wt.%.
Metals 10 01506 g005
Figure 6. Variation of the electrical conductivity of CGC with different graphite content.
Metals 10 01506 g006
Figure 7. The variation in micro-hardness of CGC with different graphite content.
Metals 10 01506 g007
Figure 8. Average friction coefficient and wear rate of CGC with different graphite content.
Metals 10 01506 g008
Figure 9. The worn morphologies of CGC with different graphite content: (a) 1.0 wt.% (b)1.5 wt.% (c) 2.0 wt.% (d) 2.5 wt.%.
Metals 10 01506 g009
Table 1. The variation in relative density of CGC with different graphite content.
Graphite ContentRelative DensityGraphite ContentRelative DensityGraphite ContentRelative DensityGraphite ContentRelative Density
1.0%98.78%5%88.59%8%89%3.0%93.50%
1.5%98.36%10%86.38%15%88%
2.0%97.82%15%81.10%20%86%
2.5%96.56%
SPS/750 °CCS */1000 °CCS/900 °CVS */900 °C
This work[9][28][29]
* CS—Conventional sintering (data from [9,28]), VS—Vacuum-hot-press sintering (data from [29]).
Publisher’s Note: MDPI stays neutral with regard to jurisdictional claims in published maps and institutional affiliations.

