Article

An Analytical Model for Predicting the Stress Intensity Factor of Single-Hole-Edge Crack in Diffusion Bonding Laminates with Preset Unbonded Area

1
College of Transportation Engineering, Dalian Maritime University, Dalian 116026, China
2
State Key Laboratory of Structural Analysis for Industrial Equipment, Department of Engineering Mechanics, Dalian University of Technology, Dalian 116024, China
*
Author to whom correspondence should be addressed.
Metals 2020, 10(11), 1526; https://doi.org/10.3390/met10111526
Submission received: 5 October 2020 / Revised: 12 November 2020 / Accepted: 14 November 2020 / Published: 17 November 2020
(This article belongs to the Special Issue Fatigue Life Prediction of Metallic Materials)

Abstract

:
The diffusion bonding titanium alloy laminates with preset unbonded area (DBTALPUA) compared with other titanium alloy structural forms has good damage tolerance performance and designability. It is important to fast get the damage estimation of the DBTALPUA with crack. The stress intensity factor (SIF) of the crack is an effective indicator to give the damage estimation. In order to get the SIF fast, this paper proposed an analytical model to calculate SIF for single hole-edge crack in DBTALPUA with hole under tension loading. Comparison of the results obtained through this analytical model and numerical simulation illustrated that the analytical model can rapidly predict the SIF with fine precision.

1. Introduction

Titanium alloys are widely used in aeronautical structures for its prominently high specific strength, excellent corrosion resistance, and high temperature properties [1,2,3,4]. For example, titanium alloy members, such as load-carrying parts or mechanical joints account for 20% in F35 fighter and up to 40% in F22 fighter [5]. Although exhibiting excellent properties, titanium alloys are susceptible to initiated cracks, i.e., its residual crack growth life is very short after a crack occurs, which has low damage tolerance performance [5,6,7,8].
Diffusion bonding (DB) is a solid-state bonding technique without the presence of a liquid phase, which is commonly used process in machining titanium alloys [9,10,11,12]. Titanium alloy laminates are manufactured by diffusion bonding of several thin titanium sheets under specific time, applied pressure, and bonding temperature. That enables one to take the thickness and the number of layers of a diffusion-bonded plate as design parameters, which is more flexible to suit different structural demand. The laminates have almost the same tensile strength as parent metal under in-plane loading.
Based on the above characteristics, Wang [13] proposed a type of structure to improve damage tolerance of titanium alloy base on the diffusion bonding laminates. They set the solder mask on the sheets at specific location before the diffusion bonding process. Because of the solder mask, the formed diffusion bonding titanium alloy laminates contain the areas unbonded in the laminate interfaces. The research showed that the laminates with the unbonded areas have little decline in static strength under in-plane loading [14], and the fatigue crack growth life is much longer than that without the unbonded areas. So, a series of studies were constructed on the diffusion bonding titanium alloy laminates with preset unbonded area (DBTALPUA) [15,16,17,18,19,20]. For instance, Reference [15] built the numerical analysis model for the fatigue failure process of the DBTALPUAs, and obtained the unbonded area effect law to the crack growth life of the laminates in parameter analysis. Reference [16] obtained the process of the fatigue failure of the unbonded laminates with surface crack in experiment. The result shows that unbonded area can change the crack growth path of the surface crack, and prolong the crack growth life of the laminates. Reference [17] analyzed the joint part made of the DBTALPUAs in numerical method, and the result showed that the damage tolerance of the joint had significant improvement.
At present, the research methods on the DBTALPUAs are mainly based on experiment and numerical methods. Although analytical research is also important, the research based on analytical method is less.
In this paper, we proposed an analytical model to analyze the DBTALPUA. First, we did an experiment for DBTALPUA to get the fatigue failure process. Then, according to the fatigue failure process and existing formula for 3-D crack [21], we proposed the analytical model to calculate the SIF distribution for single hole-edge crack in DBTALPUA with hole under tension loading. For verifying the effectiveness of the formula, the numerical model was built. Through the comparison between the analytical results and numerical results, the effectiveness and errors were given. The results show that the analytical model can rapidly give the SIF distribution with fine precision. It is a good foundation for the fast damage estimation of the DBTALPUA with crack and also a foundation for further design or optimization of the DBTALPUA.

2. Experiment

2.1. Specimen

The material used for this study is titanium alloy Ti-6AL-4V, a well-established alpha-beta general-purpose alloy. The composition of the titanium alloy is shown in Table 1.
The preparation of DBTALPUA mainly contains following steps.
  • The Ti-6Al-4V titanium alloy sheets were chosen to make the specimen. In this paper, the sheet thickness is 2 mm. So, each sublaminate of the specimen has a thickness ts = 2 mm.
  • The unbonded areas were located at diffusion bonding interface in the specimen. So, we arranged solder mask on the sheet follow the design of the specimen before diffusion bonding process for producing the unbonded areas at the interfaces.
  • Four Ti-6Al-4V titanium alloy sheets were utilized to manufacture a titanium alloy laminate using diffusion bonding technology at 900 °C/1.5 MPa/1.5 h. The laminates had a thickness t = 8 mm.
  • The laminates were cut into specimens following the design. Moreover, a through thickness hole was drilled at its center for each specimen. The specimen was subjected to a tension–tension cyclic loading, which is a typical load for a bolt joint.
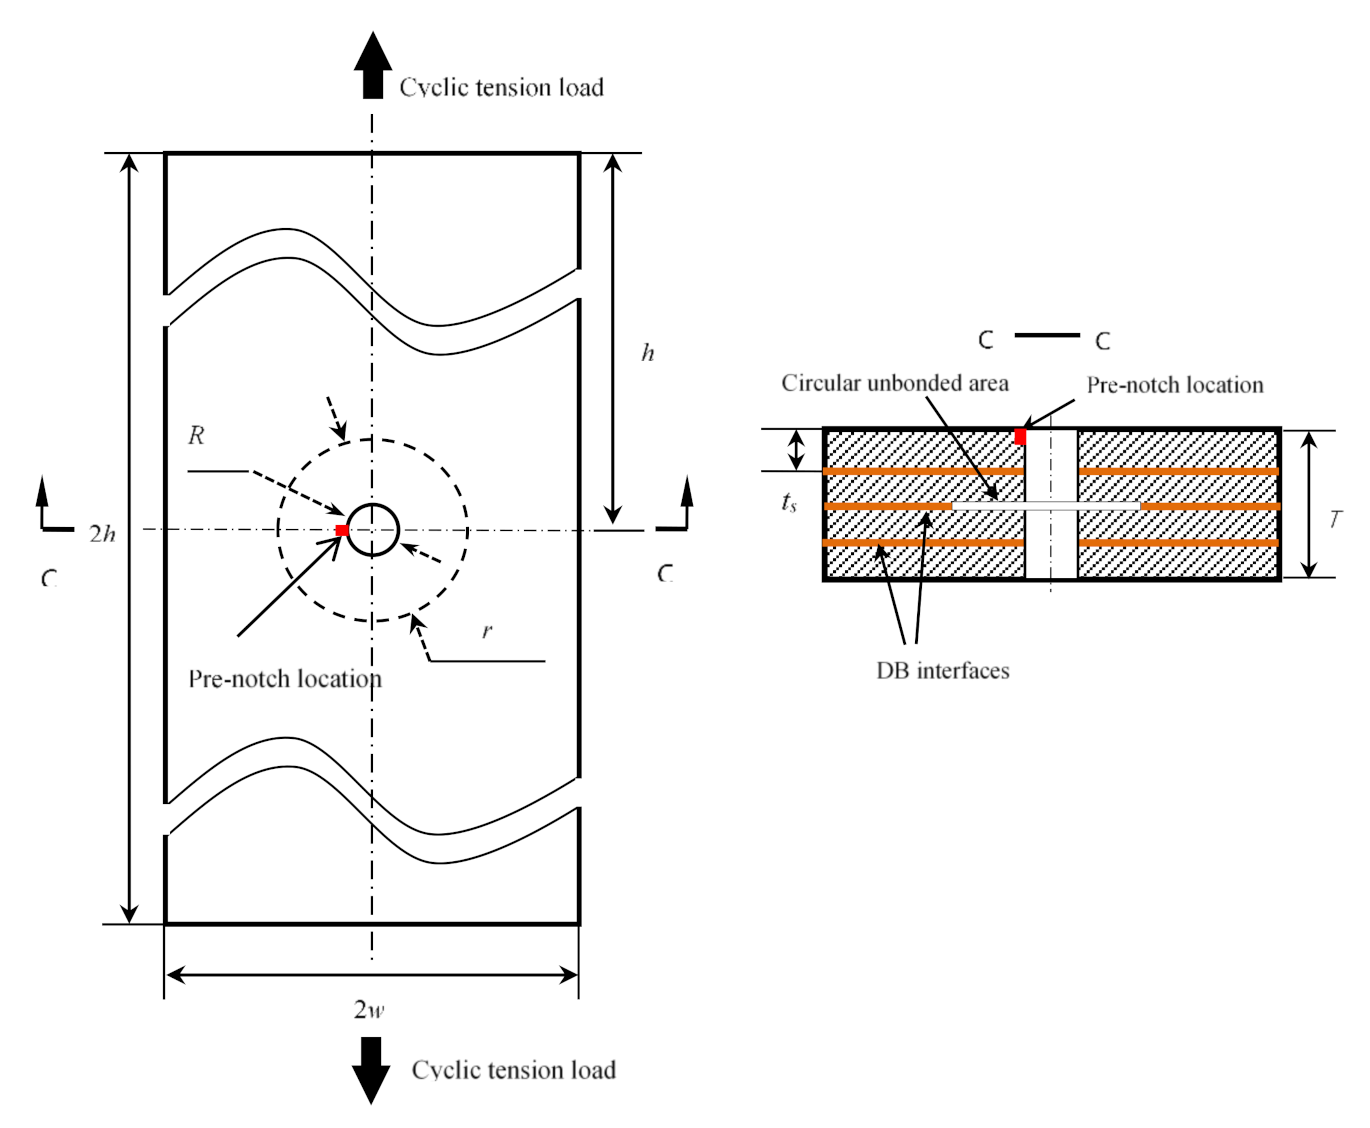
  • This study focusses on the fatigue crack growth process, so we made the notch at the single hole edge using electrodischarge machining (EDM), shown in Figure 1.
The specimen has a length 2h = 180 mm, width 2w = 40 mm, and thickness t = 8 mm. The radius of the hole R = 3 mm, and the radius of the circular unbonded area r = 15 mm. The sketch map of specimen is shown in Figure 2.

2.2. Test Conditions and Procedures

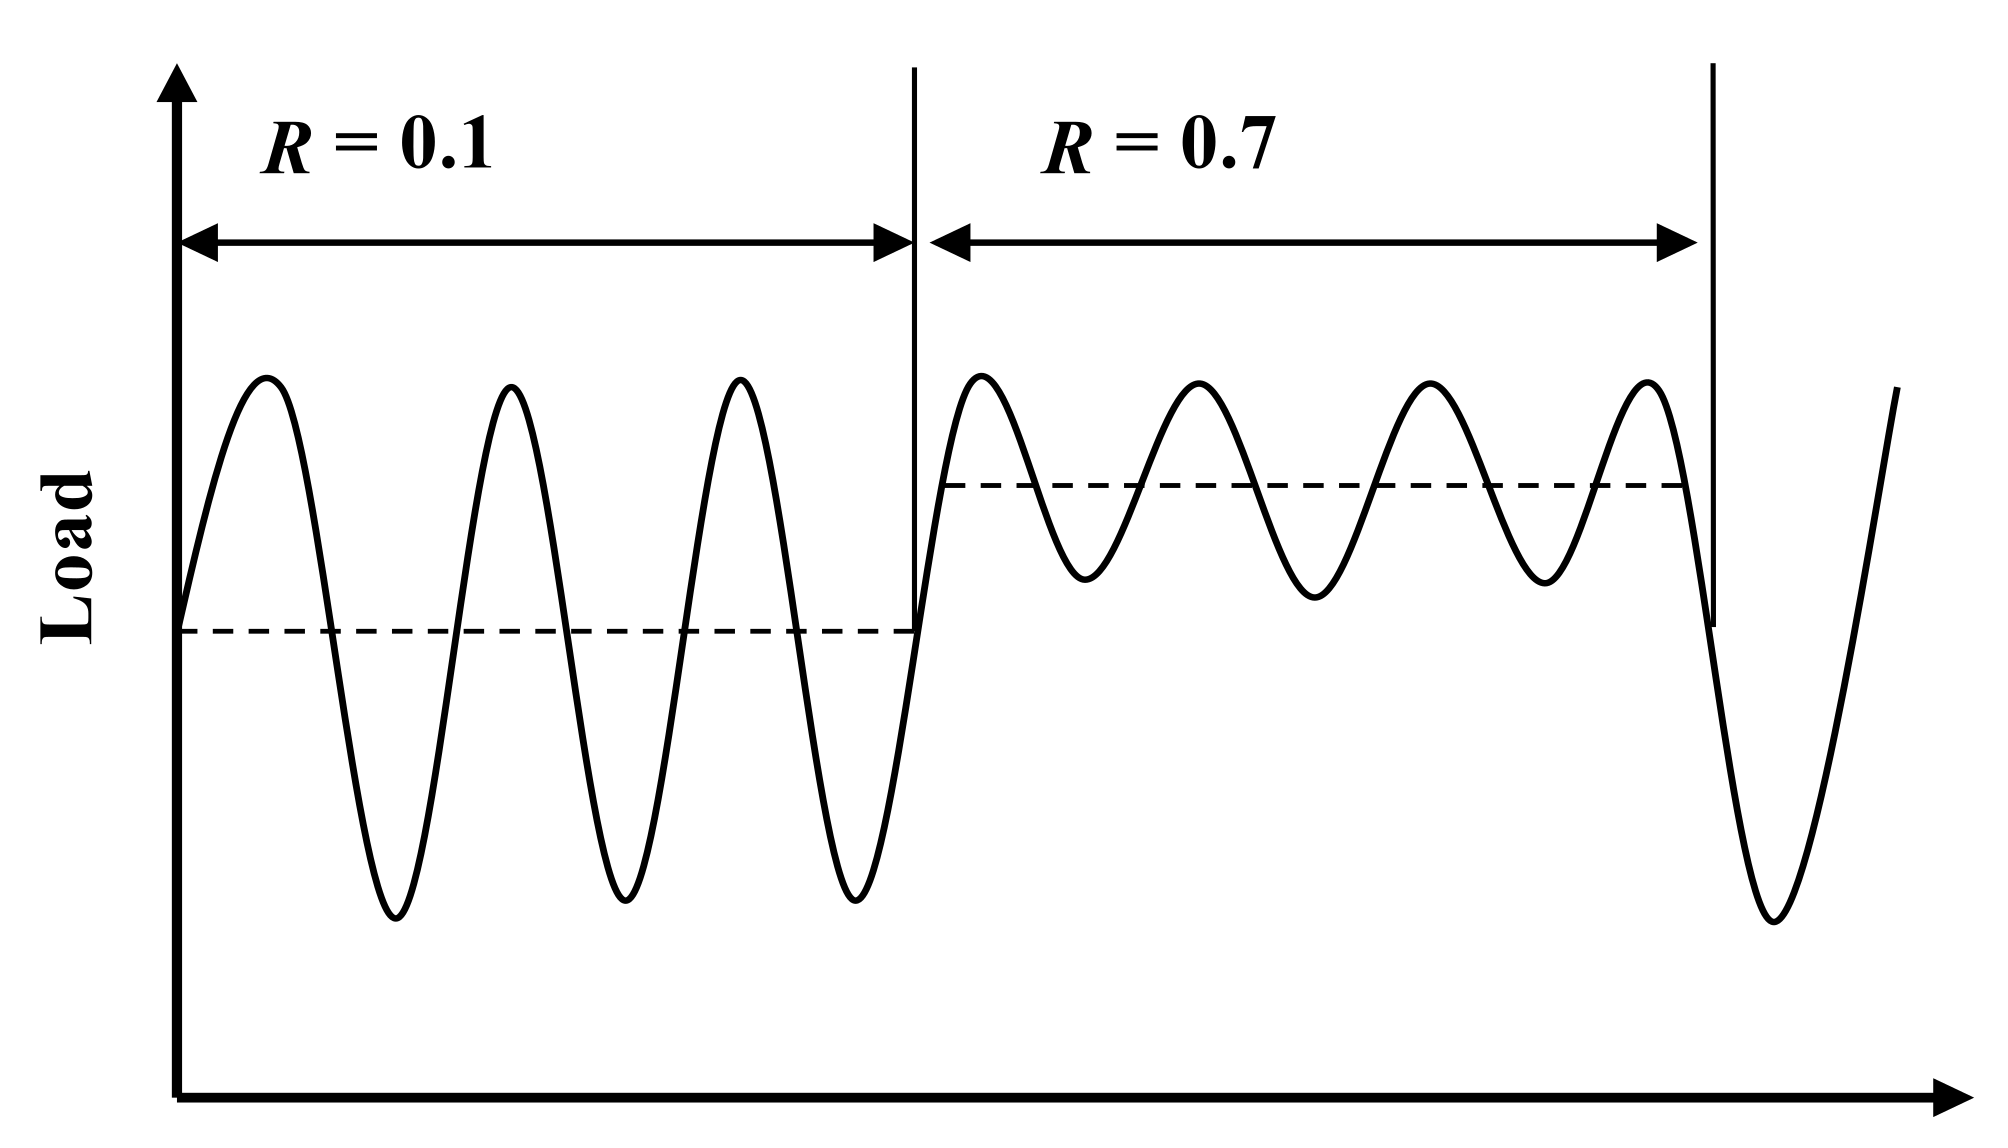
The test was carried out at room temperature, and the test machine was MTS-810 fatigue test machine (Mechanical Testing & Simulation, America). The working condition was tensile–tensile fatigue with the stress ratio R = 0.1, and the peak stress of the tension load was 230 MPa.
This study focuses on the crack growth process in the laminates. So, before the formal loading, the precrack was made by tensile–tensile cyclic loading. Because the notch was located at the hole edge, which is the stress concentration zone in the specimen, the precrack load was the same as formal cyclic loading. The digital microscope was employed to observe the notch root location until the precrack growth was 1 mm.
Since the unbonded area was set inside the specimen, the effect of the unbonded area on fatigue crack cannot be obtained by directly observing the crack propagation on the specimen surface. Therefore, benchmarking method was used here. During the test, two kinds of stress ratios (R = 0.1 with frequency of 8 Hz and R = 0.7 with frequency of 20 Hz) were used to alternately load the specimen until the specimen fracture. TestStarIIs control system was employed to program the load spectrum. It is shown in Figure 3. The loading part R = 0.1 was the formal loading load. Sinusoidal wave loading was adopted for loading. The maximum tensile load of the tension–tension cycle load was 73.6 kN, corresponding to the average peak stress of 230 MPa in the specimen.
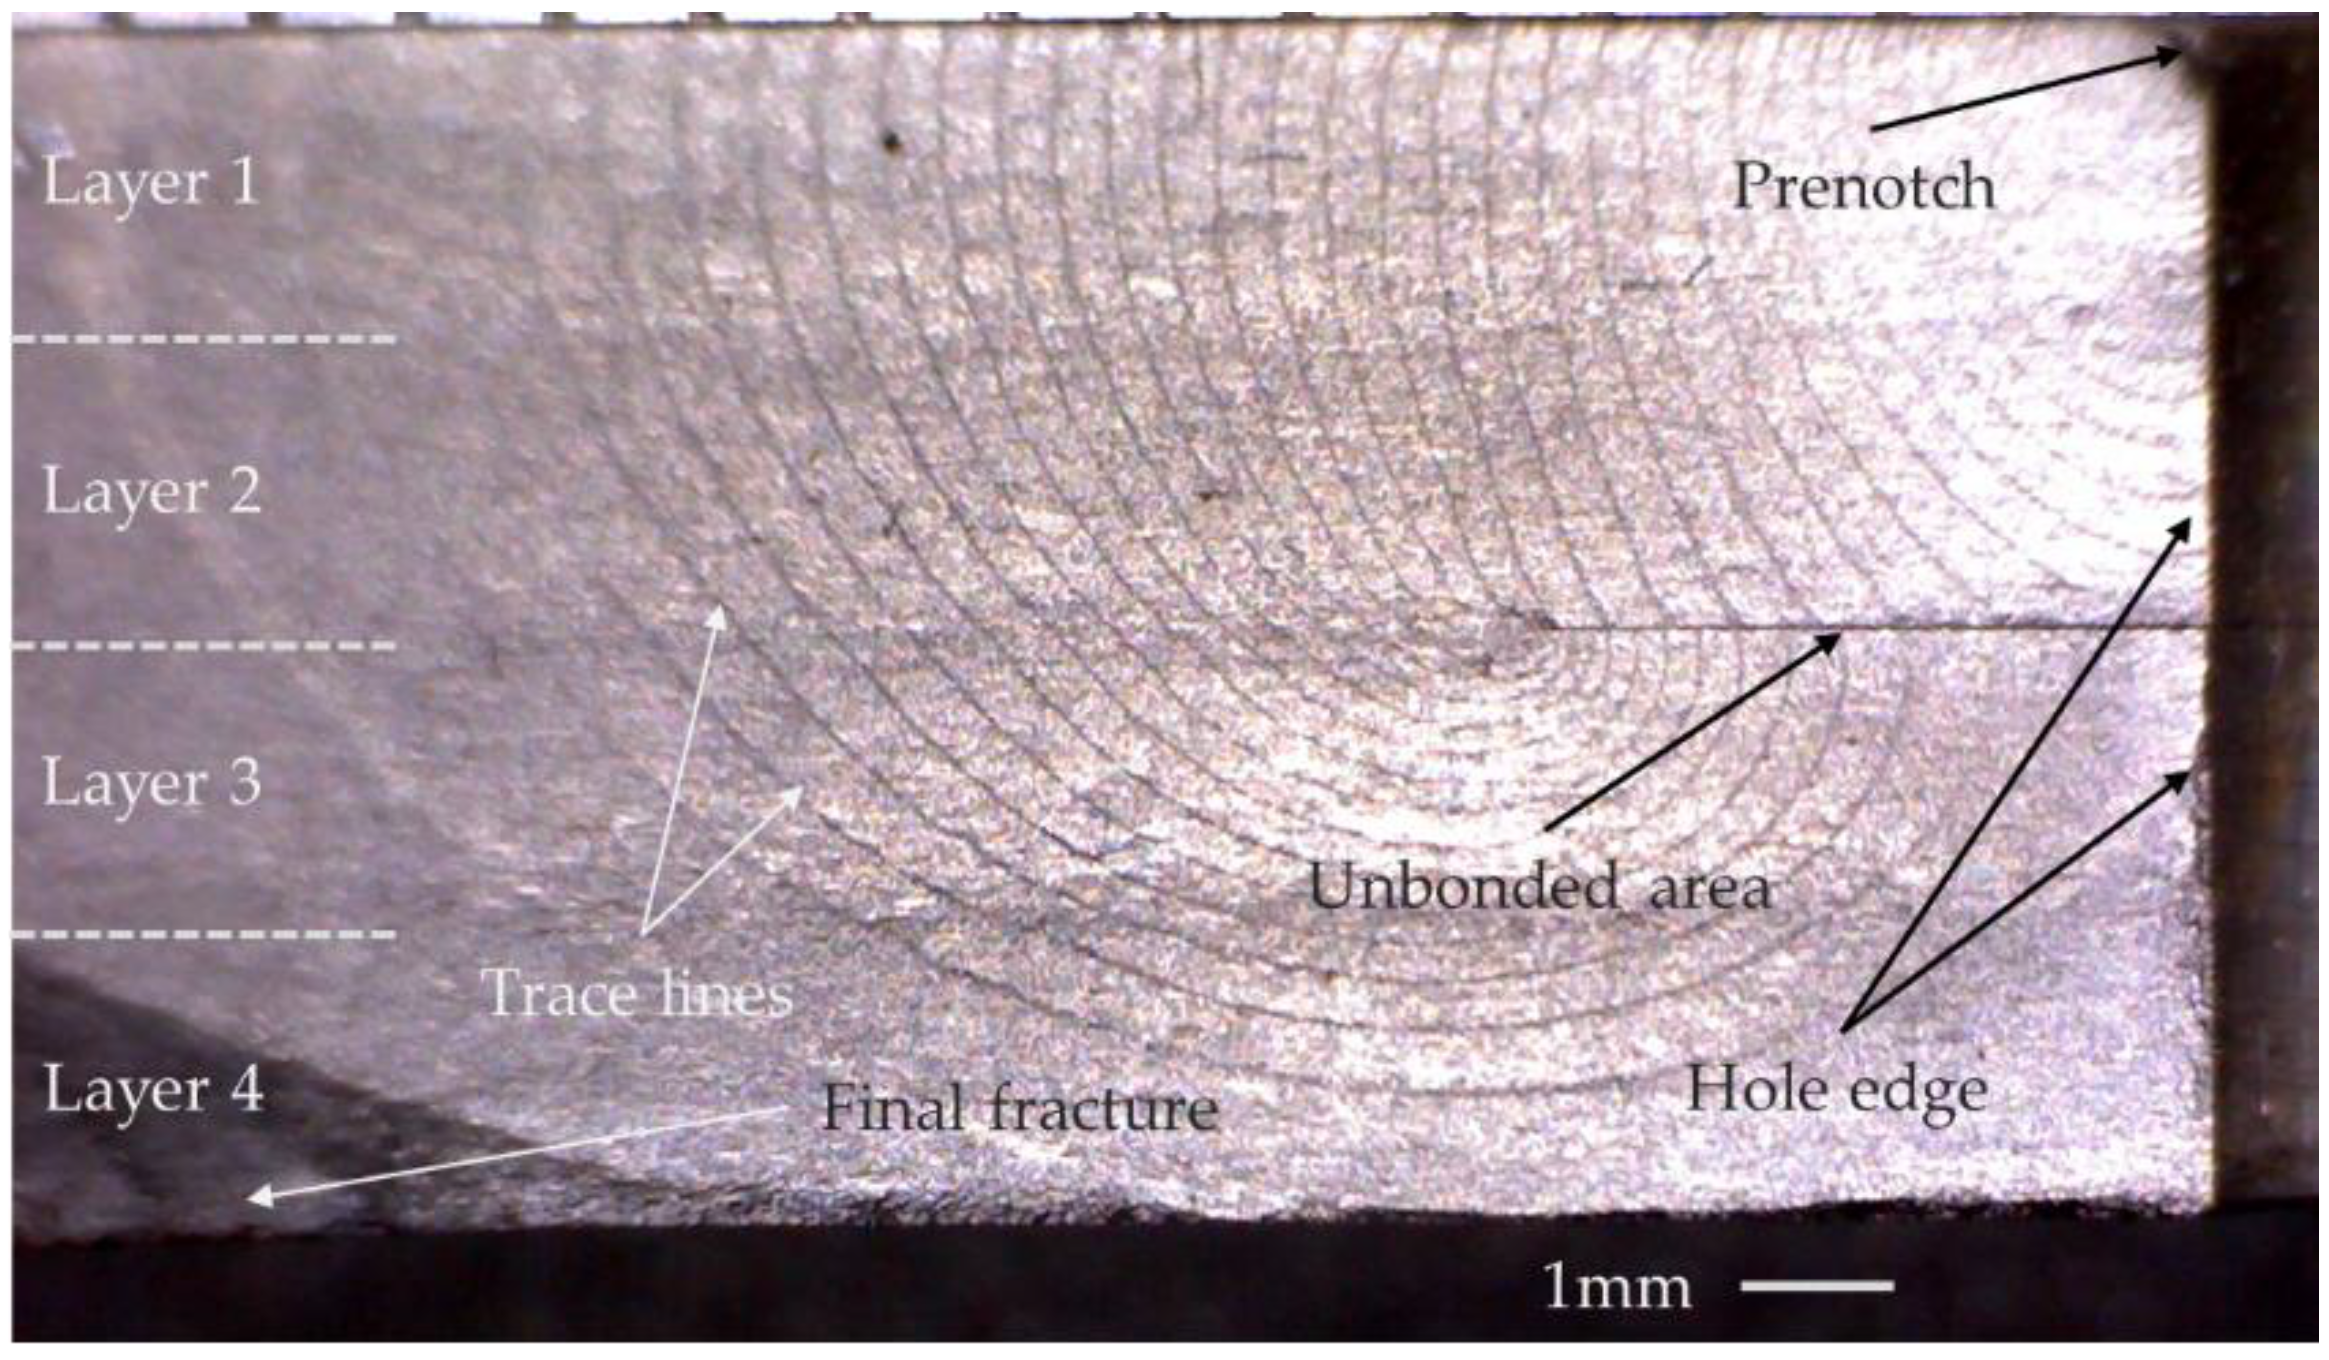
Figure 4 shows the fracture surface of the specimen. The specimen went through 243,698 cycles from the initial loading to the fracture, and 60 complete loading cycles, with each loading cycle going through 4000 cycles. The stress ratio R = 0.1 was used to load 1000 times, and the stress ratio R = 0.7 was used to load 3000 times. As can be seen from the figure, due to the slow fatigue crack growth rate in the initial stage, the lines are very dense and difficult to be identified, and this area is far from the unbonded area location. Therefore, we analyzed the trace lines starting from the surface crack length equal 1 mm.

3. The Stress Intensity Factor (SIF) Formula

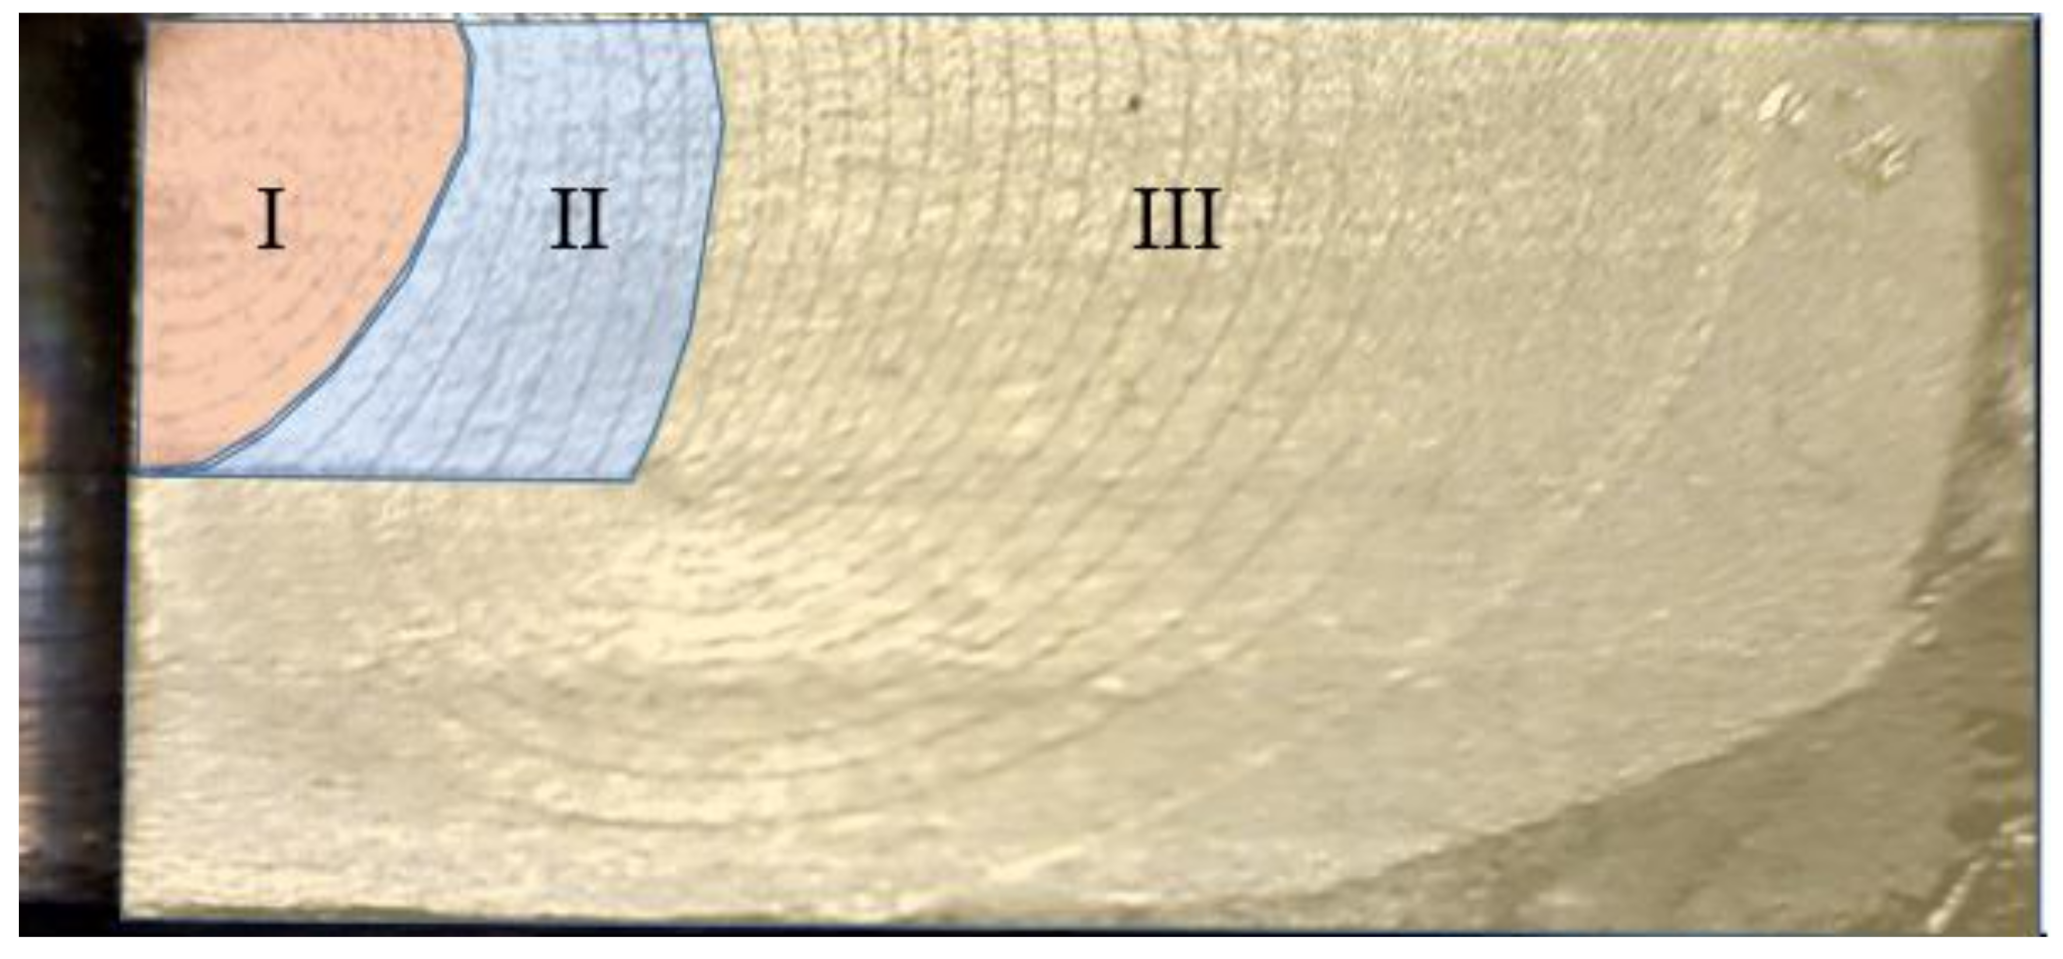
Previous research has shown that the DBTALPUA have excellent damage tolerance performance under tension–tension loading, and in this condition, the single hole-edge crack is the main failure reason. So in this paper, we built the formula of the SIF distribution for the single hole-edge crack in DBTALPUA under tension loading. The trace lines on the fracture surface of the specimen showed the crack growth process. Although the whole growth process is complicated, the process can be divided into three stages to analyze as shown in Figure 5.
The crack from hole-edge grew to the unbonded area can be defined as the first stage. In this stage, the crack has not grown to the unbonded area, and the unbonded area has little effect on the crack growth. The crack growth process in this stage is similar with the single hole-edge crack growth in the intact plate. So, the formula of the SIF in first stage can use the formula of single hole-edge crack in an open hole plate as shown in reference. The crack growth from the end of the first stage to the boundary of the unbonded area can be defined as the second stage. In the second stage, the crack penetrated the upper layer of the laminates and grew along the unbonded area. In this stage, the crack became a penetrated crack, so the crack could be simplified as a two-dimensional crack. In addition, the formula of the SIF in this stage can use the formula that two-dimensional single hole-edge crack as shown in reference. The third stage was defined from the end of the second stage to complete failure of the specimen. At this stage, the crack growth process was relatively complicated, and we gave the formula of this stage based on the formula of the surface crack shown in reference.
Based on the above analysis, the formula of the SIF for the single hole-edge crack in DBTALPUA was given as follows in the form of piecewise functions.
K = K   a t < t 1 K   a t = t 1   a n d   a w < r R K   a t > t 1 .
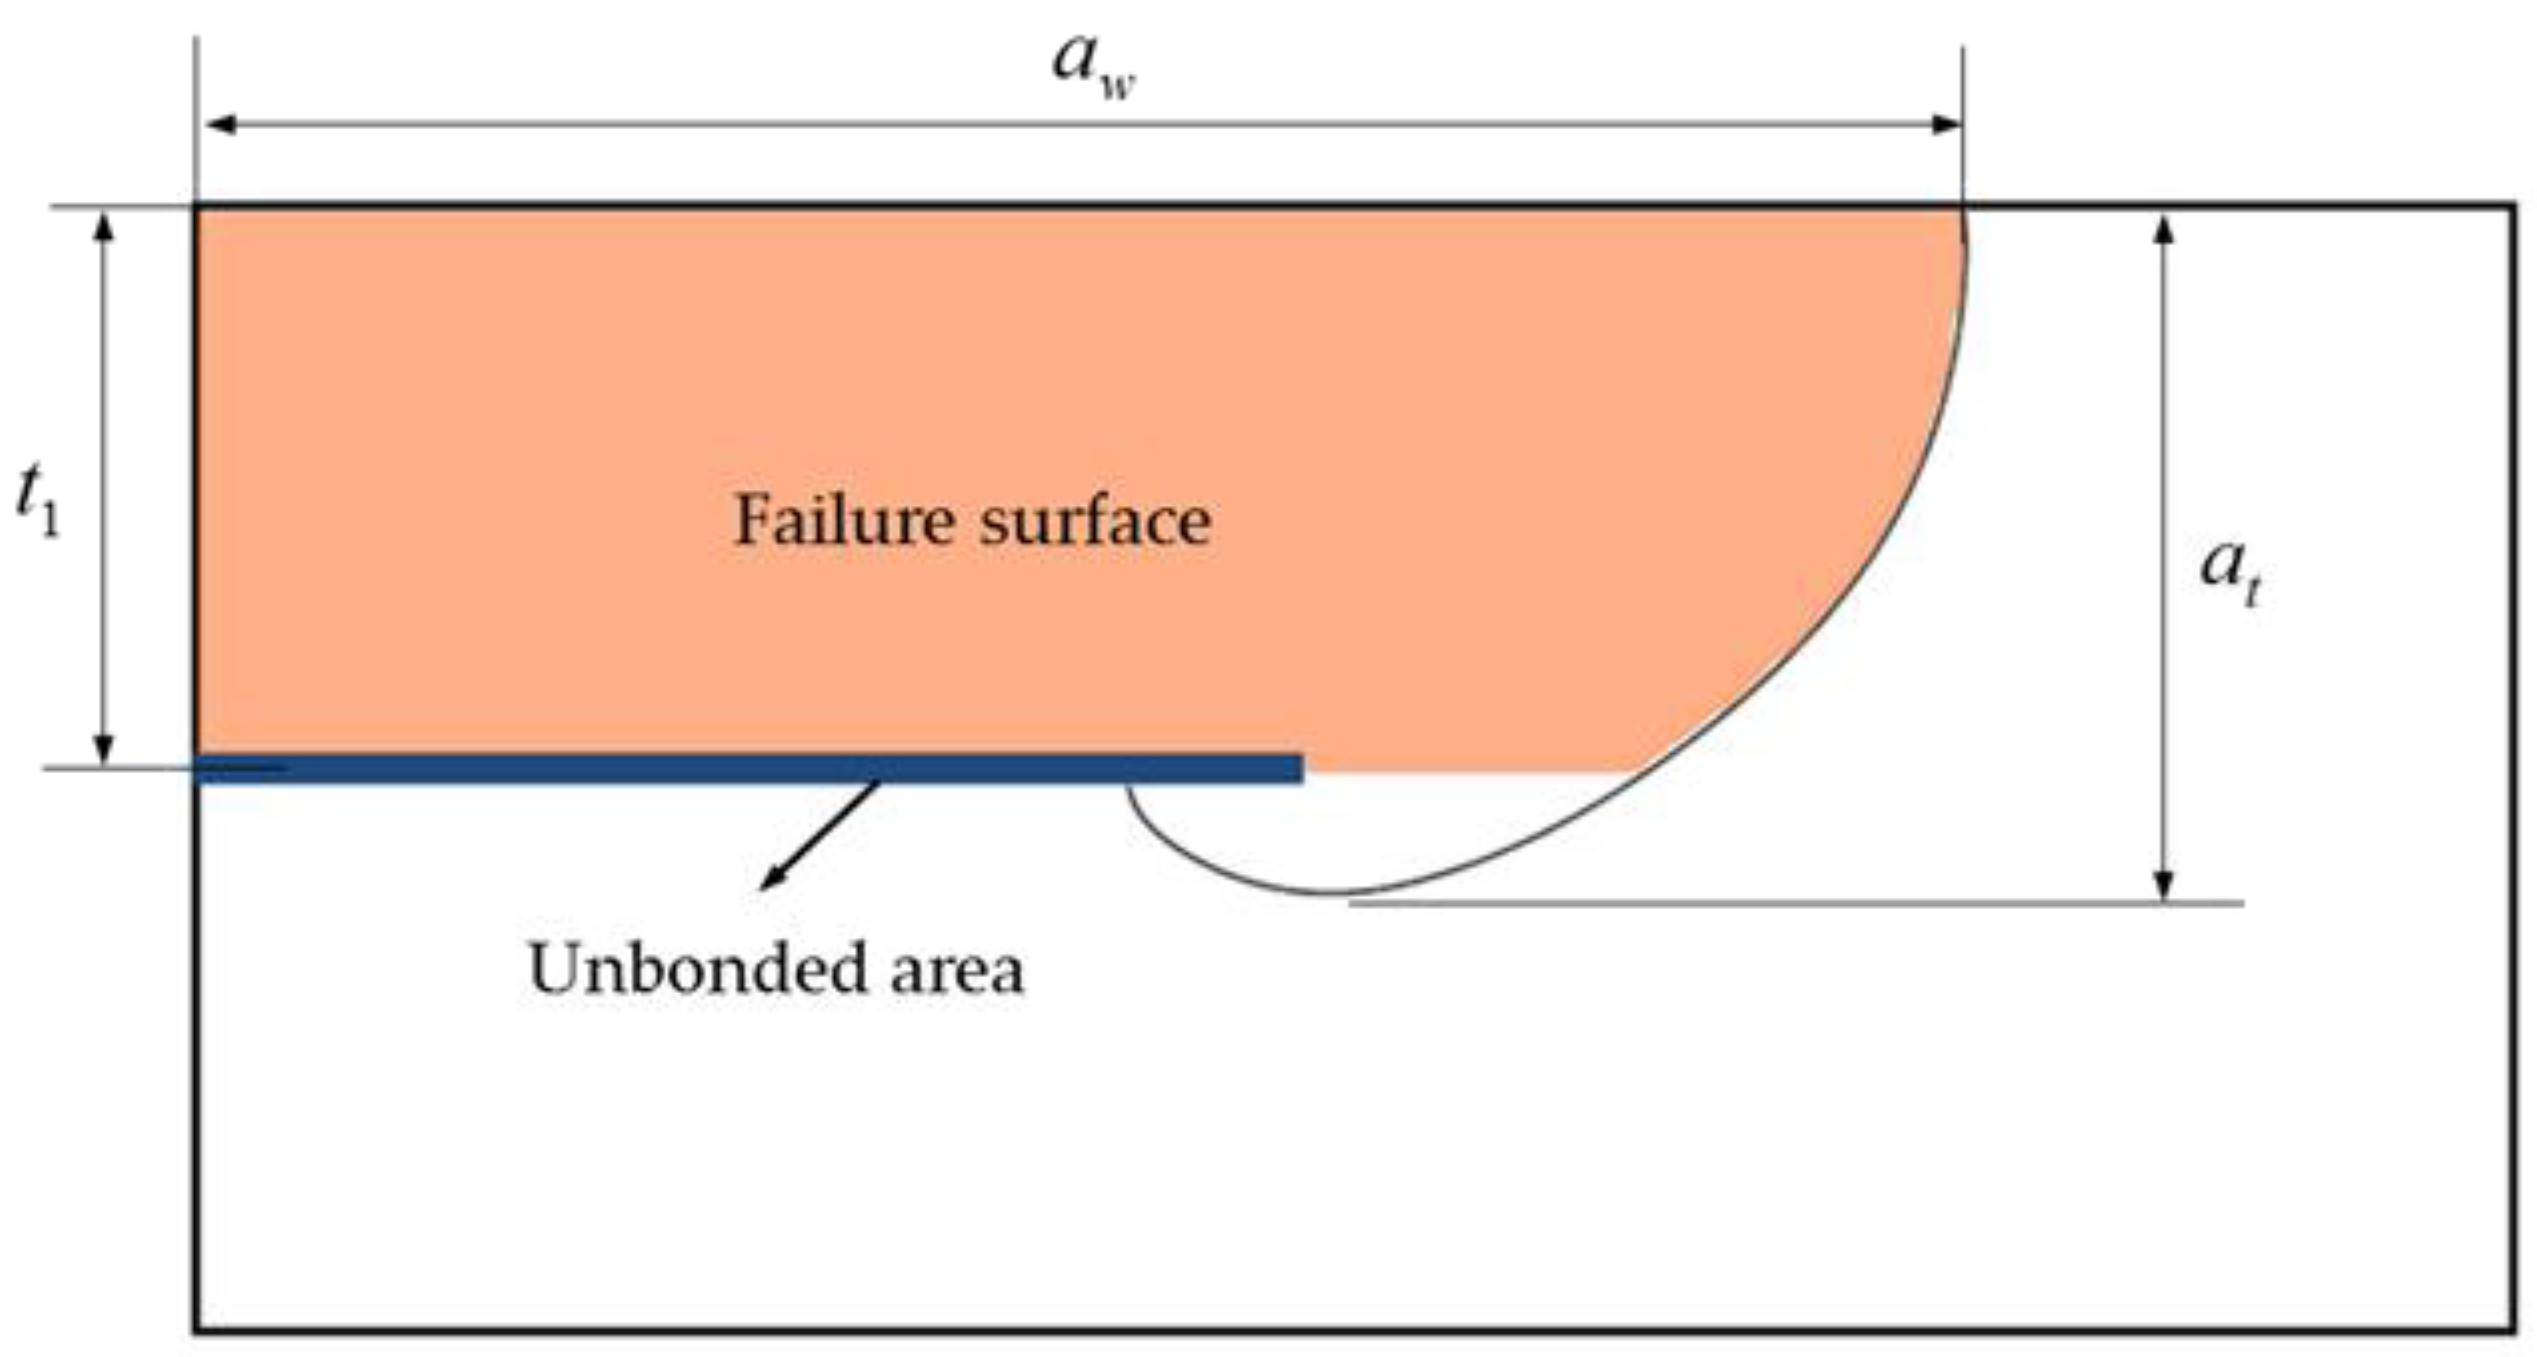
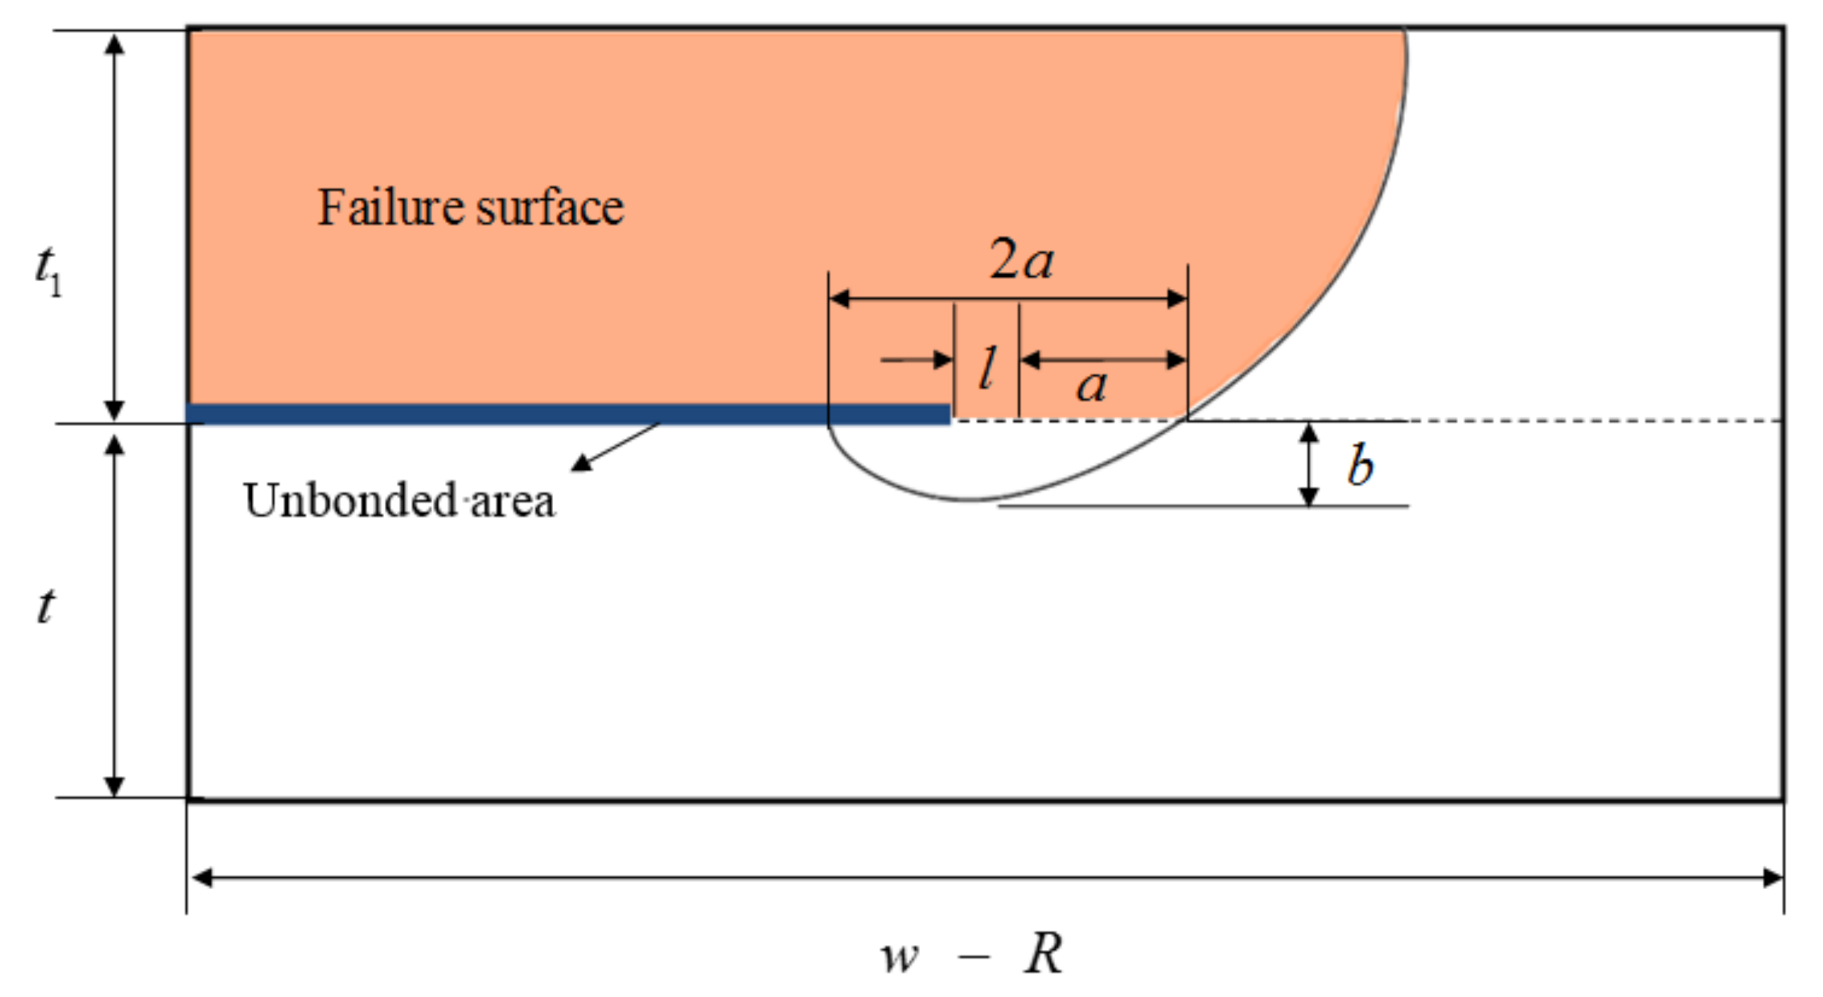
Figure 6 gives the parameters to the piecewise functions. The parameter aw represented the distance from the hole edge to the point located on the specimen’s upper surface of crack front curve. The parameter at represented the vertical distance from the specimen’s upper surface to the lowest point of the crack front curve. The parameter t1 is the thickness of the upper layer, which is the distance of the upper surface to the unbonded area. The parameter r is the radius of the circular unbonded area. The parameter R is the radius of the open hole in the laminates.

3.1. The Expression of K

Based on the above analysis, in the first state, the unbonded area has little effect on the crack growth process. Reference [21] gave the formulas to calculate the SIF of the single hole-edge crack in the intact plate. Here, K used the formulas in Reference [21]. The expression of K is shown in Formula (2).
K = 4 π + b a 2 t R 4 π + b a t R 1 / 2 K I , d f w s .
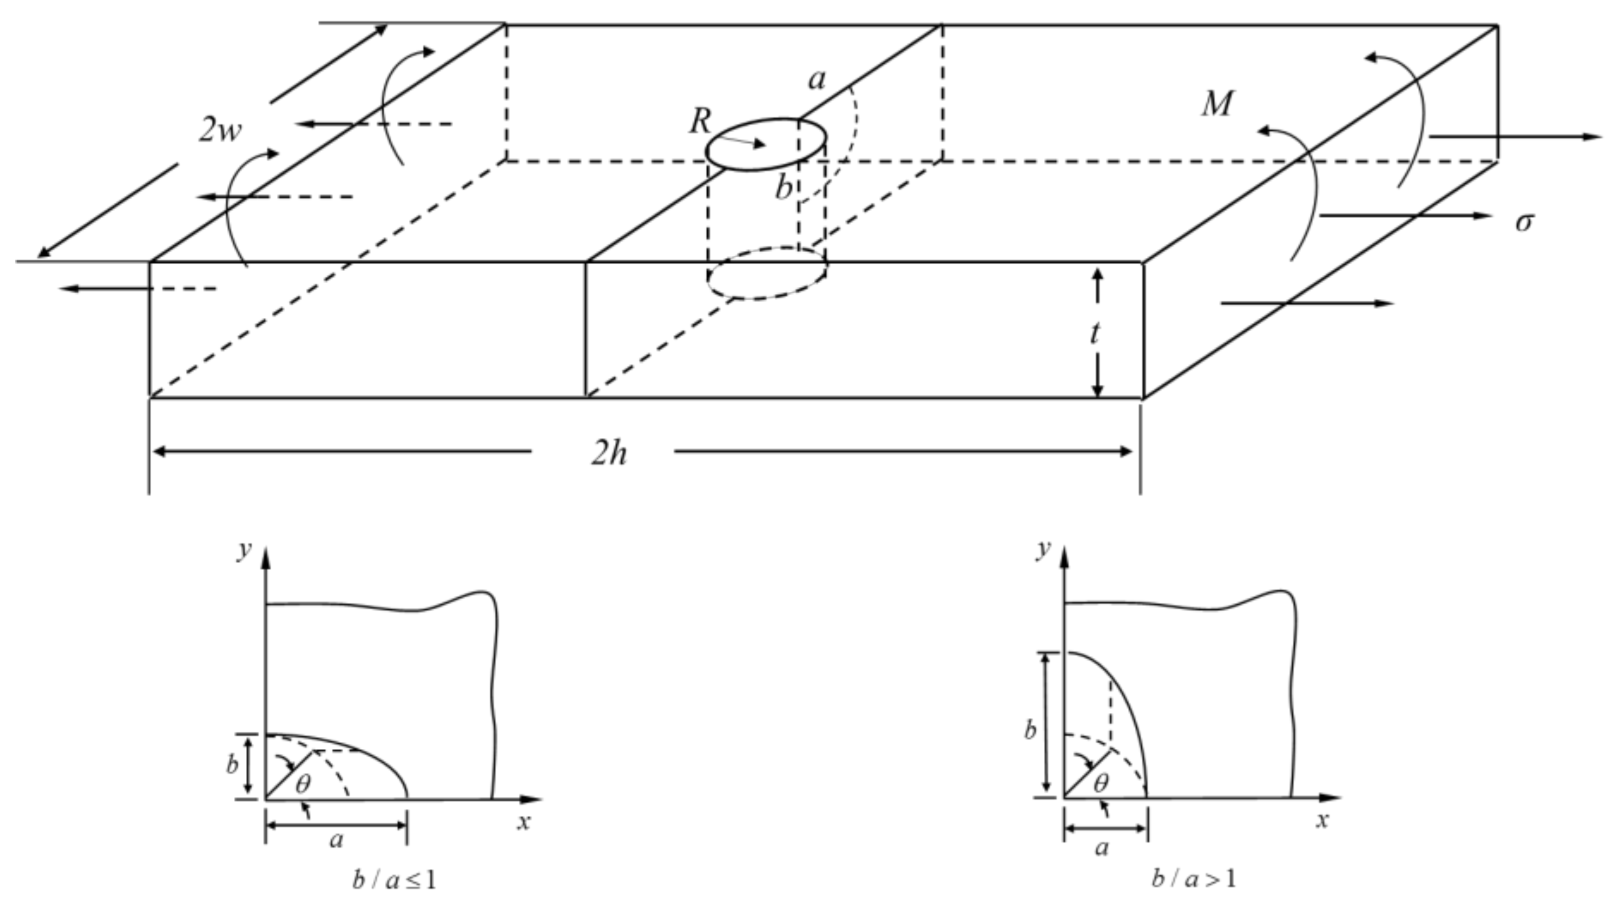
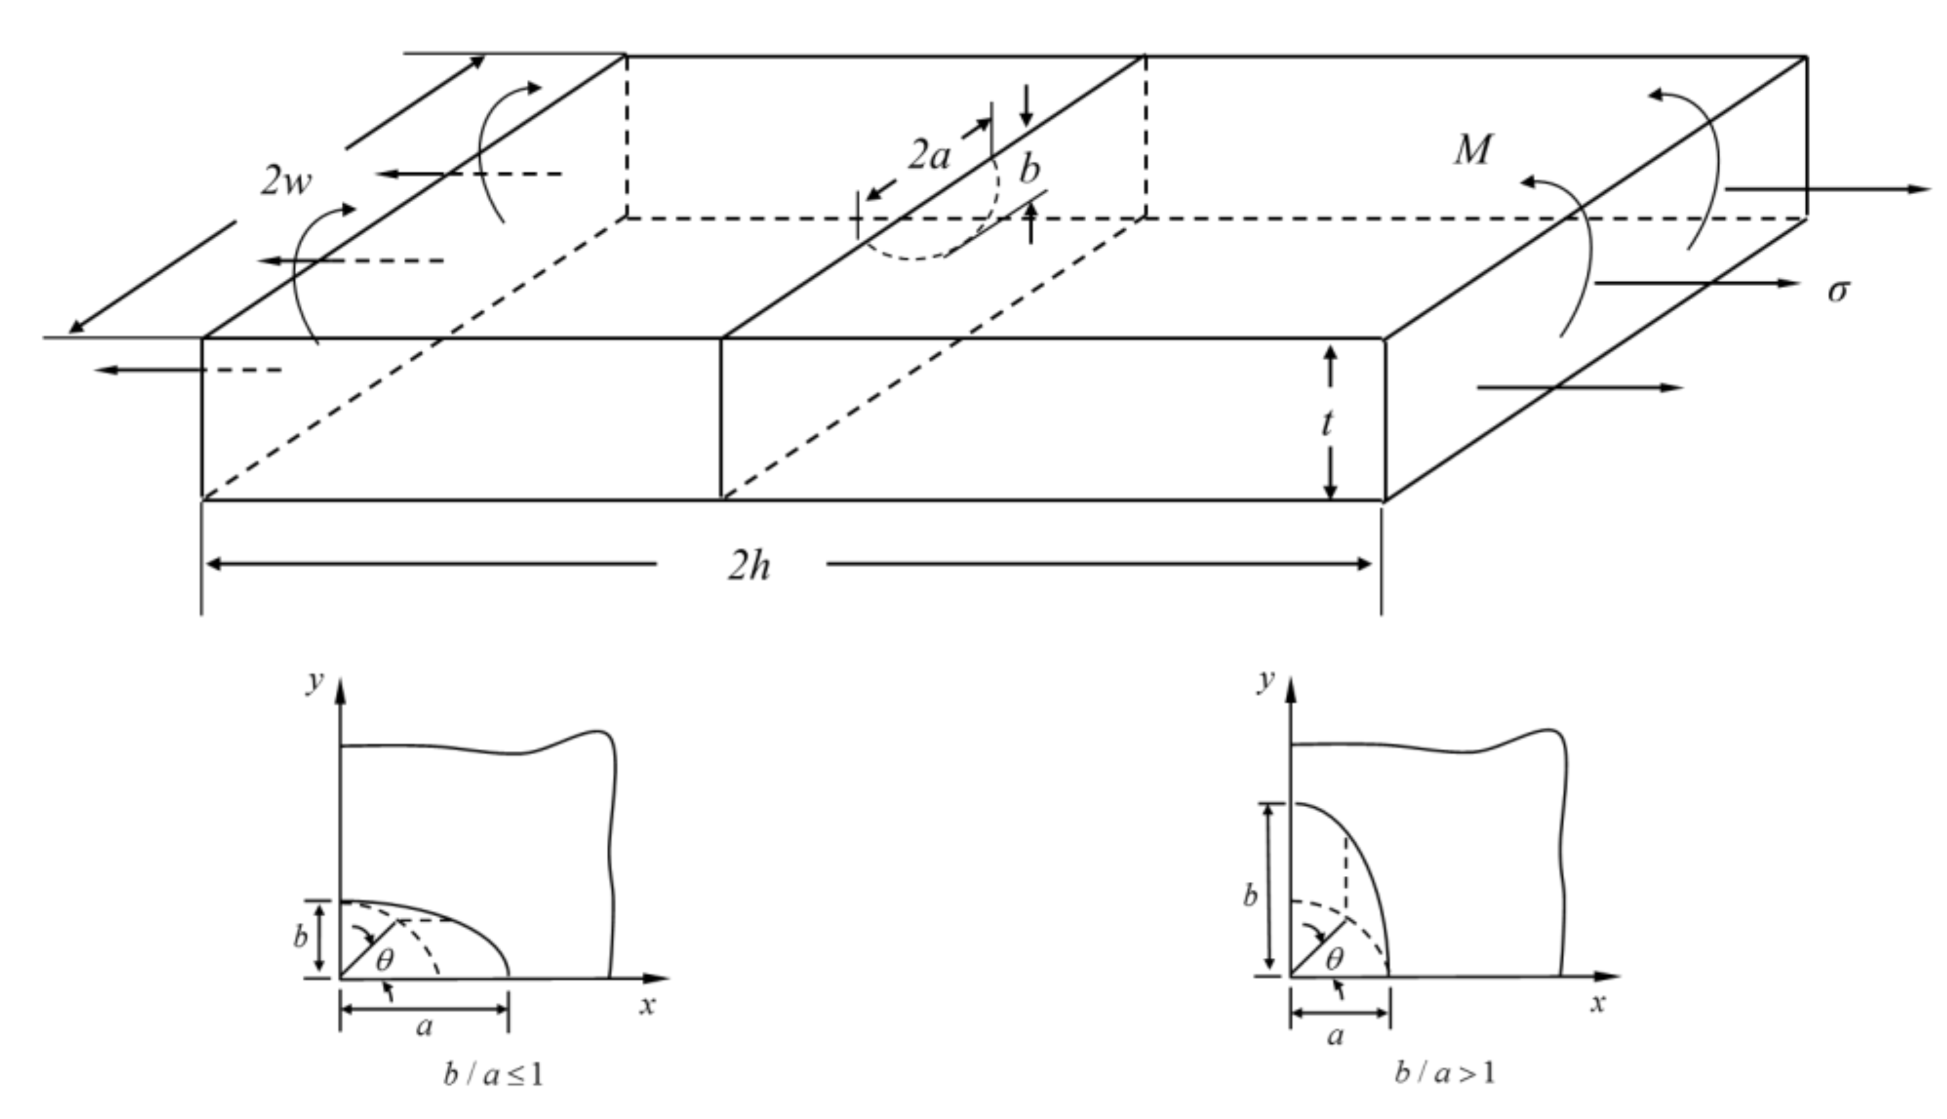
The geometry parameters in Formula (2) are shown in Figure 7. The parameter a is the length of the crack appearance on the surface. The parameter b is vertical distance from the surface to the lowest point of the crack front curve. The parameter t is the total thickness of the plate. The parameter R is the radius of the open hole. The parameter K I , d is the SIF of double hole-edge crack in the intact plate. The parameter f w s is a correction factor for the width of the plate, and the expression is shown in Formula (3).
f w s = sec π R 2 w sec π ( 2 R + a ) 4 ( w a ) + 2 a b t 1 / 2 .
In Formula (3), the parameter 2w is the width of the plate. The expression of K I , d is shown in Formula (4) as follows.
K I , d = σ π b E ( k ) F I b a ,   b t ,   R t ,   R w ,   a w ,   θ .
The parameter σ in Formula (4) is the tension stress. The parameter θ is defined in Figure 7 to describe the distribution of the crack front. The parameter E ( k ) is the second kind of complete elliptic integral, and the expression is shown in Table 2. The parameter F I can be written in Formula (6) under the condition in Formula (5).
0 . 2 b a 2 ,   b / t < 1 ,   0.5 R / t 2 ,   ( R + a ) / w < 0.5   a n d   0 θ π 2
F I = M 1 + M 2 b t 2 + M 3 b t 4 g 1 g 2 g 3 g 4 f θ f w .
The expression of parameters in Formula (6) are shown in Table 2.

3.2. The Expression of K

In the second stage of the crack growth in DBTALPUA, the crack penetrated the upper layer and grew along the unbonded area. That can be simplify into two-dimensional question. Here, the solution of the two-dimensional single hole-edge crack given in reference was used to describe the SIF of the crack in the second stage in DBTALPUA. The expression of K is given in Formula (7) as follows.
K = σ π a F .
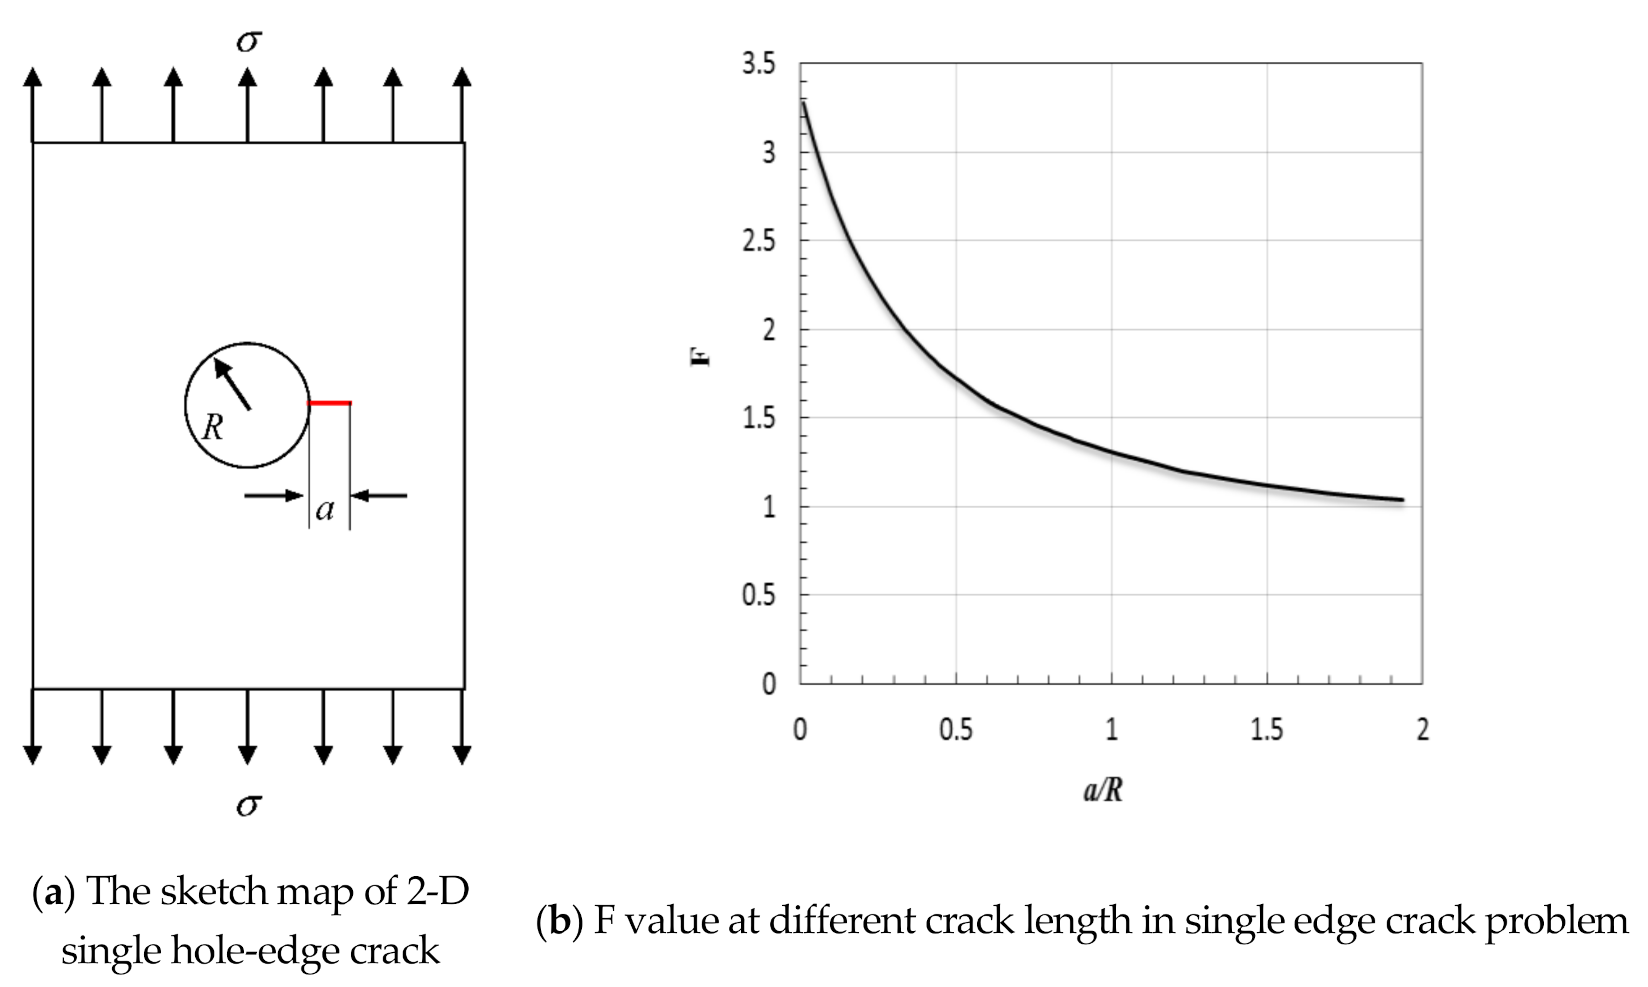
The parameter σ in Formula (7) is the tension stress. The parameter a is the crack length shown in Figure 8. The parameter F describes the effect of the stress concentration near the hole, and the value is shown in Figure 8.

3.3. The Expression of K

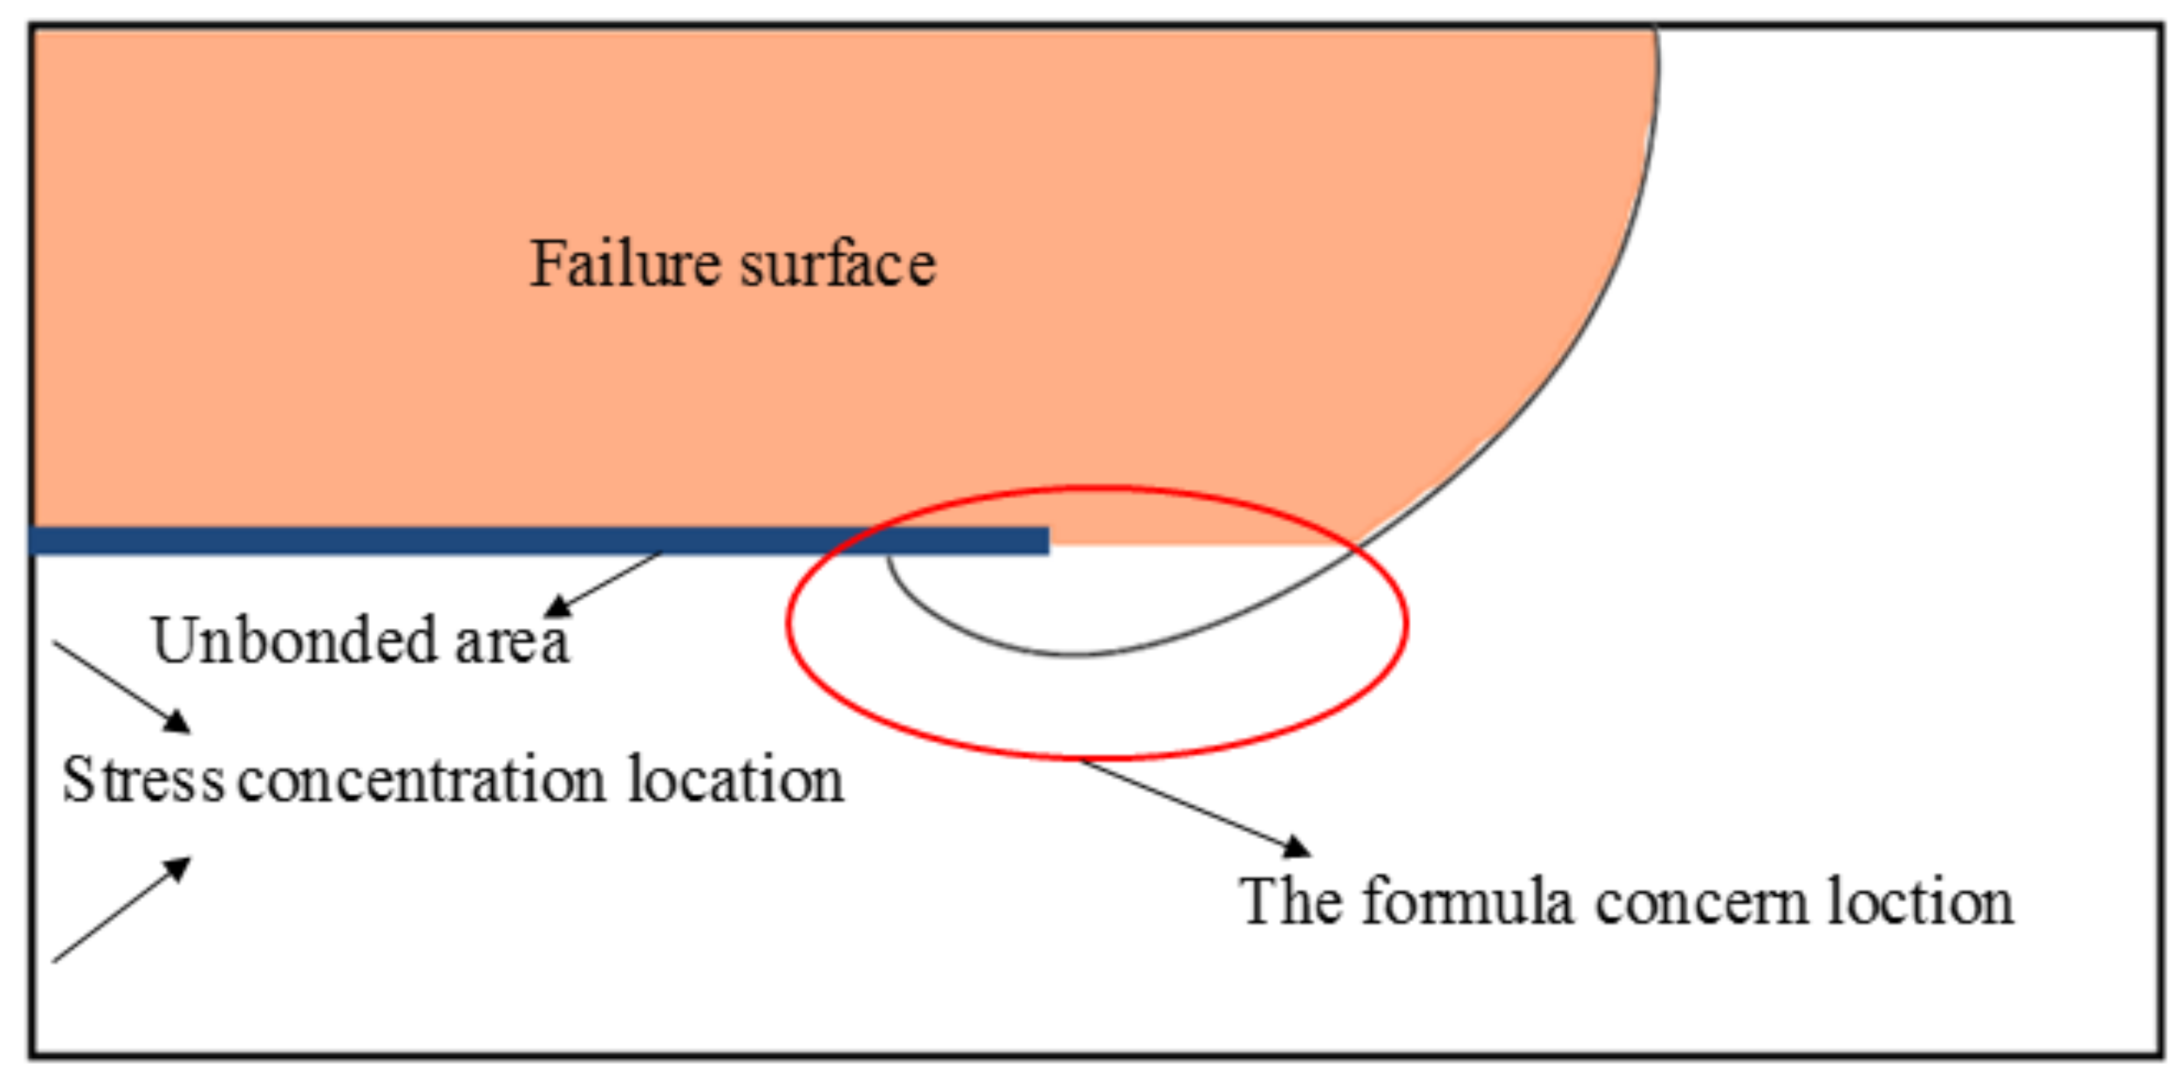
The crack growth process in third stage is complicated, and there is no proper formula to describe the SIF of the crack directly. In the third stage, the crack had crossed bypass the unbonded area and grew into the depth. If the laminates were penetrated totally in depth, the left crack growth process could be simplified as a two-dimension question. So, in this paper, we concentered the research on the part of the crack growth into depth in the third stage. The part K described is shown in Figure 9.
The crack shape reflected by the trace lines on fracture surface in the concerned part is shown in Figure 10 and is similar with the three-dimensional surface crack in an intact plate. So, the expression of K is built based on the formulas of the three-dimensional surface crack given in reference and with some corrections for the DBTALPUA. The SIF expression of the three-dimensional surface crack K I is shown in Formula (8) as follows [21].
K I = ( σ + H σ M ) π b E ( k ) F I b a ,   b t ,   a w   ,   θ   .
The geometric parameters a, b, t, w, and θ are shown in Figure 11. The parameter σ is the tension stress, and the parameter σ M is the bending stress, and its expression is shown in Formula (9).
σ M = 3 M w t 2 .
0 b a 2 ,   a / w < 0.5   and   0 θ π   ,   w h e n   0 b a 0.2 ,   b t < 1.25 b a + 0.6 w h e n   0.2 b a ,   b t < 1  
In the condition of Formula (10), the expression of FI and H can be written in Formulas (11) and (12).
F I = M 1 + M 2 b t 2 + M 3 b t 4 g f θ f w
H = H 1 + ( H 2 H 1 ) sin P θ .
The parameter E(k) in Formula (8) and the parameters in Formulas (11) and (12) are given in Table 3.
There are four main problems to describe the crack in DBTALPUA using Formula (8).
  • The laminates in this paper have an open hole, and there is stress concentration near the hole. Formula (8) did not consider the hole, and that needs correction.
  • When the crack grows to the third stage, there are already considerable fracture surfaces in the laminates. The tension stress needs correction.
  • Though the condition is tension loading in this paper, in the third stage, there is already some fracture surface. The fracture surface caused some eccentric bending moment to the left part. Formula (8) did not consider the additional eccentric bending moment, and that needs correction.
  • In Formula (8), the surface of the plate is free surface. However, in DBTALPUA, the side with unbonded area is approximate to a free surface, while the other side of the crack is not a free surface, as shown in Figure 10, and that needs correction.
For problem 1 to problem 3 mentioned above, we gave the K I * as the corrected expression as shown in Formula (13).
K I * = ( σ * + H σ M ) π b E ( k ) F I b a ,   b t ,   a w   ,   θ   F .
There are two parameters F and σ * in Formula (13) different from Formula (8), while other parameters defined are same as in Formula (8). The value of parameter F is shown in Figure 8, which considers the effect of the stress concentration near the hole. The corrected tension stress σ * is given in Formula (14) as follows.
σ * = σ ( t 1 + t ) ( 2 w ) ( t 1 + t ) ( 2 w 2 R ) S F .
The parameter σ is the tension stress at the loading end. The parameter SF is fracture surface in the upper layer. The shape of this part was irregular, and here, the right part with curve was simplified into right triangle with right-angle side length t1 and t1/2. The express of SF is given in Formula (15).
S F = r R + l + a + t 1 / 2 t 1 .
In Formula (15), the parameter l is the distance from the boundary of the unbonded area to the middle of the concerned part shown in Figure 12. The parameter a is half length of the crack in the concerned part shown in Figure 12. The additional eccentric bending moment M can be expressed in Formula (16) as follows.
M = w R t σ * t / 2 w R t 1 S F σ * t 1 / 2 .
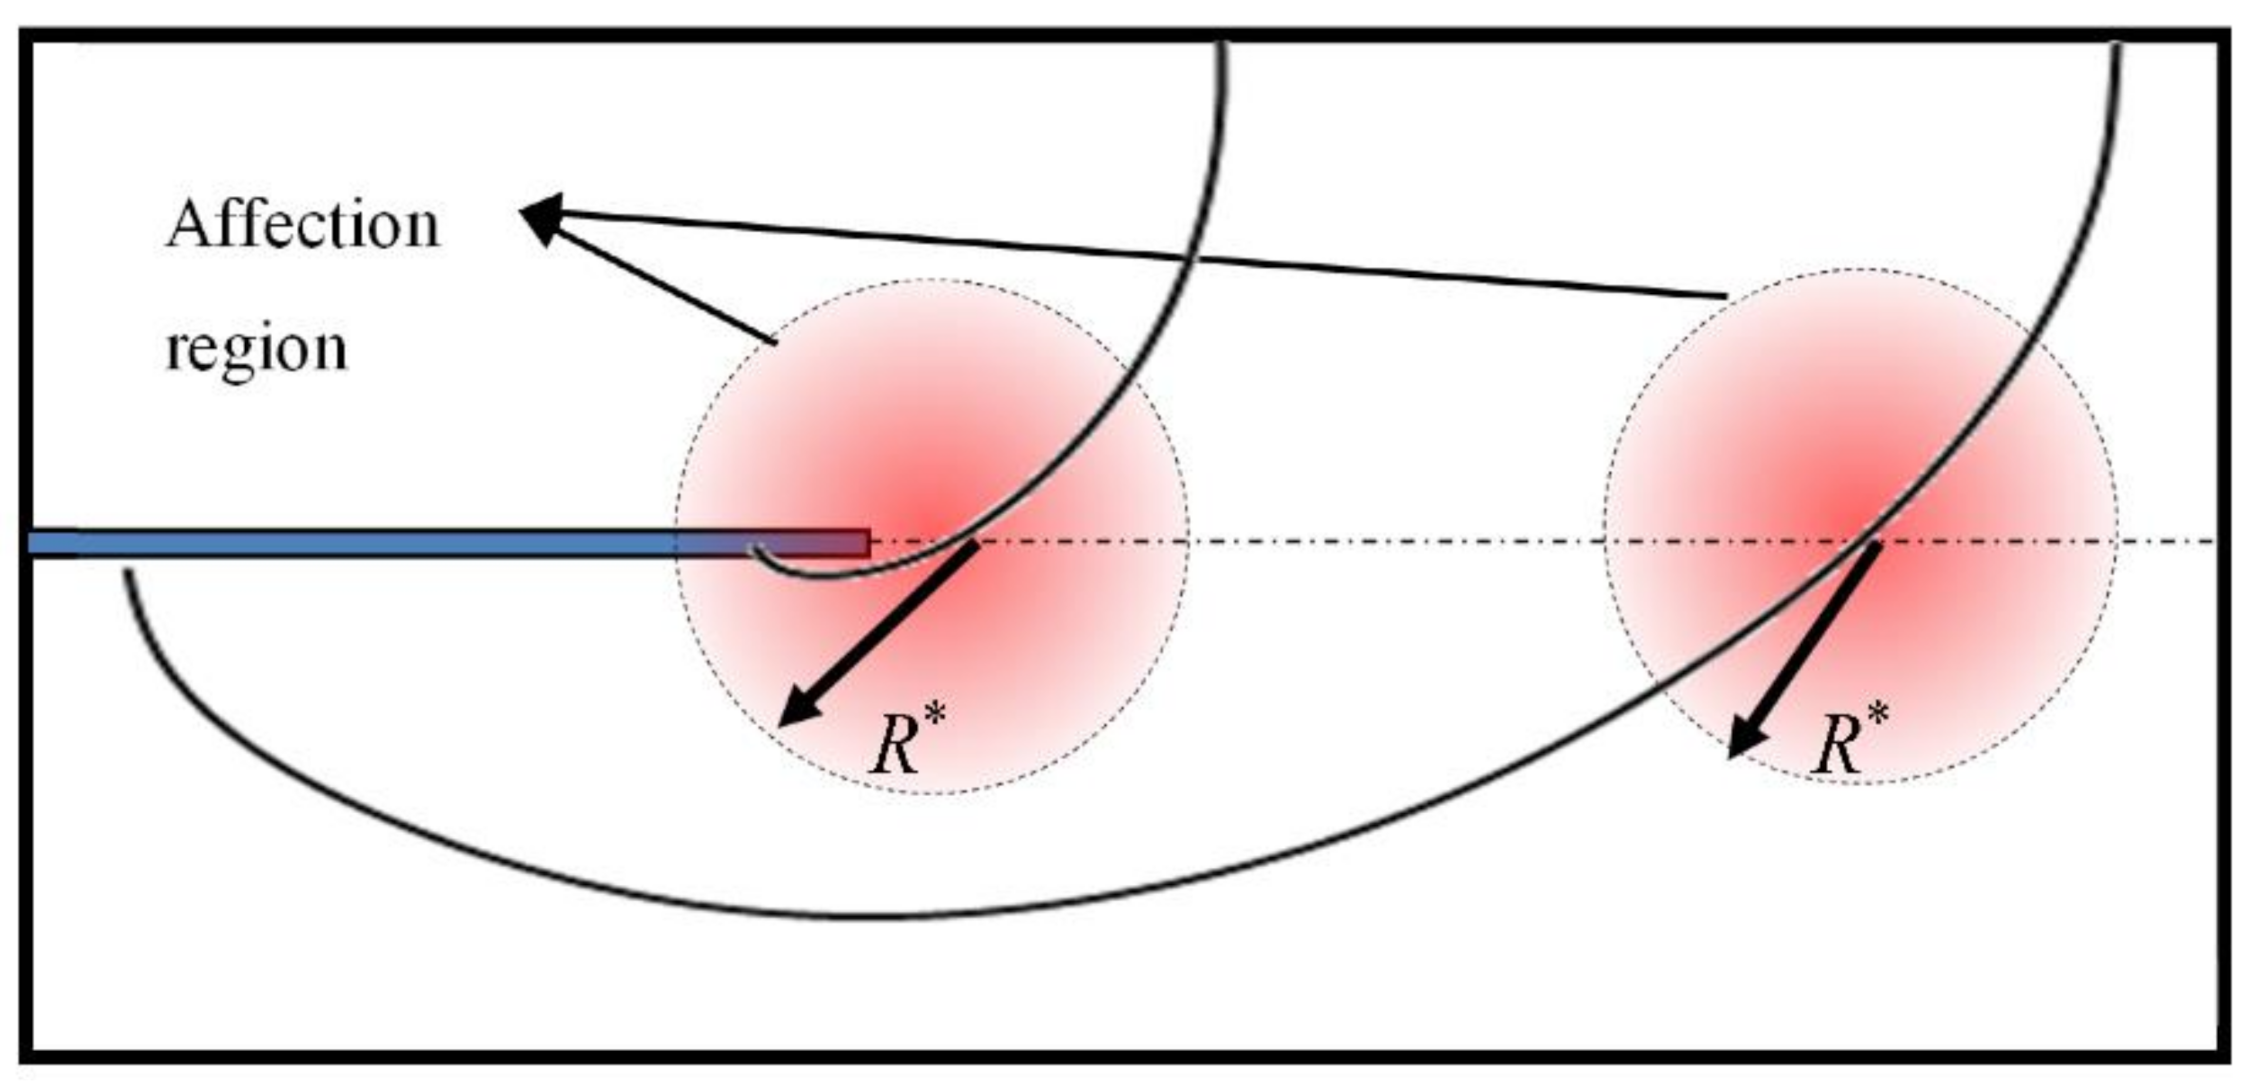
For problem 4, here, we assumed that there is an affected zone in nonfree surface location, and the effect is linear attenuation from the center as shown in Figure 13. The expression of K can be written as Formula (17).
K I = K I * ( l + a ) / R * + ( R * ( l + a ) ) K .
The parameter R* is the radius of the effect zone. The value of R* = 7 mm for the material in this paper, and the size is connected with the material property. The value can be obtained by curve fitting for specific material. The parameter K is the SIF in the center of the effect zone, and the value can be calculated approximately by Formula (7).

4. Validation of Formula

The finite element method was employed to validate the formula. We built the finite element model for the specimen and calculated the distribution of the crack front in the trace lines’ locations. By comparing the numerical results and the formula results, the validation and the errors are given in following section.

4.1. The Trace Line Modeling

The shapes of crack trace lines in three stages are quite different, so b-spline interpolation is adopted to describe the shape of crack leading edge in three stages separately. According to the complexity of the trace lines, proper number of feature points is used to fit the line shape shown in Figure 14.
Figure 15 shows the total trace lines modeled by b-spline interpolation method.

4.2. Finite Element Modeling

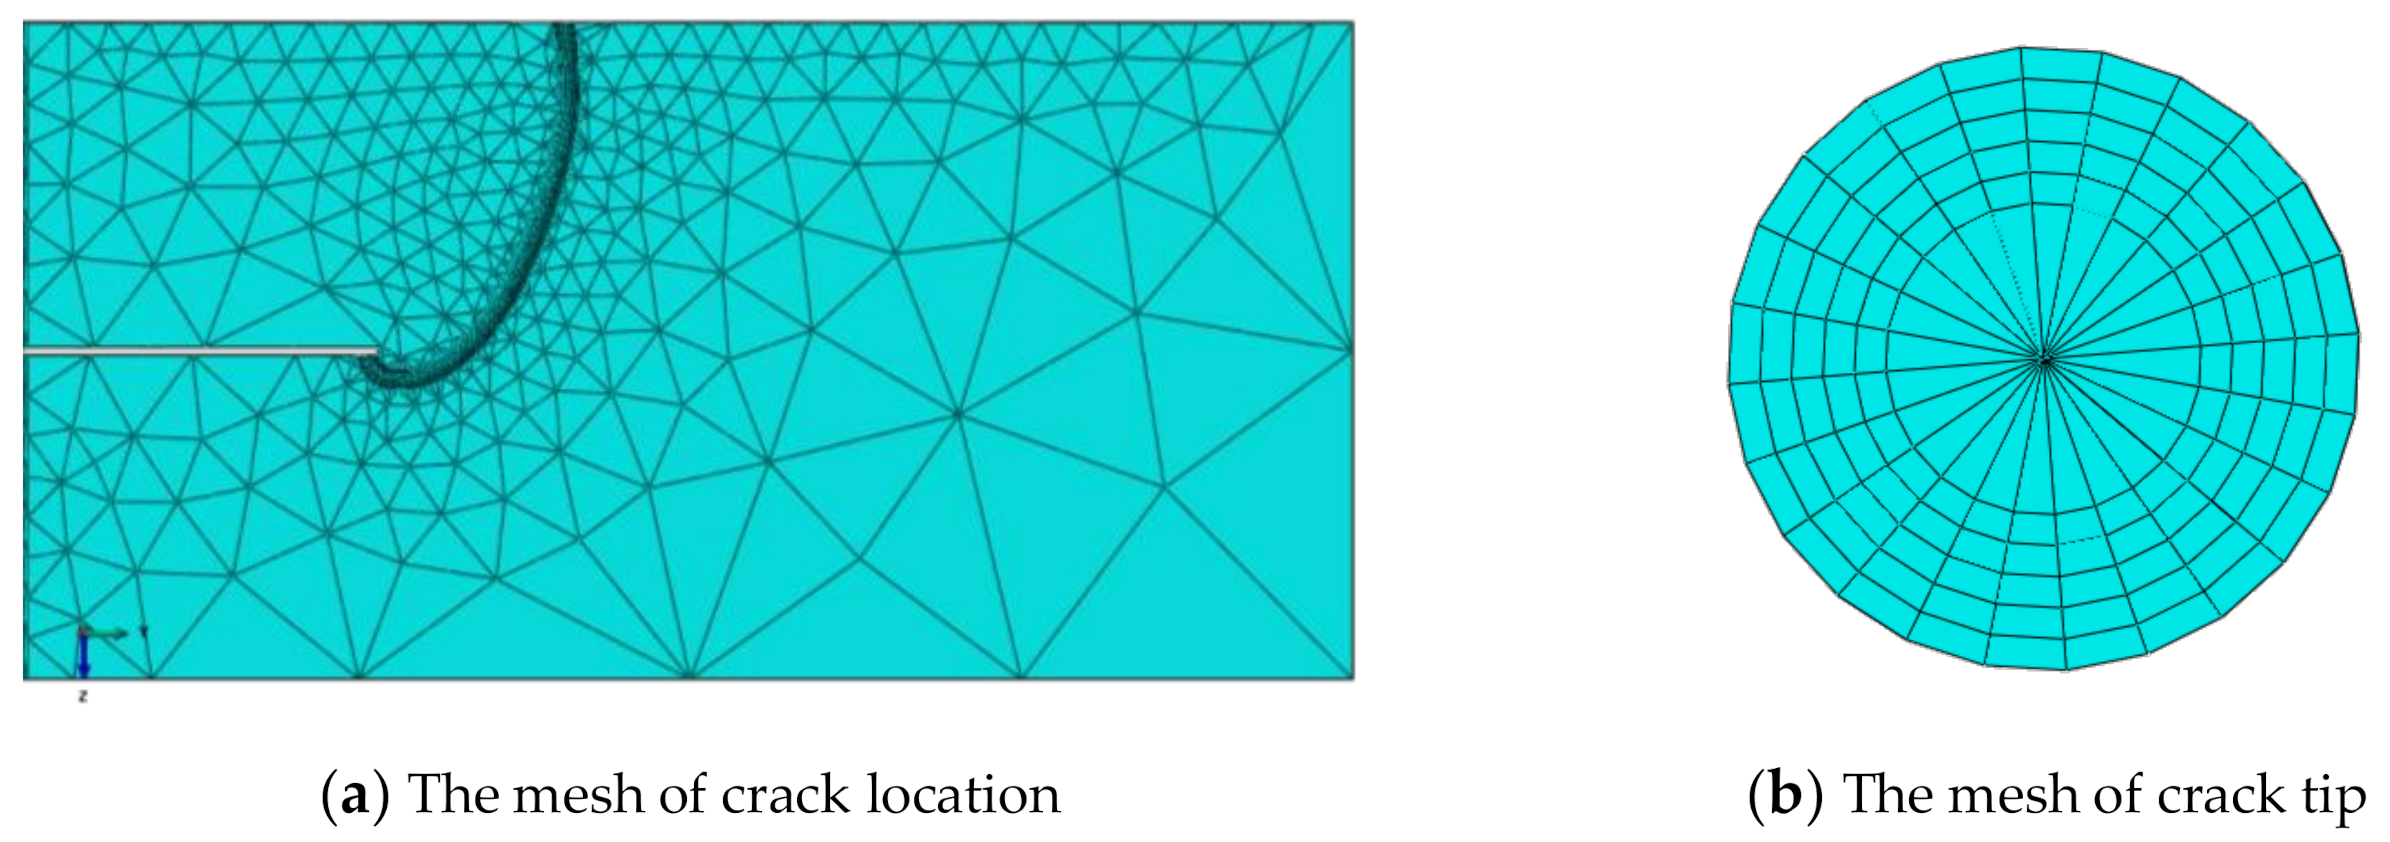
Commercial finite element software ABAQUS was used for finite element modeling of the specimen, and the SIF of the crack front edge was calculated by J integral method. The load boundary condition is consistent with the test as shown in Figure 16. One end is fixed and the other end is subjected to tensile load. The maximum fatigue load during the test is 230 MPa. The finite element grid is shown in Figure 17. Tetrahedral element is used for the main part of the specimen, and hexahedral element and degenerated hexahedral element are used for the crack front edge. Finite element model was established for each line and analyzed. The material parameters are shown in Table 4.
It is worth noting that the fatigue crack surface here is defined by seam, i.e., the joints with two layers of coordinate superposition on the crack surface will be separated after tensile load.

4.3. Validation and Errors Analysis

4.3.1. The Analysis of the First Stage during the Crack Growth Process

The trace lines in the first stage were assumed as quarter ellipse. The long axis and short axis of six trace lines are given in Table 5.
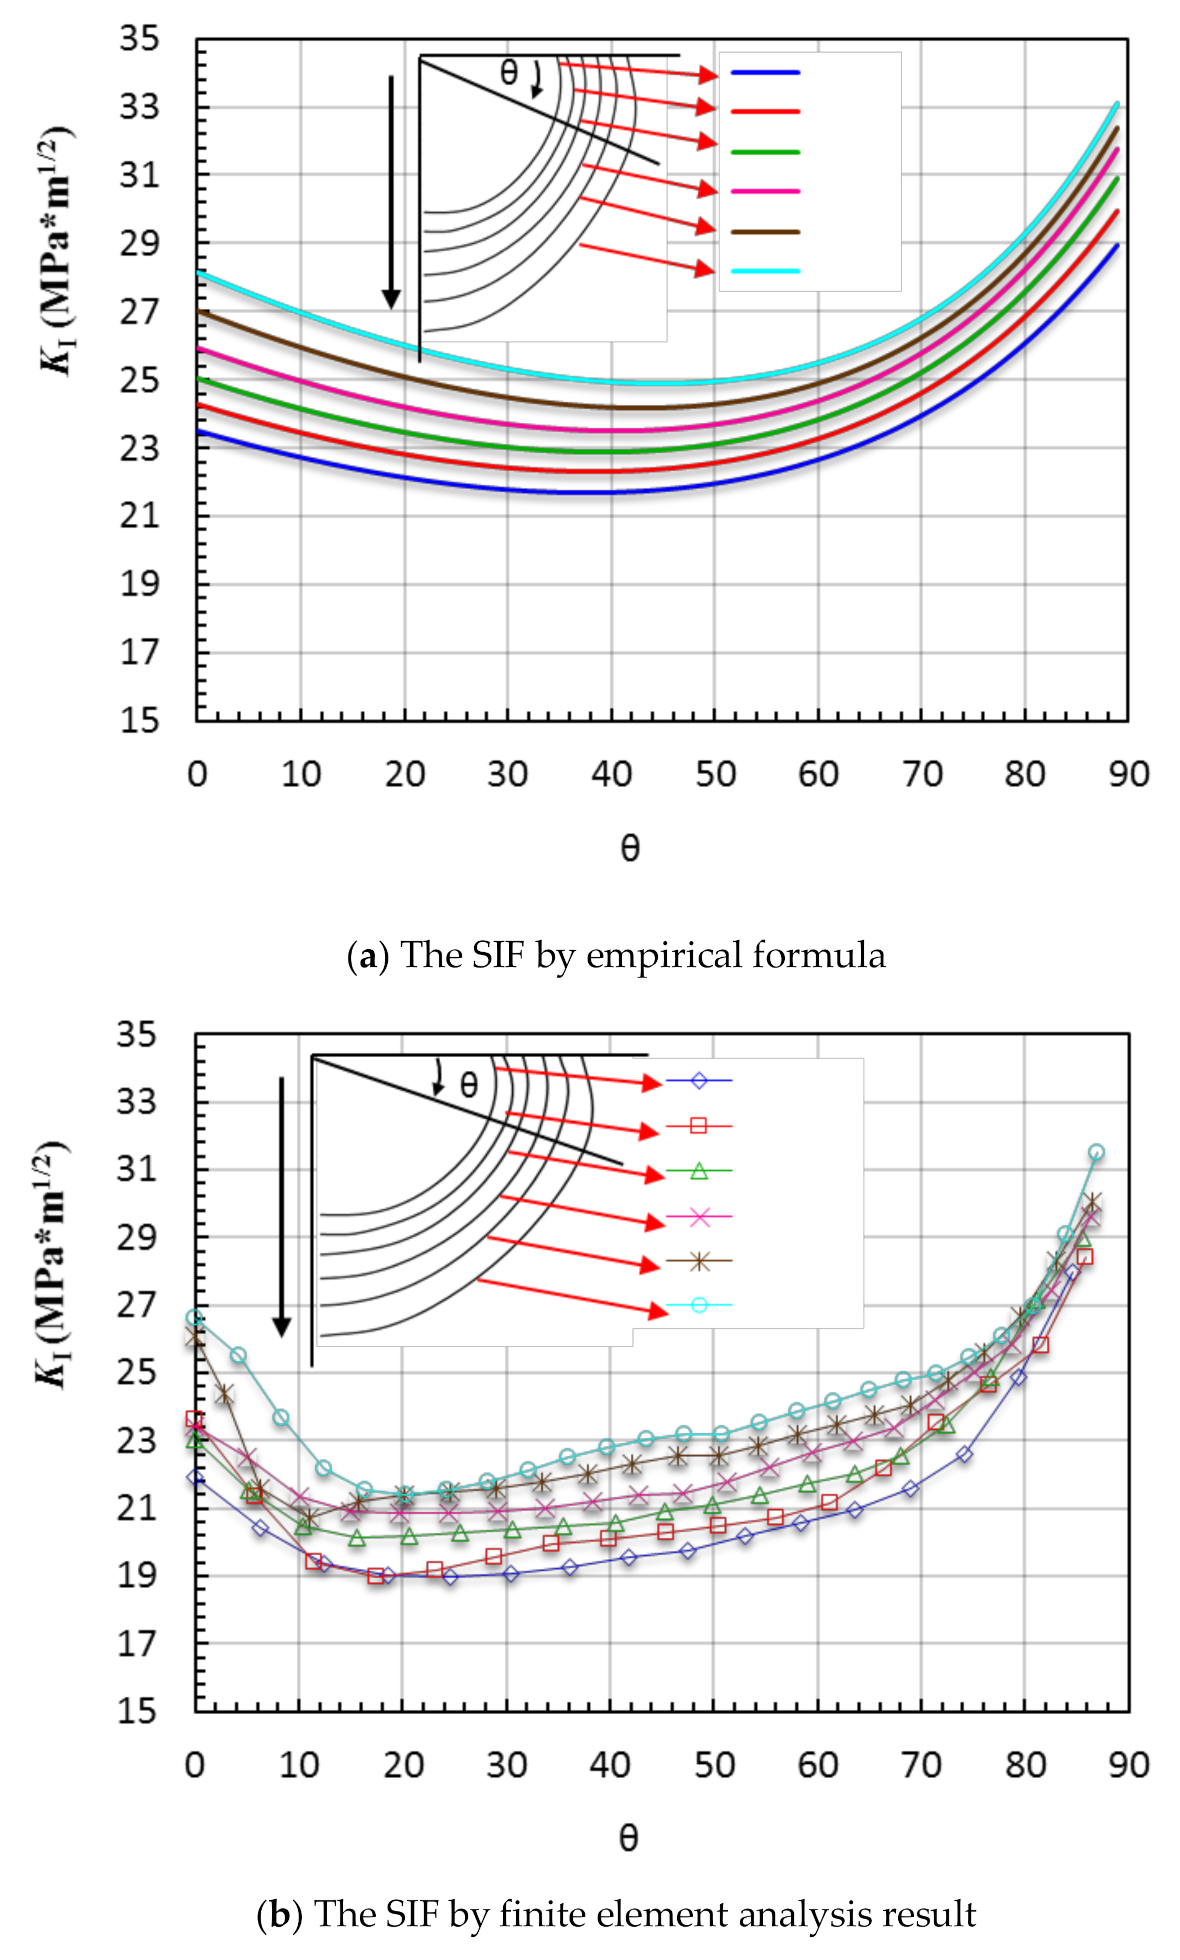
Figure 18 gives the results obtained by formula and numerical analysis. The overall trends of the distribution of the SIF are almost the same. The result curves obtained by formula are much smoother. That is because the trace lines are not perfect quarter ellipse and there is some region with curvature mutation on the trace line.
Table 6 gives the comparison between formula results and numerical results at θ = 0° and θ = 90° location. The formula results are a little larger than numerical results, and the formula results are conservative. The maximum difference is about 10%.

4.3.2. The Analysis of the Second Stage during the Crack Growth Process

The crack growth process in the second stage was simplified into two-dimensional problem. So, the surface crack length aw in Figure 6 is used as the crack length to calculate the SIF in Formula (7). Table 7 gave comparison between formula results and numerical results. The No. column in Table 7 represents the number of crack front in the second stage. The numerical results in Table 7 are the average value of each crack front. The formula results and numerical results are fairly close, and the maximum difference is less than 4.5%.

4.3.3. The Analysis of the Third Stage during the Crack Growth Process

In the third stage, there are too many trace lines. If the results of these trace lines were put together, the results would be too many to distinguish. So, we picked the beginning six trace lines and the ending six trace lines to analysis separately.
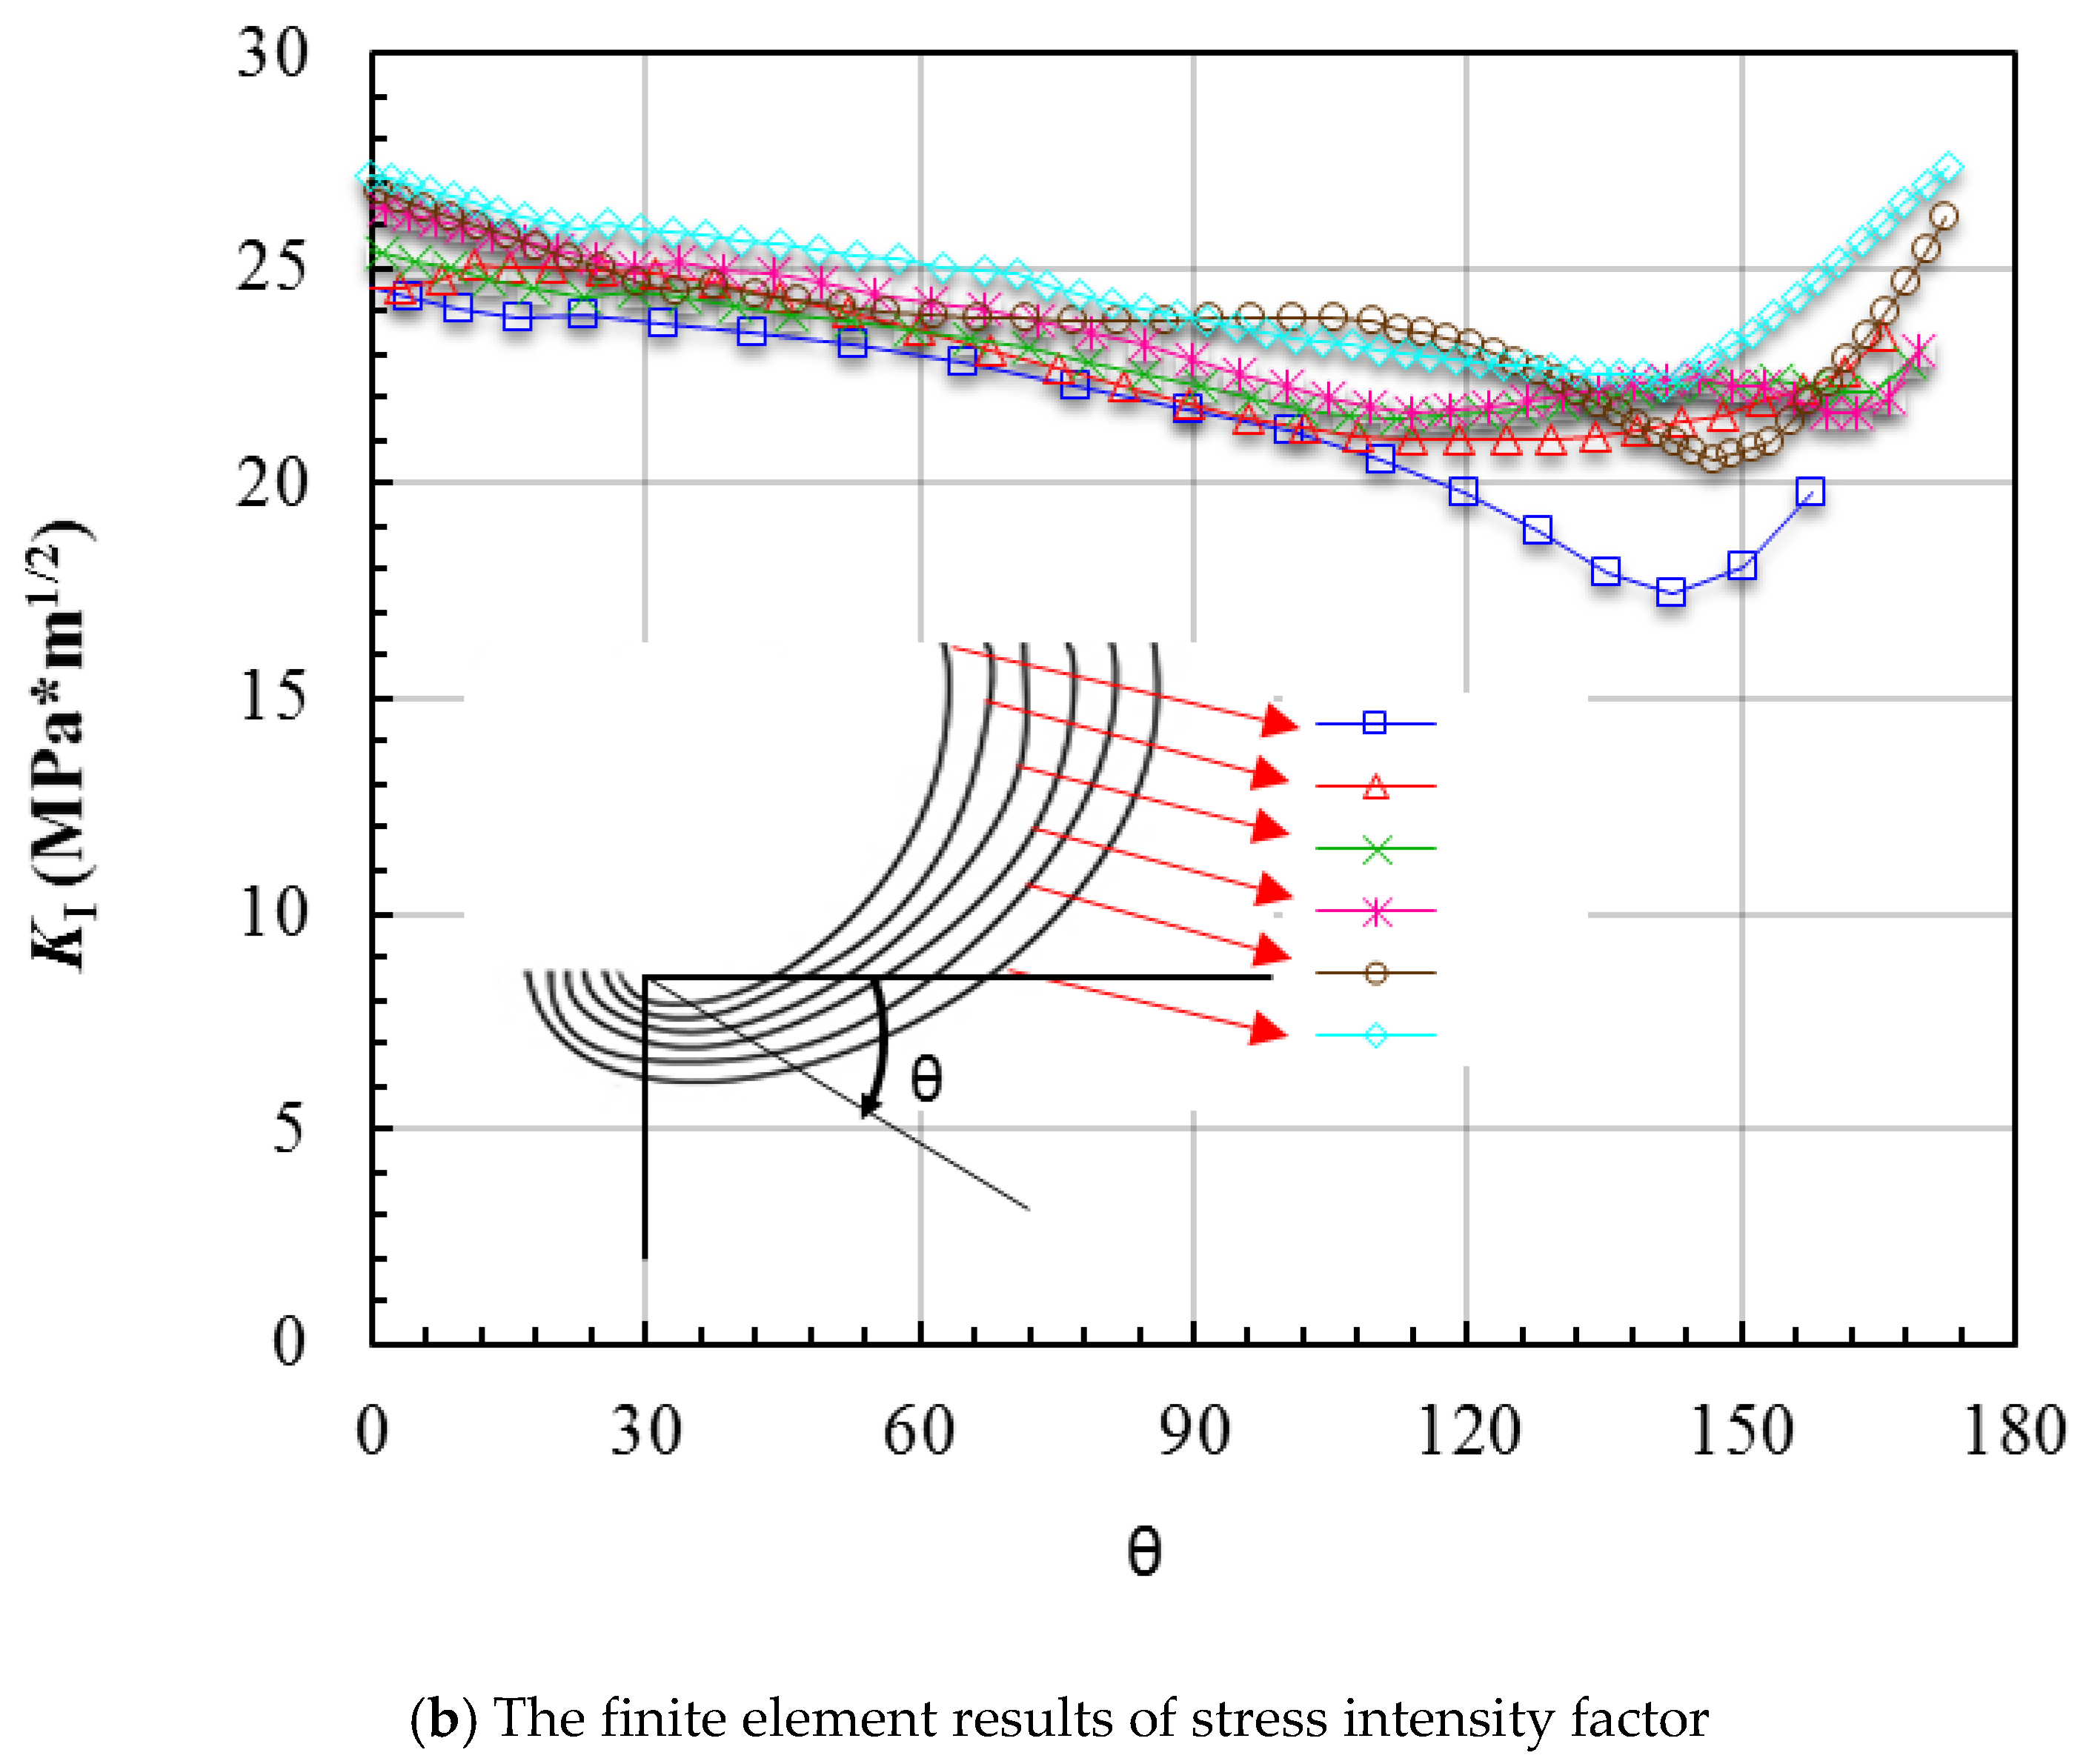
Figure 19 shows the formula results and numerical results of the beginning six trace lines in the third stage. The overall trends of the formula results and numerical results are similar. There is some difference near θ = 150° location, which is caused by the curvature mutation of the crack fronts. Table 8 gives the comparison between formula results and numerical results. Although the maximum difference near θ = 180° reached 17.2%, the maximum average value difference of each whole crack front was only 3.5%. It means that when the shape of crack front is close to ellipse, the formula can give results with considerable accuracy, and for the location with huge curvature mutation, the accuracy of the formula will lose some of accuracy.
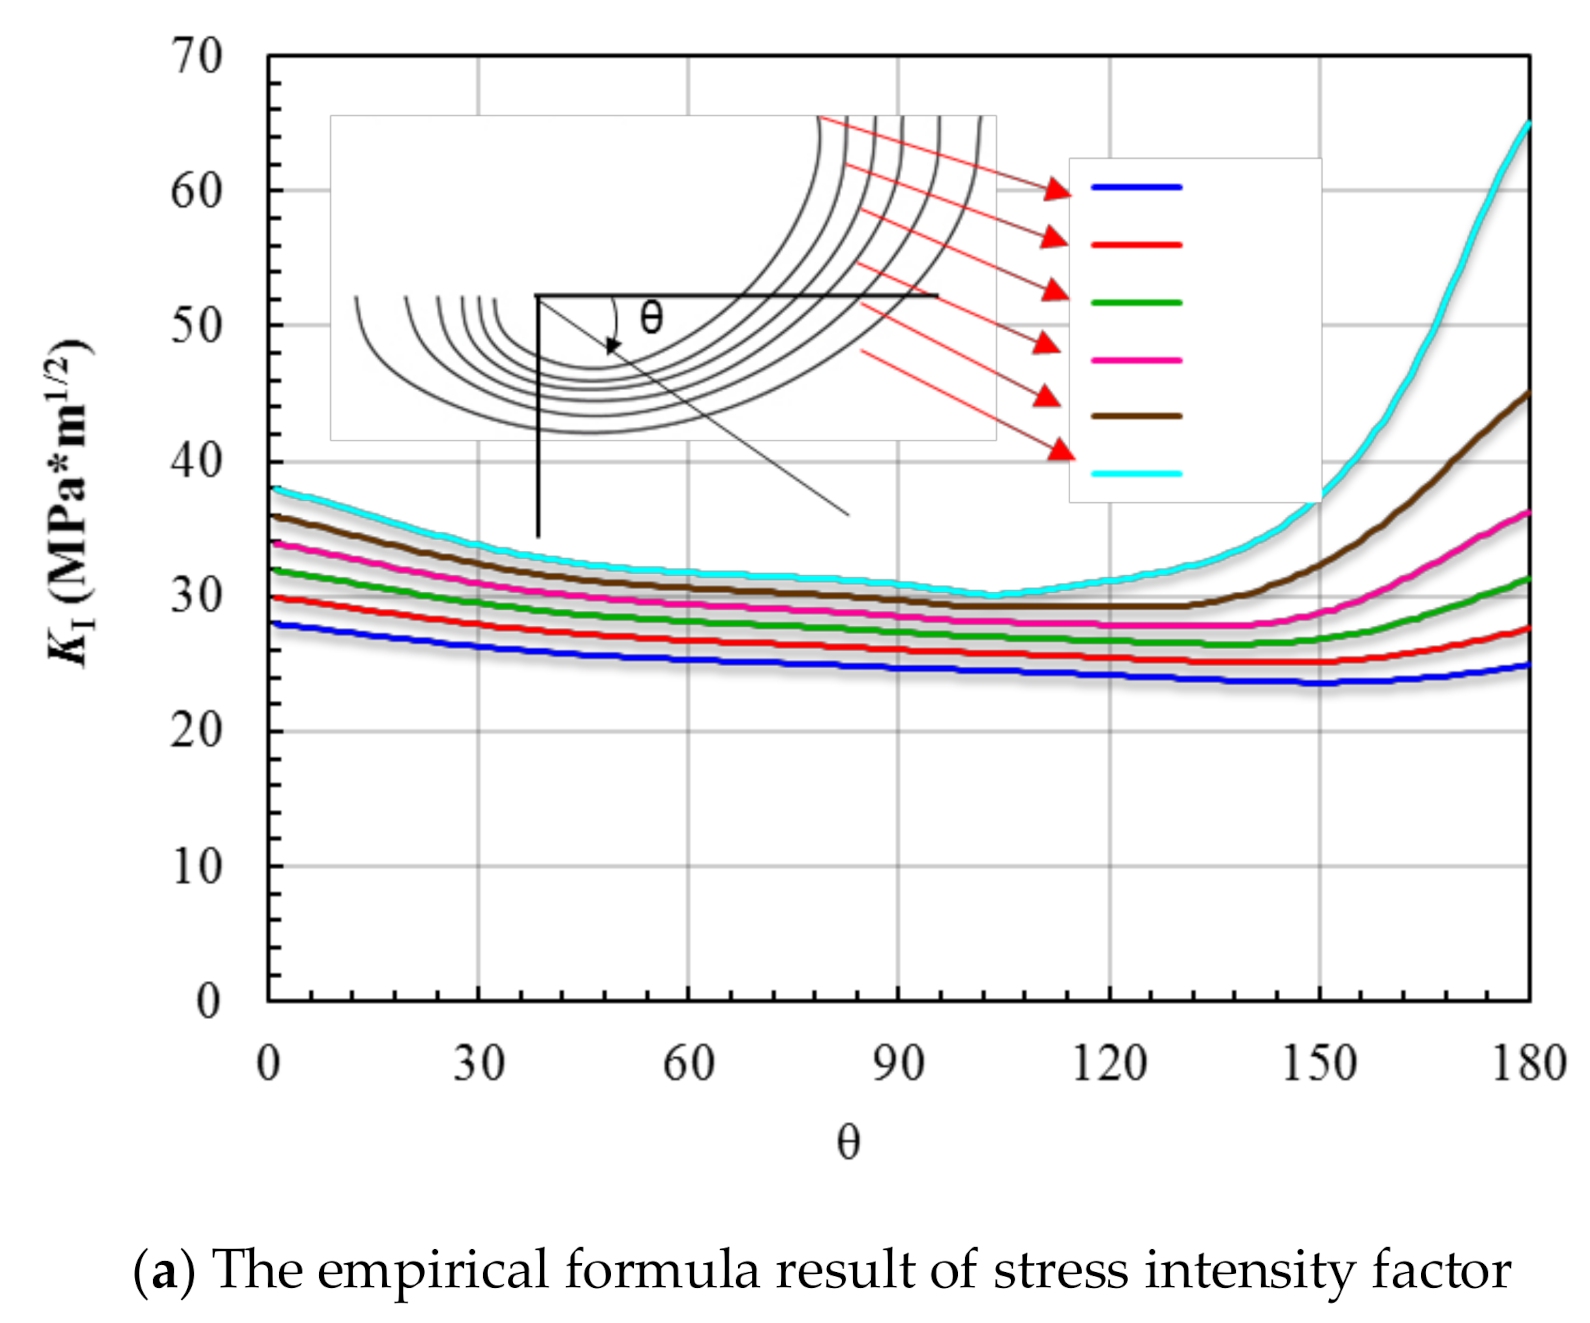
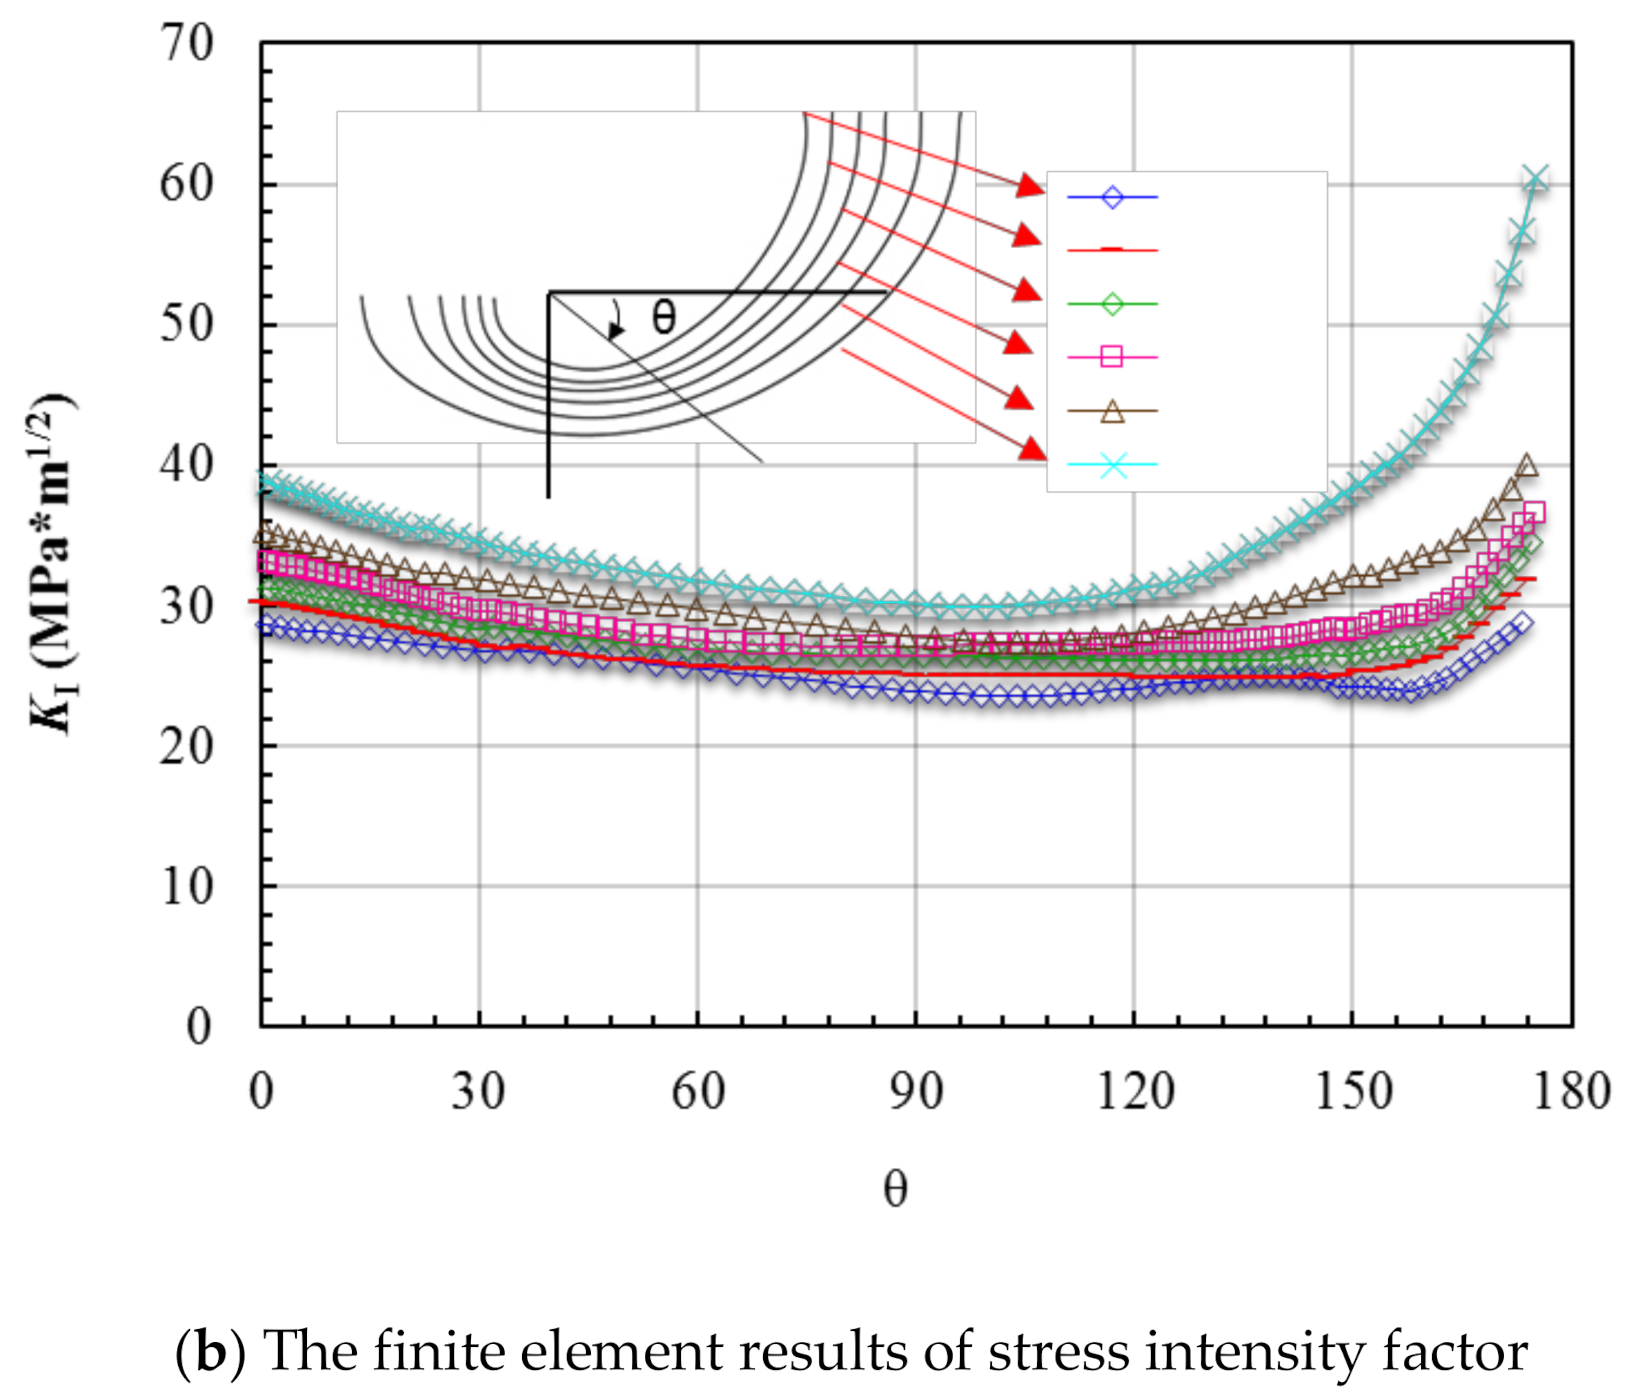
Figure 20 shows the formula results and numerical results of the ending six trace lines in the third stage. The overall trends of the formula results and numerical results are similar. Table 9 gives the comparison between formula results and numerical results. Although the maximum difference near θ = 180° is 13.2%, the maximum average value difference of each whole crack front was only 3.0%.

5. Conclusions

An analytical model was presented in this paper to calculate SIF distribution for single hole-edge crack in DBTALPUA with hole under tension loading. Comparison of the results obtained through this analytical model and numerical simulation illustrated that the analytical model can rapidly predict the SIF distribution with fine precision. Following conclusions can be concluded.
  • The analytical formula for the first two stages has higher precision than that for the third stage.
  • In the very beginning of the third stage, the analytical formula has comparatively low precision, and the precision increased as the fracture surface increased.
  • When the curve of crack front is closed to a part of ellipse, the analytical formula gives fined precision. For the curve of crack front with curvature mutation, there is low precision at the curvature mutation location.

Author Contributions

S.L. and Y.L. conceived and designed the experiments; Y.L. performed the experiments; S.L. and Y.L. analyzed the data and proposed the model; Y.L. wrote the paper. All authors have read and agreed to the published version of the manuscript.

Funding

This research was funded by the National Natural Science Foundation of China (Grant No. U1808215), the 111 Project (B14013) and the Fundamental Research Funds for the Central Universities (3132020163). And the APC was funded by the National Natural Science Foundation of China (Grant No. U1808215), the 111 Project (B14013) and the Fundamental Research Funds for the Central Universities (3132020163).

Conflicts of Interest

The authors declare no conflict of interest.

References

  1. Williams, J.C. Titanium Alloys: Production, Behavior and Application; Springer: Berlin/Heidelberg, Germany, 1995. [Google Scholar]
  2. Oguma, H.; Nakamura, T. Fatigue crack propagation properties of Ti–6Al–4V in vacuum environments. Int. J. Fatigue 2013, 50, 89–93. [Google Scholar] [CrossRef]
  3. Owolabi, G.; Okeyoyin, O.; Olasumboye, A.; Whitworth, H. A new approach to estimating the fatigue notch factor of Ti-6Al-4V components. Int. J. Fatigue 2016, 82, 29–34. [Google Scholar] [CrossRef] [Green Version]
  4. Nalla, R.; Ritchie, R.; Boyce, B.; Campbell, J.; Peters, J. Influence of microstructure on high-cycle fatigue of Ti-6Al-4V: Bimodal vs. lamellar structures. Metall. Mater. Trans. A 2002, 33, 899–918. [Google Scholar] [CrossRef]
  5. Makabe, C.; Murdani, A.; Kuniyoshi, K.; Irei, Y.; Saimoto, A. Crack-growth arrest by redirecting crack growth by drilling stop holes and inserting pins into them. Eng. Fail. Anal. 2009, 16, 475–483. [Google Scholar] [CrossRef]
  6. Oguma, H.; Nakamura, T. The effect of microstructure on very high cycle fatigue properties in Ti–6Al–4V. Scr. Mater. 2010, 63, 32–36. [Google Scholar] [CrossRef] [Green Version]
  7. Campbell, J.; Ritchie, R. Mixed-mode, high-cycle fatigue-crack growth thresholds in Ti–6Al–4V: II. Quantification of crack-tip shielding. Eng. Fract. Mech. 2000, 67, 229–278. [Google Scholar] [CrossRef]
  8. Gunderson, A.; Gegel, H.; Lyon, S. Fatigue Behavior of Diffusion Bonded Ti-6A1-4V Having Very Small Defects. In Titanium Science and Technology; Springer: Berlin/Heidelberg, Germany, 1973; pp. 649–659. [Google Scholar]
  9. Kaibyshev, O.A.; Safiullin, R.V.; Lutfullin, R.; Valiakhmetov, O.R.; Galeyev, R.M.; Dutta, A.; Raghu, T.; Saha, G.G. Advanced superplastic forming and diffusion bonding of titanium alloy. Mater. Sci. Technol. 2006, 22, 343–351. [Google Scholar] [CrossRef]
  10. Derby, B.; Wallach, E. Theoretical model for diffusion bonding. Met. Sci. 1982, 16, 49–56. [Google Scholar] [CrossRef]
  11. Kazakov, N.F. Diffusion Bonding of Materials; Elsevier: Amsterdam, The Netherlands, 2013. [Google Scholar]
  12. Dunford, D.V.; Wisbey, A. Diffusion Bonding of Advanced Aerospace Metallics; MRS Online Proceedings Library Archive: San Francisco, CA, USA, 1993. [Google Scholar]
  13. Wang, X.; Liu, W. Design and Application of Aircraft Titanium Alloy Structure; National Defense Industry Press: Beijing, China, 2010. (In Chinese) [Google Scholar]
  14. He, X.; Liu, W.; Sun, Y.; Wang, X. Fatigue crack growth characteristic for diffusion bonded laminates of titanium alloy with centered hole. Eng. Mech. 2015, 4, 244–249. (In Chinese) [Google Scholar]
  15. Liu, Y.; Zhang, Y.; Liu, S.; Xiao, S.; Sun, Y.; Wang, X. Effect of unbonded areas around hole on the fatigue crack growth life of diffusion bonded titanium alloy laminates. Eng. Fract. Mech. 2016, 1, 176–188. [Google Scholar] [CrossRef]
  16. He, X.; Dong, Y.; Li, Y.; Wang, X. Fatigue crack growth in diffusion-bonded Ti-6Al-4V laminate with unbonded zones. Int. J. Fatigue 2018, 106, 1–10. [Google Scholar] [CrossRef]
  17. Xiao, S.; Bi, J.; Sun, Y. XFEM-based analysis for crack growth characteristic of diffusion bonded laminate of titanium-alloy. Aeronaut Manuf. Technol. 2015, 17, 86–89. (In Chinese) [Google Scholar]
  18. Liu, Y.; Zhang, Y.; Liu, S.; Xiao, S.; Wang, X.; Sun, Y. XFEM-Based Analysis for Crack Growth Characteristics of Diffusion Bonded Laminates of Titanium Alloy with Localized Nonwelded Zone. Math. Prob. Eng. 2013, 10, 1256–1271. [Google Scholar] [CrossRef]
  19. Li, X.; Gai, P.; Zeng, Y.; Bi, J.; Shi, Y.; Liu, J. Manufacturing of titanium alloy laminated joint based on damage tolerance design. Aeronaut Manuf. Technol. 2015, 17, 66–68. (In Chinese) [Google Scholar]
  20. Gai, P.; Li, X.; Liu, J.; Han, X. Research on crack propagation characteristic for diffusion bonded laminates of titanium alloy. J. Plast. Eng. 2016, 5, 156–159. (In Chinese) [Google Scholar]
  21. Murakami, Y.; Keer, L.M. Stress intensity factors handbook, vol. 3. J. Appl. Mech. 1993, 60, 1063. [Google Scholar] [CrossRef] [Green Version]
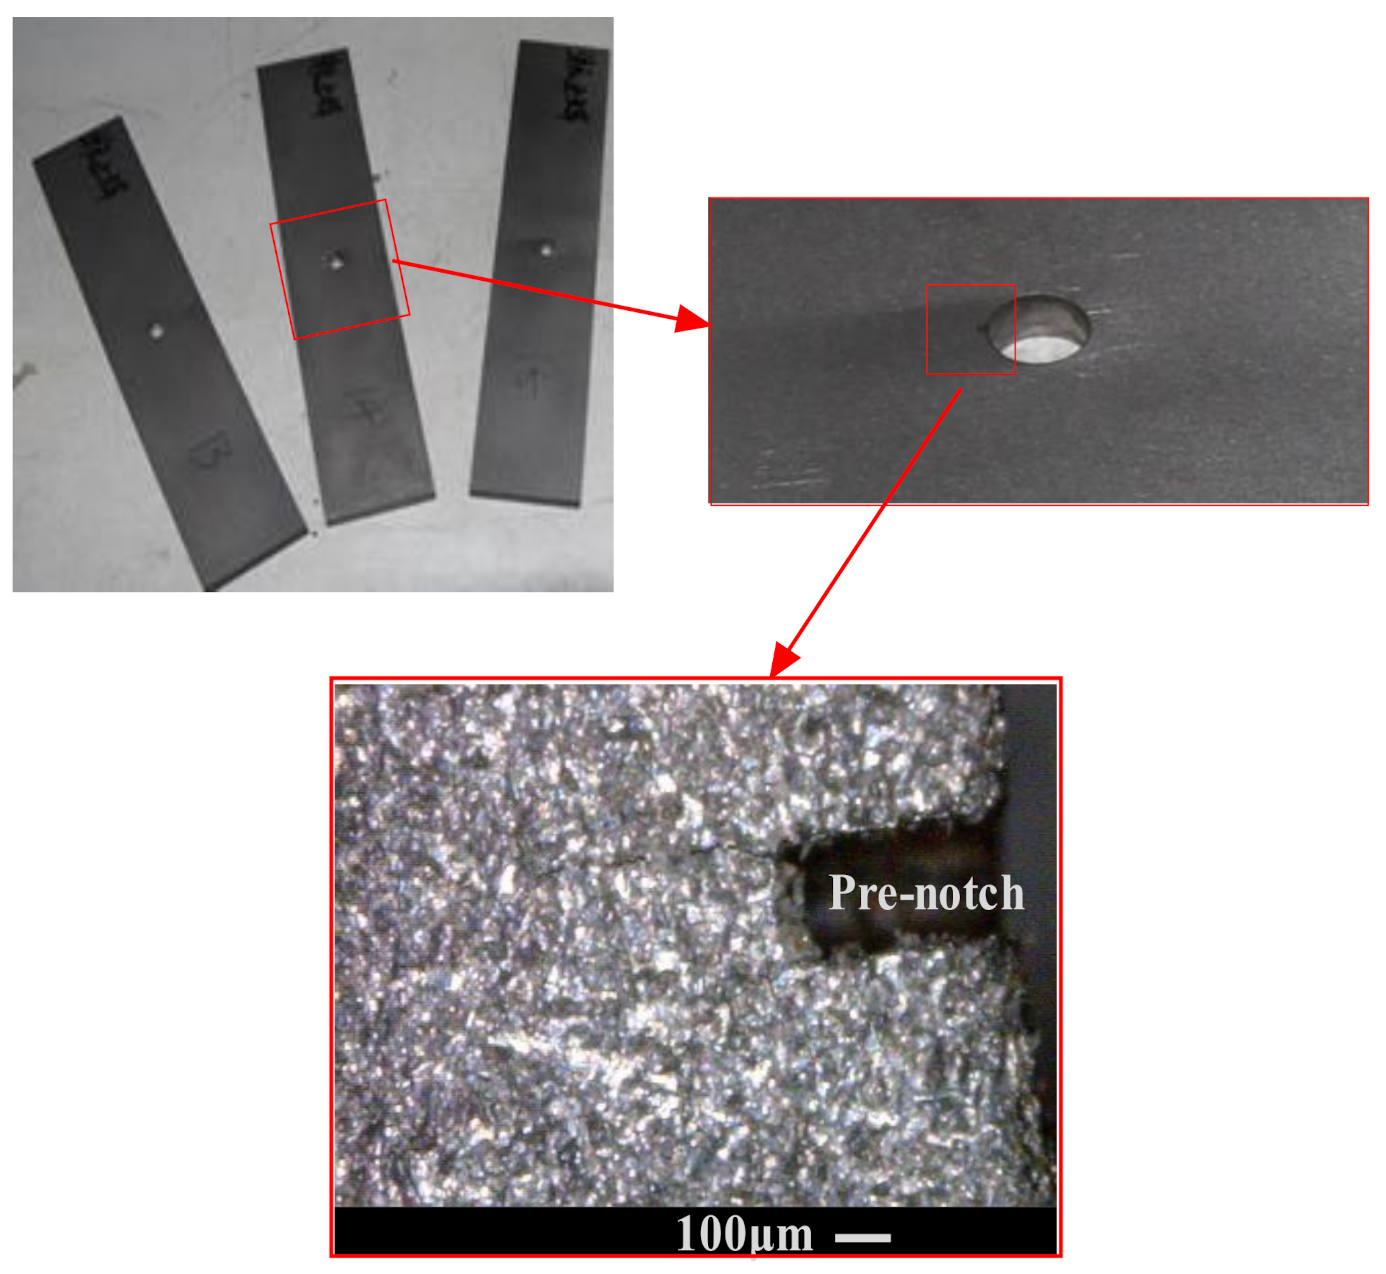
Figure 1. The prenotch shape and location.
Metals 10 01526 g001
Figure 2. The diffusion bonding titanium alloy laminates with preset unbonded area (DBTALPUA) specimen.
Metals 10 01526 g002
Figure 3. The loading spectrum.
Metals 10 01526 g003
Figure 4. The fracture surface.
Metals 10 01526 g004
Figure 5. The three crack growth stages (I: The first stage, II: The second stage, III: The third stage).
Metals 10 01526 g005
Figure 6. Schematic diagram of the parameters.
Metals 10 01526 g006
Figure 7. Geometry parameter definition of 3-D crack.
Metals 10 01526 g007
Figure 8. The standard 2-D crack growth problem.
Metals 10 01526 g008
Figure 9. The formula concerned location.
Metals 10 01526 g009
Figure 10. The shape of the concerned crack front in the third stage.
Metals 10 01526 g010
Figure 11. Surface crack problem.
Metals 10 01526 g011
Figure 12. Modified predictor area and parameter definition.
Metals 10 01526 g012
Figure 13. Affection on predictor area by uncounted failure part.
Metals 10 01526 g013
Figure 14. The feature points of the trace lines.
Metals 10 01526 g014
Figure 15. All the trace lines by b-spline interpolation.
Metals 10 01526 g015
Figure 16. The geometry and boundary conditions of the specimen.
Metals 10 01526 g016
Figure 17. The finite element mesh of the entity and local crack front of the model.
Metals 10 01526 g017aMetals 10 01526 g017b
Figure 18. Stress intensity factor comparison between empirical formula and finite element analysis result in the first stage of crack growth. (The different color lines represent different crack front.).
Metals 10 01526 g018
Figure 19. Modified stress intensity factor prediction by empirical formula in the beginning part of trace lines of the third stage. (The different color lines represent different crack front).
Metals 10 01526 g019aMetals 10 01526 g019b
Figure 20. Modified stress intensity factor prediction by empirical formula in the following part of trace lines of the third stage. (The different color lines represent different crack front.).
Metals 10 01526 g020aMetals 10 01526 g020b
Table 1. The composition of the Ti-6Al-4V material.
ElementAlVFeCONTi
Content (%)5.5–6.753.5–4.5≤0.5≤0.1≤0.2≤0.05Bal.
Table 2. Empirical formula of the parameters in F I .
w h e n   b / a 1 w h e n   b / a > 1
M 1 = 1.13 0.09 ( b a ) M 2 = 0.54 + 0.89 0.2 + ( b / a ) M 3 = 0.5 1.0 0.65 + ( b / a ) + 14 ( 1.0 b / a ) 24 g 1 = 1 + [ 0.1 + 0.35 ( b t ) 2 ] ( 1 sin θ ) 2 g 2 = 1 + 0.358 λ + 1.425 λ 2 1.578 λ 3 + 2.156 λ 4 1 + 0.13 λ 2 λ = 1 1 + ( a / R ) cos ( 0.85 θ ) g 3 = ( 1 + 0.04 ( b a ) ) [ 1 + 0.1 ( 1 cos θ ) 2 ] [ 0.85 + 0.15 ( b t ) 1 / 4 ] g 4 = 1 0.7 [ 1 ( b / t ) ] [ ( b / t ) 0.2 ] [ 1 ( b / a ) ] f θ = [ ( b a ) 2 cos 2 θ + sin 2 θ ] 1 / 4 f w = { sec ( π R 2 w ) sec [ π ( R + a ) 2 w b t ] } 1 / 2 E ( k ) = [ 1 + 1.464 ( b a ) 1.65 ] 1 / 2 M 1 = a b ( 1 + 0.04 a b ) M 2 = 0.2 ( a b ) 4 M 3 = 0.11 ( a b ) 4 g 1 = 1 + [ 0.1 + 0.35 ( a b ) ( b t ) 2 ] ( 1 sin θ ) 2 g 2 = 1 + 0.358 λ + 1.425 λ 2 1.578 λ 3 + 2.156 λ 4 1 + 0.13 λ 2 λ = 1 1 + ( a / R ) cos ( 0.85 θ ) g 3 = [ 1.13 0.09 ( a / b ) ] [ 1 + 0.1 ( 1 cos θ ) 2 ] [ 0.85 + 0.15 ( b / t ) 1 / 4 ] g 4 = 1 f θ = [ cos 2 θ + ( a b ) 2 sin 2 θ ] 1 / 4 f w = { sec ( π R 2 w ) sec [ π ( R + a ) 2 w b t ] } 1 / 2 E ( k ) = [ 1 + 1.464 ( a b ) 1.65 ] 1 / 2
Table 3. Empirical formula of the parameters.
w h e n   b / a 1 w h e n   b / a > 1
M 1 = 1.13 0.09 ( b a ) M 2 = 0.54 + 0.89 0.2 + ( b / a ) M 3 = 0.5 1.0 0.65 + ( b / a ) + 14 ( 1.0 b / a ) 24 g = 1 + [ 0.1 + 0.35 ( b t ) 2 ] ( 1 sin θ ) 2 f θ = [ ( b a ) 2 cos 2 θ + sin 2 θ ] 1 / 4 f w = [ sec ( π a 2 w b t ) ] 1 / 2 P = 0.2 + b a + 0.6 b t H 1 = 1 0.34 b t 0.11 b a ( b t ) H 2 = 1 + G 21 ( b t ) + G 22 ( b t ) 2 G 21 = 1.22 0.12 b a G 22 = 0.55 1.05 ( b a ) 0.75 + 0.47 ( b a ) 1.5 E ( k ) = [ 1 + 1.464 ( b a ) 1.65 ] 1 / 2 M 1 = a b ( 1 + 0.04 a b ) M 2 = 0.2 ( a b ) 4 M 3 = 0.11 ( a b ) 4 g = 1 + [ 0.1 + 0.35 ( a b ) ( b t ) 2 ] ( 1 sin θ ) 2 f θ = [ cos 2 θ + ( a b ) 2 sin 2 θ ] 1 / 4 f w = [ sec ( π a 2 w b t ) ] 1 / 2 P = 0.2 + a b + 0.6 b t H 1 = 1 G 11 ( b t ) G 12 ( b t ) 2 H 2 = 1 + G 21 ( b t ) + G 22 ( b t ) 2 G 11 = 0.04 0.41 ( a b ) G 12 = 0.55 1.93 ( a b ) 0.75 + 1.38 ( a b ) 1.5 G 21 = 2.11 + 0.77 ( a b ) G 22 = 0.55 0.72 ( a b ) 0.75 + 0.14 ( a b ) 1.5 E ( k ) = [ 1 + 1.464 ( a b ) 1.65 ] 1 / 2
Table 4. Mechanical properties of Ti-6Al-4V.
Elastic ModulusUltimate StrengthFracture ToughnessPoisson’s Ratio
E ( G P a ) σ b ( M P a ) K I C ( M P a m ) ν
11091378.30.34
Table 5. Long axis and short axis of six trace lines in the first stage (Units: mm).
No.ba
12.031.59
22.281.77
32.541.95
42.852.15
53.192.31
63.582.52
Table 6. Stress intensity factor comparison between empirical formula and finite element analysis results at different location of trace lines in the first stage of crack growth, Units: MPa*m1/2.
No.Formula 0°Numerical 0°Diff. (%)Formula 90°Numerical 90°Diff. (%)
123.5121.907.3928.9430.09−3.81
224.2723.602.8829.9530.98−3.30
325.0423.038.7530.9128.996.62
425.9523.4310.7631.7829.637.26
527.0326.083.6632.3630.057.69
628.1426.625.7433.1131.485.17
Table 7. Stress intensity factor comparison between empirical formula and finite element analysis results at different location of crack front in the second stage of crack growth, Units: MPa*m1/2.
No.FormulaNumerical (Average)Diff. (%)
129.1729.29−0.42
229.4029.280.42
329.6729.390.98
430.0229.432.01
530.4529.592.90
630.7929.524.30
731.1129.864.16
Table 8. Stress intensity factor comparison between empirical formula and finite element analysis results at different location of crack front in the third stage of crack growth, Units: MPa*m1/2.
No.Formula
180°
Numerical
180°
Diff. (%)Formula
(Average)
Numerical
(Average)
Diff. (%)
120.819.75.422.221.53.5
220.923.4−10.822.422.8−1.4
321.122.7−7.122.622.9−1.1
421.623.0−6.223.023.4−2.0
522.126.7−17.223.623.50.43
623.627.3−13.624.324.6−1.2
Table 9. Stress intensity factor comparison between empirical formula and finite element analysis results at different location of crack front in the third stage of crack growth. Units: MPa*m1/2.
No.Formula
180°
Numerical
180°
Diff. (%)Formula
(Average)
Numerical
(Average)
Diff. (%)
724.928.7−13.225.025.3−1.4
827.631.8−13.126.626.50.090
931.334.4−9.128.227.81.5
1036.236.6−0.9529.929.12.7
1145.040.012.432.231.23.0
1265.060.47.535.635.9−1.0
Publisher’s Note: MDPI stays neutral with regard to jurisdictional claims in published maps and institutional affiliations.