Article

Effect of Mischmetal Introduction on Hydrogen Storage Properties in Impure Hydrogen Gas of Ti-Fe-Mn-Co Alloys

1
Shanghai Institute of Microsystem and Information Technology, Chinese Academy of Sciences, Shanghai 200050, China
2
University of Chinese Academy of Sciences, Beijing 100049, China
*
Author to whom correspondence should be addressed.
Metals 2020, 10(12), 1574; https://doi.org/10.3390/met10121574
Submission received: 6 November 2020 / Revised: 19 November 2020 / Accepted: 20 November 2020 / Published: 25 November 2020

Abstract

:
The research aims to study the effect of adding mischmetal (Mm) to the TiFe0.86Mn0.07Co0.07 alloy on its hydrogen storage performance and cyclic stability. The results show that TiFe0.86Mn0.07Co0.07 + x% Mm (x = 0,4,6,8) alloys can be easily activated. The hydrogen absorption capacity of TiFe0.86Mn0.07Co0.07 + 4% Mm reaches 1.76 wt% (mass fraction) at 298 K. With the increase of Mm addition, the hydrogen storage capacity decreases slightly. Furthermore, after 40 absorption and desorption cycles in hydrogen containing 250 ppm O2, the alloy still has 36% of its initial hydrogen storage capacity, and the alloy can recover 93% of its hydrogen storage capacity through heat treatment.

1. Introduction

Energy is a global major issue in the 21st century. Hydrogen is an efficient, cheap, safe, and sustainable new energy vector, and it plays an important role in the human energy strategy. Hydrogen storage is a major problem that limits the development of hydrogen energy. At present, the commonly used hydrogen storage methods are hydrogen storage alloys, carbon-based hydrogen storage materials, liquid chemical hydrogen storage materials, etc. The metal hydrogen storage has the advantages of safety, reversibility, and rapid absorption and desorption. The TiFe-based hydrogen storage alloy has the advantages of low cost, large hydrogen storage capacity, and easy preparation, and is currently a commonly used hydrogen storage material. The TiFe-based alloy has a BCC structure and its theoretical hydrogen storage capacity is 1.86 wt% [1].
However, the TiFe-based alloy also has serious shortcomings. The activation procedure of the alloy is very difficult, and the hydrogen absorption and desorption plateau are inclined, so it cannot stably release hydrogen under the same pressure. In order to solve these problems, many studies have been conducted. Leng et al. [2] added Mn and Ce to the TiFe alloy, which greatly reduced the difficulty of alloy activation. Qu et al. [3] added Mn and Co to the TiFe alloy. Their research showed that the addition of Co can greatly flatten the hydrogen absorption and desorption plateau and make the alloy easier to activate. Gosselin and Huot [4] added Y to the TiFe alloy, and they found that Y can simplify the activation procedure of the alloy. Ali et al. [5,6] added Y and Cu to the TiFe0.86Mn0.1 alloy, and they detected that Y and Cu were formed into Cu4Y as a secondary phase, which made the activation procedure easier. Wu et al. [7] added Mm to the V-based alloys, and they found that the alloys can be easily activated. Jain et al. [8] added Zr7Ni10 to TiFe alloys and improved the first hydrogenation behavior of the alloy. It can be concluded that the formation of the secondary phase can reduce the difficulty of activation of TiFe alloy.
However, a problem that has not been solved yet is that the TiFe-based alloy has poor cyclic stability under impure hydrogen gas. As the alloy undergoes multiple cycles of absorption and desorption in hydrogen, the hydrogen storage capacity will decrease due to impurities in hydrogen gas. The same problem has occurred in other hydrogen storage alloys, and a lot of work has been done to solve the problem. Zhang et al. [9] studied the effects of oxygen and nitrogen on V-based hydrogen storage alloys. It was found that even if hydrogen is mixed with a very low concentration of oxygen, the alloys can hardly absorb any hydrogen. Shwartz et al. [10] studies the oxidation processes of H2O and O2 on TiFeMn alloys. They found that the composition and chemical state of the surfaces of the alloy will be changed. Sandrock and Goodell [11] found that LaNi5 has better cyclic stability under impure hydrogen gas than TiFe-based alloys. Shihai et al. [12] studied the effect of the rare-earth metal La in LaNi5 and La-Mg-N on the absorption and desorption properties of hydrogen in mixed hydrogen gas. They found that La plays an important role in the cyclic stability of the alloys. Ulmer et al. [13] studied the effect of adding rare-earth metals on the cyclic stability of V-Fe-Cr-Ti alloy in impure hydrogen gas. They found that adding rare-earth metals can improve the cycling stability in hydrogen containing oxygen. Facts have proved that rare-earth metals can significantly improve the cyclic stability under impure hydrogen gas of V-based hydrogen storage alloys. Fromm [14] studied the effect of the oxide layer on the hydrogen absorption kinetics of the alloy. Modi and Aguey-Zinsou [15] studied the recovery method of the poisoned TiFe-based alloys. However, the effect of rare-earth metals on TiFe alloys has never been studied.
The focus of this work is to improve the performance of TiFe-based alloys in impure hydrogen gas, especially in the mixing of hydrogen and oxygen. The TiFe0.86Mn0.07Co0.07 alloy [3] was used as the base alloy, which has excellent hydrogen absorption and desorption properties, and has been studied in our previous work. We hope that the addition of rare-earth elements (43% La, 56% Ce, 1% Pr, and Nd is easy to buy in the market, we call this metal mixture mischmetal) can improve the cyclic stability properties of the alloy and maintain its excellent hydrogen absorption and desorption properties.

2. Materials and Methods

The raw materials were bought from Aladdin. The purity of raw materials used in the experiment was higher than 99.5 wt%. Approximately 70 g of raw materials were added to the RF magnetic levitation that melted on water-cooled copper. An argon atmosphere was used to prevent oxidation of the materials. All alloys were measured without any homogenizing treatment such as annealing. The ingots were melted four times to ensure homogenization. After cooling, the ingots were cut into 30 meshes. ICP was used to test the chemical composition to ensure that the chemical composition of the alloy is the same as the designed alloy. To start the activation procedure, 3 g of the sample was placed in the reactor. The activation procedure includes: First, the alloy was vacuumed at room temperature for 30 min to remove the air attached to the surfaces of the alloy. Then, the reactor was heated to 773 K and kept under vacuum for 3 h. After cooling the reactor to room temperature, 3 MPa pure H2 was added to the reactor, and the alloy was allowed to absorb hydrogen for 2 h. The above procedure was repeated twice.
The activation procedure, PCT tests, and hydrogen absorption cycle tests were carried out in the YJ-2 automatic PCT test equipment. The XRD tests were performed using the RigakuD/MAX-2200/PC diffractometer with a CuKα radiation to determine the phases and corresponding lattice parameters. SEM and EDX tests were performed using FEI Nova Nano SEM 450 to show the metallographic microstructures. In order to explain the oxygen poisoning mechanism of the alloys, hydrogen mixed with 250 ppm oxygen was used to test the hydrogen absorption cycle performances, by setting the test time to 30 min and recording the pressure in the reactor. After 40 cycles, the XPS tests were used to detect the chemical composition on the surface and inside of the alloy. The XPS equipment is Thermo Fisher K-Alpha X. Finally, the recovery method to restore the poisoned alloy to its origin properties was studied. Our recovery procedure is: First, fill the alloy with 99.999% hydrogen until the pressure reaches 3 MPa. After the alloy has fully absorb the hydrogen, the alloy is heated to 773 K and kept in a vacuum for 10 min to force the alloy to release hydrogen quickly. Through a certain number of hydrogen absorption and desorption cycles, the alloy can restore the original hydrogen absorption and desorption capacity.

3. Results and Discussion

3.1. Composition and Structure Analysis

Figure 1 shows the XRD patterns of TiFe0.86Mn0.07Co0.07 + x% Mm (x = 0,4,6,8) alloys. Figure 1a shows that all the alloys show a single BCC phase. In Figure 1b, La, Ce, and their oxide phases can be detected. As a result, it proves that rare-earth metals are insoluble in the TiFe phase. It is worth noting that the XRD peaks show that Mn and Co are not identified in the patterns, indicating that Mn and Co have replaced the Fe and solid solution in the TiFe phase, which is consistent with the conclusions of Qu [3].
The lattice parameters were analyzed by the Jade6.5 software, and the results are listed in Table 1. It can be seen that after adding Mm, the lattice parameters of the main BCC phase do not change obviously, which further shows that the rare-earth elements are insoluble in the TiFe phase.

3.2. Activation Performance
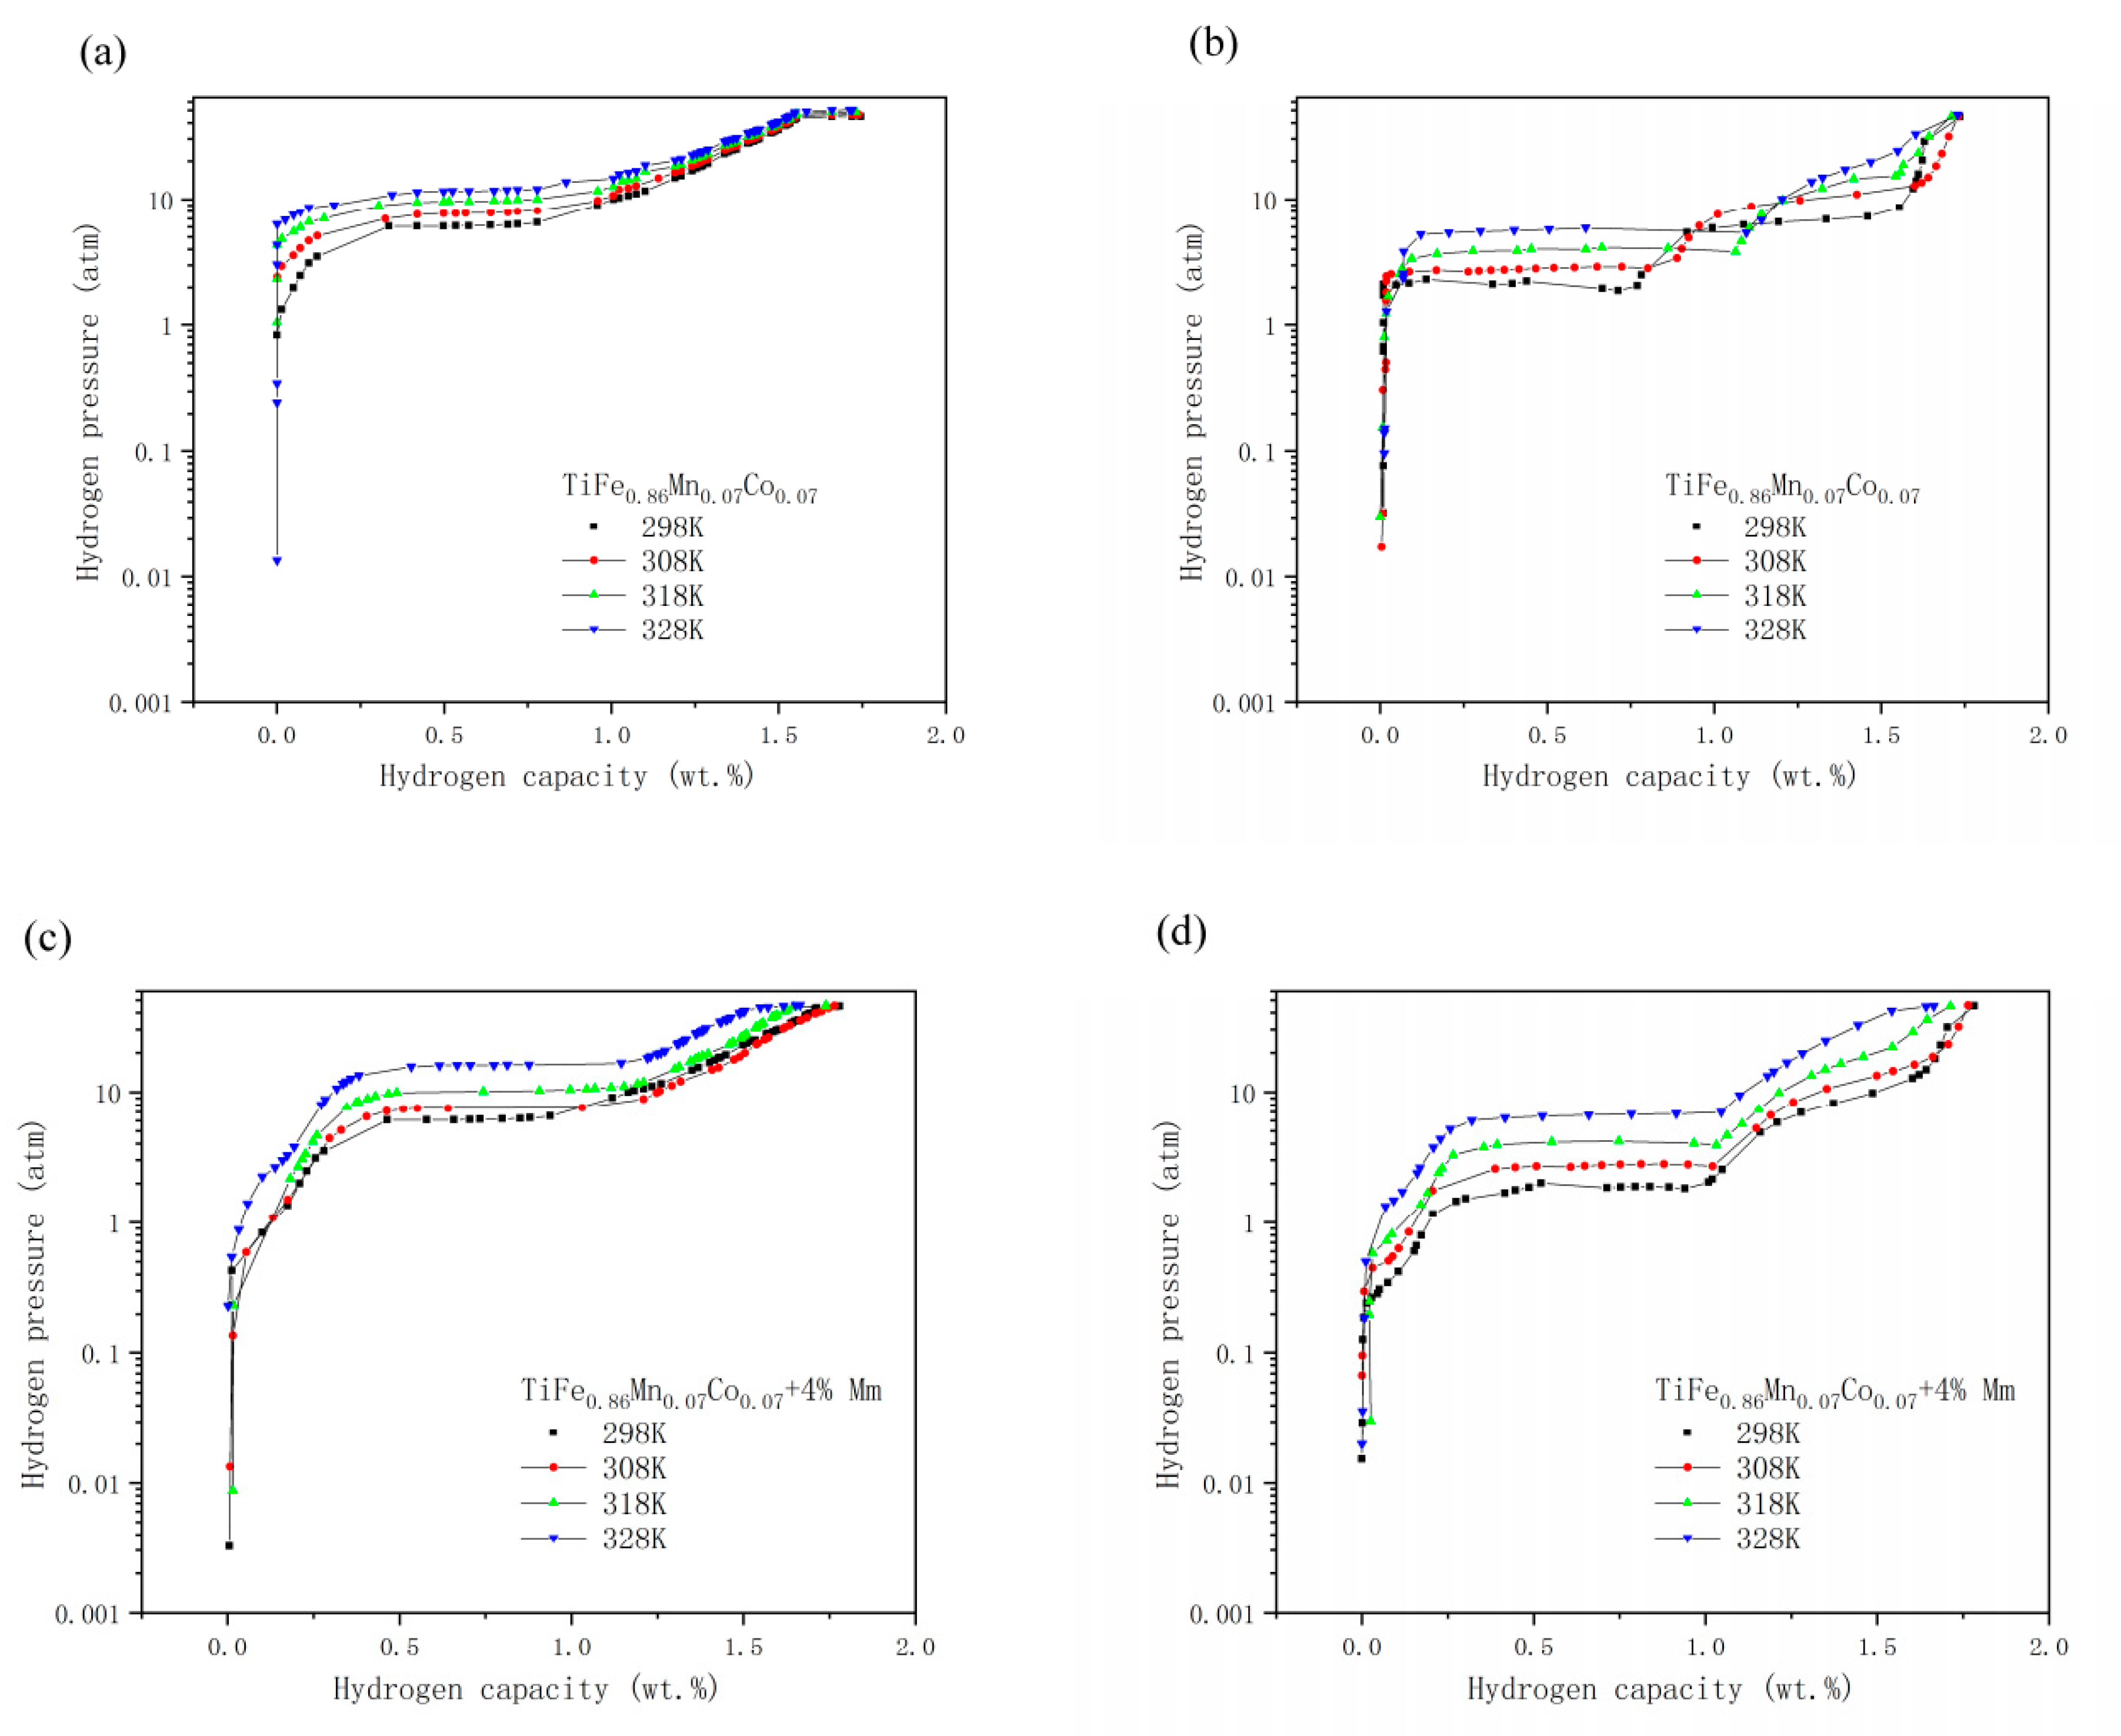
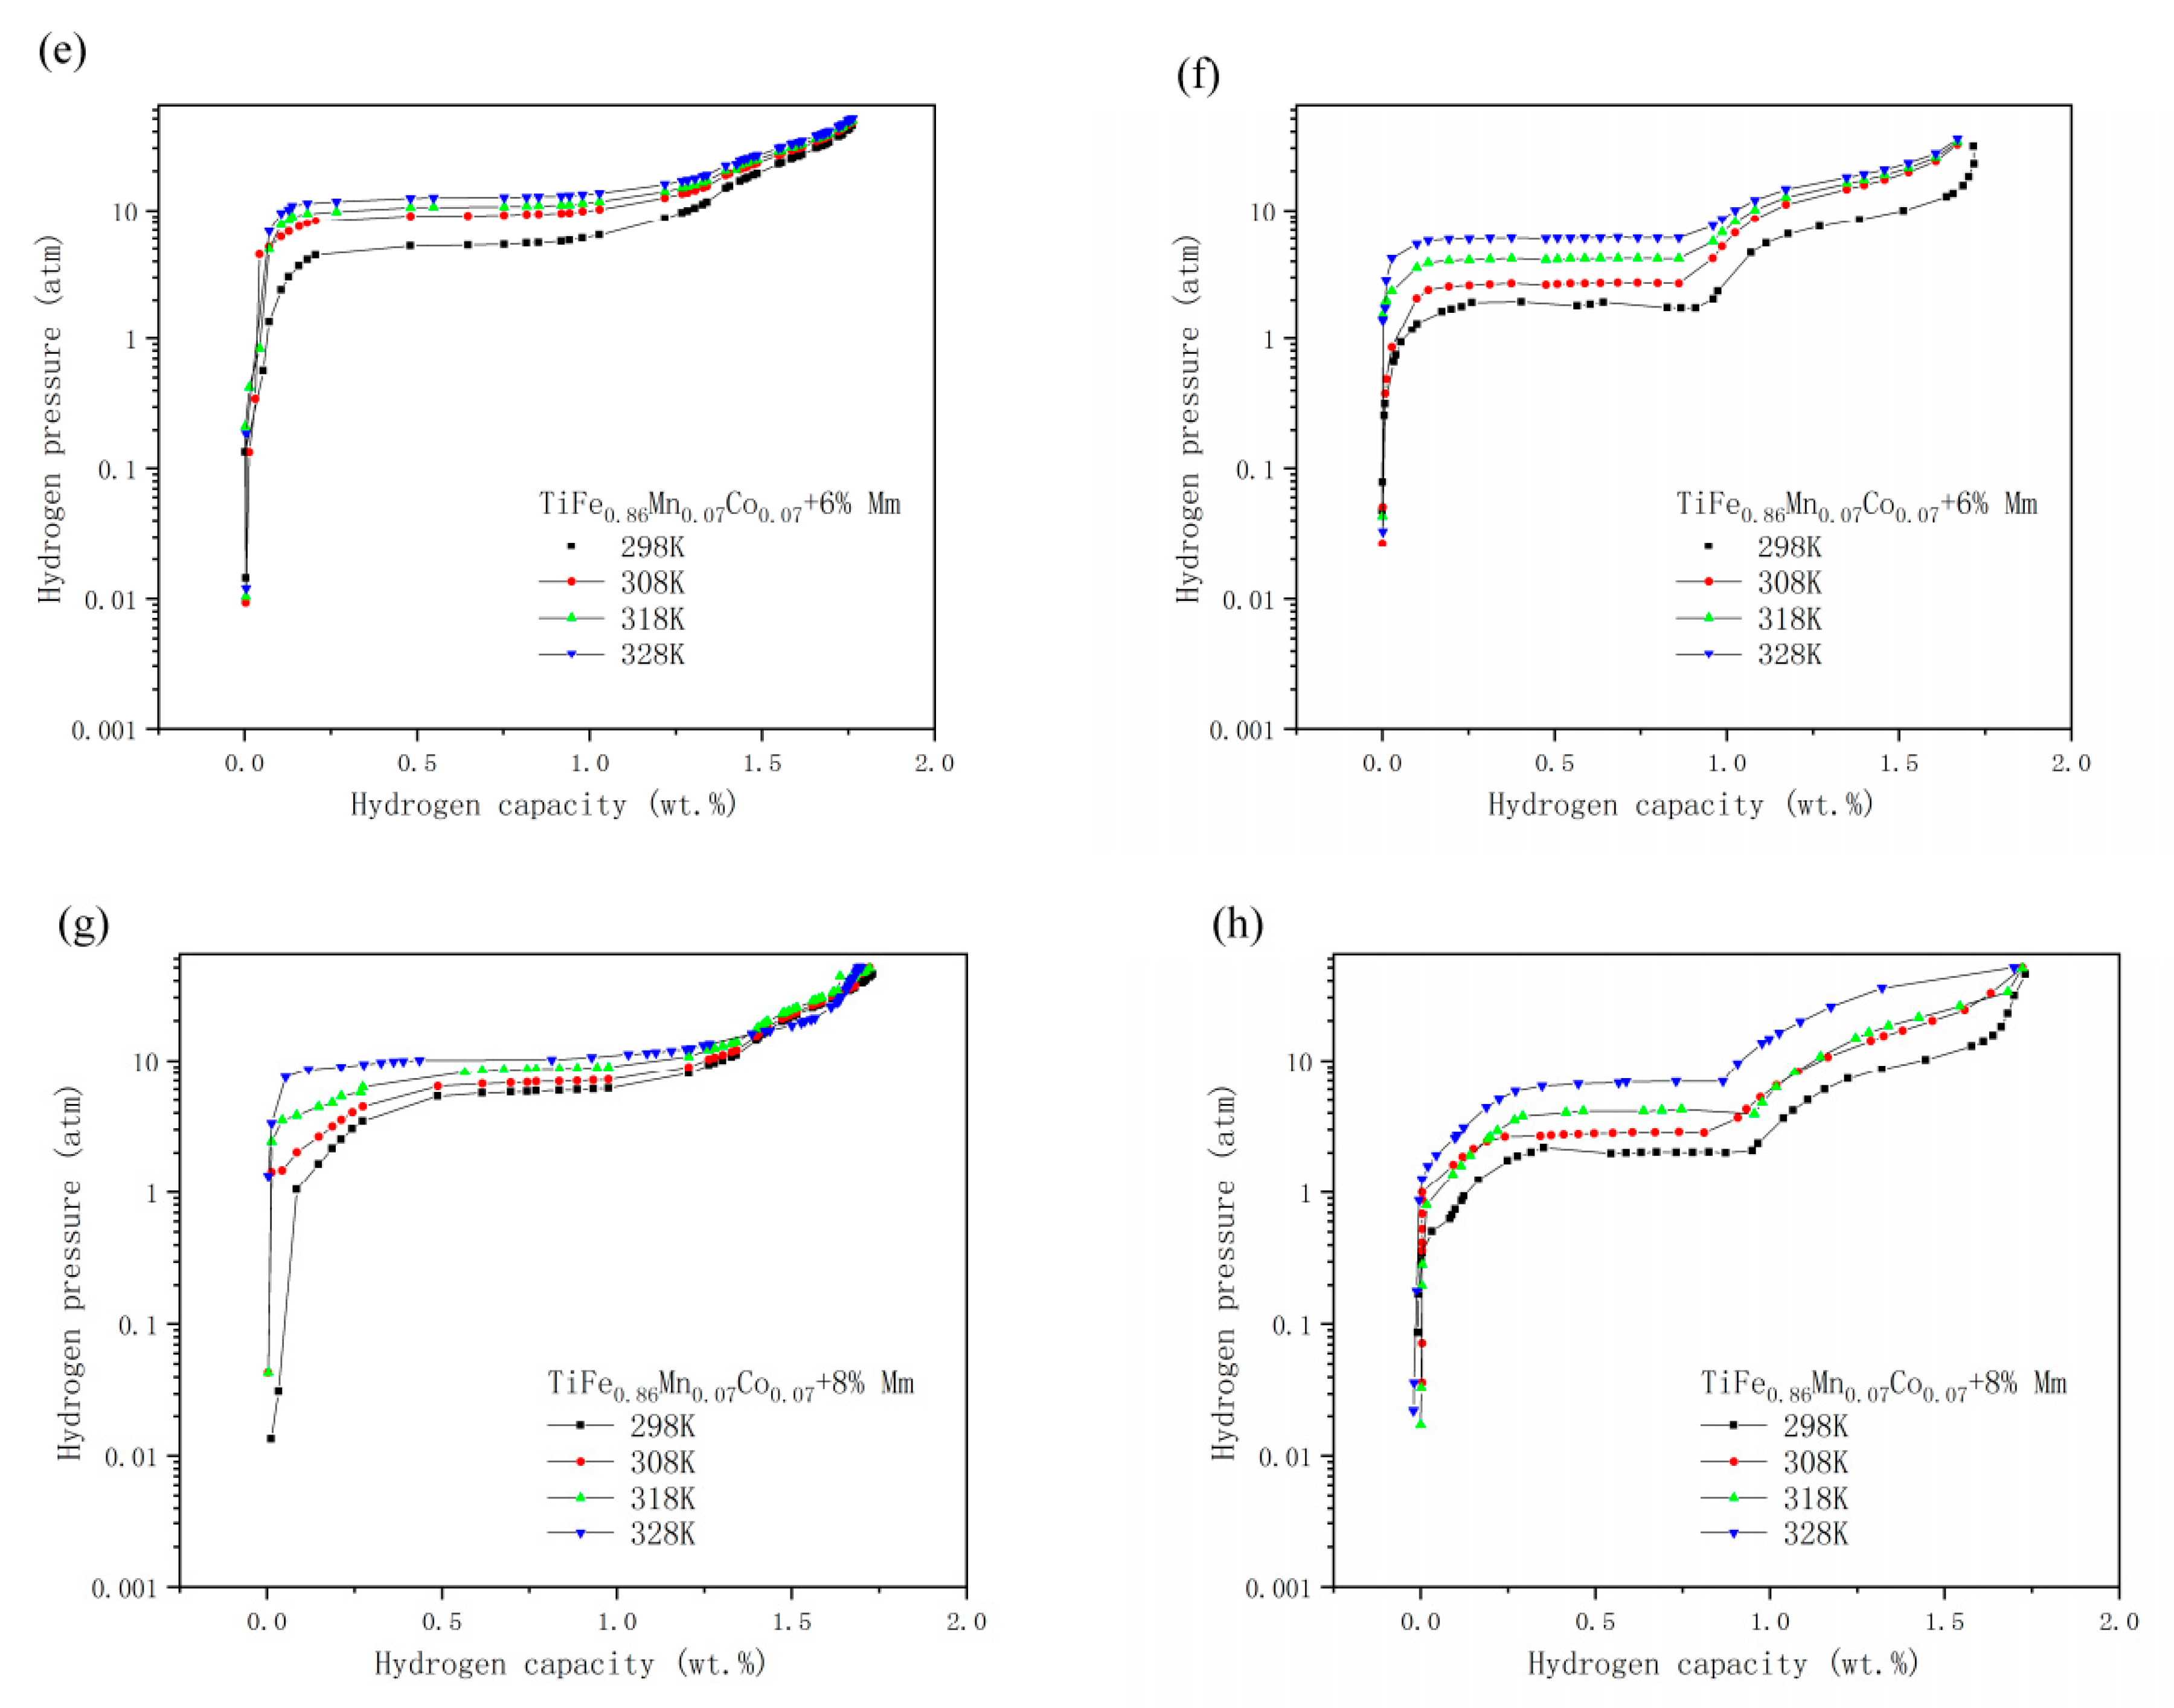
The activation procedure of the alloy was carried out in the PCT test equipment. The hydrogen storage capacity of each activated alloy was calculated by the changes of hydrogen pressure in the reactor.
The activation performance of TiFe0.86Mn0.07Co0.07 + x% Mm (x = 0,4,6,8) alloys is shown in Table 2. The hydrogen absorption capacity of the alloy in the second activation procedure is similar to that of the third activation procedure, which indicates that the alloy has been fully activated after two activation cycles.
After PCT tests, the as-cast TiFe0.86Mn0.07Co0.07 + x% Mm (x = 4,6,8) alloys were tested by SEM and the results are shown in Figure 2. It can be seen that the surface of the as-cast alloy is smooth, hydrogen is difficult to enter the alloy body, and the hydrogen absorption rate of the alloy is slow, which is consistent with the hydrogen absorption properties of the alloy in the first activation process. After complete activation, cracks appear on the surface of the alloy, which increases the surface of the alloy by forming cracks and improves the kinetic performance. Moreover, the grain size of the as-cast alloys after PCT tests remains unchanged, which indicates that the pulverization of TiFe0.86Mn0.07Co0.07 + x% Mm (x = 0,4,6,8) alloys can be controlled by adding Co, and this is consistent with the conclusions of Qu [3].

3.3. PCT Tests

Before the PCT tests, all the alloys were fully activated. The PCT tests were carried out at 298, 308, 318, and 328 K. The result is shown in Figure 3.
With the increasing amount of Mm, the hydrogen storage capacity decreases gradually. All the hydrogen storage capacity of the alloys at 298 K is shown in Table 3. TiFe0.86Mn0.07Co0.07 + 4% Mm has the highest hydrogen storage capacity among the Mm doped alloys. Yao et al. [16] indicates that the addition of rare-earth alloys will tilt the hydrogen absorption and desorption plateau. While for TiFe0.86Mn0.07Co0.07 + x% Mm (x = 0,4,6,8) alloys, the increase of Mm has no obvious tendency to tilt the hydrogen absorption and desorption plateau. Similar to TiFe0.86Mn0.07Co0.07, the Mm doped alloys have two obvious hydrogen desorption plateaus, which indicated two hydrogen reactions, respectively. TiFe0.86Mn0.07Co0.07 + 6% Mm has the best hydrogen desorption plateau. It is the first hydrogen desorption plateau that contains a 0.91 wt% hydrogen capacity.
Under the desorption pressures of 0.773 wt%, the Van’t Hoff plots of lnp vs. 1000/T for dehydrogenation of TiFe0.86Mn0.07Co0.07 + x% Mm (x = 4,6,8) alloys are shown in Figure 4. All three different alloys can fit a straight line. The enthalpy change (ΔHd) and entropy change ΔSd) of the alloy during hydrogen desorption can be calculated by the Van’t Hoff Equation. The results are listed in Table 3.

3.4. Hydrogen Absorption Cycle Stability Tests

The cycle stability tests of the alloy were carried out in the PCT test equipment. First, the test was carried out under pure hydrogen. The hydrogen absorption capacity of the alloy was recorded by the pressure change in the reactor, and the initial pressure was 3 MPa. A 30-min hydrogen absorption of the alloy under pure hydrogen was set as the reaction timetable ξ = 1. The alloy was then evacuated for 15 min using a vacuum pump to release hydrogen. After that, the pure hydrogen was changed to hydrogen containing 250 ppm O2. All these steps were carried out at 298 K. The stability test results are shown in Figure 5 and Figure 6. The number on the curves represents the number of cycles.
From Figure 5, we can find that after 15 cycles, TiFe0.86Mn0.07Co0.07 hardly absorbs hydrogen containing 250 ppm oxygen.
From Figure 6, it can be seen that all the alloys can absorb most of the hydrogen within 3 min. After six cycles, the hydrogen absorption capacity of the alloy decreased obviously, and as the number of cycles increases, the hydrogen absorption capacity decreases sequentially. As shown in Figure 6b,d,f, after 40 hydrogen absorption cycles, the alloy can still absorb about 40% of hydrogen compared to the original alloy.
In Figure 7, it can be seen that the increase in Mm cannot improve the cyclic stability property of the alloy. However, the greater the amount of Mm added, the lower the hydrogen storage capacity we can obtain from the alloy. Therefore, we believe that TiFe0.86Mn0.07Co0.07 + 4% Mm is the best choice.

3.5. Cyclic Stability Mechanism Analysis

The SEM and EDS results of TiFe0.86Mn0.07Co0.07 + 4% Mm are shown in Figure 8 and Table 4. It can be seen that La and Ce are oxidized and become small agglomerates (0.5~5 μm), which exist on the surface of the alloy.
We call the TiFe0.86Mn0.07Co0.07 + 4% Mm alloy as “poisoned alloy”, which contains 250 ppm O2 after undergoing 40 cycles of absorption and desorption of hydrogen. The XPS tests were carried out on the “poisoned alloy”, and the results are shown in Figure 9. There are two peaks in the La3d5/2 XP spectrum, which appear in 835.62 and 839.29 eV, respectively, indicating that La is oxidized and becomes La3+ on the surface and inside of the alloy. Similarly, the Ce3d5/2 XP spectrum has two peaks at 882.13 and 886.08 eV, respectively. According to the position and intensity distribution of these peaks, Ce is oxidized and becomes Ce3+. The Ti 2p XP and Fe 2p XP spectrums also indicate that TiO2 as well as FeO and Fe2O3 were formed on the surface of the alloy. Furthermore, Ti and Fe were detected in the alloy. We conclude that the decrease in hydrogen storage capacity of the “poisoned alloy” is due to the oxidation of the TiFe main phase on the surface of the alloy. The TiFe main phase in the alloy can still regularly absorb and release hydrogen.
The TiFe0.86Mn0.07Co0.07 alloy can hardly absorbs impure hydrogen after 15 cycles, since hydrogen splitting does not occur on the surface of oxidized Ti-Fe-Mn-Co, thereby preventing further reaction between hydrogen and the alloy. Adding Mm to Ti-Fe-Mn-Co will form small agglomerates of oxidized rare-earth metal on the surface and inside of the alloy. As shown in Figure 10, we believe that small agglomerates of oxidized rare-earth metal on the surface of the alloy act as channels for hydrogen to enter the alloy body. Hydrogen splitting occurs at the interface between the oxidized rare-earth metal and the TiFe phase in the alloy. This is due to the fact that Ti, Fe, Mn, and Co have a higher hydrogen separation potential than that of La and Ce [13,17,18]. This can explain why the “poisoned alloy” can still absorb hydrogen after 15 cycles, while the source alloy hardly absorbs any hydrogen. It is worth noting that the small agglomerates of oxidized Mm in the alloy do not contribute to the cyclic stability, which may explain why adding more Mm to the alloy does not improve the cyclic stability of the alloy.
It is worth mentioning that the hydrogen absorption rate of the alloy in impure hydrogen is obviously faster than that in pure hydrogen. This is due to the fact that the secondary phase in the alloy is oxidized by O2 to form a more active phase. Meanwhile, the number of interfaces between the secondary phase and the TiFe phase increases. Therefore, more and more channels of hydrogen enter the alloy, which accelerates the hydrogen absorption rate of the alloy.
The recovery test of the alloy was performed and the test results are shown in Figure 11. It can be seen that after 10 cycles of pure hydrogen absorption, the alloy basically recovered the initial kinetic characteristics, indicating that the alloy has a good regeneration property.

4. Conclusions

In summary, (1) when adding Mm to the TiFe0.86Mn0.07Co0.07 alloy, Mm is insoluble in the main phase of BCC TiFe and it forms an independent rare-earth alloy phase. (2) Adding Mm to the TiFe0.86Mn0.07Co0.07 alloy does not tilt the hydrogen absorption and desorption plateau of the alloy. As the amount of Mm increases, the hydrogen storage capacity decreases sequentially. (3) Mischmetal can effectively enhance the cyclic stability properties of the alloy in impure hydrogen gas containing oxygen. When the doping amount of Mm is greater than 4%, the addition of Mm has little effect on the cyclic stability properties. (4) After being poisoned, the TiFe0.86Mn0.07Co0.07 + 4% Mm alloy can recover 93% of its initial hydrogen absorption and desorption capacity through heat treatment, while through a vacuum and absorption of pure hydrogen for several cycles.

Author Contributions

Conceptualization, Z.W.; investigation, R.S., C.P., X.X., Y.X., and Z.L.; writing—review and editing, R.S. All authors have read and agreed to the published version of the manuscript.

Funding

This research received no external funding.

Conflicts of Interest

The authors declare no conflict of interest. The funders had no role in the design of the study; in the collection, analyses, or interpretation of data; in the writing of the manuscript, or in the decision to publish the results.

References

  1. Reilly, J.J.; Wiswall, R.H. Formation and Properties of Iron Titanium Hydride. Inorg. Chem. 1974, 13, 77–112. [Google Scholar] [CrossRef]
  2. Leng, H.; Yu, Z.; Yin, J.; Li, Q.; Wu, Z.; Chou, K.-C. Effects of Ce on the hydrogen storage properties of TiFe0.9Mn0.1 alloy. Int. J. Hydrogen Energy 2017, 42, 23731–23736. [Google Scholar] [CrossRef]
  3. Qu, H.; Du, J.; Pu, C.; Nyu, Y.; Huang, T.; Li, Z.; Lou, Y.; Wu, Z. Effects of Co introduction on hydrogen storage properties of Ti–Fe–Mn alloys. Int. J. Hydrogen Energy 2015, 40, 2729–2735. [Google Scholar] [CrossRef]
  4. Gosselin, C.; Huot, J. First Hydrogenation Enhancement in TiFe Alloys for Hydrogen Storage Doped with Yttrium. Metals 2019, 9, 242. [Google Scholar] [CrossRef] [Green Version]
  5. Ali, W.; Li, M.; Gao, P.; Wu, C.; Li, Q.; Lu, X.; Li, C.-H. Hydrogenation properties of Ti-Fe-Mn alloy with Cu and Y as additives. Int. J. Hydrogen Energy 2017, 42, 2229–2238. [Google Scholar] [CrossRef]
  6. Ali, W.; Hao, Z.; Li, Z.; Chen, G.; Wu, Z.; Lu, X.; Li, C.-H. Effects of Cu and Y substitution on hydrogen storage performance of TiFe 0.86Mn0.1Y0.1−xCux. Int. J. Hydrogen Energy 2017, 42, 16620–16631. [Google Scholar] [CrossRef]
  7. Wu, C.L.; Yan, Y.G.; Chen, Y.G.; Tao, M.D.; Zheng, Z. Effect of rare earth (RE) elements on V-based hydrogen storage alloys. Int. J. Hydrogen Energy 2008, 33, 93–97. [Google Scholar] [CrossRef]
  8. Jain, P.; Gosselin, C.; Skryabina, N.; Fruchart, D.; Huot, J. Hydrogenation properties of TiFe with Zr7Ni10 alloy as additive. J. Alloy. Compd. 2015, 636, 375–380. [Google Scholar] [CrossRef]
  9. Zhang, T.; Yang, X.; Lionel, G.; Hu, R.; Xue, X.; Fu, H. On the poisoning effect of O2 and N2 for the Zr0.9Ti0.1V2 hydrogen storage alloy. J. Power Sources 2012, 202, 217–224. [Google Scholar] [CrossRef]
  10. Shwartz, A.; Shamir, N.; Zlakind, S.; Edry, I.; Haim, I.; Mintz, M.H. Initial oxidation of TiFe1−xMnx (x = 0–0.3) by low dose exposures to H2O and O2. J. Alloy. Compd. 2014, 610, 6–10. [Google Scholar] [CrossRef]
  11. Sandrock, G.; Goodell, P. Surface poisoning of LaNi5, FeTi and (Fe,Mn) Ti by O2, CO and H2O. J. Less Common Met. 1980, 73, 161–168. [Google Scholar] [CrossRef]
  12. Shihai, G.; Guoqing, W.; Dongliang, Z.; Yanghuan, Z.; Xinlin, W. Study on Hydrogen in Mixed Gas Separated by Rare Earth Hydrogen Storage Alloys. Rare Metal. Mat. Eng. 2011, 40, 189–194. [Google Scholar] [CrossRef]
  13. Ulmer, U.; Oertel, D.; Diemant, T.; Minella, C.M.; Bergfeldt, T.; Dittmeyer, R.; Behm, R.J.; Fichtner, M. Performance Improvement of V-Fe-Cr-Ti Solid State Hydrogen Storage Materials in Impure Hydrogen Gas. ACS Appl. Mater. Interfaces 2017, 10, 1662–1671. [Google Scholar] [CrossRef] [PubMed]
  14. Fromm, E. Effect of Oxide Layers on the Absorption Kinetics of Hydrogen by Metals at Room Temperature. Z. Phys. Chem. 1986, 147, 61–75. [Google Scholar] [CrossRef]
  15. Modi, P.; Aguey-Zinsou, K.-F. Titanium-iron-m manganese (TiFe0.85Mn0.15) alloy for hydrogen storage: Reactivation upon oxidation. Int. J. Hydrogen Energy 2019, 44, 16757–16764. [Google Scholar] [CrossRef]
  16. Yao, Z.; Liu, L.; Xiao, X.; Wang, C.; Jiang, L.; Chen, L. Effect of rare earth doping on the hydrogen storage performance of Ti1.02Cr1.1Mn0.3Fe0.6alloy for hybrid hydrogen storage application. J. Alloy. Compd. 2018, 731, 524–530. [Google Scholar] [CrossRef]
  17. Groß, A. Hydrogen Dissociation on Metal Surfaces—A Model System for Reactions on Surfaces. Appl. Phys. A Mater. Sci. Process. 1998, 67, 627–635. [Google Scholar] [CrossRef] [Green Version]
  18. Karen, P.; Kjekshus, A. Phase Diagrams and Thermodynamic Properties. In Handbook on the Physics and Chemistry of Rare Earths; Gschneider, K.A., Eyring, L., Maple, M.B., Eds.; Elsevier: Amsterdam, The Netherlands, 2000; Volume 30, pp. 229–373. [Google Scholar]
Figure 1. XRD patterns of TiFe0.86Mn0.07Co0.07 + x% Mm (x = 0,4,6,8) alloys. (a) 20~120 degree; (b) 20~40 degree.
Metals 10 01574 g001
Figure 2. SEM micrographs of (a,b) TiFe0.86Mn0.07Co0.07 + 4% Mm alloys; (c,d) TiFe0.86Mn0.07Co0.07 + 6% Mm alloys; and (e,f) TiFe0.86Mn0.07Co0.07 + 8% Mm alloys. (a,c,e) As-cast; (b,d,f) After pressure-composition (P–C) isotherms tests.
Metals 10 01574 g002
Figure 3. Absorption and desorption pressure-composition (P–C) isotherms of TiFe0.86Mn0.07Co0.07 + x% Mm (x = 0,4,6,8) alloys. (a,c,e,g) Absorption; (b,d,f,h) Desorption.
Metals 10 01574 g003aMetals 10 01574 g003b
Figure 4. Van’t Hoff plots of TiFe0.86Mn0.07Co0.07 + x% Mm (x = 4,6,8) alloys.
Metals 10 01574 g004
Figure 5. Hydrogen absorption kinetic curves of TiFe0.86Mn0.07Co0.07 at 3 MPa of pure H2 and H2 containing 250 ppm of O2 at 298 K.
Metals 10 01574 g005
Figure 6. Hydrogen absorption kinetic curves of TiFe0.86Mn0.07Co0.07 + x% Mm (x = 4,6,8) at 3 MPa of pure H2 and H2 containing 250 ppm of O2 at 298 K. (a,b) TiFe0.86Mn0.07Co0.07 + 4% Mm; (c,d) TiFe0.86Mn0.07Co0.07 + 6% Mm; (e,f) TiFe0.86Mn0.07Co0.07 + 8% Mm.
Metals 10 01574 g006
Figure 7. The cycle stability of TiFe0.86Mn0.07Co0.07 + x% Mm (x = 0,4,6,8) alloys in H2 containing 250 ppm O2.
Metals 10 01574 g007
Figure 8. SEM micrographs of as-cast TiFe0.86Mn0.07Co0.07 + 4% Mm.
Metals 10 01574 g008
Figure 9. Ti 2p (a,b); Fe 2p (c,d); La 3d (e,f); Ce 3d (g,h); and O 1s (i,j) XP spectrum of TiFe0.86Mn0.07Co0.07 + 4% Mm after 40 cycles in H2 containing 250 ppm O2.
Metals 10 01574 g009aMetals 10 01574 g009b
Figure 10. Cyclic stability mechanism of TiFe-based alloys with Mm oxides.
Metals 10 01574 g010
Figure 11. Hydrogen absorption recovery kinetics curves of TiFe0.86Mn0.07Co0.07 + 4% Mm at 3 MPa of pure H2 at 298 K.
Metals 10 01574 g011
Table 1. The chemical composition and crystallographic data of TiFe0.86Mn0.07Co0.07 + x% Mm (x = 0,4,6,8).
xChemical CompositionSpace GroupLattice Parameter(Å)
0TiFe0.8587Mn0.0702Co0.0695Pm-3m2.97657
4TiFe0.8487Mn0.0710Co0.0691 + 4.123% MmPm-3m2.97226
6TiFe0.8543Mn0.0721Co0.0689 + 5.935% MmPm-3m2.97302
8TiFe0.8562Mn0.0699Co0.0703 + 8.024% MmPm-3m2.97239
Table 2. Activation properties of TiFe0.86Mn0.07Co0.07 + x% Mm (x = 0,4,6,8) alloys at 298 K.
xActivate TimesInitial Pressure (atm)Pressure after 3 h (atm)Δp (atm)
4147.0039.417.59
247.2134.5012.71
348.0635.2412.82
6147.8241.176.65
247.4935.8611.63
348.0035.6612.34
8147.0337.589.45
248.0435.5212.52
348.0535.5812.47
Table 3. Hydrogen storage characteristics linear fitting parameters of TiFe0.86Mn0.07Co0.07 + x% Mm (x = 4,6,8) alloys.
xCmax (wt%)ΔHd (kJ/mol)ΔSd (J/K·mol)Standard ErrorR-Square
InterceptSlope
41.76−34.59−121.150.42680.133340.99693
61.73−35.86−124.820.30240.094470.99856
81.72−33.07−116.470.92400.288680.98436
Table 4. Elemental analysis of as-cast TiFe0.86Mn0.07Co0.07 + 4% Mm.
AlloysZoneTi wt%Fe wt%Mn wt%Co wt%La wt%Ce wt%O wt%
TiFe0.86Mn0.07Co0.07 + 4%A0.530.510.040.0442.1342.0614.69
B43.2043.934.013.710.540.414.20
C0.490.500.040.0342.0542.2114.68
Publisher’s Note: MDPI stays neutral with regard to jurisdictional claims in published maps and institutional affiliations.

