Article

Characterization and Modeling of Intermetallic Phase Formation during the Joining of Aluminum and Steel in Analogy to Co-Extrusion

1
Institut für Umformtechnik und Umformmaschinen (Forming Technology and Machines), Leibniz Universität Hannover, 30823 Garbsen, Germany
2
Institut für Werkstoffkunde (Materials Science), Leibniz Universität Hannover, 30823 Garbsen, Germany
*
Author to whom correspondence should be addressed.
Metals 2020, 10(12), 1582; https://doi.org/10.3390/met10121582
Submission received: 30 October 2020 / Revised: 20 November 2020 / Accepted: 24 November 2020 / Published: 26 November 2020
(This article belongs to the Special Issue Hybrid Bulk Metal Components)

Abstract

:
The reinforcement of light metal components with steel allows to increase the strength of the part while keeping the weight comparatively low. Lateral angular co-extrusion (LACE) offers the possibility to produce hybrid coaxial profiles consisting of steel and aluminum. In the present study, the effect of the process parameters temperature, contact pressure and time on the metallurgical bonding process and the development of intermetallic phases was investigated. Therefore, an analogy experiment was developed to reproduce the process conditions during co-extrusion using a forming dilatometer. Based on scanning electron microscopy analysis of the specimens, the intermetallic phase seam thickness was measured to calculate the resulting diffusion coefficients. Nanoindentation and energy dispersive X-ray spectroscopy measurements were carried out to determine the element distribution and estimate properties within the joining zone. The proposed numerical model for the calculation of the resulting intermetallic phase seam width was implemented into a finite element (FE) software using a user-subroutine and validated by experimental results. Using the subroutine, a numerical prediction of the resulting intermetallic phase thicknesses is possible during the tool design, which can be exploited to avoid the weakening of the component strength due to formation of wide intermetallic phase seams.

1. Introduction

The industrial efforts to reduce the mass of vehicles in order to save fuel and reduce CO2 emissions result, inter alia, in the use of hybrid components and thus in the demand for new joining techniques of dissimilar materials. In order to achieve a reduction in mass at low cost, the combination of aluminum and steel has lately received substantial attention. The joining of 6xxx series aluminum alloys and steel has extensively been investigated using several joining processes, such as laser welding [1], friction stir welding [2], friction welding [3], compound forging [4] or co-extrusion [5]. The occurrence of intermetallic phases presents a challenge for both fusion welding and solid-state joining processes, as these phases are very hard and brittle and can reduce the strength of the hybrid component. Control of the resulting phase seam width is therefore essential to achieve reliable compounds [6]. The growth of intermetallic phases is diffusion controlled, and thus strongly dependent on the prevailing temperature and time [7].
Intermetallic phases typically exhibit low crystal symmetry, which curtails dislocation movements. Due to the low mobility of the dislocations, intermetallic phases are generally characterized by high hardness values and a particularly brittle material behavior [8]. For this reason, the thickness of the intermetallic phase seam is an indispensable aspect in assessing the strength of hybrid components. Intermetallic phase seams with a given width often consist of different intermetallic phases, which in the case of the Fe-Al system, are Fe3Al, FeAl, FeAl2, Fe2Al5 and FeAl3. When joining aluminum and steel in the solid state, the phase Fe2Al5 is mainly formed [9].
The effect of intermetallic phases on the mechanical properties of a joint has been evaluated by several authors. Yamamoto et al. report a linear decrease in the joint strength with an increase in the thickness of the intermetallic layer [10]. Kimapong and Watanabe state that the joint strength increases exponentially with a decrease in the intermetallic seam thickness [11]. Yilmaz et al. determined that the highest strength can be achieved by the thinnest possible intermetallic phase in friction welding [12]. According to Fukuora, even with a thickness of the intermetallic layer less than 1 μm, the joint demonstrated premature fracture at the interface in friction bonding of high-strength Al alloys to steels [13].
Clearly, it is crucial for these hybrid materials to control the thickness of the intermetallic phase seam that forms at the interface during bonding and to characterize its properties, especially the mechanical ones. Nanoindentation enables to probe the local hardness at the nanometer scale, and was used by several authors to investigate the mechanical properties of intermetallic phases. Ogura et al. determined the nano hardness of different Fe-Al intermetallic phases. They stated that the nano hardness of intermetallic phases of type FexAly increases with increasing proportion of aluminum, with the exception of the FeAl3 phase, which is less hard than FeAl2 and Fe2Al5. The increase in hardness can be explained by the increasing complexity of the lattice structures [6].
Within the framework of the Collaborative Research Centre 1153, co-extrusion is used to produce coaxial hybrid profiles of aluminum and steel. In the further course of the process chain, these profiles are used as joined hybrid semi-finished workpieces for the die forging of bearing bushings. The use of already joined semi-finished workpieces allows a geometrical and thermomechanical tailoring of the joining zone, resulting in improved mechanical properties. For a sufficient formability of these hybrid semi-finished products, the intermetallic phase seam must not exceed a certain size after co-extrusion. In order to consider the resulting phase seam thickness already in the numerical process design, a phenomenological model was developed that can predict the phase seam width during the post-processing of a commercial finite element (FE) system. In the present study, the influence of the process parameters temperature, time and force on the resulting intermetallic phase seam thickness were investigated using analogy experiments and subsequent scanning electron microscopy (SEM) analysis. In the following, the numerical model being developed and its implementation into the FE software are presented. The parameters required to describe the development of the intermetallic phase seam thickness were determined from the analogy experiment. To correlate the properties of the joining zone with the formed intermetallic phases, additional nanoindentation and energy dispersive X-ray measurements (EDS) were carried out.

2. Materials and Methods

2.1. Experimental Procedure

An experimental setup for analogy experiments was developed in order to simulate the boundary conditions physically during co-extrusion on a laboratory scale and to be able to set them independently, see Figure 1a. The specimens, consisting of two steel cylinders (20MnCr5, AISI 5120), an aluminum cylinder (AlMgSi1, EN AW-6082) and a steel sleeve, were placed on a forming dilatometer DIL 805 A/D + T (BÄHR Thermoanalyse GmbH, Hüllhorst, Germany) between two deformation punches to which the forming force was applied. The steel cylinders and the aluminum cylinder had a diameter of 5 mm and 3 mm, respectively. The diameter of the aluminum specimen was chosen to be smaller in order to break up the surface layers during forming, analogous to the co-extrusion process. A steel sleeve was used to prevent the aluminum specimen from being displaced between the steel specimens and to obtain higher stresses than the yield stress of aluminum. An external induction coil realized the heating of the specimen. The temperature was controlled by a thermocouple (TC, type K) welded to the outside of the sleeve. To minimize temperature gradients and avoid oxidation effects, the experiments were carried out in a vacuum of 3.5 × 10⁻³ Pa. The vacuum was generated by means of a vacuum pump integrated in the dilatometer.
The temperature–time course employed during the experiments is shown schematically in Figure 1b. The jagged line indicates the actual forming. In the first step, the specimens were heated to the respective forming temperature TF with a heating rate of 8 K/s and kept at TF for 240 s to ensure a near homogeneous temperature distribution. The subsequent forming was force-controlled by a pre-defined forming force F. The force was applied and maintained over the given time period tF. After forming, the specimens were cooled to room temperature by nitrogen with a rate of 30 K/s.
For the reference specimen, a temperature TF of 560 °C, a forming force F of 5890 N, and a forming time tF of 120 s were used. Based on this parameter configuration, time, force and temperature were varied to determine their influence on the resulting thickness of the intermetallic phase seam. The parameter matrix employed is shown in Table 1. The temperature, time and force values were chosen based on the numerical investigation of the co-extrusion process described in [5]. For each parameter combination, three repetitions were carried out to estimate variability in the data.
The chemical compositions of the aluminum alloy EN AW-6082 and the steel 20MnCr5 used in the present study are listed in Table 2 and Table 3. The aluminum and steel specimens—produced by wire cutting—were ground and polished shortly before the tests to remove excess oxide layers from the surfaces.
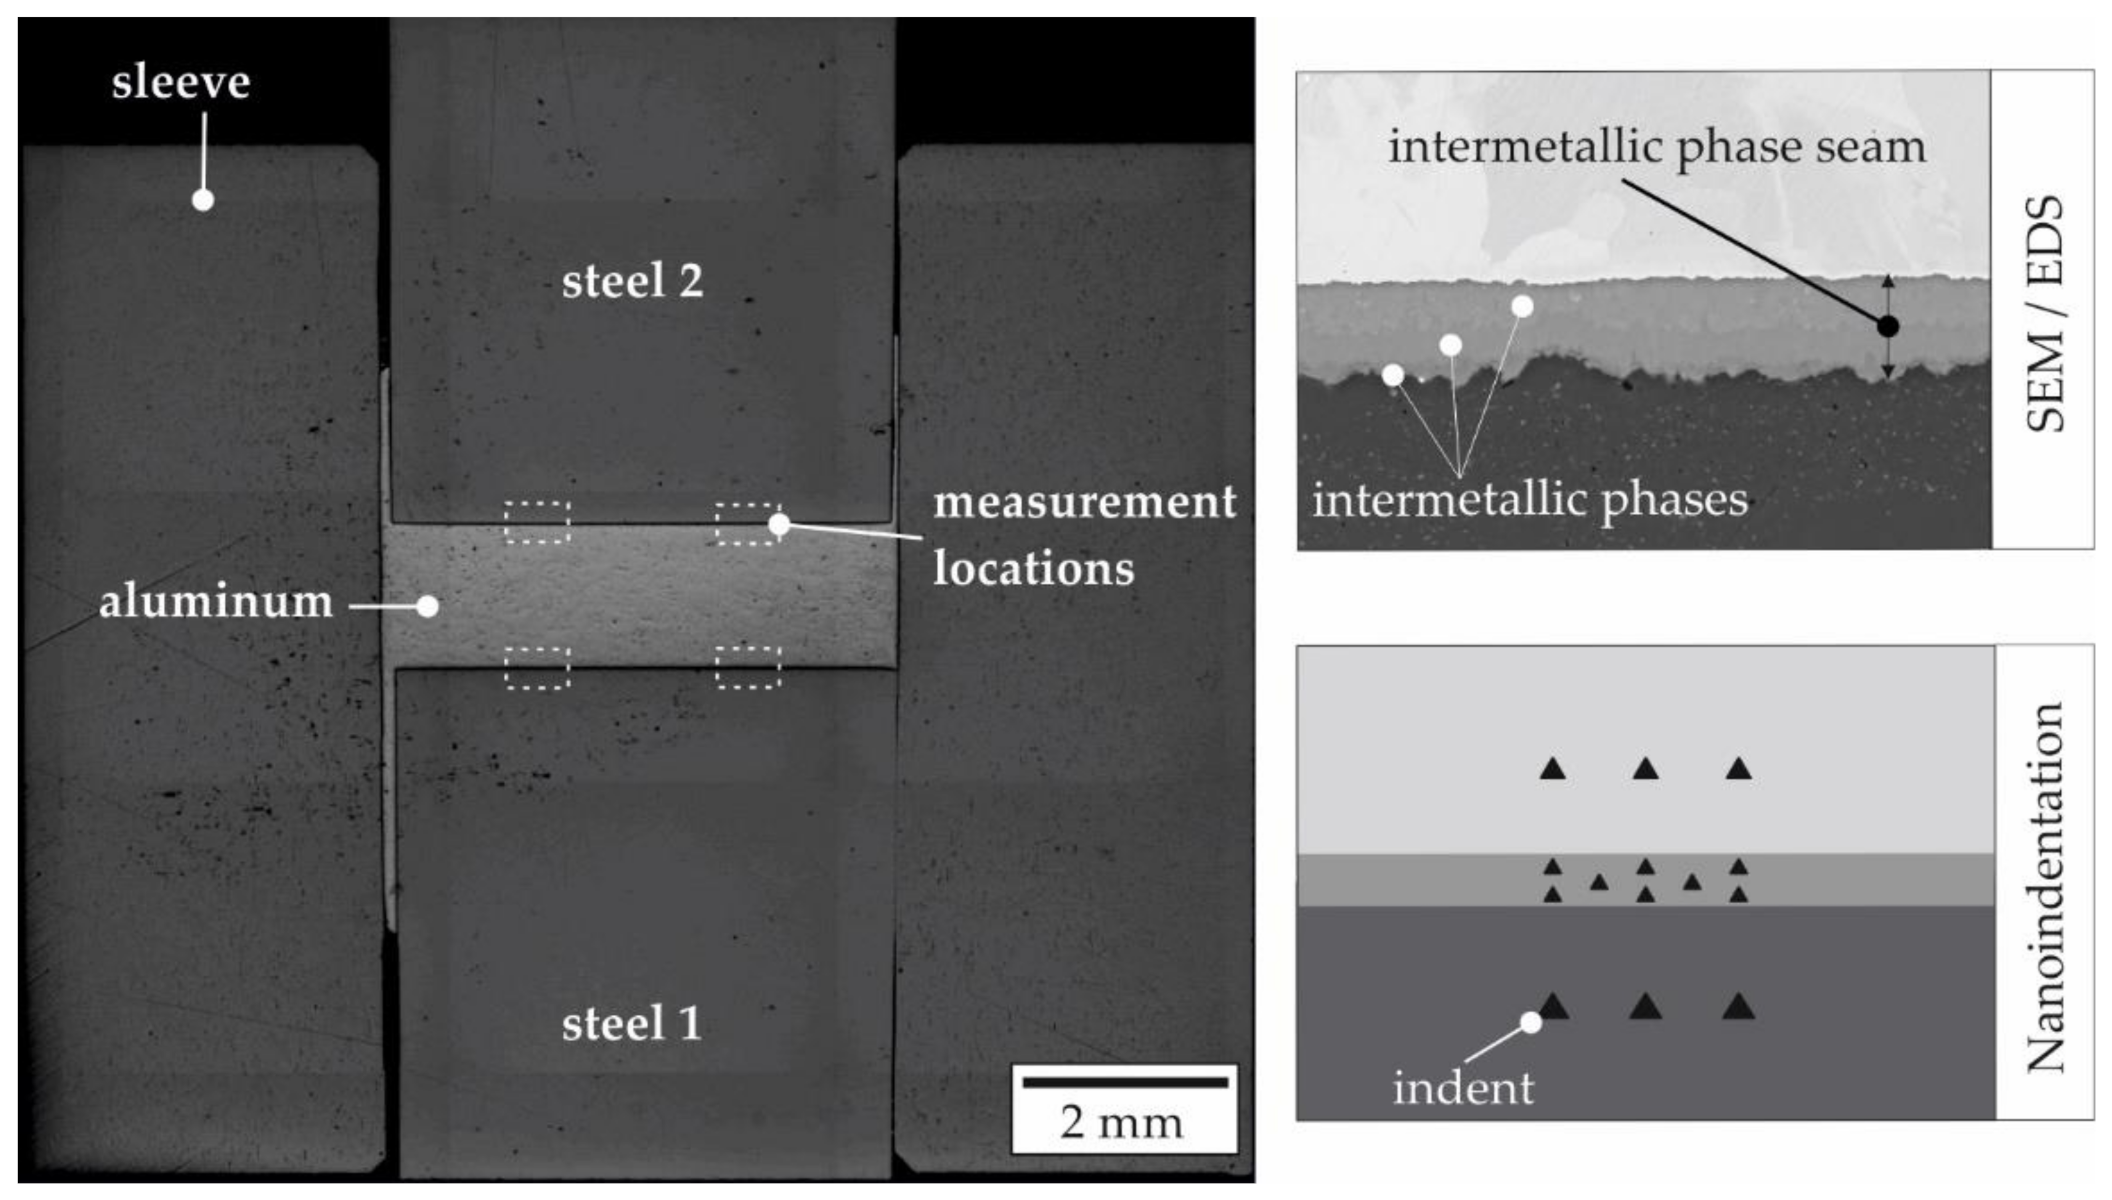
After the analogy experiments, the hybrid specimens were embedded and then cut perpendicular to the bonded surfaces. The specimens were ground and polished down to 1 µm. The interface was analyzed by SEM with EDS using a Supra 40VP (Zeiss, Oberkochen, Germany). Images were recorded using secondary (SE) and backscattered electrons (BSE). SEM analysis was performed at both joining zones at several locations. Figure 2 schematically shows a formed specimen where the areas probed in the SEM and nanoindentation analysis are highlighted. The width of the intermetallic phase seam was measured by evaluating the recorded BSE images using a MATLAB (R2020a, The MathWorks, Natick, MA, USA) script descripted in detail in by Herbst et al. [14]. In each specimen, at least two images were taken of each side of the joining zone.
Nanoindentation measurements were carried out on a Hysitron TI 980 Nanoindenter (Bruker, Billerica, MA, USA) to characterize the mechanical properties of the individual detected phases in the intermetallic phase seam. Due to their small size, the visual localization of the intermetallic phases was challenging and scanning probe microscopy (SPM) integrated in the nanoindenter was used for this purpose. The joining zone was scanned tactilely with a scanning force of 2 µN. Due to the different material hardness, the specimen preparation by grinding and polishing results in different surface roughness of the different materials. The nano hardness measurements were carried out with a Berkovich diamond tip. The tip geometry was calibrated for a minimum penetration depth of 25 nm on a fused quartz probe. The hardness was evaluated based on the method proposed by Oliver and Pharr [15]. A trapezium function with a duration of 12 s was used as the load function to eliminate dynamic effects [16]. For the nanoindentation measurements, a test force of 3000 µN was used. Thus, the minimum penetration depth of 25 nm in the intermetallic phase could be achieved and at the same time, the remaining indentation was small enough to position several indents across the phase width. In the longitudinal direction, a distance of about 2 µm was maintained. In both steel and aluminum, three indentations each were created with a distance of 7.5 µm from the intermetallic phase and in longitudinal direction with a distance of 7.5 µm using a programmed grid.
In addition, the joining zone was characterized using accelerated mechanical property mapping (XPM). A 10 × 10 indentation grid was stretched out applying a test force of 1000 µN. The distance between the indents was set to 0.7 µm to obtain a high lateral resolution of the hardness in the joining zone. The quantitative measurement of steel and aluminum was carried out separately near the joining zone.

2.2. Setup of Numerical Model and Subroutine

To validate the subroutine, a numerical model of the analogy experiments was built up in the first step. For the FE analysis of the analogy experiments, the commercial software FORGE NxT 3.0 (Transvalor S. A., Mugins, France) was used. The 3D FE model of the analogy experiments is shown in Figure 3a. The temperatures from the experimental measurements were assigned to the components as homogeneous temperature. A hydraulic press with a constant speed of 0.19 mm/s was assigned to steel cylinder 1, which was determined from the experimental data. In this way, steel cylinder 1 was moved in a positive z-direction until the defined maximum force was reached, after which the force was kept for a given period of time. The contact between the steel cylinders and the aluminum work piece was modeled as bilateral sticking, following the contact modeling from the lateral angular co-extrusion (LACE) process. Between the steel sleeve and aluminum specimen a friction factor m of 0.95 was chosen in accordance to the co-extrusion process, as determined numerically in previous studies [5]. Flow curves of aluminum were recorded by cylindrical upsetting tests and implemented in the FE software. Details about the material data used are given in [5].
The model comprised approximately 44,408 volume elements (tetrahedral) of linear interpolation type typically used for metal forming simulations. The steel specimens and the sleeve were modeled as rigid bodies to limit the computation time. In addition, the effect of the element size was analyzed, since both the accuracy of the calculated results and the computation time strongly depend on the selected minimal element size. In Figure 3b, the results of the mesh study are shown. For a minimum element size of 0.2 mm a sufficient accuracy, as well as an adequate computation time were achieved and therefore used for the subsequent analysis. Remeshing was applied, combining two remeshing criteria, a periodic initiated remeshing criterion and an automatic size criterion. Thus, remeshing followed a fixed incremental step of 20. In addition, the automatic size criterion was activated to refine the mesh of the work piece in the contact zone with the steel cylinders. The time step equaled 0.2 s, which resulted in 681 time steps in total.
To describe the growth of intermetallic phases numerically, the Einstein–Smoluchowski equation
p = 2 D t
was employed, where p is the intermetallic phase seam thickness after time t and D is the diffusion coefficient [17]. The phase seam thicknesses p determined via SEM images was then used to calculate the apparent diffusion coefficient D with the Einstein–Smoluchowski equation.
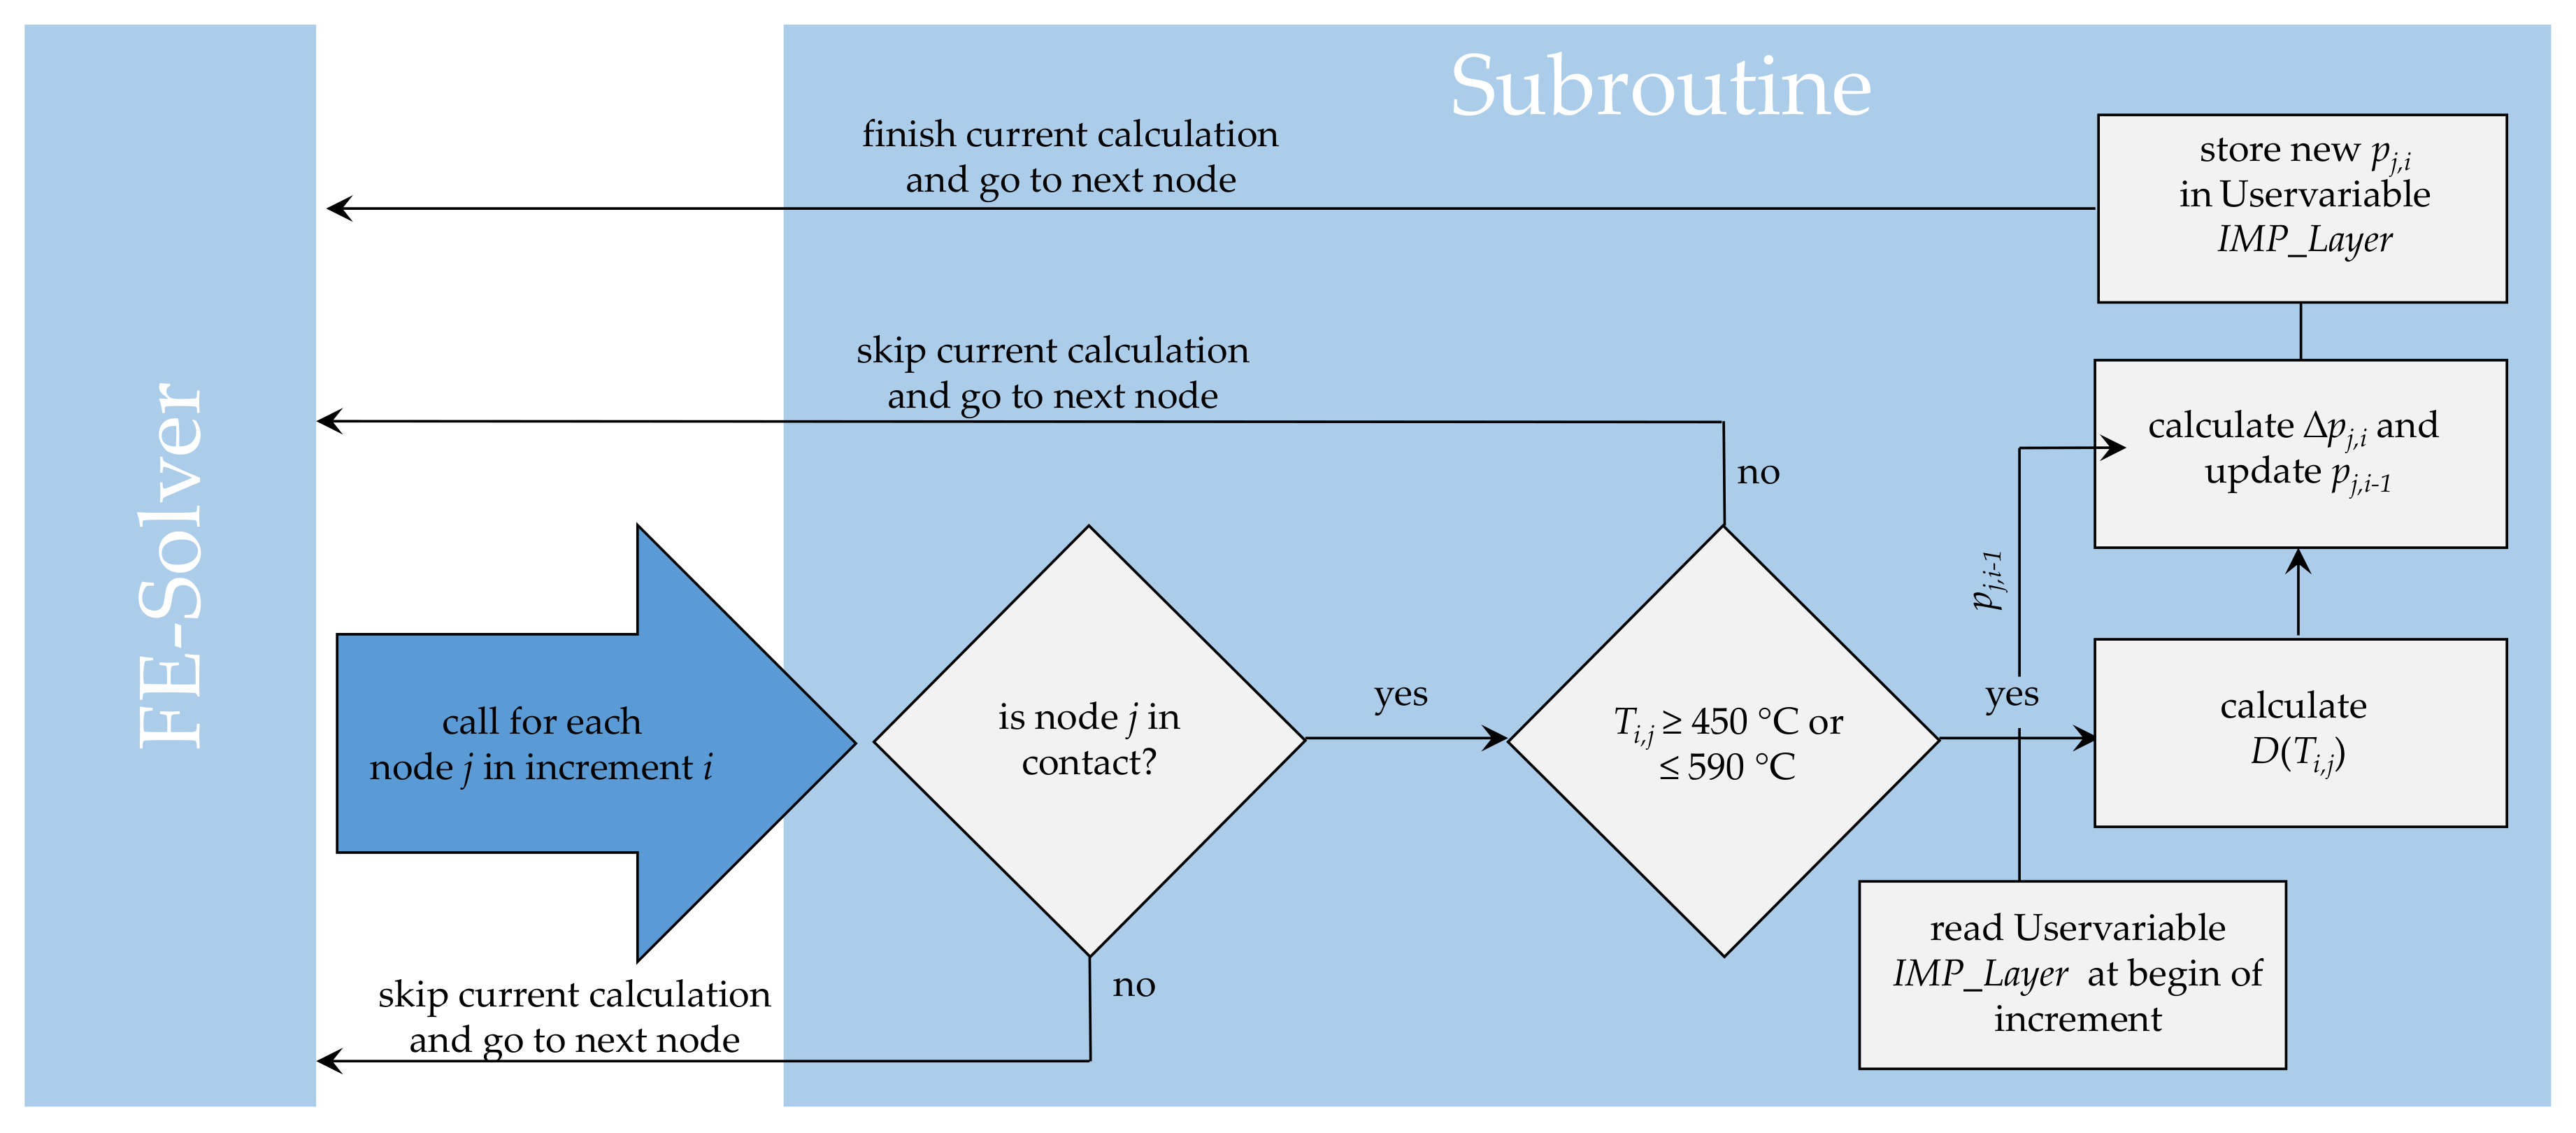
To enable the usage of a temperature-dependent diffusion coefficient in the numerical simulation, a functional correlation was derived from the measured data, which describes the dependence of the diffusion coefficient on temperature. Thus, the subroutine can be used to describe the growth of the intermetallic phase seam as a function of contact time and contact temperature. The intermetallic phase seam was calculated only where the element nodes of the aluminum and the element nodes of the steel cylinders came into contact. To check if the requirements were fulfilled, the contact modeling was queried in each increment for each node of the aluminum. If the conditions were fulfilled, the subroutine was continued. Within the subroutine the temperature was requested from the solver for the considered node. If the nodal temperature was equal to or between 450 °C and 590 °C, the routine was continued. Otherwise, the temperature is too low for development of an intermetallic phase and the subroutine is terminated. The temperatures were chosen according to the upper and lower limits of the test matrix and the developed subroutine is only valid in this range. The diffusion coefficients, which are calculated with temperatures outside the temperature range are extrapolated and not interpolated values and therefore, are not permitted. If the node temperature is in the permitted range, the diffusion coefficient is calculated for the considered node, depending on the node temperature. The phase growth in the current increment is calculated, taking into account the phase width of the previous increment. Finally, the calculated phase thickness is stored and is available in the next increment as an already existing phase thickness and is included again in the calculation of the next increment. The sequence of the subroutine is shown in Figure 4 in a flow chart. In each increment the result variable IMP_Layer is updated. The subroutine was programmed in Fortran 90 and implemented by compiling the dynamically linked library in FORGE NxT 3.0.

3. Results and Discussion

3.1. Evolution of the Intermetallic Phase Seam Thickness

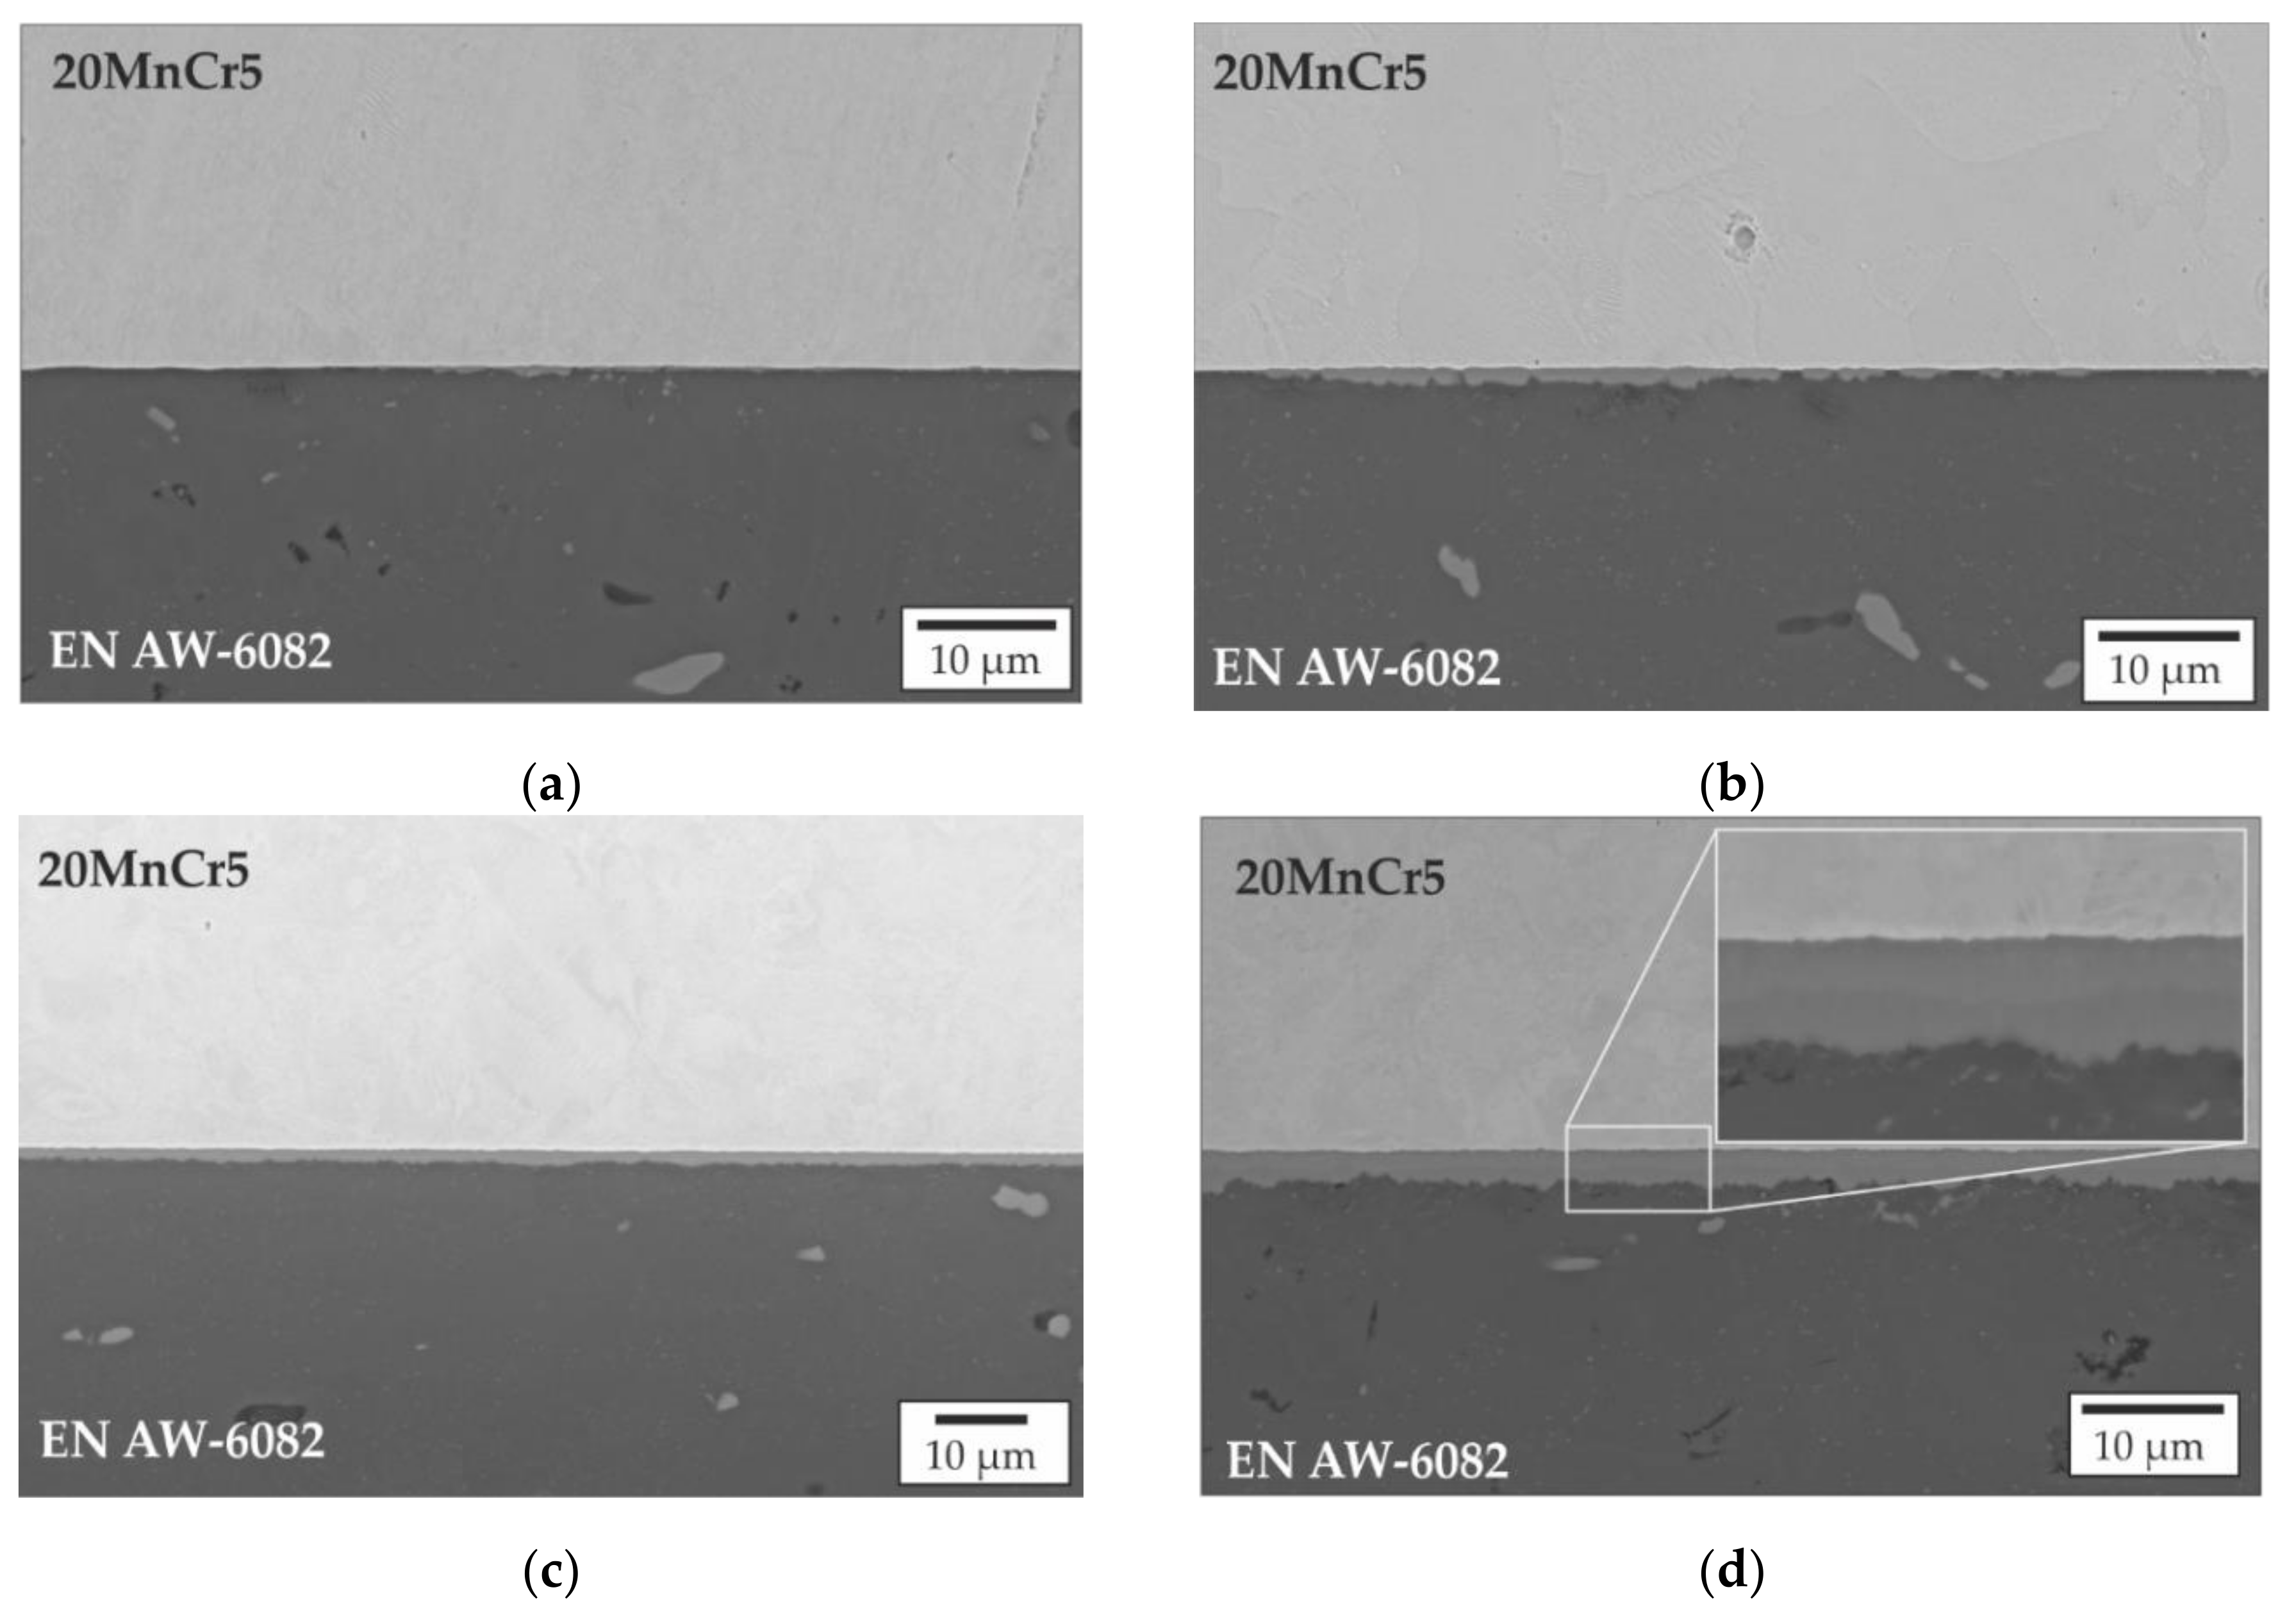
The growth of intermetallic phases can be divided in different steps as described by Ryabov et al. [7]. At first, small areas of an intermetallic phase are created by diffusion processes at the joining zone and continue to grow along the joining zone with advancing time. The different phases subsequently grow together and start to grow transversely to the joining zone. In Figure 5, SEM images of the resulting joining zone from analogy experiments at a forming temperature of 560 °C, a force of 5890 N and different forming times are shown. After 30 s intermetallic phases are present, which exist as isolated islands along the joining zone, cf. Figure 5a. After 60 s, the individual phases have already partially grown together and have begun to grow across the joint zone, as shown in Figure 5b. A larger band of intermetallic phases is shown in Figure 5c which was detected for experiments with a forming time of 120 s. The intermetallic phase fringe continues to grow into the aluminum with a further increase in time to 240 s. As seen in Figure 5d, the different grey tones indicate the presence of different types of intermetallic phases within the joining zone.
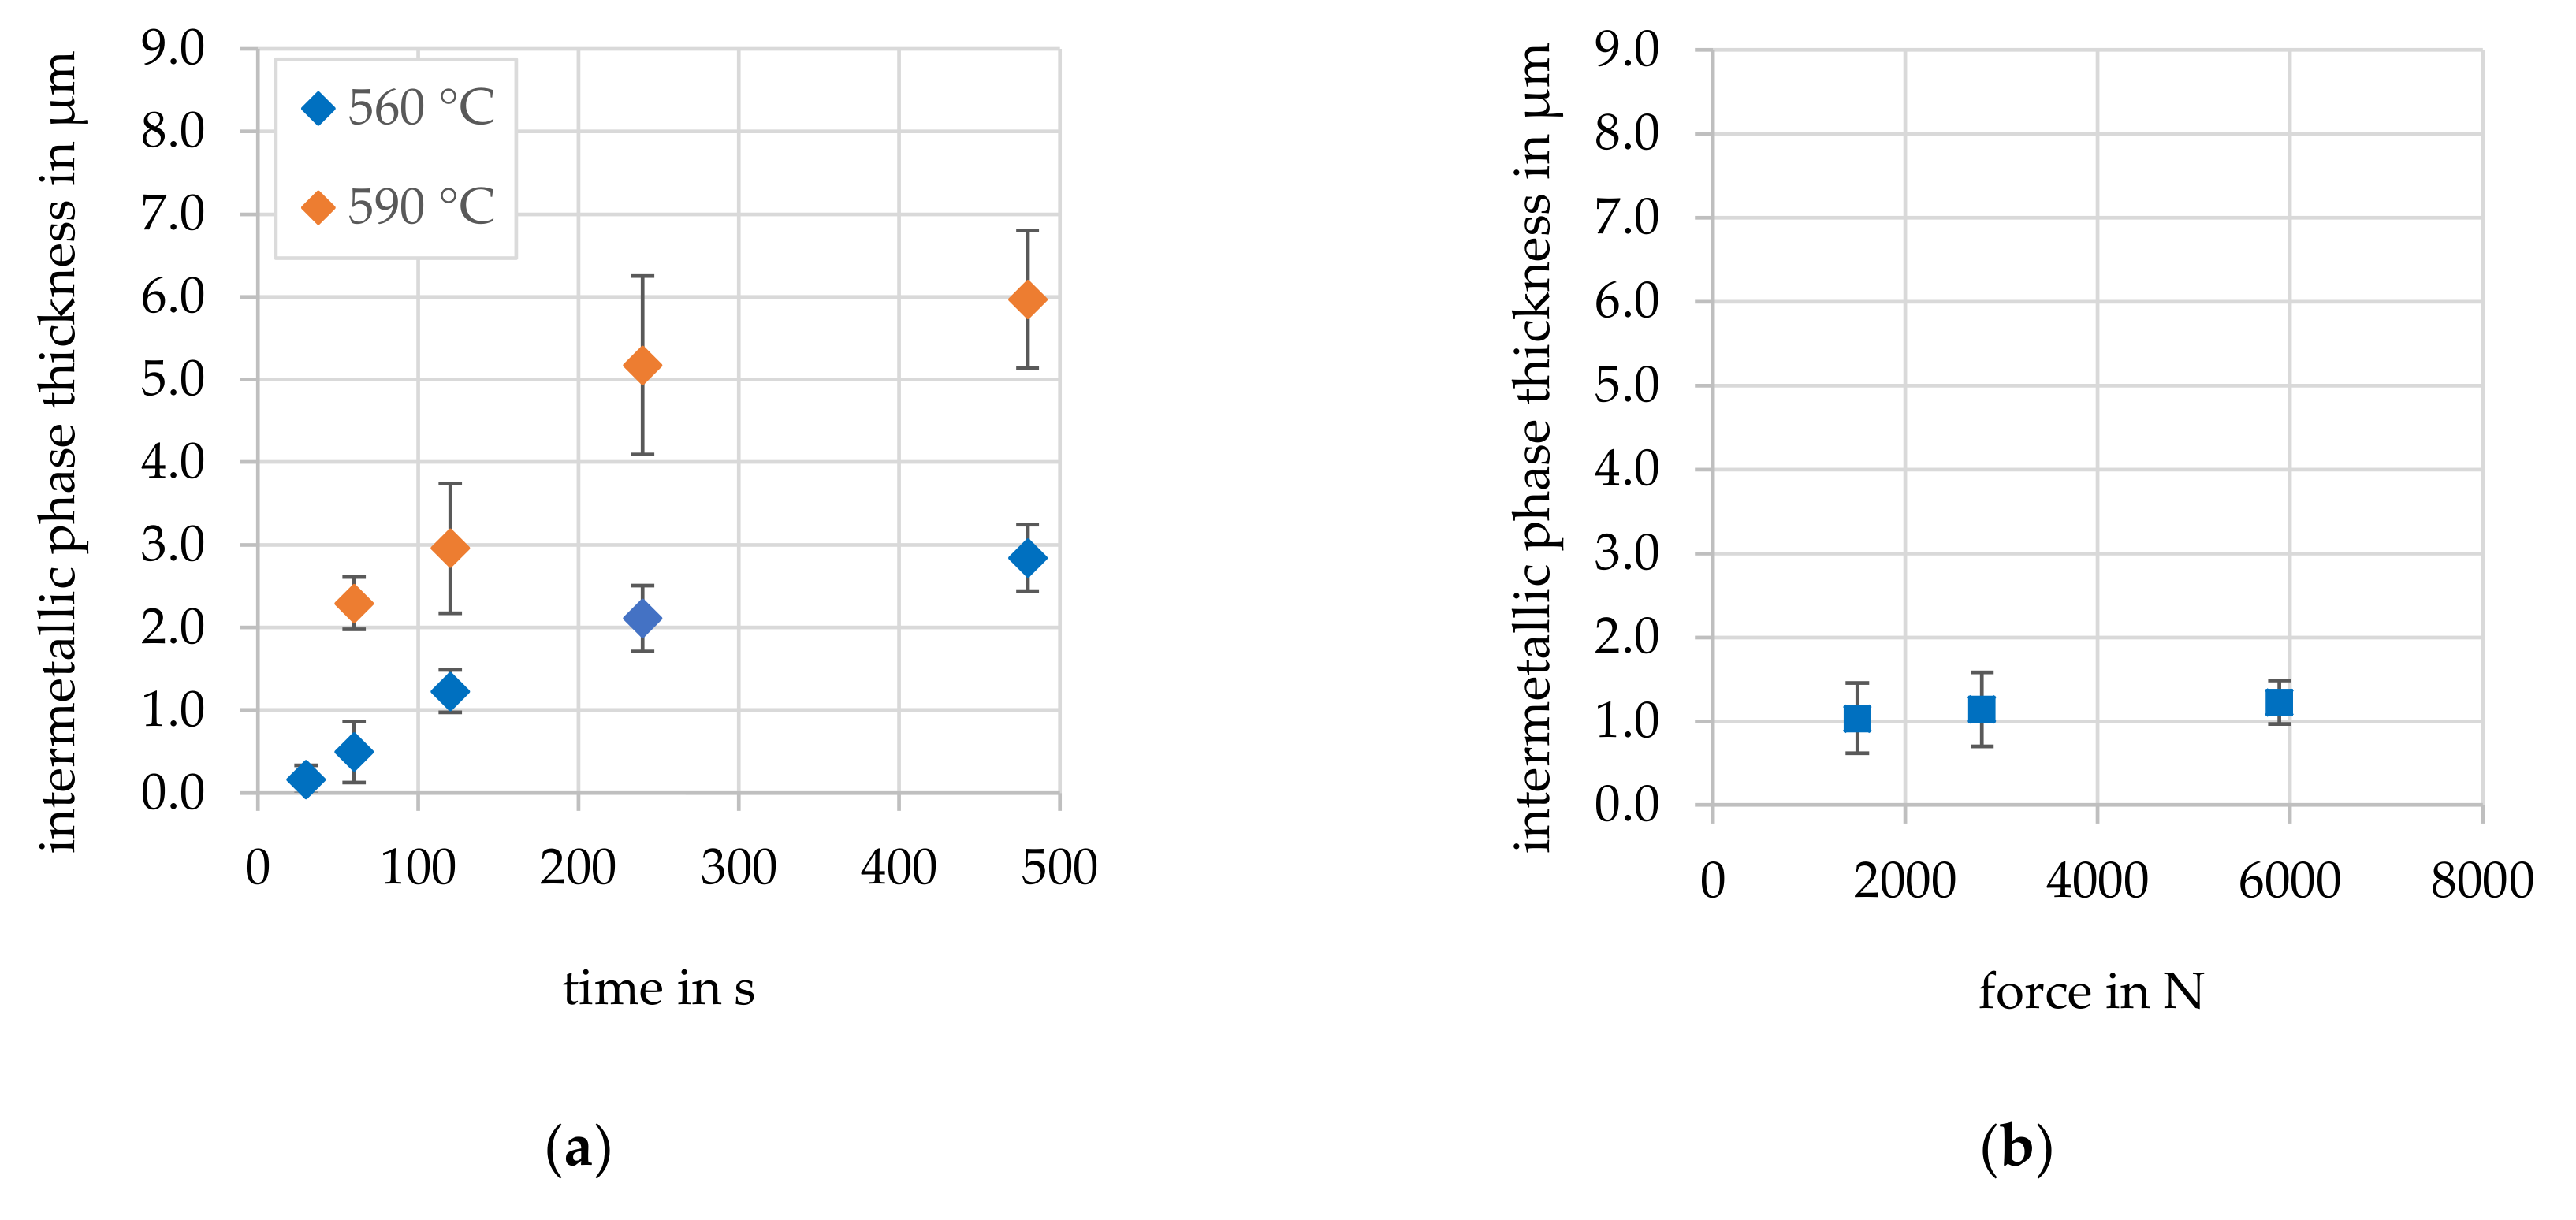
Based on the SEM images, the average thickness of the intermetallic phases was determined depending on the parameters forming time, forming force and forming temperature, using the described MATLAB script. The graphic representation of the dependence of the intermetallic phase seam thickness on time is shown in Figure 6a. An increase in the intermetallic phase seam width with time can be seen for both forming temperatures. As expected, the comparison of the results for different forming temperatures demonstrates an increasing growth rate with increasing temperature. The variation of force shows no significant influence on the resulting phase seam thickness, as shown in Figure 6b. Theoretically, the phase growth should decrease with increasing force, as diffusion is hindered. Rummel et al. [18] were able to show this effect in investigations on a single crystal, but this effect only occurred at contact pressures being significantly higher than those employed in the analogy experiments conducted in the present study.
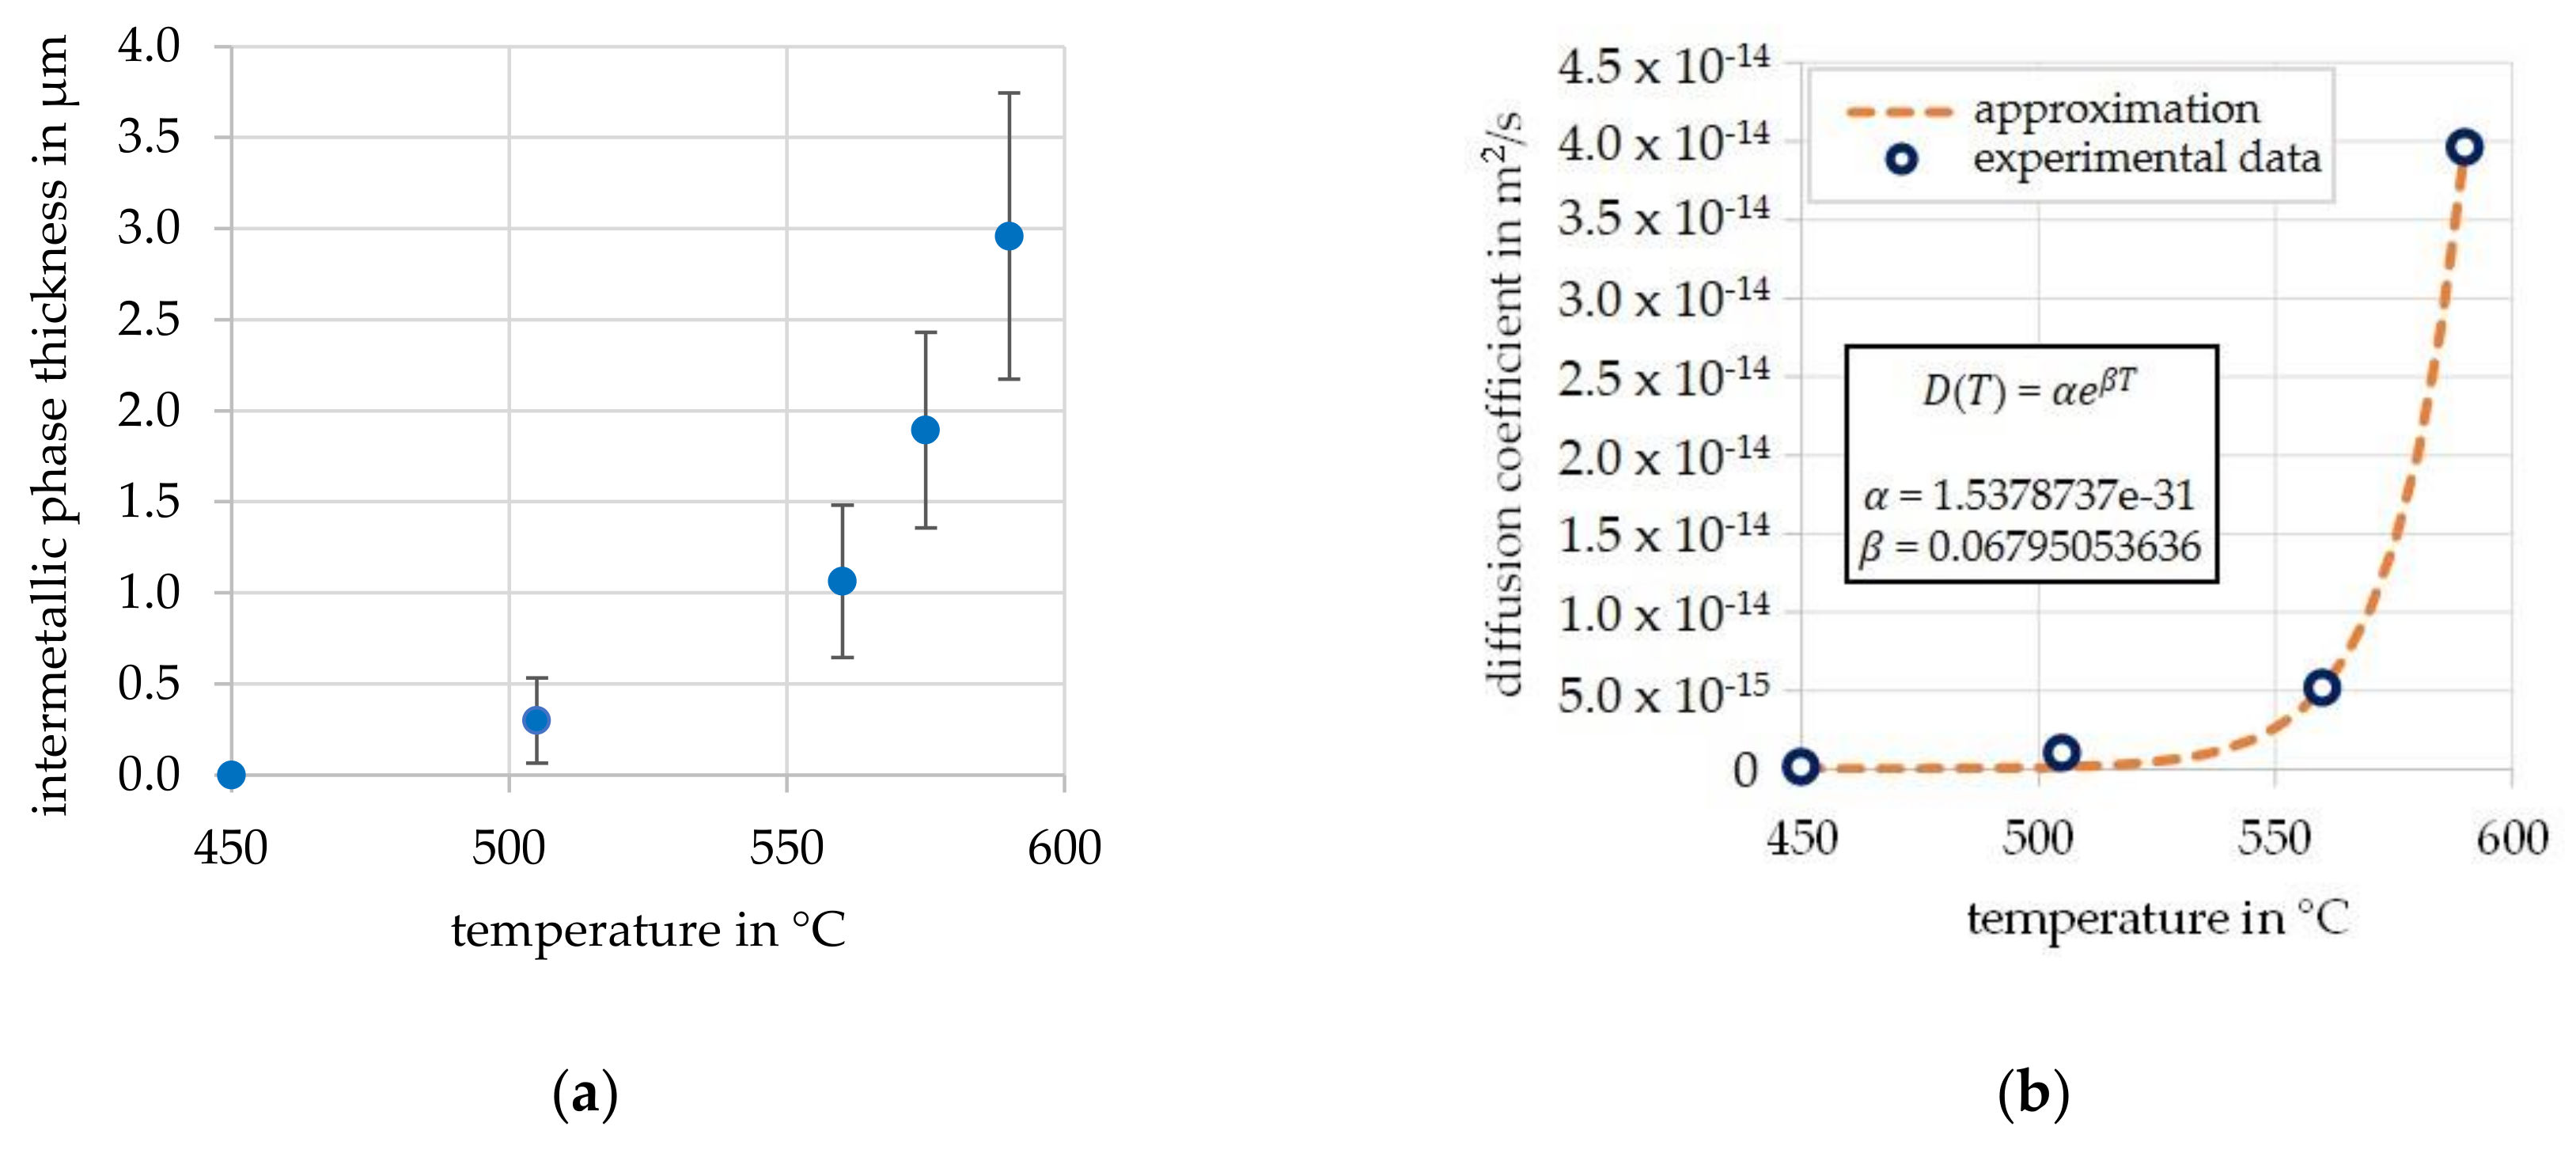
Depending on the temperature, a parabolic increase in the intermetallic phase seam width can be observed, as shown in Figure 7a, according to literature [9]. The standard deviation of the measured values increases with increasing temperature, which can be explained by the locally irregular and stem-like growth of the layers, especially on the aluminum side.
As no significant influence of the applied force on the resulting phase thickness was detected, a force-dependent calculation of the intermetallic phase seam width was not carried out in further investigations. Since a decisive influence on the formation of time and temperature on the intermetallic phases was observed, time- and temperature-dependent modeling was chosen. For temperature-dependent modeling, the corresponding diffusion coefficients were first calculated from the measured intermetallic phase seam widths using the Einstein–Smoluchowski equation. Then, an approximation function was determined to describe the diffusion coefficient as a function of temperature, which is represented in Figure 7b. An exponential function with the two constants α and β was used. The constants were determined by fitting the measured data and are valid in the temperature range from 450 °C to 590 °C. The value determined at 575 °C was not used for the approximation but later for the validation of the subroutine. The exponential increase in the intermetallic phase seam thickness and diffusion coefficient with increasing temperature is as expected for a thermally-activated process [19].
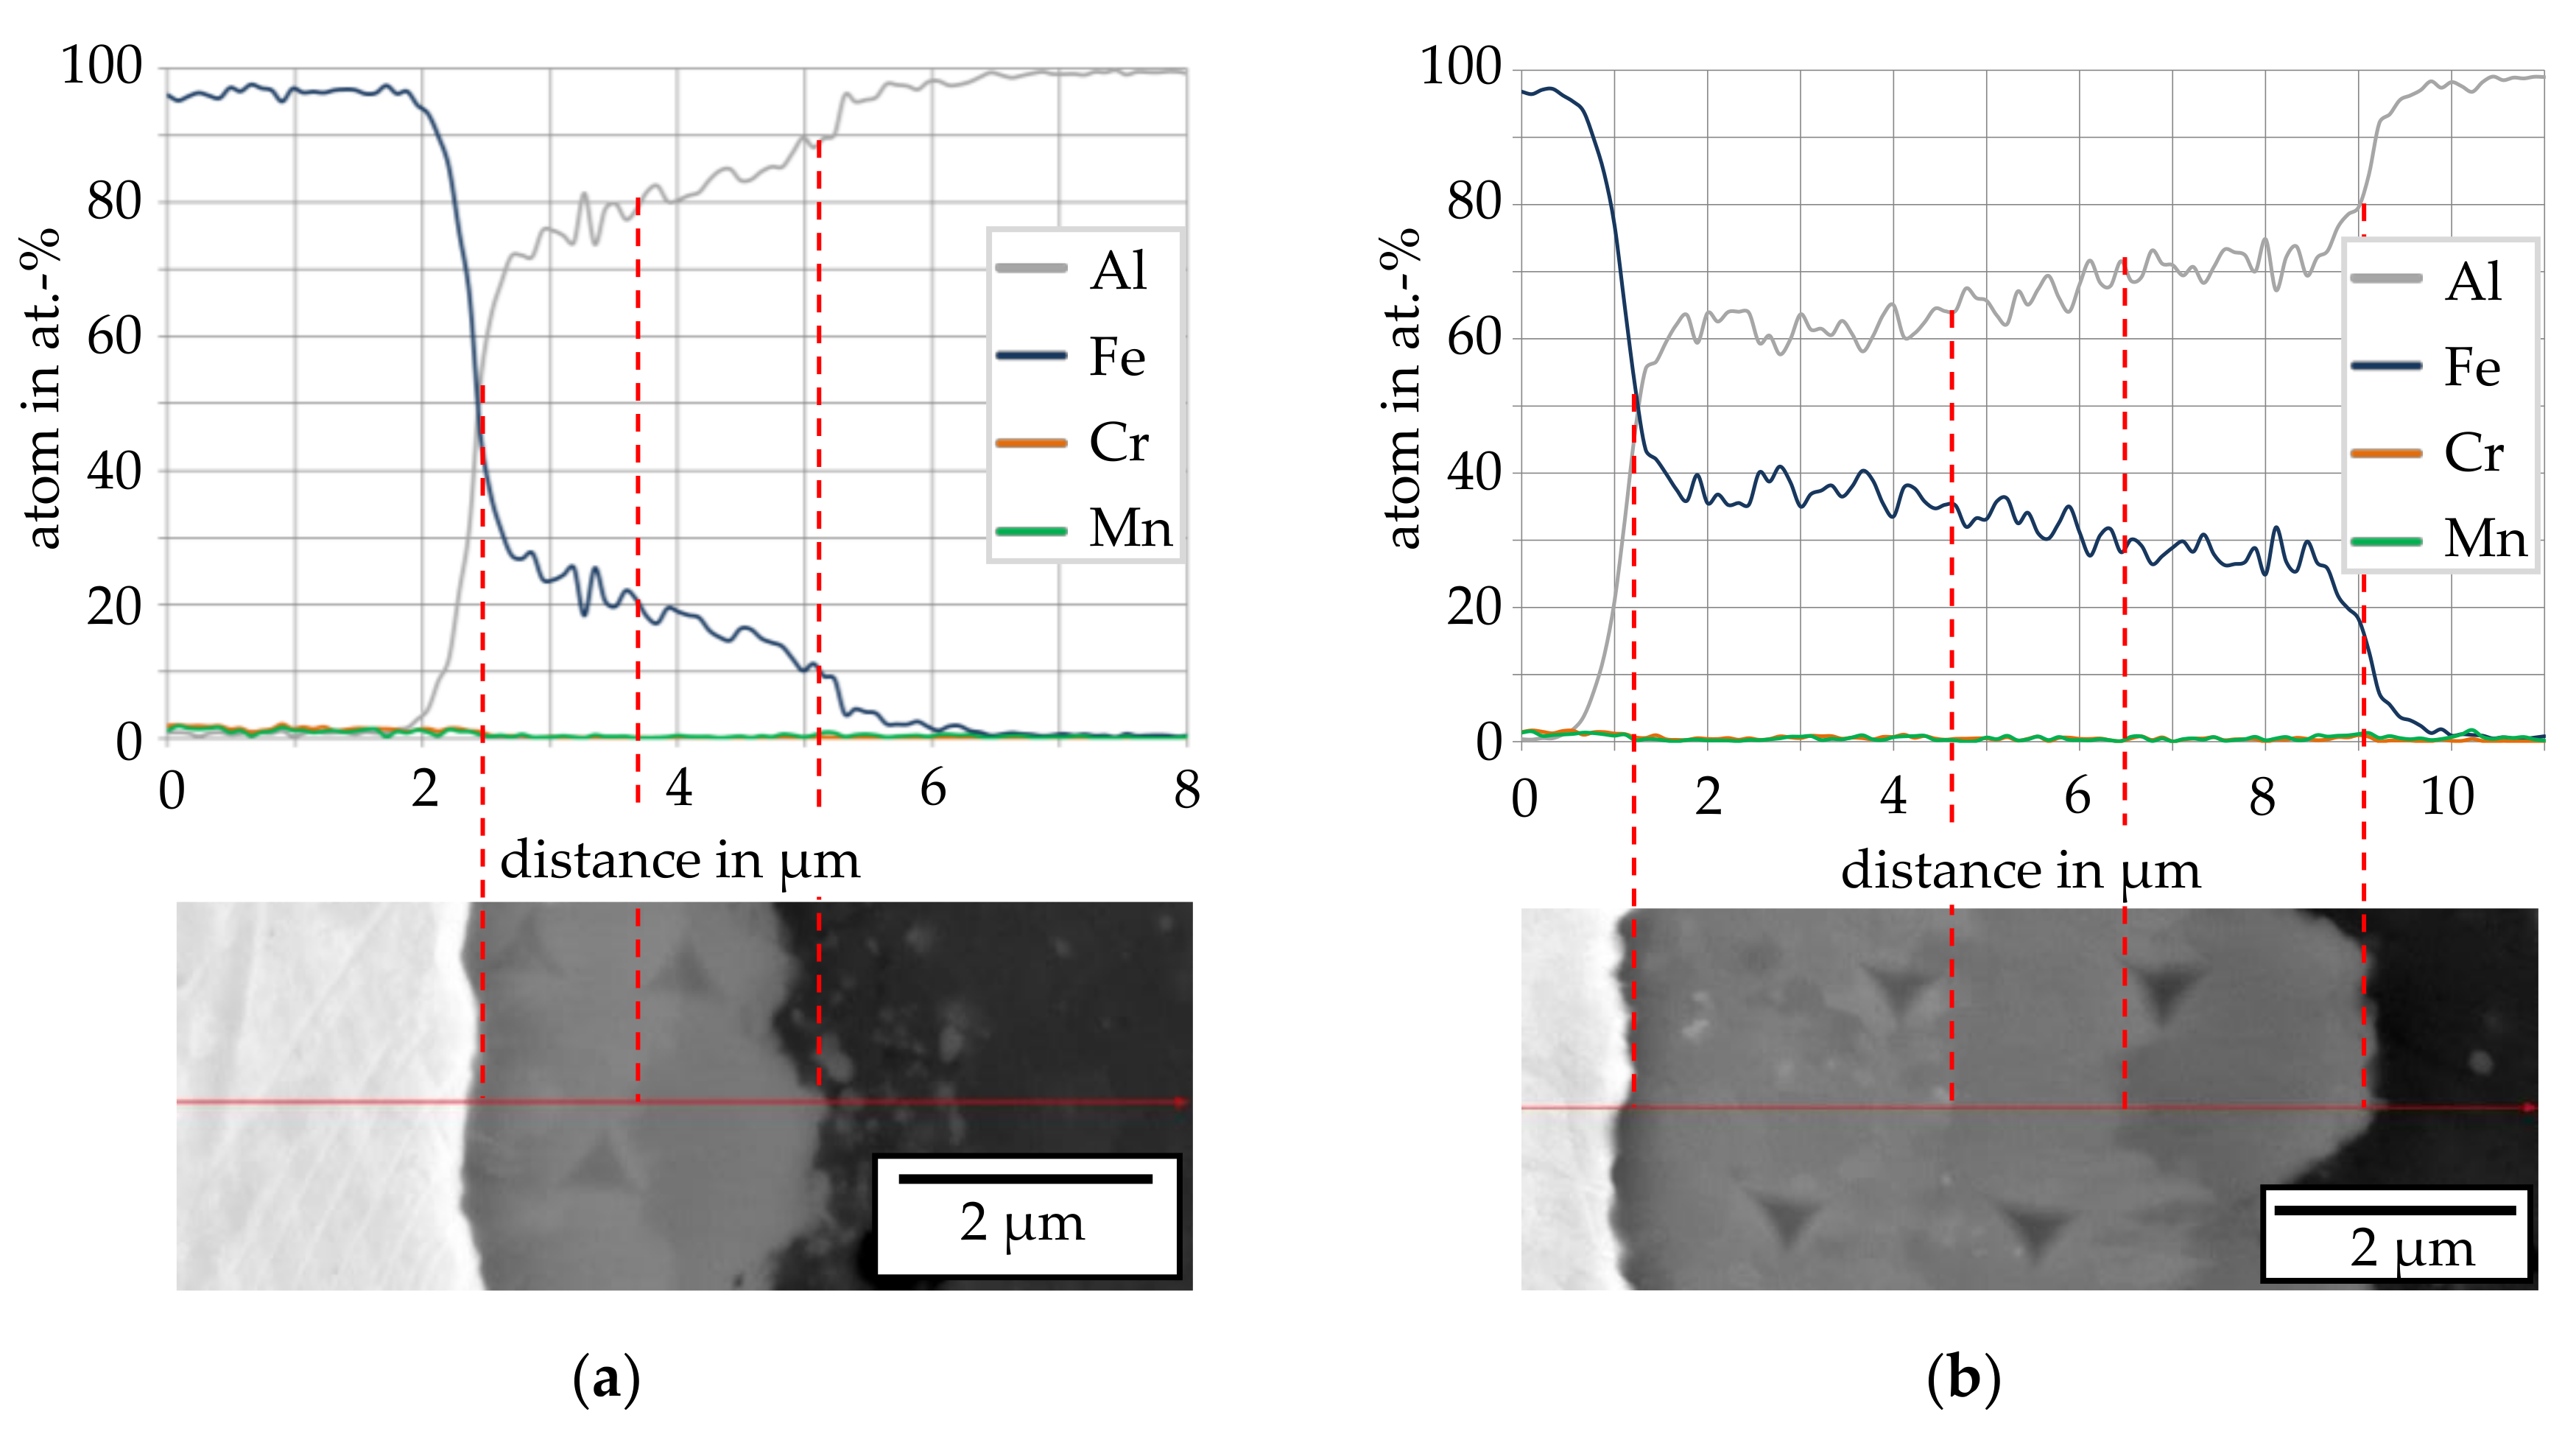
EDS investigations of the joining zones were carried out to determine the chemical composition of the phases formed in the joining zones. Of particular interest were the joining zones, in which up to three different phases could be identified based on line scans carried out perpendicular to the joining zone. In Figure 8, the distribution of the elements over the measured distance for a specimen formed at 575 °C compared to a specimen formed at 590 °C is presented, whereby the first shows two and the second shows three intermetallic phases with different thicknesses. A rapid transition of iron and aluminum content can be recognized in both line scans. However, the specimens formed at the lower temperature of 575 °C (Figure 8a) show an aluminum content of approximately 60 to 75 at.% at the interface. In contrast, for the specimen formed at the higher temperature of 590 °C (Figure 8b) the line scan shows individual plateaus, which indicate individual phases. The aluminum content in the joining zone increases from approximately 60 at.% in the first plateau to up to 70 at.% in the second plateau. A final plateau with an aluminum content of approximately 80 at.% is present in the area of the third phase at a distance of 6 to 8.5 µm to the interface. The iron content behaves reciprocally to the development of the aluminum content. In the steel, a weak signal of chromium and manganese was also detected, which is caused by the alloying elements of the mono material. Based on the determined ratios of aluminum to iron, the presence of the Al-rich phases FeAl2, Fe2Al5 and FeAl3 would be possible. The aluminum contents of the phases FeAl2, Fe2Al5 and FeAl3 are approximately 66–67 at.%, 70–73 at.% and 74–76 at.% according to the Fe-Al phase diagram [20]. A statement regarding the stoichiometry solely based on the EDS measurements is, however, not possible due to the interaction volume. For this reason, nanoindentation measurements were carried out to obtain further information on the composition and properties of the different intermetallic phases.

3.2. Nanoindentation Measurement of the Intermetallic Phase Seam

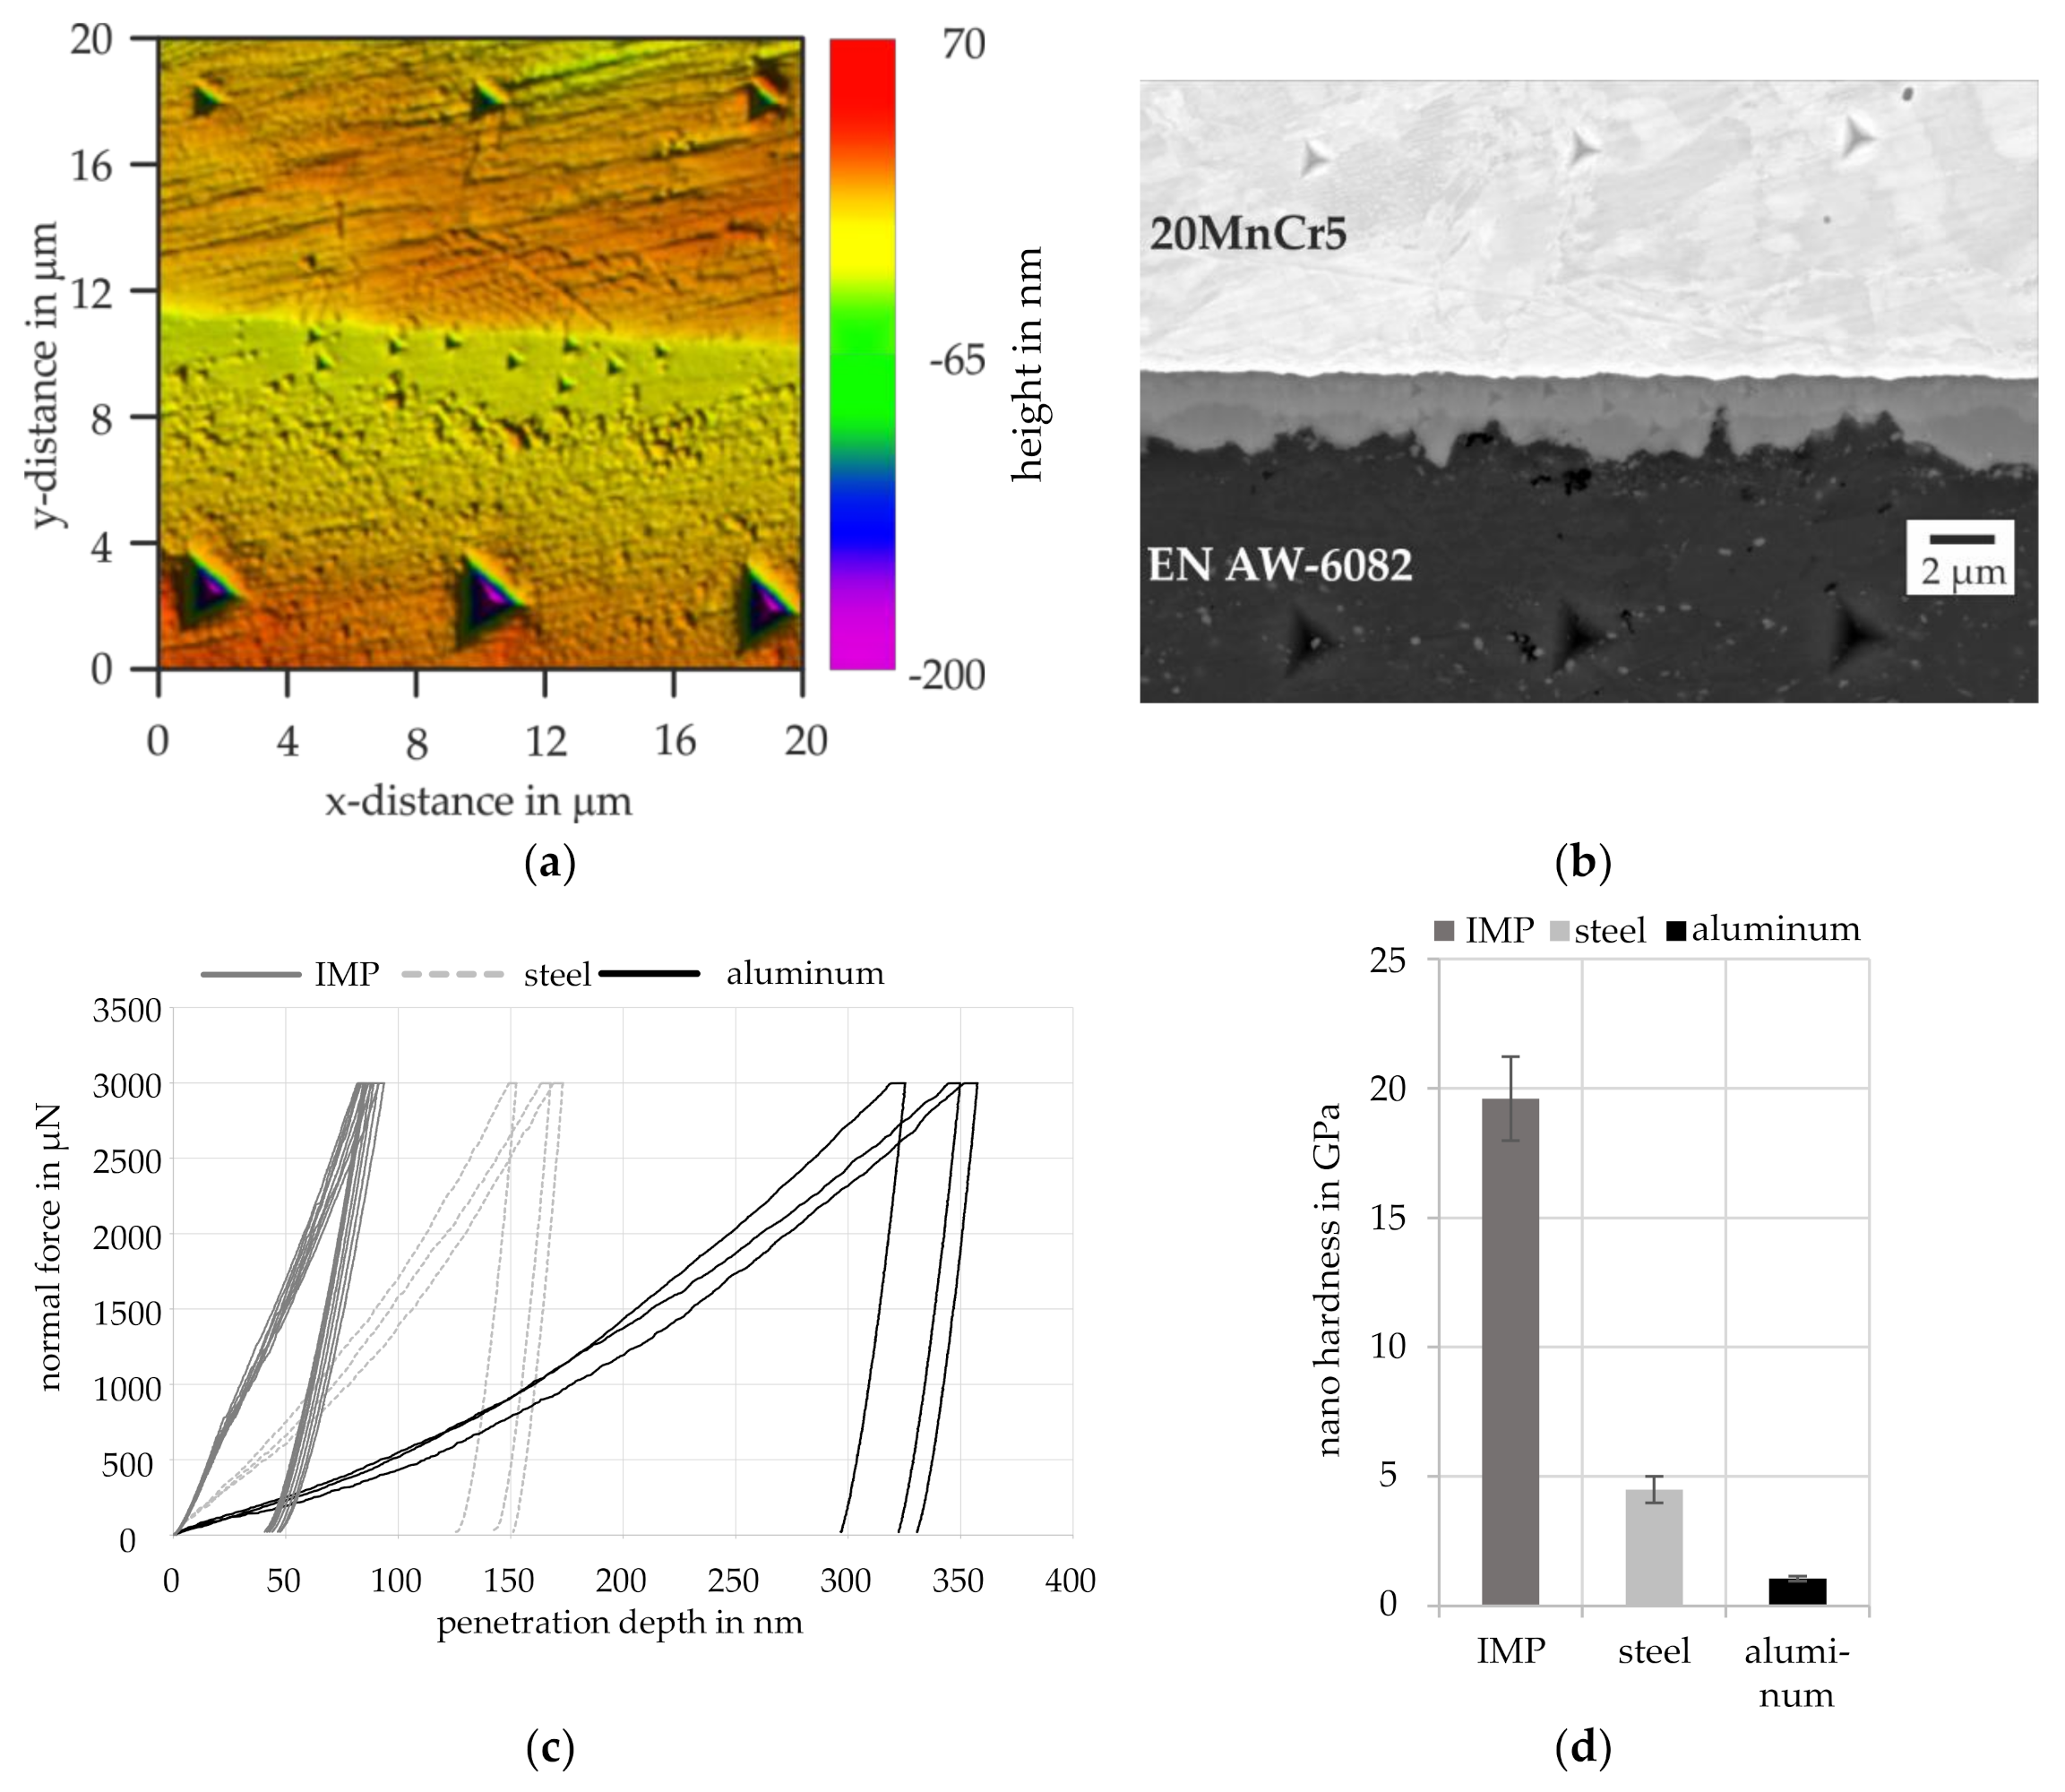
A scanning probe microscopy (SPM) image of the nanoindentation measurement of a specimen, which was formed at a temperature of 575 °C, a forming time of 120 s and a force of 5890 N is shown in Figure 9a, illustrating the different topographies of aluminum, the joining zone and steel caused by the specimen preparation. In Figure 9b, the corresponding BSE image is shown. The contour of the intermetallic phase is very well represented in the SPM image, as seen, for example, in the V-shaped notch between the two right-hand indents in the intermetallic phase. The different shades of grey within the intermetallic phase seam that can be seen in the BSE image are not reproduced in the SPM image. To clearly assign the measured hardness to a specific phase, it was therefore necessary to examine the measuring points by SEM after indentation.
The indents shown in the BSE image in Figure 9b were all indented with a test force of 3000 µN. It can be recognized that the indents of the intermetallic phase are significantly smaller than the indents in both base materials. In Figure 9c, the force-penetration curves of the indents are shown. The penetration depth of the indent correlates with the amount of plastic deformation. The average penetration depth of the indent of the intermetallic phase is 75 nm, and thus, is well above the minimum penetration depth of 25 nm. In Figure 9d, the nano hardness of aluminum, steel and the intermetallic phase is compared. The average hardness of aluminum and steel is 1 GPa and 4.85 GPa, respectively. In comparison, the hardness values of the intermetallic phase are about 20 GPa. In addition, the measured values for the intermetallic phase show more scatter, which is due to the different phases present within the intermetallic phase seam.
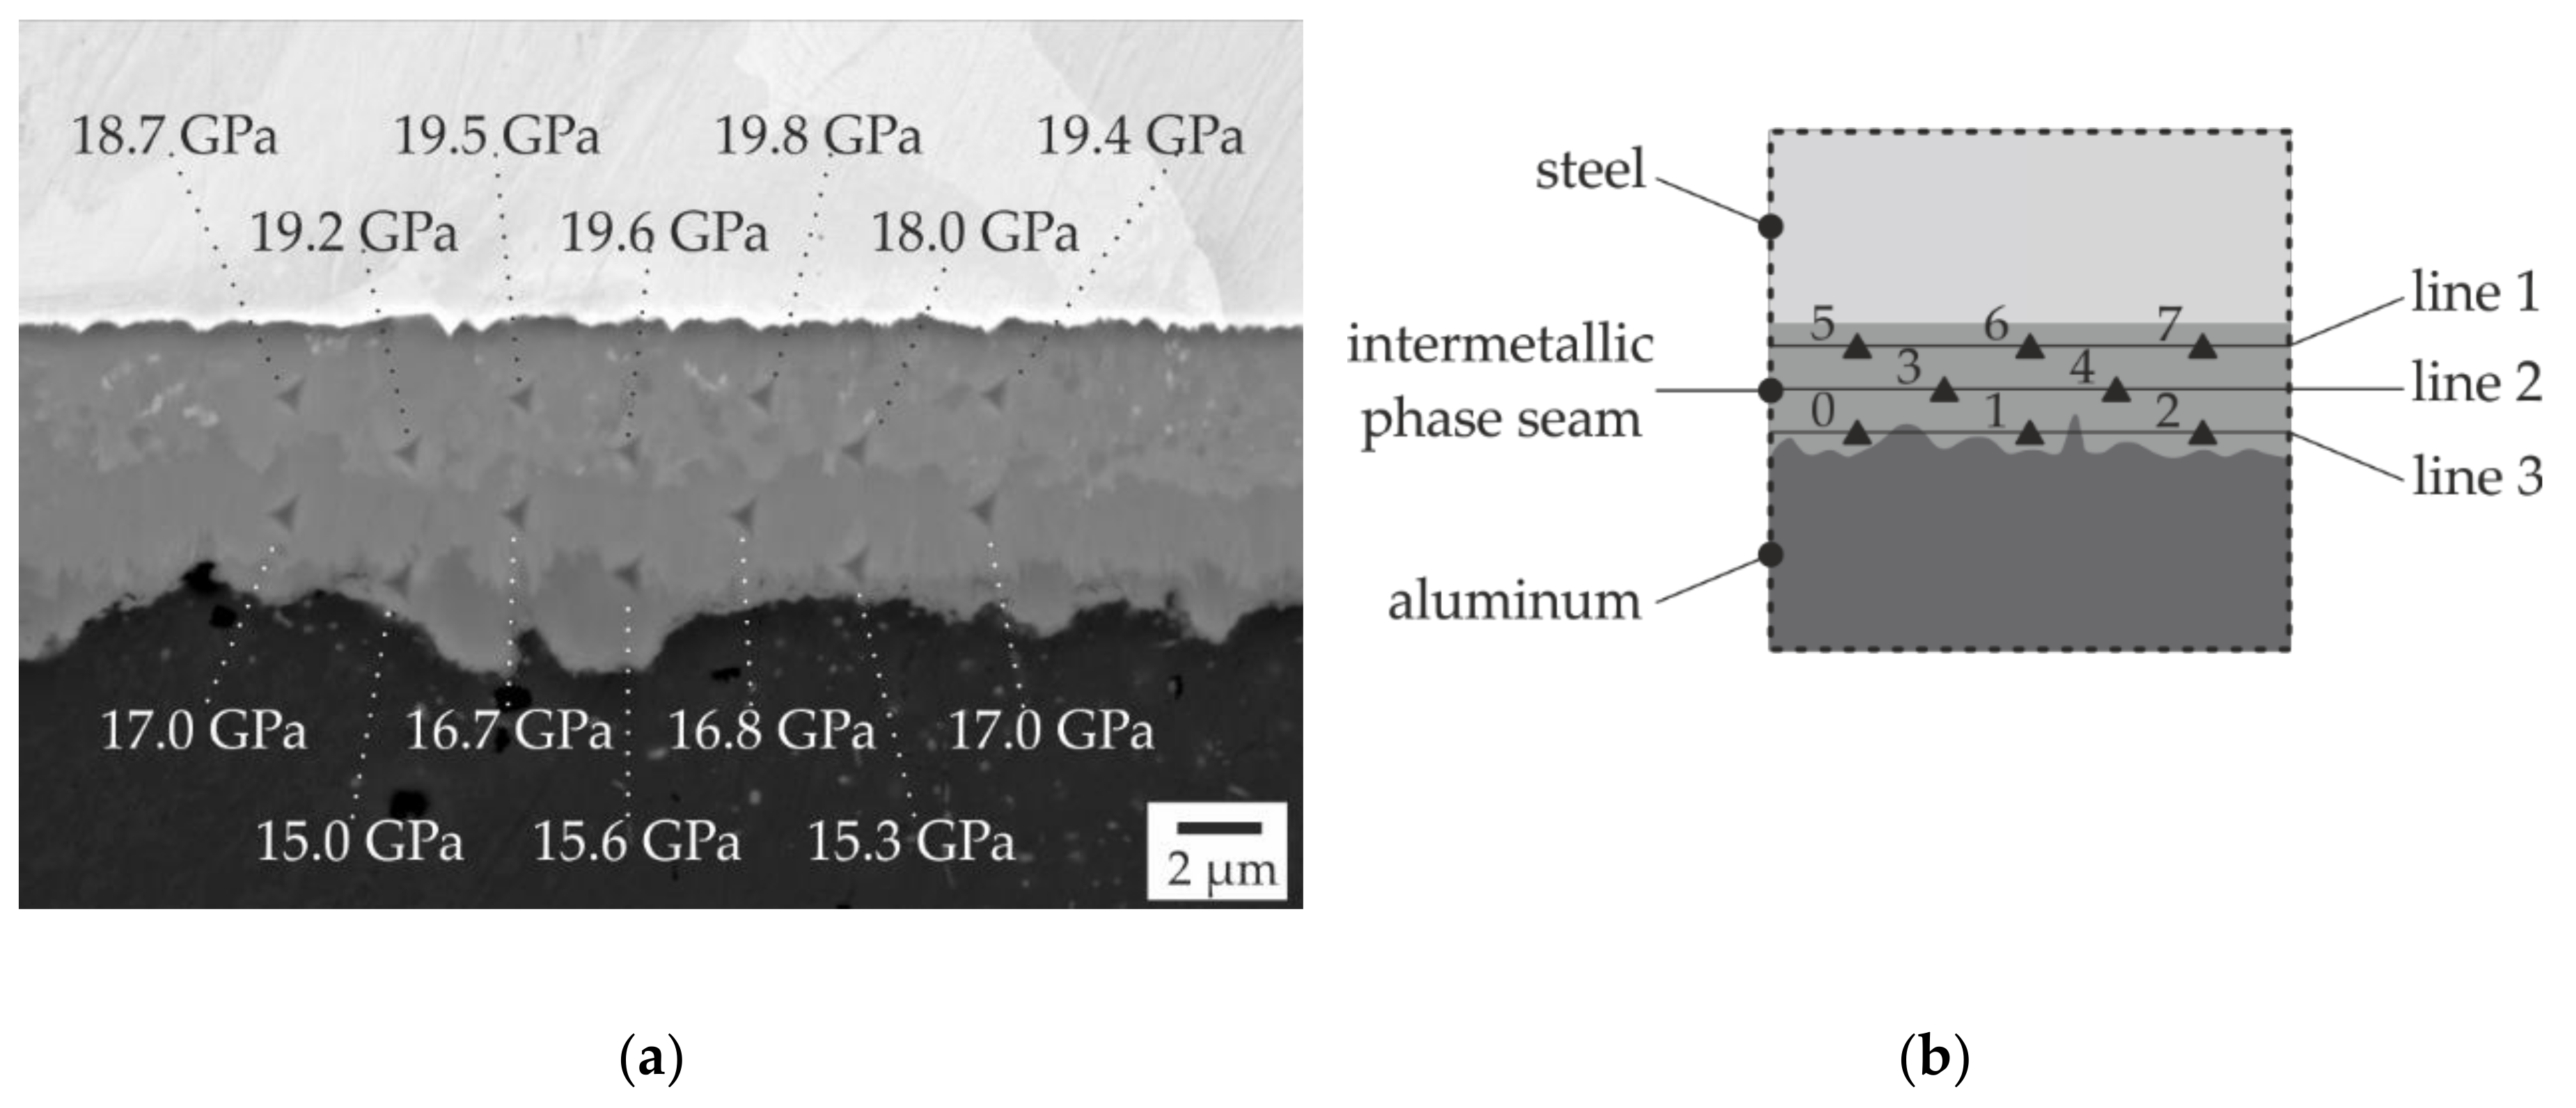
To correlate the measured nano hardness values to the different phases that are present in the joining zone, the measuring points were assigned to the different phases based on the BSE images, as exemplarily shown in Figure 10a. The marked hardness values show that the hardness in intermetallic phases seam increases towards the steel side. Nevertheless, it is evident that it was not always possible to place the hardness indentations in the middle of the phases present, making it sometimes difficult to assign the hardness unambiguously. This was most pronounced for the phase formed next to aluminum. In particular, this was the case for specimens produced at lower temperatures or times, some of which featured significantly thinner phases than those shown in Figure 10a. For this reason, three lines of hardness measurements were made on all specimens, as shown in Figure 10b.
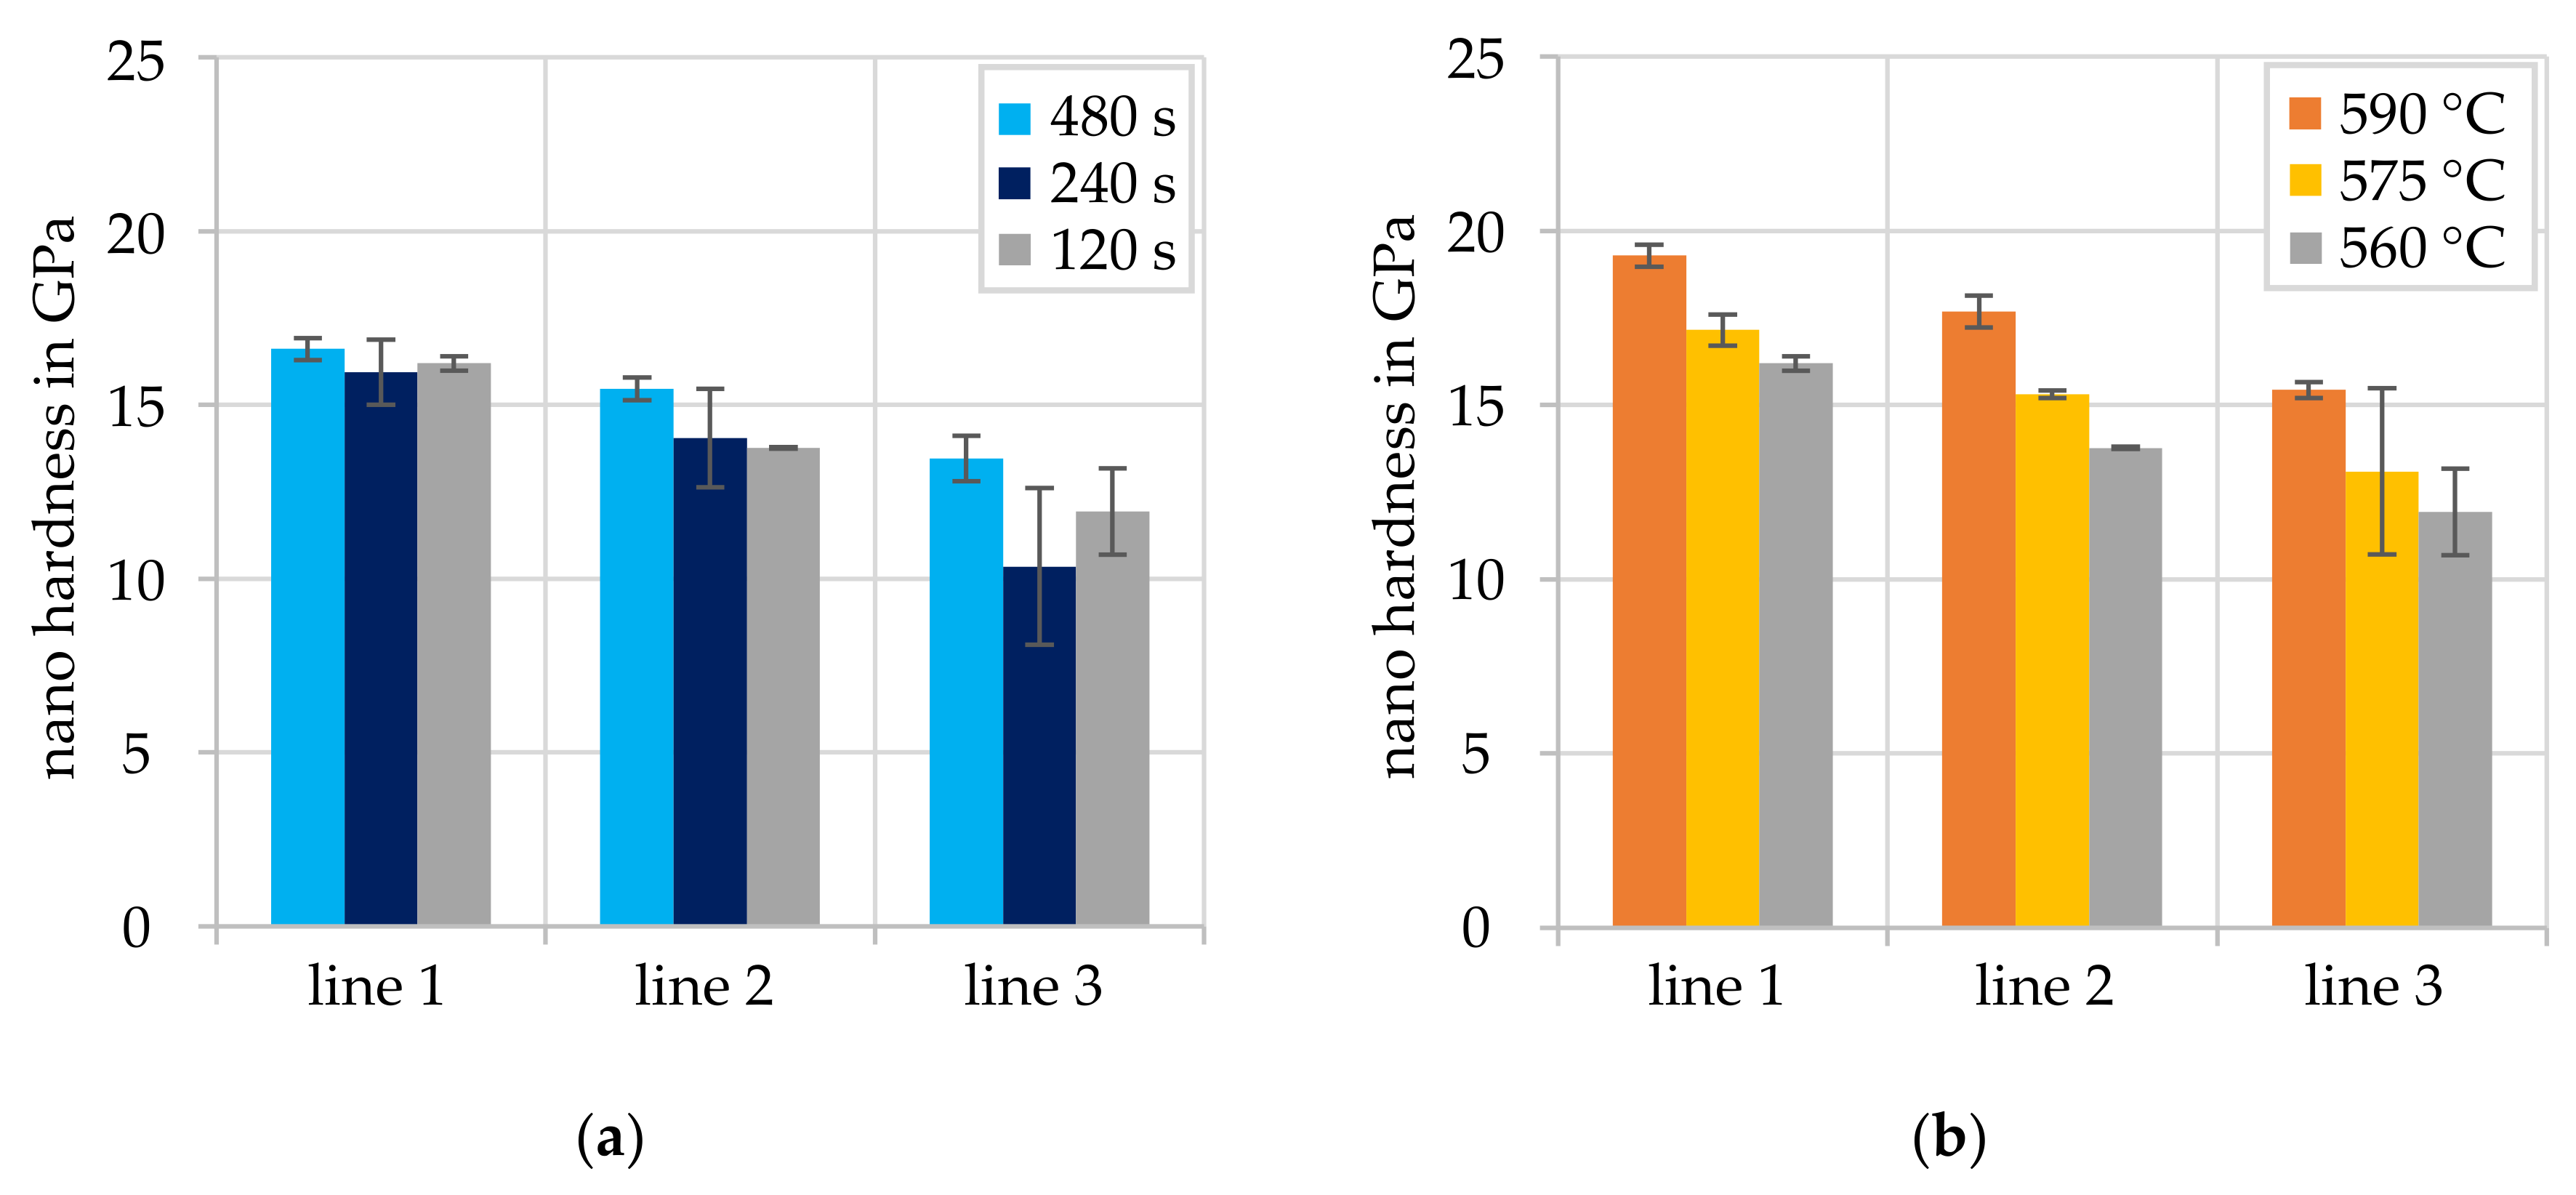
The evaluation of the three series of measurements in Figure 11 shows that the hardness decreases continuously from line one to line three for all investigated specimens. As shown in Figure 11a, the contact time does not seem to have a significant influence on the resulting nano hardness. When time is varied, the hardness of the investigated specimens is at a similar level for each line, although the phase seam width increases with time. The larger scatter in line three is caused by the fact that the transition of the intermetallic phase to the aluminum formed an irregular jagged pattern. Therefore, the positioning of the indent is more critical. If the indentations are placed too close to the jagged transition, they will partially slide off into the much softer aluminum, which affects the hardness value determined. A further explanation for the strong scattering of the nano hardness in line three might be that if the indent lies optically within the intermetallic phase in the SEM image, no statement can be made regarding the geometrical shape of the intermetallic phase in the depth direction. Contrary to the observation of the development of the nano hardness as a function of time, the nano hardness increases slightly over all phases with increasing temperature, see Figure 11b. The high hardness values measured in the intermetallic phase seam indicate, in accordance with the results of the EDS measurements and the hardness data from literature, the presence of the Al-rich intermetallic phases FeAl2, Fe2Al5 or FeAl3. Ogura et al. stated that the hardness of the Al-rich phases is higher than the hardness of the Fe-rich phases, which is due to their lattice structure and a smaller number of slip systems. They also observed a decrease in the hardness of the intermetallic phase from steel to aluminum [6].
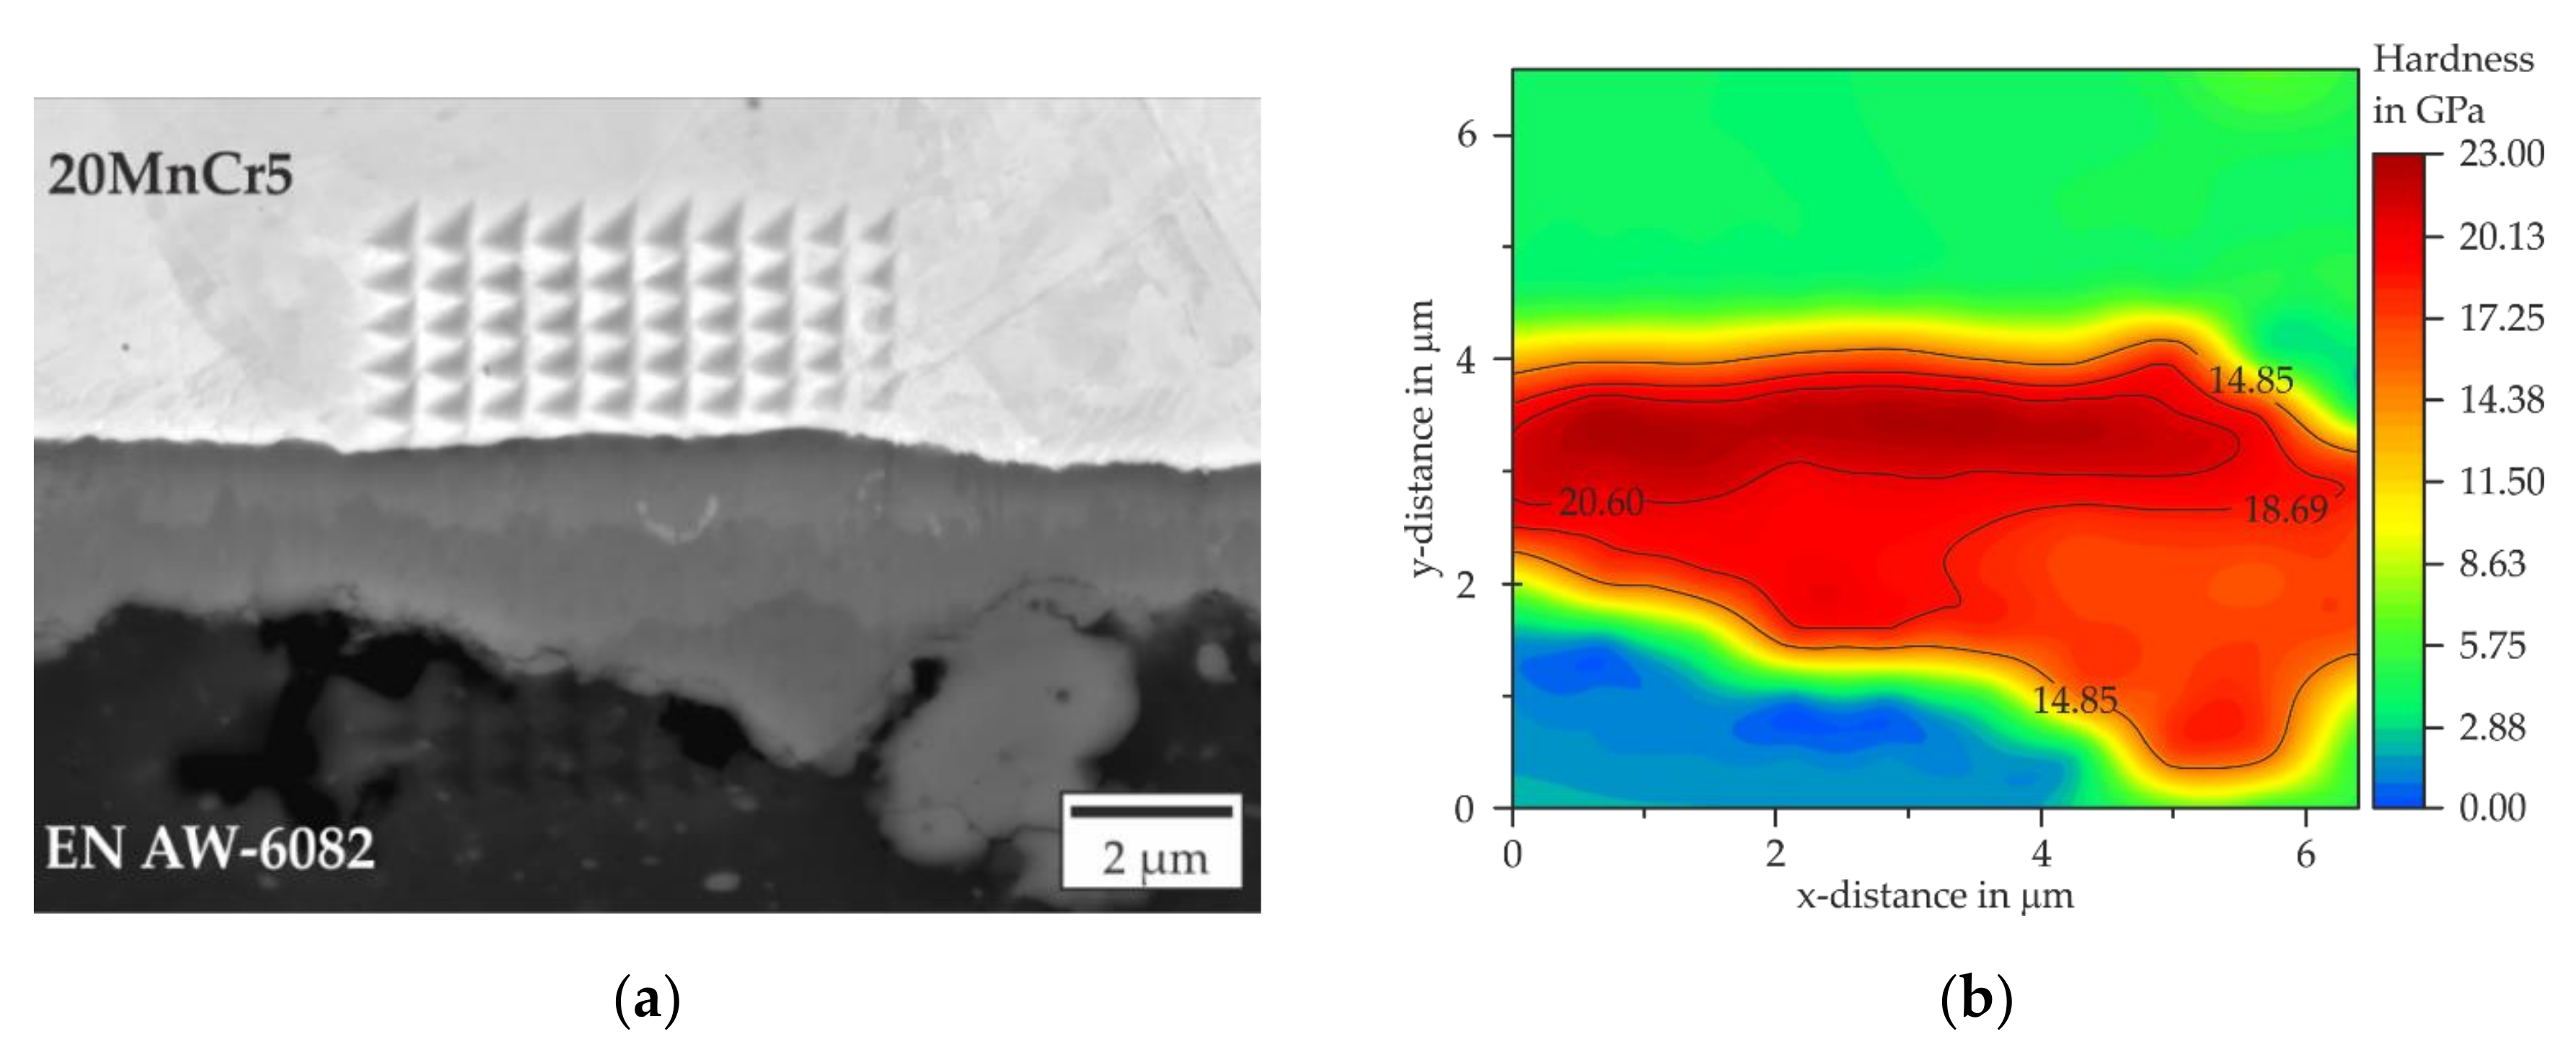
To investigate the properties of the joining zone with a high later resolution, XPM measurements were performed. In Figure 12a the resulting indentations in the SEM image of a joining zone that was formed at a temperature of 590 °C, a holding time of 120 s and a force of 5890 N are exemplarily shown. In the intermetallic phase, the indents are significantly smaller than in the base material due to its high hardness. In the base material, the hardness values can only be assessed qualitatively due to the small distance between the indents. In the case of steel and aluminum, the distance between the indentations of 0.7 µm at a test load of 1000 µN is too small to be able to evaluate the hardness values quantitatively. The indents influence each other so that the hardness values increase, as can be seen in the hardness map in Figure 12b. Here, the nano hardness for steel is 5.75 GPa is higher compared to 4.85 GPa in Figure 9d. However, the objective of the XPM measurements was to characterize the hardness development over the intermetallic phase with high resolution. The indents of the intermetallic phase are difficult to see in the SEM image because the penetration depth was about 35 nm and therefore, not clearly visible in the BSE images. The indent was more clearly visible using the in-lens detection, where a gap between the intermetallic phase and the aluminum could also be detected, which is shown in the image here as a black spot in the lower left corner of the measuring field. It is not clear whether the crack was caused by the preparation of the specimen.
Due to the lower penetration depth of the indent within the intermetallic phase, the indents do not influence each other and the minimum penetration depth of 25 nm was also exceeded, so that the recorded hardness values could also be evaluated quantitatively. The different phases, which are visible in the SEM picture, are also displayed in the hardness map. Isolines were included in the hardness map to represent the transitions of the individual phases. Compared to the hardness values of line one at 590 °C (see Figure 10a), it is shown that the hardness in the hardness map is 3 GPa higher in the area of line one. With a higher test load of 3000 µN the indent must be moved further away from the transition, so that no mixed hardness is produced due to the larger indentation. By means of the XPM measurement, it was possible to make measurements closer to the transition of steel due to the low-test load. This allows the individual phases to be visualized by ISO lines in the hardness map.

3.3. Validation of the Subroutine

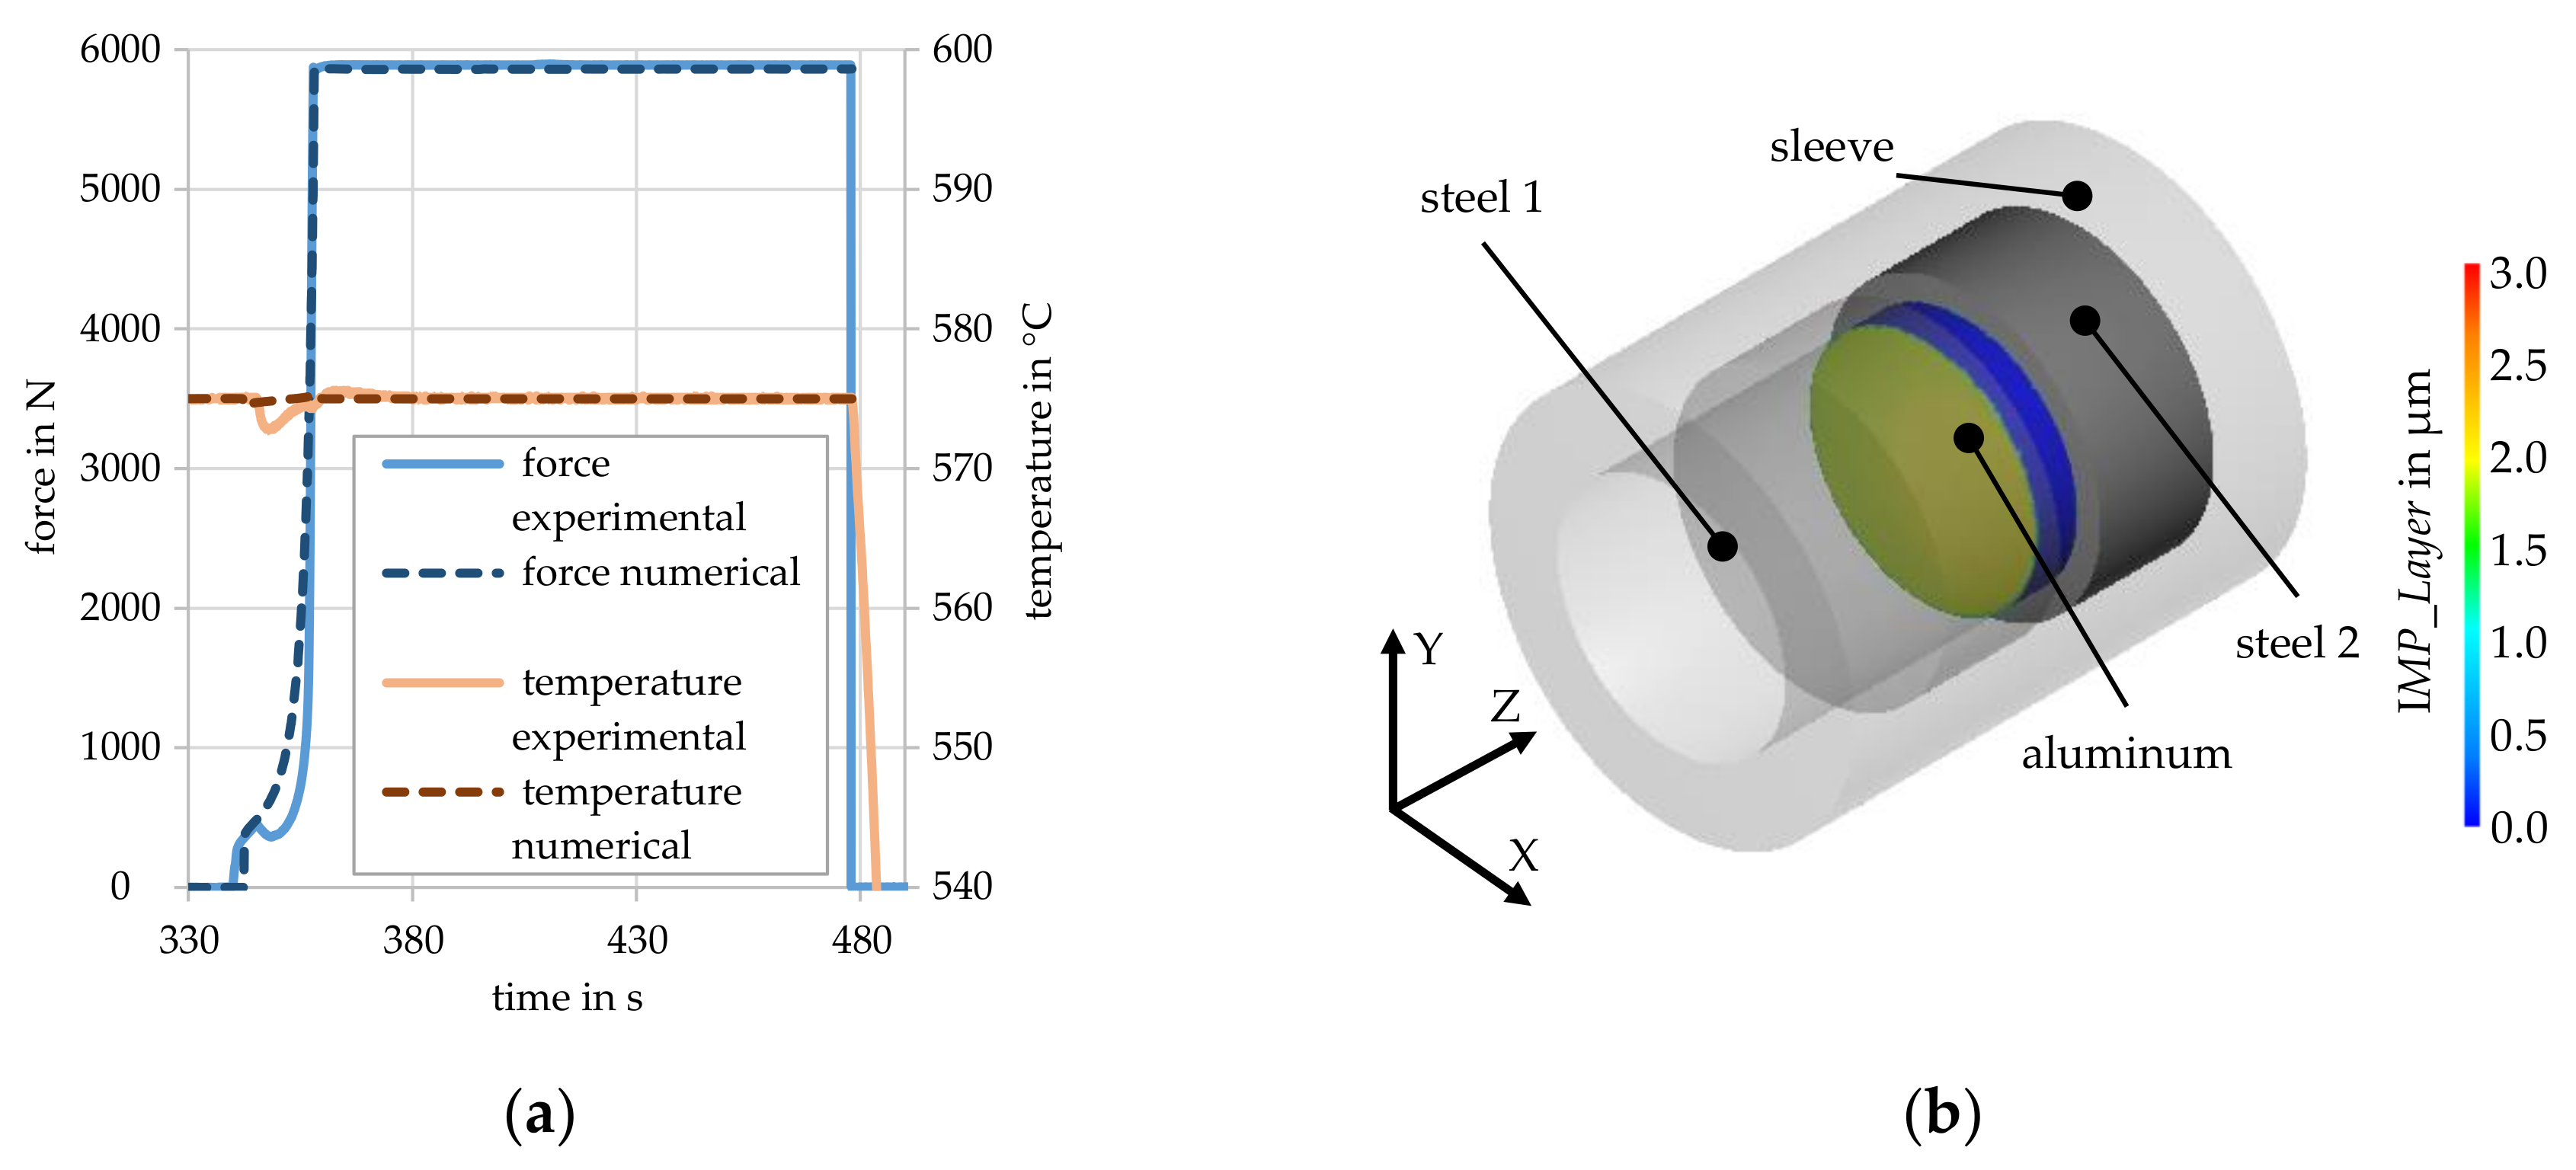
A first verification of the functionality of the developed subroutine for calculating the intermetallic phase seam width was presented in [21]. For the final validation of the subroutine within the present study, further experiments with parameter sets that differ from the sets used for parameterization of the diffusion coefficient were performed. The following results refer to an experiment with a temperature of 575 °C, a forming time of 120 s and a forming force of 5890 N. In Figure 13a, the comparison of the resulting numerical and experimental force–time and temperature–time curves is shown. The temperature was kept constantly at 575 °C in the simulation and experiment. In the experiment, a slight drop in temperature can be seen at the beginning of the forming step, which is due to the increasing contact of the aluminum with the sleeve and the resulting change in heat flow, which cannot be compensated instantly by the temperature controller due to the inertia of the heating coil. Shortly after reaching the maximum force of 5890 N, the temperature became stable again. The force–time curves of the simulation and the experiment show a very good agreement just like the temperature progression. Deviations in the force–time curve are most pronounced at the beginning of the forming process, where the force in the experiment shows a small drop. This drop can be attributed to the alignment of the faces of the specimens in the experimental setup. In the further course of the test, the force increases exponentially in both courses due to the upsetting of the aluminum cylinder and the filling of the sleeve.
The calculated intermetallic phase seam width for a test temperature of 575 °C is shown in the corresponding FE model, see Figure 13b. The comparison of the experimentally determined phase seam widths and the simulated phase seam widths is shown in Figure 14a. The simulated phase seam widths of the temperatures, which were used to create the function in Figure 7b, show a very high degree of agreement. At 575 °C, the median of the experimental phase width is 1.96 µm, at the simulated one the phase width is on average 2.05 µm in the contact area. This comparison shows a very good agreement, even if the difference in values is larger compared to the other temperatures. Figure 14b shows the corresponding result of the simulations. At 575 °C, it is clear to see that the nodes, which were in contact with the steel cylinders at the beginning of the forming process, have a larger phase seam width than the nodes which reached the contact area only after the forming process. The different phase seam widths are due to the different contact times.

4. Conclusions and Outlook

Within the present study a model for the calculation of the intermetallic phase seam thickness was developed, which is based on the Einstein–Smoluchowski equation and implements a temperature dependent diffusion coefficient. An experimental setup was designed for analogy experiments on a forming dilatometer to analyze the influence of process conditions and determine the input parameters. Specifically, experiments were performed at different temperatures, forces and forming times to investigate the influence of the boundary conditions on the resulting phase seam width. The thickness of the resulting intermetallic phases was subsequently measured by SEM examinations and optical image analysis. Nanoindentation and EDS measurements were carried out to determine the element distribution and properties of the joining zone. Based on experimental findings, the diffusion coefficient within the developed model was determined and implemented into the commercial FE software Forge NxT 3.0 by means of a user-subroutine. The subroutine was successfully validated by comparison with the experimental results of the analogy experiments, and a high correlation between the experimental and simulated phase thicknesses was achieved.
Based on the presented results, the following conclusions can be drawn:
  • As expected, the growth of intermetallic phases in the joint zone of EN AW-6082 and 20MnCr5 is time-dependent. By calculating the intermetallic phase seam width using the Einstein–Smoluchowski equation, a good agreement with the experimental data was achieved.
  • With rising temperature, the phase seam width and the apparent diffusion coefficient increase.
  • The force showed no significant effect on the phase formation in the investigated range.
  • The SEM images indicated the presence of up to three different intermetallic phases in the joining zone. This was confirmed by EDS and nanoindentation measurements. At temperatures above 560 °C or times above 120 s, the formation of different intermetallic phases was observed.
  • Due to the high aluminum content and the hardness determined in the EDS and nanoindentation analysis, the presence of the phases FeAl2, Fe2Al5 or FeAl3 would be possible, but could not be clearly proven. To confirm this assumption, further electron probe micro analysis (EPMA) and X-ray diffraction (XRD) investigations are to be carried out. In future work, the usability of the subroutine for the co-extrusion process will be tested and validated based on experimental investigations.

Author Contributions

Conceptualization, B.-A.B., C.K. and H.J.M.; methodology, J.U., N.H. and H.W.; software, J.U. and N.H.; validation, J.U., N.H. and S.E.T.; investigation, J.U. and N.H.; writing—original draft preparation, J.U. and N.H.; writing—review and editing, S.E.T., H.W., H.J.M., and B.-A.B.; visualization, J.U. and N.H.; supervision, B.-A.B., C.K. and H.J.M.; project administration, B.-A.B., C.K. and H.J.M.; funding acquisition, B.-A.B., C.K. and H.J.M. All authors have read and agreed to the published version of the manuscript.

Funding

This research was funded by the Deutsche Forschungsgemeinschaft (DFG, German Research Foundation) grant number 252662854. The APC was funded by the Deutsche Forschungsgemeinschaft (DFG, German Research Foundation).

Acknowledgments

The results presented in this paper were obtained within the Collaborative Research Center 1153 “Process chain to produce hybrid high performance components by Tailored Forming” in the subproject A01, funded by the Deutsche Forschungsgemeinschaft (DFG, German Research Foundation)—252662854. The authors thank the German Research Foundation (DFG) for their financial support of this project.

Conflicts of Interest

The authors declare no conflict of interest.

References

  1. Sierra, G.; Peyre, P.; Deschaux-Beaume, F.; Stuart, D.; Fras, G. Steel to aluminium key-hole laser welding. Mater. Sci. Eng. A 2007, 447, 197–208. [Google Scholar] [CrossRef]
  2. Watanabe, T.; Takayama, H.; Yanagisawa, A. Joining of aluminum to steel by friction stir welding. J. Mater. Process. Technol. 2006, 342–349. [Google Scholar] [CrossRef]
  3. Ashfaq, M.; Sajja, N.; Khalid Rafi, H.; Prasad Rao, K. Improving strength of stainless steel/aluminum alloy friction welds by modifying faying surface design. JMEPEG 2013, 22, 376–383. [Google Scholar] [CrossRef]
  4. Behrens, B.-A.; Kosch, K.-G. Development of the heating and forming strategy in compound forging of hybrid steel-aluminum parts. Mat. Werkstofftech. 2011, 42, 973–978. [Google Scholar] [CrossRef]
  5. Behrens, B.-A.; Klose, C.; Chugreev, A.; Heimes, N.; Thürer, S.E.; Uhe, J. A numerical study on co-extrusion to produce coaxial aluminum-steel compounds with longitudinal weld seams. Metals 2018, 8, 717. [Google Scholar] [CrossRef] [Green Version]
  6. Ogura, T.; Ueda, K.; Saito, Y.; Hirose, A. Nanoindentation measurement of interfacial reaction layers in 6000 series aluminum alloys and steel dissimilar metal joints with alloying elements. Mater. Trans. 2011, 52, 979–984. [Google Scholar] [CrossRef] [Green Version]
  7. Ryabov, V.R. Welding of aluminum alloys to steels. Weld. Surf. Rev. 1998, 9, 1–139. [Google Scholar]
  8. Agudo, L.; Jank, N.; Wagner, J.; Schmaranzer, C.; Arenholz, E.; Bruckner, J.; Hackl, H.; Pyzalla, A. Investigation of microstructure and mechanical properties of steel-aluminium joints produced by metal arc joining. Steel Res. Int. 2008, 79, 530–535. [Google Scholar] [CrossRef]
  9. Springer, H.; Kostka, A.; Payton, E.J.; Raabe, D.; Kaysser-Pyzalla, A.; Eggeler, G. On the formation and growth of intermetallic phases during interdiffusion between low-carbon steel and aluminum alloys. Acta Mater. 2011, 59, 1586–1600. [Google Scholar] [CrossRef]
  10. Yamamoto, N.; Tkahashi, M.; Aritoshi, M.; Ikeuchi, K. Effect of intermetallic compound layer on bond strength of friction-welded interface of commercially pure aluminum to mild steel. Q. J. Jpn. Weld. Soc. 2005, 23, 622–627. [Google Scholar] [CrossRef]
  11. Kimapong, K.; Watanabe, T. Lap joint of A5083 aluminum alloy and SS400 steel by friction stir welding. Mater. Trans. 2005, 46, 835–841. [Google Scholar] [CrossRef] [Green Version]
  12. Yilmaz, M.; Çöl, M.; Acet, M. Interface properties of aluminum/steel friction-welded components. Mater. Charact. 2003, 49, 421–429. [Google Scholar] [CrossRef]
  13. Fukumoto, S.; Tsubakino, H.; Okita, K.; Aritoshi, M.; Tomita, T. Static joint strength of friction welded joint between aluminium alloys and stainless steel. Weld. Int. 2000, 14, 89–93. [Google Scholar] [CrossRef]
  14. Herbst, S.; Dovletoglou, C.N.; Nürnberger, F. Method for semi-automated measurement and statistical evaluation of iron aluminum intermetallic compound layer thickness and morphology. Metallogr. Microstruct. Anal. 2017, 6, 367–374. [Google Scholar] [CrossRef] [Green Version]
  15. Oliver, W.C.; Pharr, G.M. An improved technique for determining hardness and elastic modulus using load and displacement sensing indentation experiments. J. Mater. Res. 1992, 7, 1564–1583. [Google Scholar] [CrossRef]
  16. Fischer-Cripps, A.-C. Nanoindentation, 3rd ed.; Springer: New York, NY, USA, 2011; pp. 21–37. [Google Scholar]
  17. Heumann, T. Diffusion in Metallen. Grundlagen, Theorie, Vorgänge in Reinmetallen und Legierungen, 1st ed.; Springer: Berlin/Heidelberg, Germany, 1992; pp. 4–13. [Google Scholar]
  18. Rummel, G.; Zumkley, T.; Eggersmann, M.; Freitag, K.; Mehrer, H. Diffusion of implanted 3d-transition elements in aluminium part II: Pressure dependence. diffusion implantierter 3d-Übergangselemente in aluminium. Teil II: Druckabhängigkeit. Z. Met. 1995, 95b, 131–140. [Google Scholar]
  19. Rummel, G.; Zumkley, T.; Eggersmann, M.; Freitag, K.; Mehrer, H. Diffusion of implanted 3d-transition elements in aluminium part I: Temperature dependence. diffusion implantierter 3d-Übergangselemente in aluminium. Teil I: Temperaturabhängigkeit. Z. Met. 1995, 95a, 122–130. [Google Scholar]
  20. Massalski, T.B.; Okamoto, H. Binary alloy phase diagrams. In American Society for Metals; ASM International: Novelty, OH, USA, 1990. [Google Scholar]
  21. Behrens, B.-A.; Klose, C.; Thürer, S.E.; Heimes, N.; Uhe, J. Numerical modeling of the development of intermetallic layers between aluminium and steel during co-extrusion. AIP Conf. Proc. 2019, 2113, 040029. [Google Scholar]
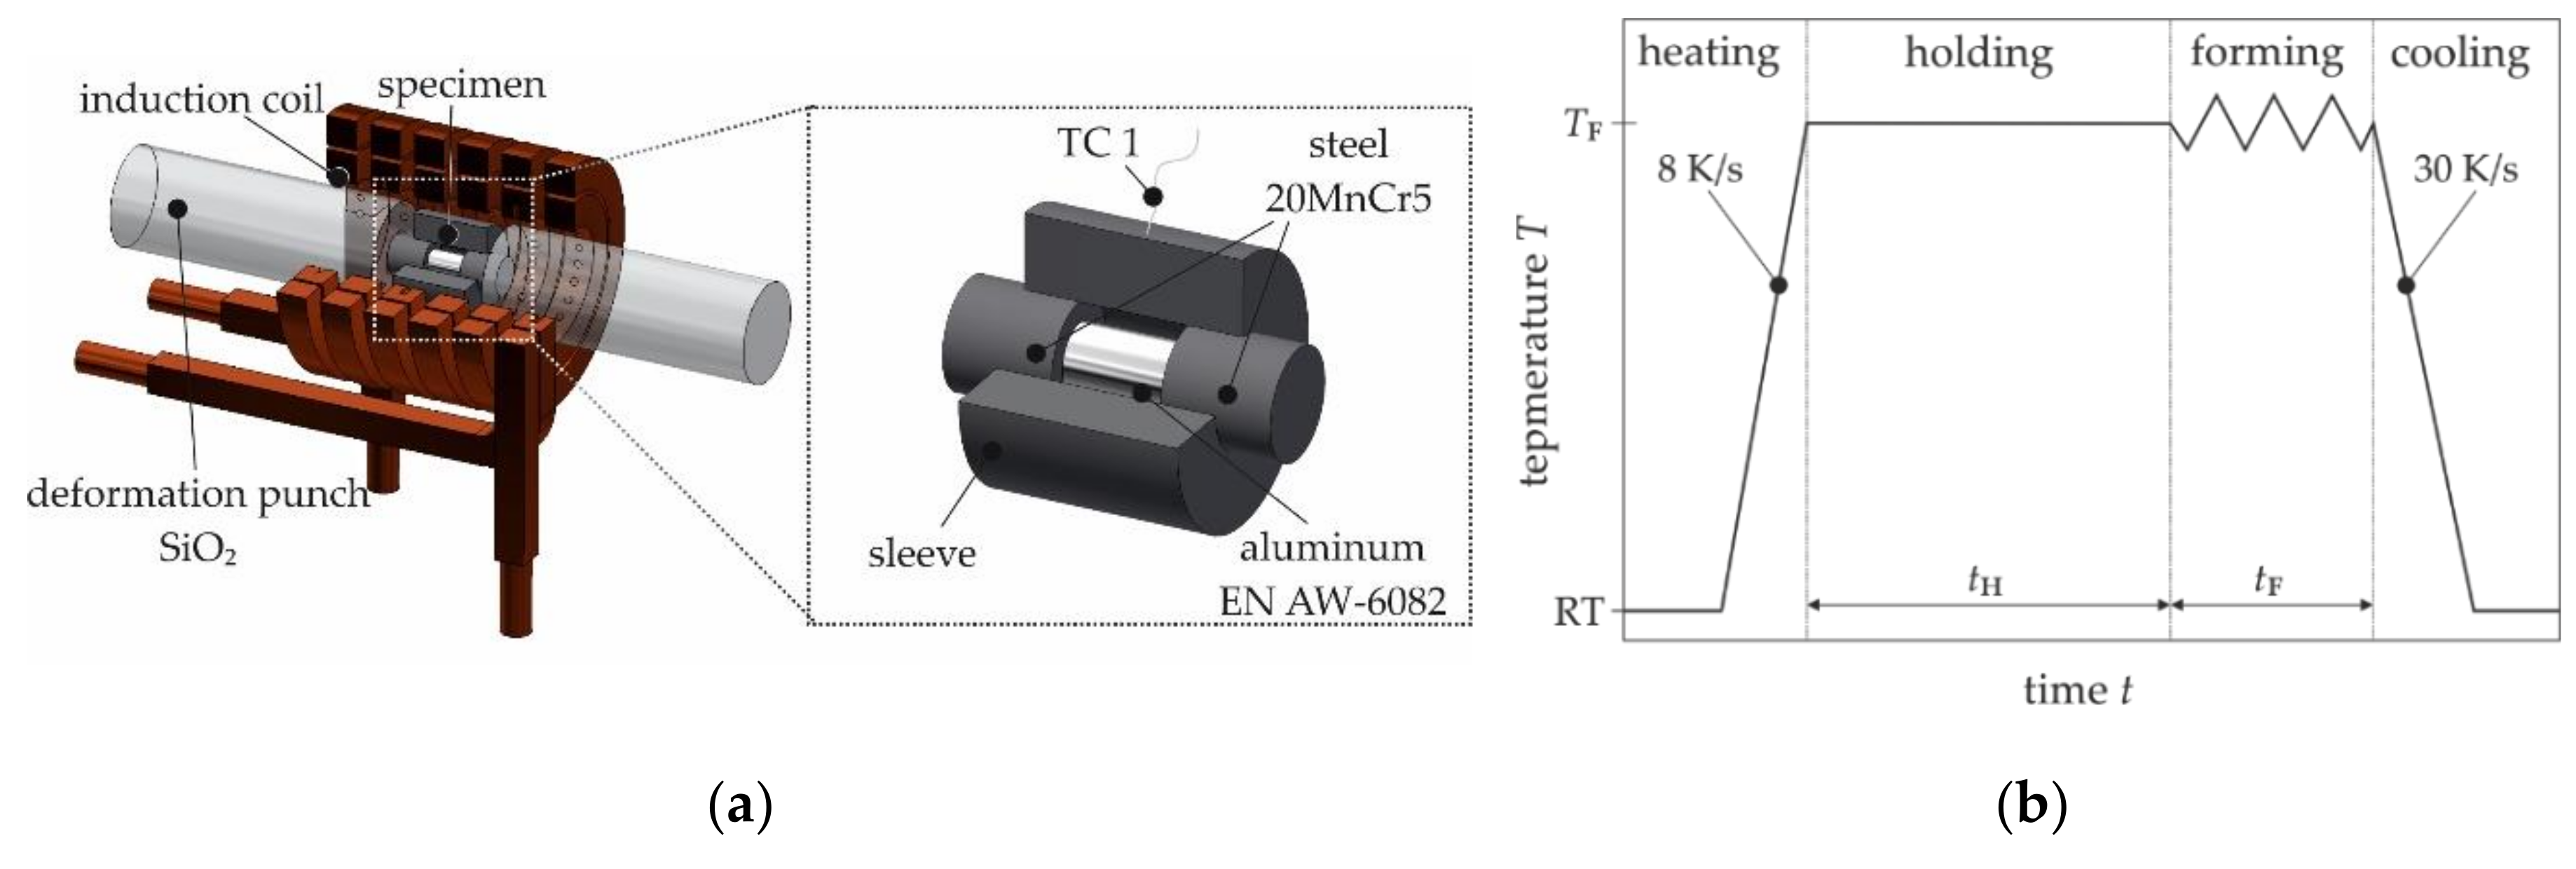
Figure 1. (a) Schematic test setup of the analogy experiments on a forming dilatometer, (b) temperature–time curve used in the experiments.
Metals 10 01582 g001
Figure 2. Schematic representation of a formed specimen with highlighted positions of the scanning electron microscopy (SEM) and nanoindentation measurements.
Metals 10 01582 g002
Figure 3. (a) 3D finite element (FE) model of the analogy experiment, (b) influence of the minimal element length on the calculated force and the computation time.
Metals 10 01582 g003
Figure 4. Flow chart for the developed subroutine that is executed for each node of the aluminum in each increment.
Metals 10 01582 g004
Figure 5. SEM images of the resulting joining zones formed in the analogy experiments at a forming temperature of 560 °C, a force of 5890 N and a forming time of (a) 30 s, (b) 60 s, (c) 120 s and (d) 240 s.
Metals 10 01582 g005
Figure 6. Development of the intermetallic phase seam thickness with indication of the standard deviation as a function of (a) forming time and forming temperature for a force of 5890 N, (b) force for a temperature of 560 °C and a forming time of 120 s.
Metals 10 01582 g006
Figure 7. (a) Development of intermetallic phase seam thickness as a function of forming temperature with indication of the standard deviation for a forming time of 120 s and force of 5890 N, (b) apparent diffusion coefficient as a function of forming temperature with representation of the approximation function.
Metals 10 01582 g007
Figure 8. EDS and SEM analysis of the joining zone of a specimen for (a) 575 °C, 120 s, 5890 N and (b) 590 °C, 480 s, 5890 N.
Metals 10 01582 g008
Figure 9. Examination of a joining zone formed at 575 °C, 120 s and 5890 N with nanoindentation measurements with a test force of 3000 µN: (a) scanning probe microscopy (SPM) image, (b) SEM image, (c) force-penetration curves, (d) nano hardness of aluminum, steel and the intermetallic phase seam.
Metals 10 01582 g009
Figure 10. (a) SEM image and resulting nano hardness of a specimen, which was formed at a temperature of 590 °C, a forming time of 480 s and a force of 5890 N, (b) Schematic representation of the approach used during the nano hardness measurements, see main text for details.
Metals 10 01582 g010
Figure 11. Nano hardness in the joining zone. (a) For a forming temperature of 560 °C, a force of 5890 N and different forming times. (b) For a forming time of 120 s, a force of 5890 N and different forming temperatures.
Metals 10 01582 g011
Figure 12. XPM measurement of a joining zone formed at 590 °C, 120 s, 5890 N: (a) SEM image of the measuring site; (b) mapping of the nano hardness.
Metals 10 01582 g012
Figure 13. Numerical simulation of the analogy experiment at a temperature of 575 °C, a forming time of 120 s, and a force of 5890 N: (a) comparison of force–time and temperature–time curves, (b) simulated thickness of the intermetallic phase seam.
Metals 10 01582 g013
Figure 14. (a) Comparison of the experimentally determined intermetallic phase seam thickness with the simulated phase seam thickness of the respective forming temperature for a forming time of 120 s and a force of 5890 N, (b) simulated thickness of the intermetallic phase seam.
Metals 10 01582 g014
Table 1. Test matrix used for the dilatometer experiments; the values deviating from the reference configuration are highlighted in italics.
Test SeriesTemperature TF in °CForming Time tF in sForce F in N
Reference variant5601205890
Temperature variation450, 505, 560, 5901205890
Time variation 156030, 60, 120, 240, 4805890
Time variation 259060, 120, 240, 4805890
Force variation5601201500, 2797, 5890
Validation5751205890
Table 2. Chemical composition of the aluminum alloy EN AW-6082 in wt.%, the balance is Al.
MaterialSiFeCuMnMgCrZnTi
EN AW-60821.11
± 0.0295
0.19
± 0.0349
0.0349
± 0.001
0.438
± 0.006
0.656
± 0.027
0.0352
± 0.001
0.0169
± 0.002
0.0186
± 0.002
Table 3. Chemical composition of the steel alloy 20MnCr5 in wt.%, the balance is Fe.
MaterialCSiMnCrS
20MnCr50.22 ± 0.020.21 ± 0.011.10 ± 0.021.01 ± 0.01090.0131 ± 0.0007
Publisher’s Note: MDPI stays neutral with regard to jurisdictional claims in published maps and institutional affiliations.