Article

Characterization of High-Strength Packaging Steels: Obtaining Material Data for Precise Finite Element Process Modelling

1
Thyssenkrupp Rasselstein GmbH, 52262 Andernach, Germany
2
Institute of Metal Forming, RWTH Aachen University, 52056 Aachen, Germany
*
Author to whom correspondence should be addressed.
Metals 2020, 10(12), 1683; https://doi.org/10.3390/met10121683
Submission received: 20 November 2020 / Revised: 10 December 2020 / Accepted: 14 December 2020 / Published: 16 December 2020

Abstract

:
The steadily increasing demand for downgauging to reduce costs in packaging steel applications requires the development of high-strength packaging steel grades to meet strength requirements. At the same time, the demand for a simulative, computer-aided layout of industrial forming processes is growing to reduce costs in tool constructions for downgauging manners. As part of this work, different high-strength packaging steels were characterized for use in a finite element based process layout and validated using application-oriented experiments. Due to a low hardening rate and the occurrence of Lüders bands, high-strength packaging steels show a low amount of elongation in tensile tests, while for other stress states higher degrees of deformation are possible. Thus, common extrapolation methods fail to reproduce the flow curve of high-strength packaging steels. Therefore, a new approach to extrapolate the flow curve of high-strength packaging steels is presented using the tensile test and bulge test data together with a combined Swift–Voce hardening law. Furthermore, it is shown that the use of complex anisotropic yield locus models such as Yld2000-2d is necessary for high-strength packaging steels in order to be able to precisely simulate application-oriented loads in between plane strain and biaxial tension in validation experiments. Finally, the benefit of a material selection process for packaging steel applications guided by finite element simulations based on precisely characterized material behaviour is demonstrated.

1. Introduction

Packaging steel is characterized by a very low thickness (<0.5 mm), a low carbon content, a ferritic microstructure and a chromium or tin coating. Ever increasing demand for downgauging in order to improve sustainability and to reduce costs is the key driver in the packaging steel market. High-strength packaging steels (HSPS) have been an important research focus in recent years, as they enable reduced sheet thicknesses whilst maintaining strength and performance. HSPS, at the same time, require a certain degree of formability in applications, such as easy open ends or aerosol components with complex forming operations. Currently, the simple criterion of at least five percent of elongation in tensile testing is imposed, as it is easy to verify and compare. However, in typical applications packaging steels show much more formability as the stress state is multiaxial rather than uniaxial. In the past, several new HSPS were developed to meet the demand of downgauging. To estimate material savings via thickness reduction and to be able to describe the material behaviour, finite element simulation is a very powerful tool that reduces experimental effort. At the same time, finite element analysis (FEA) in the packaging steel sector is not as widespread as, for example, FEA in the automotive sector. In particular, the common methods to determine material data for finite element simulation are not designed for the specific requirements of packaging steel due to its low thickness, high temper rolling degrees and occurrence of Lüders bands. Especially high temper rolling degrees result in a low amount of hardening. In line with the well-known Considère-criterion [1], this leads to a fast occurrence of geometric softening whilst forming under tensile load, and thus a very small range of homogenous yielding. However, in application formability is higher due to the multiaxial stress states, and thus requires on the one hand an appropriate extrapolation of the flow curve from tensile tests, and on the other hand a precise description of the multiaxial stress state via yield locus models. Different yield locus models differ mainly in the area of plane strain to biaxial stress state. Hence, the aim of this work is to investigate the specific requirements in characterizing the material data of HSPS for finite element simulations.

2. State of the Art

For every simulation of a forming process, the characterization of specific material is mandatory. Beside elastic properties such as Young’s modulus and Poisson’s ratio, it is very important to obtain data to describe the plastic yield behaviour of the material. Therefore, the yield stress has to be measured. Due to hardening, yield stress is a function of true plastic strain. Hence, a flow curve must be quantified. In industrial forming processes, the stress state is typically not uniaxial. Thus, yield locus models must be used to describe the material behaviour under multiaxial loading conditions. Several yield locus models, which predict an equivalent stress depending on the current stress state and material dependent input parameters, have been established. Von Mises [2] established the most common isotropic yield function, where only the flow curve of a uniaxial tensile test in rolling direction is needed. To take anisotropic yield behaviour into account, Hill [3] proposed a quadratic yield locus function with consideration of in-plane Lankford coefficients measured from tensile tests in 0°, 45° and 90° orientation to the rolling direction. This leads to a more precise description of the forming behaviour if the material is anisotropic. Barlat [4] developed one of the most complex yield locus functions in 2003, referred to in the following as Yld2000-2d. It is based on two functions, each with a linear transformation of the deviatoric stress-tensor. This in-plane function allows us to consider yield stress differences in 0°, 45° and 90° as well as Lankford coefficients in these directions and biaxial behaviour. Table 1 presents the required input parameters for the mentioned yield locus models.
To give an exact description of the hardening, different flow curve models have been established. Swift [5] and Voce [6] proposed two of the most common approaches with an exponential formulation considering the yield strength. While the Swift equation leads to a distinctive hardening even at higher strains, the Voce approach describes a more saturated behaviour of the yield stress at higher strains.
To determine the relevant parameters for the simple constitutive models, i.e., flow curve models and the Hill48 yield locus model, quasi-static tensile tests are sufficient. To calibrate complex constitutive models such as the Yld2000-2d yield locus model, additional experiments are necessary to capture the anisotropic plastic behaviour. Kuwabara [7] comprehensively summarizes the experimental methods available in sheet metal forming and identifies hydraulic bulge tests and biaxial compression tests as suitable candidates. The bulge tests offer the potential to characterize the relevant parameters for the Yld2000-2d yield locus model as already demonstrated by Suttner et al. [8], while also exploring precise strain-rate control in bulge testing. In addition, Gutscher et al. [9] stated that bulge tests can be used to achieve higher strains than tensile tests, thus enabling a better hardening prediction.
Simulations carried out for packaging steels have mostly focused on analysing and optimizing the underlying forming processes. Thus, for example Nam and Han [10] simulated the ironing process of D&I (Drawn and Ironing) cans using Swift’s hardening law in 2000, measured with standard tensile tests. Pepelnjak and Barisic [11] developed a method in 2007 to eliminate stretcher strains on tinplate rings in the stamping process. The material characterization was based on standard tensile tests with optical measurement systems. Due to relatively low maximal true strain, the difficulties in the determination of mechanical parameters such as Lankford coefficients were already evident. Therefore, Pepelnjak parameterized the simulation with an isotropic yield function. In 2005, Barisic et al. [12] also simulated the deep drawing process of tinplate rings using Hollomon–Ludwik’s hardening law [13] and the Hill48 yield function, also only measured by standard tensile tests. Moreira [14] simulated tinplate behaviour in hemispherical punch experiments and cup-drawings in 2007 with Ferron’s and Hill’s quadratic yield function and reached good results with the simple assumption of isotropic hardening set by Swift–Krupkowksi’s power law. The material parameters were measured with standard tensile tests as well. To analyse the wall thinning effect during a deep drawing process of two-piece cans in 2017, Horta et al. [15] used a standard tensile test, Swift hardening equation and Hill48 yield locus to describe the material behaviour. In 2018, Slota et al. [16] simulated the forming limits in cup drawing and expansion processes for the packaging steel TH330. To capture the material response, they extrapolated stress–strain curves obtained in a bulge test using a hardening law put forward by Krupkowski. Additionally, they used the Hill48 yield locus model that was parametrized via quasi-static tensile tests.
There are only a few publications focusing on characterization methods of packaging steel. Illera et al. [17] proposed an approach to determine material parameters via a combination of finite element methods and data mining techniques in 2014. Therein, simulated data of hardness and springback tests were used to predict yield strength and plastic hardening with regression models. In this paper, conventional packaging steel in addition to high-strength packaging steels were considered, but only with regards to yield strength and tensile strength. The precise determination of a flow curve was not part of this publication. Subsequently, Fernández-Martinéz et al. [18] compared the aforementioned concept to a direct regression of the yield strength from experimental hardness and springback data and found the latter approach to be more accurate. To verify the strain-rate influence on the flow curve in the characterization of packaging steel, in 2016 Linnemann et al. [19] used quasi static (0.0003 1/s) and high speed tensile tests (250 1/s). However, the analysis only investigated the homogenously yielding material T52BA with a high amount of elongation. Moldovan [20] first focused on the characterization of the packaging steel TS290 for FEA transmitting methods established in the automotive sector. This analysis showed that with increasing complexity of the yield locus model, a more precise simulation is feasible in limited dome height validation experiments of the characterized material. For the extrapolation of the flow curve, Moldovan implemented a combination of the common methods by Voce [6] and Swift [5] and calibrated this method using tensile test and hydraulic bulge test data. Beier et al. [21] originally proposed this method to obtain a precise prediction of the yield stress at high strains. However, the investigated TS290 material has a high level of elongation in tensile tests compared to HSPS due to its lower strength. Furthermore, it does not show aging effects due to batch annealing.
In summary, the presented approaches either deal with the simulation of comparably low strength packaging steels exhibiting a higher amount of elongation or only use basic approaches to describe the plastic behaviour within the process simulation. The characterization of HSPS and hence the specific requirements in the characterization arising from the low elongation under tensile load and the occurrence of Lüders bands have not been investigated yet.

3. Materials and Methods

The following chapters present the investigated materials and the experimental procedure to characterize two different HSPS. On the basis of the distinctive characterization, a new extrapolation method for HSPS is proposed and different yield locus models calibrated. Finally, the forming limit curve for both materials was determined to estimate the fracture strains.

3.1. Materials and Condition Prior to Forming

In this paper, two materials TH700 and TH620 with similar thickness but different strength were characterized with regards to finite element simulation based process layout (Table 2). In accordance with the current standard DIN EN 10202:2001 [22], the temper designation of the materials is based on the upper yield strength ReH measured by tensile tests in rolling direction. The slight deviation between the temper designation and the below listed value of ReH results from a slightly different testing procedure between the standard practice used in quality control and the characterization carried out in this paper. The specimens for this paper were produced via milling instead of cutting and also a reduced testing speed was used.
In addition to the established parameters upper (ReH) and lower (ReL) yield strength [23], the stress at a plastic elongation of 0.5% (Rp0.5) is determined in this paper. On the one hand, this serves to avoid the region of scatter beyond the upper yield point, and on the other hand this criterion is more comparable as it is defined at a fixed plastic strain-value.
The carbon content of these ferritic steel grades is only 0.073 wt% and they contain almost no alloying elements due to food directives relevant for the packaging market [22]. Thus, the specific strength level is set by a combination of continuous annealing and subsequent temper rolling. The temper rolling also reduces the effect of Lüders bands resulting from interstitial atoms pinning at dislocations. However, the material will undergo aging (200 °C at 20 min) during the packaging steel lacquering process prior to sheet metal forming, and thus again show inhomogeneous yielding behaviour due to this additional heat treatment.
The material for characterisation also has to be tested in temper rolled and aged conditions to mimic the aforementioned processes. Temper rolling leads to strong pre-hardening and therefore a low residual strain hardening. Due to the low hardening rate, the geometrical softening exceeds the physical hardening early on and thus the Considère-criterion is reached at low strain levels, resulting in a low total elongation in tensile tests. Additionally, Lüders bands introduced by the aging reduce the usable area for optical evaluation once the homogeneous state of deformation sets in. In combination, these two factors lead to severe challenges in the characterisation of the mechanical properties of HSPS.
Due to the low sheet thickness, it is also important to consider possible size effects, i.e., the rapid change of mechanical properties due to microstructural features becoming dominant [24]. In a study of thin sheet metal forming, Raulea et al. [25] observed size effects influencing the mechanical response of the material for sheets with less than 20 grains over the sheet thickness. In the present study, there are about 50 grains over the sheet thickness of the investigated materials, which is a comparably high number with regard to the aforementioned study. Furthermore, in the present study the sheet thickness of the material used for characterization and forming is identical. Thus, no influence on the results is expected as long as the sheet thickness is kept constant.

3.2. Experimental Procedure

To characterize both materials for the purpose of finite element simulation, tensile tests as well as bulge tests to generate stress–strain data up to higher strains and finally forming limit curves were used. Uniaxial tensile tests according to ISO 6892-1:2019 [26] with a measuring length of 80 mm were carried out to measure mechanical properties and to enable a transformation of the bulge test data to the uniaxial stress state. Tests were conducted at a quasi-static strain-rate of 0.00025 1/s. To determine Lankford coefficients, a strain extensometer was used to measure the variation in width during testing. To quantify change in length, another extensometer was used. Due to a very small region of homogeneous yielding in the TH620 material, the tests for this material were carried out using an optical measuring system ARAMIS 12M (GOM GmbH, Braunschweig, Germany). Thus, it was possible to set the range for measuring Lankford coefficients very precisely in between the beginning of the homogenous forming state and the onset of necking. This enables a very precise determination due to averaging the full field strain measurement.
In addition, hydraulic bulge tests were used to extrapolate the flow curve to higher strains while Nakajima tests were conducted to obtain a failure criterion for the FEA. For the bulge tests, an Erichsen Universal Sheet Testing Machine 142 (Erichsen GmbH & Co. KG, Hemer, Germany) according to DIN16808 [27] with a tool diameter of 100 mm and a non-newton fluid as pressure medium was used. Similar fluids were previously used by Gutscher et al. [9] and they simplify tooling design and handling in comparison to a conventional hydraulic fluid. Nakajima tests to obtain forming limit curves were carried out using the same machine in accordance with ISO12004-2 [28]. In this setup, a selection of seven differently waisted rectangular sheet geometries (20 mm, 50 mm, 80 mm, 100 mm, 130 mm and 140 mm specimen width) with a diameter of 186 mm corresponding to strain conditions from deep drawing to biaxial tension were used (Figure 1b). The specimens were clamped with a circular blankholder by applying a force of 160 kN. Tests were carried out with a lubrication setup of three layers of grease between foils of PET (polyethylene terephthalate) to minimize friction. The punch velocity was 8 mm/min.
To verify the accuracy of the determined data and models, limited dome height tests were conducted and additionally one of the waisted Nakajima test specimens, with a specimen width of 100 mm, was reused for validation purposes (in the following referenced as Nakajima100). Those validation experiments were selected to represent typical forming conditions in application. In most applications, failure occurs in areas subjected to stress states between plane strain and biaxial tension. These stress states, for example, arise at bends with small radii in deep drawing, with bottom tears being a typical failure. Therefore, it is crucially important to precisely model the material behaviour for these stress states. At the same time, in this region of the yield locus, the anisotropic yield behaviour prediction by different yield locus models deviates greatly, and therefore this region is best suited for model identification. Both tests cover the relevant region between plane strain and biaxial stress state and deliver a good representation of the processes used for HSPS forming. Kim et al. [29] applied the limited dome height test to predict the formability of high-strength steels and to assess the simulation accuracy of different yield locus models. Furthermore, Moldovan [20] already used the limited dome height test as a surrogate for packaging steel forming and found that different yield locus models gave distinctly different predictions, thus confirming the suitability of this test for model identification. A setup similar to determining forming limit curves via Nakajima tests [28] is chosen for the limited dome height experiment and a circular blank with a diameter of 186 mm. However, instead of lubrication only a single PET-foil is layered between specimen and punch. This results in forming conditions strongly influenced by friction. To quantify the strain distribution, the limited dome height experiments were carried out using a digital image correlation measuring system. The blankholder force and the punch velocity in the limited dome height test were set in accordance with the Nakajima test (160 kN and 8 mm/min, respectively).

3.3. Extrapolation of High-Strength Packaging Steel Flow Curves

To describe the material’s hardening behaviour in the simulation, a flow curve is indispensable. The flow curve describes the equivalent uniaxial stress as a function of equivalent strain. Due to its simple experimental setup and straight forward evaluation procedure, the tensile test is often applied to determine the flow curve. However, in industrial forming applications such as the drawing of cups the deformation is much greater than measured in tensile tests. Thus, it is very important to approximate the hardening behaviour at high strains via an extrapolation of the existing curve. The most popular extrapolation method is based on either the common flow curve model proposed by Swift (Equation (1)) or the one by Voce (Equation (2)). Firstly, an inverse procedure is adopted to determine the material parameters of the models. This is done by minimizing the mean square error between the experimental and calculated flow curve by means of optimization using the material parameters as variables. As mentioned earlier, the experimental flow curve is commonly determined from quasi-static tensile tests. The determined material parameters are then used to describe the hardening behaviour and extrapolate the flow curve to the required strain level.
However, the extrapolation precision can be improved if the underlying flow curve data are extended to strains beyond necking in tensile tests. To obtain data in this strain regime, a bulge test instead of a tensile test can be used. Beier et al. [21] developed an extrapolation method (in the following referred to as “thyssenkrupp extrapolation method”) that utilizes hydraulic bulge test data to combine the Swift and Voce flow curve models. This combination allows for balancing the strong hardening predicted by Swift (Equation (1)) with the weak hardening prediction according to Voce (Equation (2)).
In bulge forming, a biaxial stress state is present. However, the flow curve describes the plastic behaviour under uniaxial stress. Thus, a transformation of the biaxial hardening curve to a uniaxial stress state is first required. This is achieved by calculating a Y-factor, defined as the average ratio between biaxial and uniaxial stress in the complete range between yield strength and uniform elongation, from the hydraulic bulge test (the transformation of the bulge test is shown in Figure 2a). Consequently, a sufficient amount of elongation in the tensile test is required for a precise bulge test transformation. In the method proposed by Beier et al., tensile tests are used again to determine the material parameters for the Swift and Voce equations. Subsequently, the transformed bulge curve is used to determine a balancing factor α shown in Equation (3).
σ = k · ( ε 0 + ε eq ) n ,
σ = k · ( 1 b · e n ε eq ) ,
σ = α · Swift + ( 1 α ) · Voce ,
For high-strength packaging steels such as TH620 and TH700, this method is not effective. This results from very low strains and severe hardening observed in tensile tests together with a low hardening in bulge tests even at higher strains. Due to the severe initial hardening, an extrapolation of the tensile tests leads to a significant overestimation of the hardening behaviour in both Swift and Voce models (illustrated in Figure 2b,c) compared to the course of the transformed bulge test data. As a result, both curves lie above the transformed bulge test and thus no combination giving a feasible result is possible.
To enable a precise flow curve extrapolation even for HSPS, a new extrapolation method was developed and adapted to the specific requirements. Here, the transformed bulge curve is first used to extend the tensile test data. At low strains, the tensile test data delivers more precise data compared to the bulge test. The flow curve consisting of tensile test and transformed bulge test data is used to calibrate the parameters of the flow curve models according to Voce and Swift. The resulting curves are finally averaged as stated in Equation (3) using a fixed factor of 0.5. (Figure 2b,c) to illustrate the corresponding flow curves. The new extrapolation method (in the following referred to as HSPS-EM) shows a very precise mapping of transformed bulge test data onto the tensile test data and a significant improvement over the extrapolation of the tensile test alone. This approach can potentially also be applied to other steel grades.

3.4. Yield Locus Parametrisation

In order to calibrate the different yield locus functions von Mises, Hill48 and Yld2000-2d, tensile tests and bulge tests were used. Moldovan [20] demonstrated that the yield locus function Yld2000-2d provides significantly better results than Hill48 when simulating limited dome height experiments of packaging steel. In addition, the yield locus function Hill48 is not able to predict material behaviour with r < 1 and σb > σo, as present in the investigated material (Table 3) [30]. Hence, in the following only von Mises will be considered for isotropic simulation while Yld2000-2d is used for anisotropic simulations.
For the TH700 material, it was possible to determine all parameters needed for the calibration of the Yld2000-2d model using standardized tensile test results. However, for the TH620 material it was impossible to measure the yield strength and Lankford coefficient crosswise to the rolling direction, as a homogenous forming condition was not reached. This problem is evident in Figure 3. The Lüders bands do not cover the whole measuring area and thus a homogenous forming condition is not reached prior to failure. All determinable parameters for both materials TH700 and TH620 can be seen in Table 3. Since for the TH620 material not all the necessary parameters could be determined to calibrate the anisotropic yield locus model Yld2000-2d, only von Mises could be applied for this material. The evaluation of new methods to overcome these issues is not part of this work and will be discussed in the conclusion.
Figure 4 shows the yield locus of both materials together with the experimental measuring points. It becomes clear that the complex anisotropic function, especially in the area of biaxial tension, provides a better description of the material yield behaviour obtained in the experiments.

3.5. Forming Limit Curve

Figure 5 presents the results for the measured forming limit curves captured with seven different Nakajima specimens as described in Section 3.2. This provides the possibility to implement a simple failure criterion in the simulation, but only for proportional loading. At the same time, the performance of different materials can be compared in the observation of the forming limit curve. Thus, for example, the two materials show very similar behaviour in the area of plane strain, while the material TH700 shows significantly higher deformations in biaxial conditions.

4. Validation

To validate the generated material data, the material behaviour in two experiments was simulated. On the one hand the Nakajima100 specimen and on the other hand the limited dome height test with a significant friction influence were carried out. Both represent the stress state between plane strain and biaxial tension that is common in industrial application and are therefore suitable to validate the anisotropic yield behaviour.
Experiments were simulated using the von Mises isotropic yield function for both materials TH700 and TH620, and additionally with the complex anisotropic yield function Yld2000-2d for TH700. The yield function Yld2000-2d was not applicable for TH620 due to the problems mentioned above. For both materials, the newly developed extrapolation method was used to evaluate the flow curve up to high strains as described and compared to the conventional Swift model using only tensile test results. Finally, it should be mentioned that a kinematic hardening model was not used in the simulations and, in general, kinematic hardening has not been thoroughly investigated for packaging steels yet.
The simulations were carried out using the LS-DYNA explicit solver 10.0 and fully integrated shell elements. An explicit solver was used to successfully simulate the limited dome height test where challenging contact conditions arise due to strong friction between sheet and die. For contact between tools and workpiece, a surface to surface formulation was used with a friction coefficient of 0.24 for the limited dome height simulations. This value is commonly used in the “thyssenkrupp” test lab and also matches the value reported in previous studies, e.g., [31]. For simulating the Nakajima experiments, no friction was assumed due to the lubrication with three layers of grease between foils of PET in the experiments. The FEA setup consists of blank holder, die, punch and blank. In Figure 6, the deformed blanks and the occurring maximum principle strain distribution are illustrated.
This mesh size was determined in a convergence analysis considering punch force, maximum major as well as minor strain. Figure 7 presents the results of this convergence analysis for both experiments carried out based on the material data of the packaging steel T52BA. While for the strain distribution (a) some minor changes are visible, the mesh size has no apparent influence on the punch force curve (b) within the investigated bounds. The maximum major strain increases when reducing the mesh size from 4 mm to 1 mm. A further reduction in mesh size has no significant influence. For the limited dome height test, similar observations hold. There is a modest increase in the maximum received major strain when reducing the mesh size from 4 mm to 1 mm (c) and only little change thereafter. In the punch force curve, no significant change is visible (d). Consequently, an element edge length of 1 mm was used throughout.

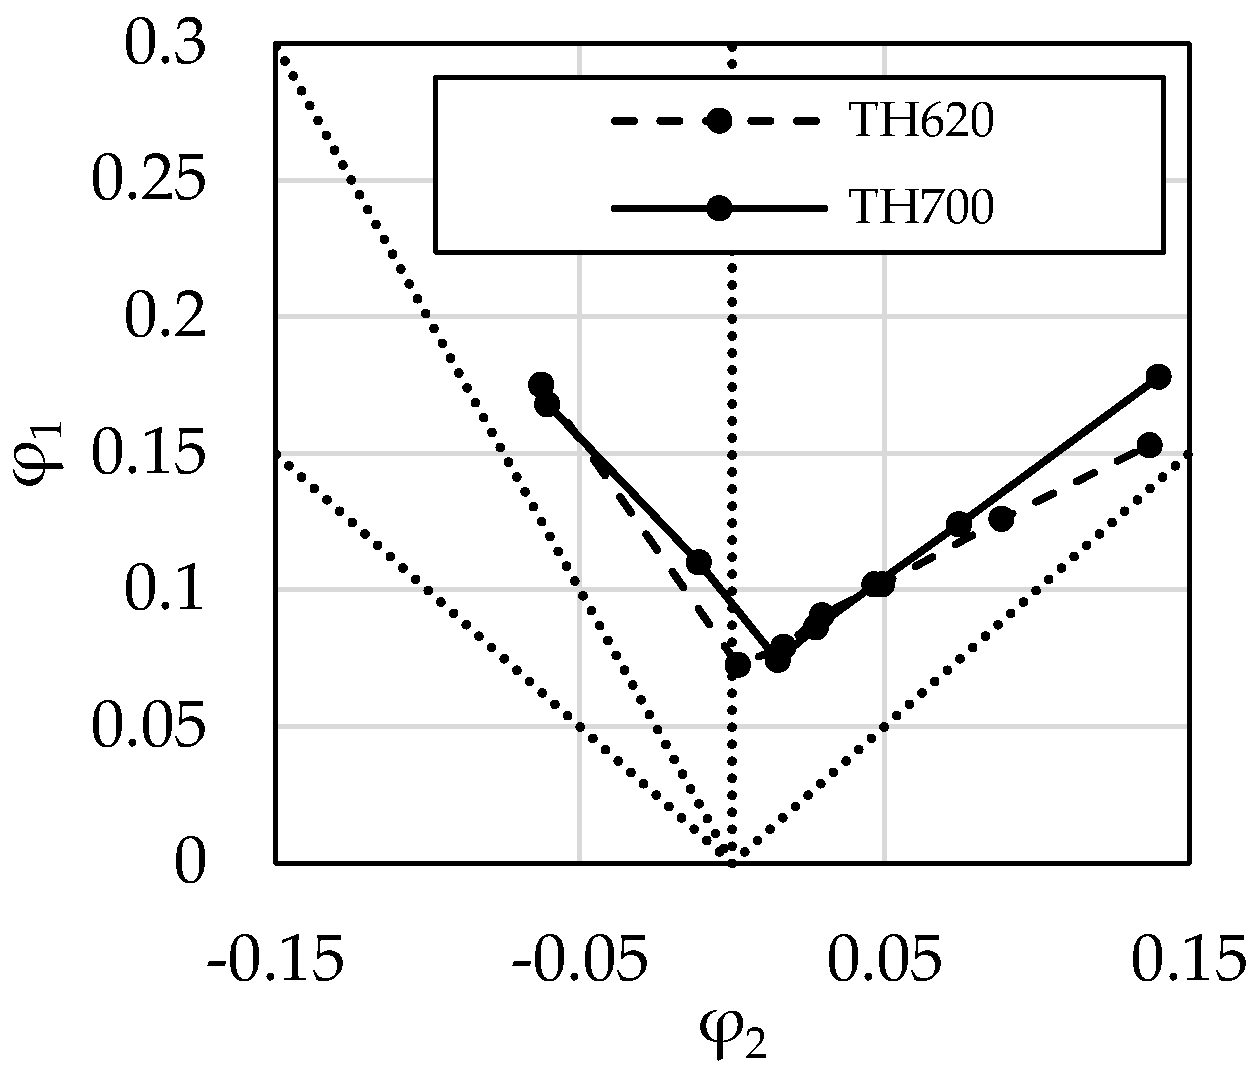
4.1. Strain Distribution Based Validation of the Used Models

Figure 7 compares the experimental and simulation results for the Nakajima100 specimen and the limited dome height test obtained using different flow curves and yield locus models. To simplify the comparison, only the strain distribution at the maximum punch stroke before necking is illustrated.
Regarding the Nakajima100 specimen (Figure 8a,b), in general a good agreement can be observed using the newly proposed HSPS extrapolation method, even when coupled with a simple isotropic yield locus model for both materials. For the TH700 material (Figure 8a), for which the anisotropic yield locus model Yld2000-2d was also applicable, this model even provides slightly better results, especially with regards to the strain distribution width at medium major strain levels. For the TH620 material (Figure 8b), in contrast for minor compressive (negative) strains, significantly too low major strain levels are predicted regardless of the extrapolation method used. This might be due to the isotropic yield locus model. Furthermore, the simulation based on the simple Swift flow curve extrapolation predicts 40% less maximum major strain (0.10 in the experiment vs. 0.06 in the simple Swift flow curve extrapolation, as can be seen in Figure 8a) than the experiment for the material TH700. This results from the overestimation of the strain hardening compared to the transformed bulge test data, which leads to higher stress levels and thus less maximum strain. In comparison, the newly presented HSPS-EM only underestimates the maximum major strain by about 16% (0.10 in the experiment vs. 0.084 in the HSPS extrapolation, as can be seen in Figure 8a), which is more than twice as accurate.
Figure 8c,d shows the strain distribution of the simulation results for the limited dome height test. The need to use anisotropic yield locus models for this test can clearly be observed for the TH700 material (Figure 8c), for which such a model was applied. The isotropic yield function differs from the experiment and is not able to describe friction induced forming conditions that shift the maximum strain from biaxial forming conditions (φ1 = φ2 > 0) towards plane strain conditions (φ2 = 0) as visible when comparing the yellow and brown points. In contrast, the Yld2000-2d criterion shows good results in matching the experiments when using the newly presented HSPS-EM. For the TH700 material, the simulation based on the Swift extrapolation underestimates the maximum major strain observed in the experiment by 26% (0.105 in the experiment vs. 0.077 in the simple Swift flow curve extrapolation, as can be seen in Figure 8c), similar to what was already observed for the Nakajima100 specimen. However, the HSPS-EM only underestimates the maximum major strain by about 15% (0.105 in the experiment vs. 0.089 in the HSPS extrapolation, as can be seen in Figure 8c), and thus it is almost twice as precise. Therefore, it can be stated that for forming conditions similar to the ones occurring in the limited dome height test, the use of anisotropic yield functions is recommended in order to achieve sufficiently precise results. Furthermore, the use of an advanced extrapolation procedure is indispensable for both steel grades when simulating the limited dome height experiment.
Summarizing the validation, the simulation shows especially significant improvement when using the new extrapolation method. Additionally, the exact modelling of the yield locus using anisotropic yield functions reveals more precise simulation results in particular for the limited dome height test. In fact, the need for an exact yield locus modelling in the area between plane strain and biaxial stress is more important for the limited dome height test than for the Nakajima100 specimen due to the friction-induced gradient in the stress state from plane strain to biaxial condition.

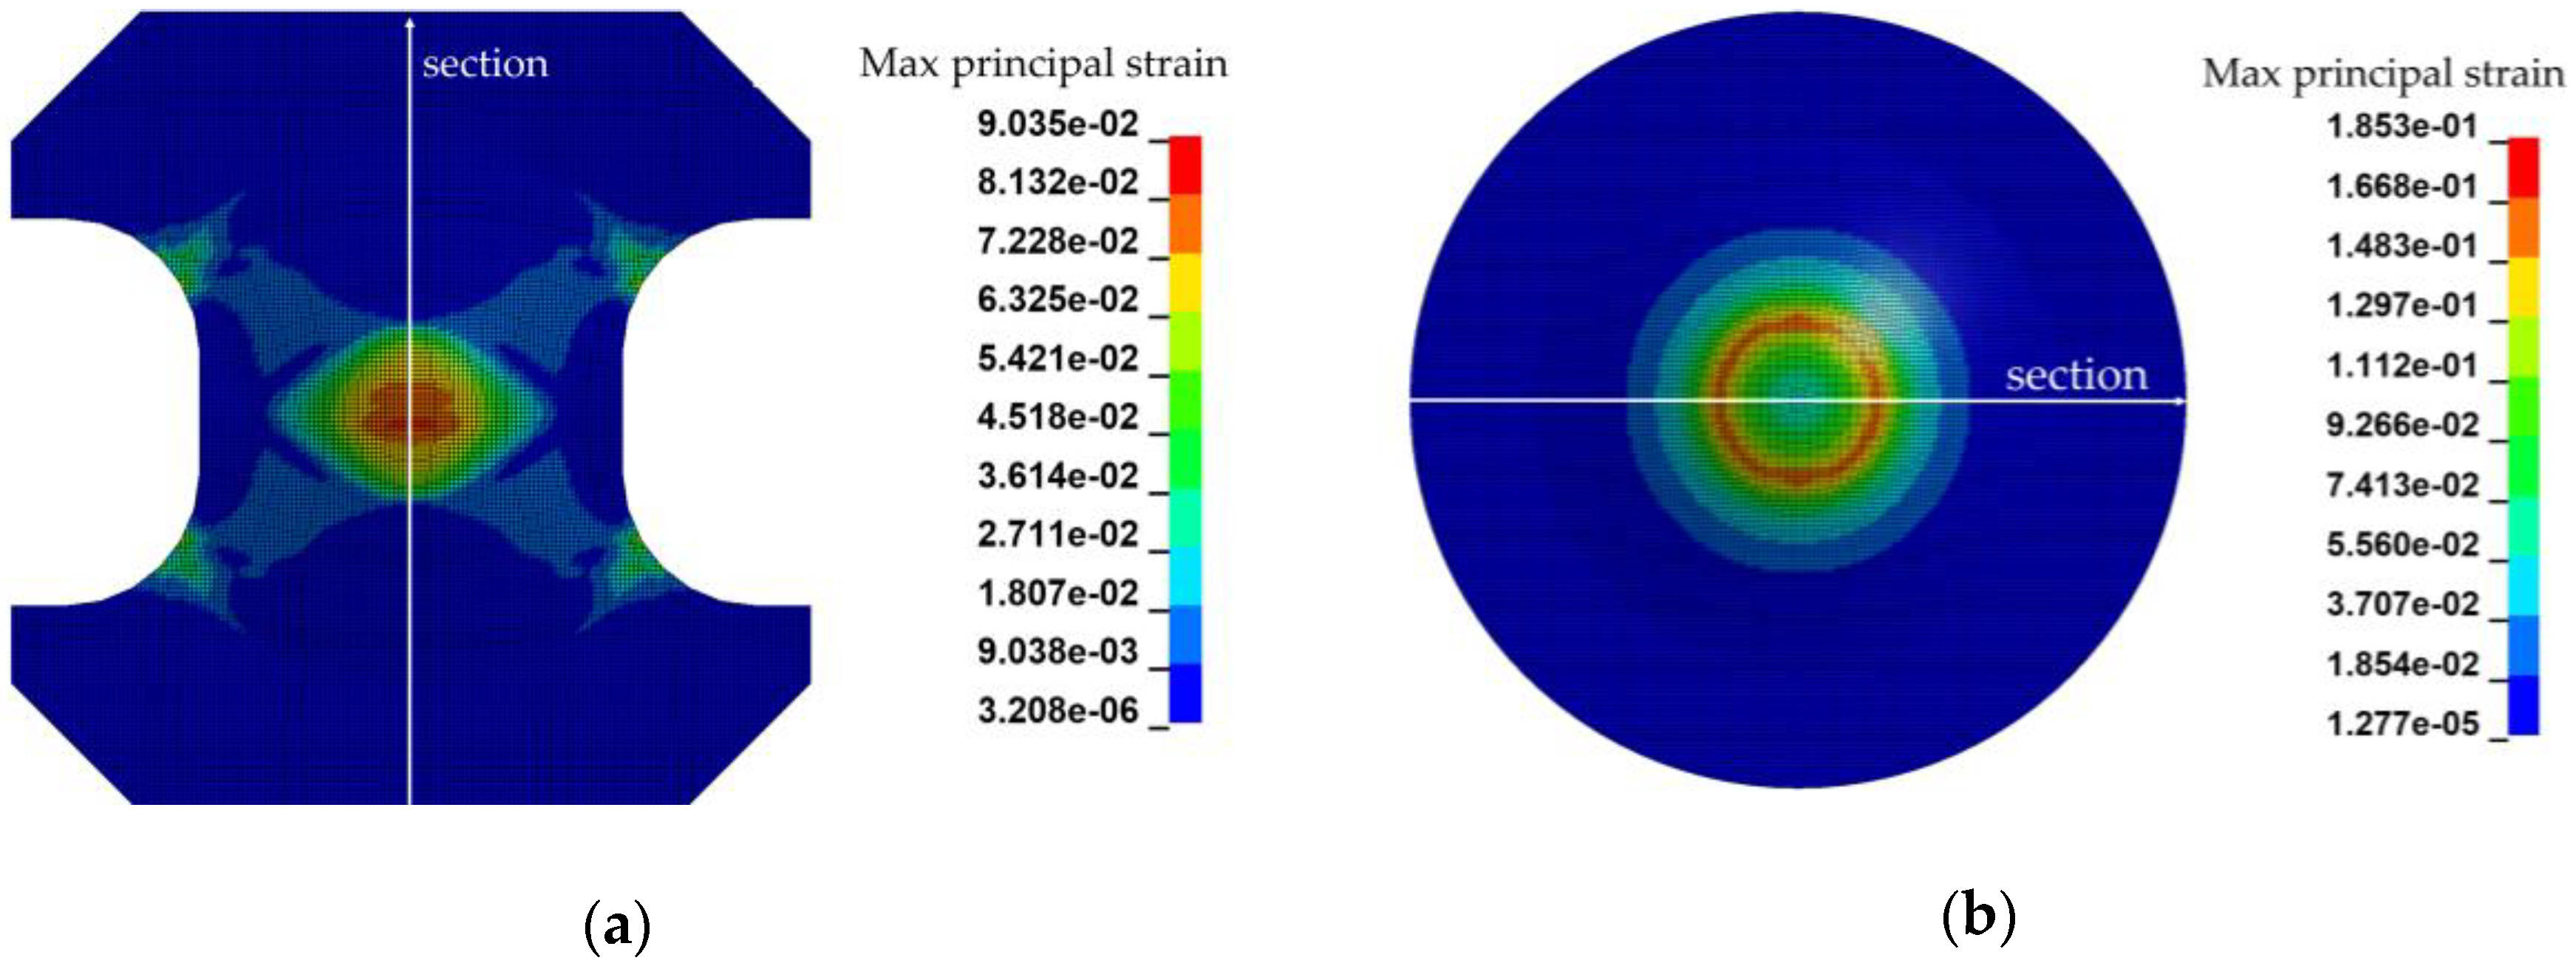
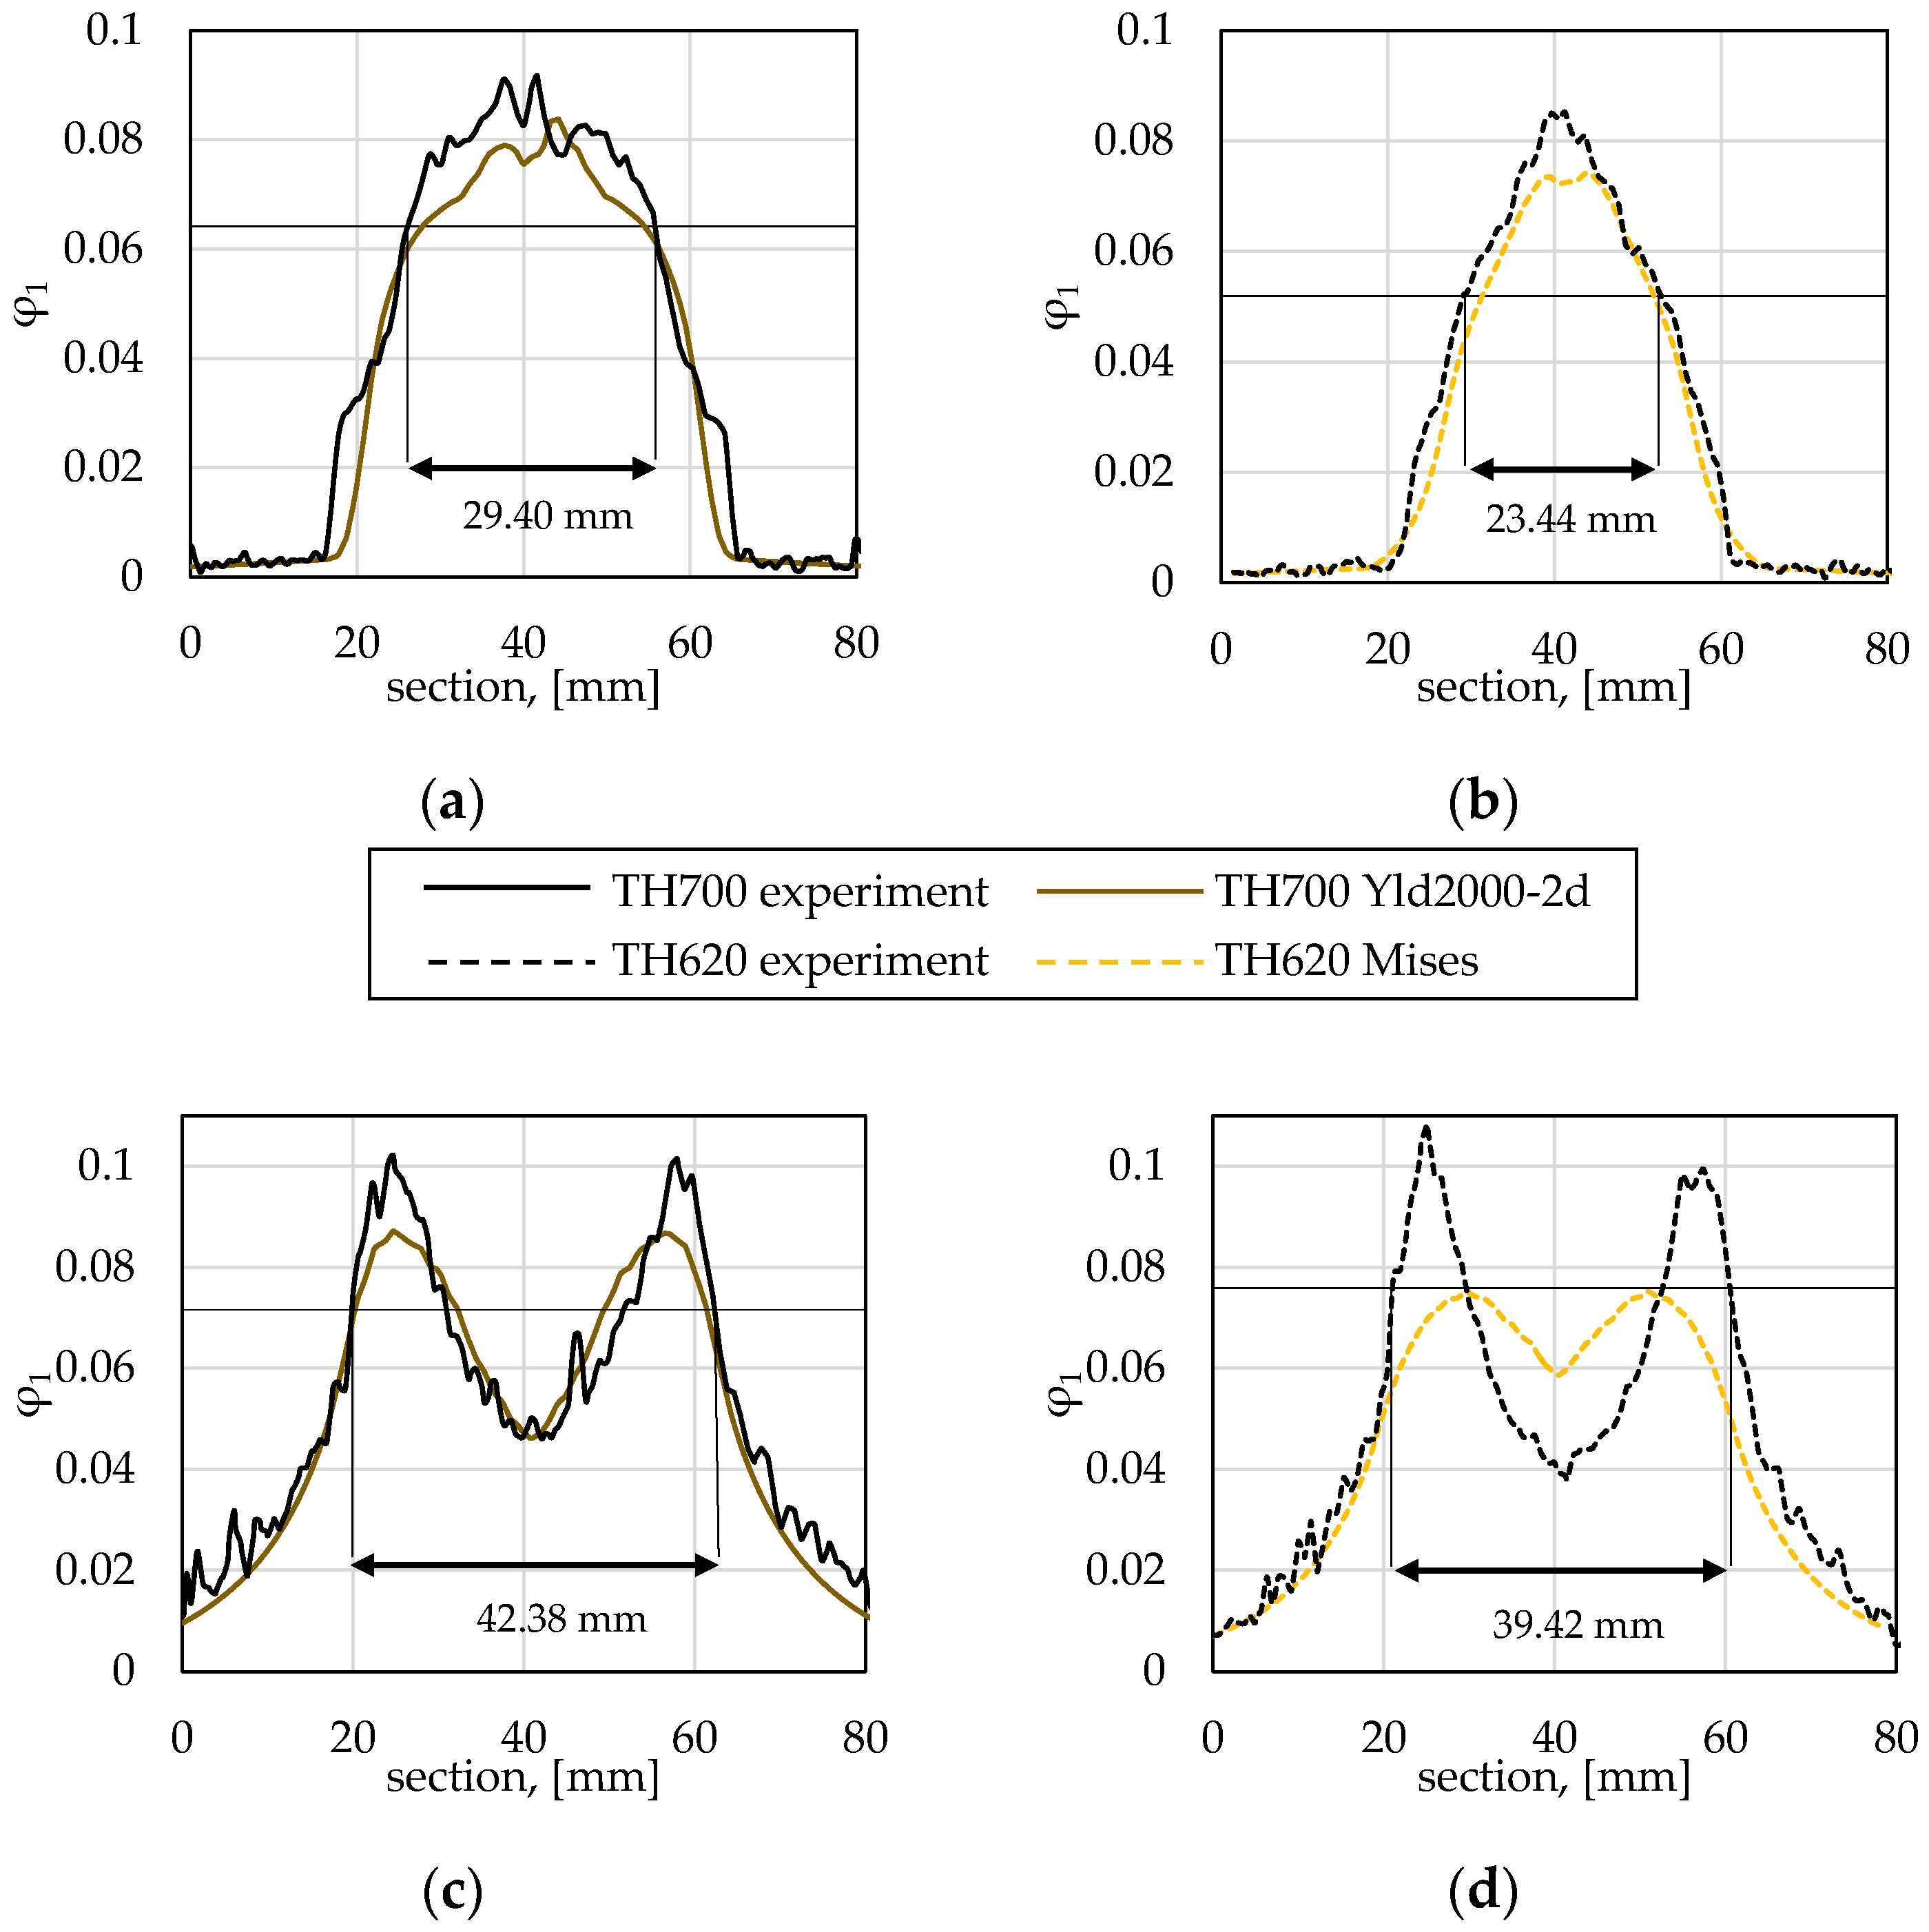
4.2. Prediction of the Strain Localization in a Selected Section of the Validation Specimen

A reliable and robust simulation of the forming process of high-strength packaging steel is very important in order to reduce the experimental effort and to simplify the material selection. Figure 9 presents the strain in the middle section of the validation experiments defined in Figure 6. Comparing the simulation results to the experiment for the Nakajima100 specimen, a very good accordance between experimental and simulative output can be observed, as already discussed before (Figure 9a,b). A different material flow for the two materials is clearly visible and this highlights the potential to review the forming behaviour of different packaging steels through finite element simulation. Both materials show a similar amount of maximum strain and thus have similar grid points in the forming limit curve (Figure 5). However, considering the selected middle section of the Nakajima100 specimen right before the onset of necking in Figure 9a, different strain localization becomes obvious. The TH700 material (a) shows a less localized forming behaviour than the TH620 material (b) and thus a much higher total deformation.
To assess this observation, the section width at a major strain level of 70% of the maximal occurring major strain is evaluated. While the TH700 material section has a width of 29.40 mm, the TH620 section is only 23.44 mm wide, which corresponds to a substantial relative difference of 20%. This is also reflected in a greater punch-stroke until failure. For the limited dome height experiments, similar behaviour can be found, as the strain localizes much more at the flank for the TH620 than for the TH700 material (Figure 9c,d). Applying the introduced criterion, the section width at 70% of maximum major strain is 42.38 mm for the TH700 and only 39.42 mm for the TH620 material, i.e., a relative difference of 7%. The anisotropic yield locus model Yld2000-2d can capture this localization for the TH700 material. The simple isotropic von Mises model is not able to do so, as already discussed above. However, the effect of a material-dependent localization is not as pronounced in the limited dome height experiment (7%) as in the Nakajima test (20%) due to the strong friction influence on the deformation distribution.
The significantly lower localization of the TH700 material offers great advantages in further forming steps. Simulations based on the tailored material characterization method put forward in this paper can capture this behaviour and therefore provide great added value in the simulation-based material grade selection for specific applications. Furthermore, this understanding enables a FEA supported process development.

5. Conclusions and Outlook

In this paper, the specific requirements when characterizing the forming behaviour of HSPS were pointed out. These arise due to the unfavourable combination of limited elongation in tensile tests resulting from strong pre-hardening induced by temper rolling and of Lüders bands occurring after the lacquering process. At the same time, different HSPS show greatly different localization behaviour in forming processes. Thus, precise simulation results are necessary to support the material selection for forming operations, especially if the forming processes exhibit plane strain to biaxial stress states. Based on the main findings in this work, the following conclusions can be drawn:
  • A new extrapolation approach was introduced to fulfil specific requirements in HSPS forming, i.e., to capture the high degree of deformation occurring during HSPS processing. The extrapolation method was validated using a set of industrially relevant experiments.
  • The need for anisotropic yield functions to simulate industrially relevant HSPS forming processes, i.e., having plane strain to biaxial tension stress states, was pointed out. Therefore, it is indispensable to determine Lankford coefficients and yield strength for all relevant directions with respect to rolling direction.
  • Localization behaviour during forming was quantified by considering the section width of the middle section in the investigated validation experiments, and a difference of up to 20% was observed between the two HSPS grades. Simulations based on the tailored characterisation can capture these differences and highlight the associated potential with regards to an efficient material selection of HSPS grades.
In addition, the results reveal that conventional methods for material characterization are only suitable to a limited extent for high-strength packaging steels. It was not possible to calibrate the complex Yld2000-2d yield locus model for the HSPS material TH620, as the required Lankford coefficients in the relevant directions could not be determined. The likely cause for this is the very inhomogeneous deformation in the presence of Lüders bands. To calibrate complex yield functions for all high-strength packaging steels, advanced methods have to be established. Approaches such as using the earing profile to predict Lankford coefficients and the use of microscale tensile test specimens to obtain more elongation in tensile tests provide ways to overcome this issue. Additionally, in-plane torsion tests [32] offer the possibility to obtain a proper flow curve. Finally, the inverse Lankford coefficients determination might be a feasible concept [33].

Author Contributions

Conceptualization, F.K. and J.L.; methodology, F.K., B.L. and I.M.; validation, F.K.; investigation, F.K.; resources, F.K.; writing—original draft preparation, F.K.; writing—review and editing, J.L.; visualization, F.K.; supervision, J.L.; project administration, M.K.; All authors have read and agreed to the published version of the manuscript.

Funding

This research received no external funding.

Conflicts of Interest

The authors declare no conflict of interest.

References

  1. Considère, A. Mémoire sur L’emploi du fer et de L’acier Dans les Constructions, Annales des Ponts et Chaussées; Ch. Chunod: Paris, France, 1885; Volume 9, pp. 574–605. [Google Scholar]
  2. Mises, R.V. Mechanik der festen Körper im plastisch-deformablen Zustand. Nachr. Von Der Ges. Der Wiss. Zu Göttingen Math. Phys. Kl. 1913, 1913, 582–592. [Google Scholar]
  3. Hill, R. A theory of the yielding and plastic flow of anisotropic metals. Proc. R. Soc. Lond. Ser. A 1948, 193, 281–297. [Google Scholar]
  4. Barlat, F.; Brem, J.C.; Yoon, J.W.; Chung, K.; Dick, R.E.; Lege, D.J.; Pourboghrat, F.; Choi, S.-H.; Chu, E. Plane stress yield function for aluminum alloy sheets—part 1: Theory. Int. J. Plast. 2003, 19, 1297–1319. [Google Scholar] [CrossRef]
  5. Swift, H.W. Plastic instability under plane stress. J. Mech. Phys. Solids 1952, 1, 1–18. [Google Scholar] [CrossRef]
  6. Voce, E. The Relationship between Stress and Strain for Homogeneous Deformation. J. Inst. Met. 1948, 74, 537–562. [Google Scholar]
  7. Kuwabara, T. Advances in experiments on metal sheets and tubes in support of constitutive modeling and forming simulations. Int. J. Plast. 2007, 23, 385–419. [Google Scholar]
  8. Suttner, S.; Merklein, M. Experimental and numerical investigation of a strain rate controlled hydraulic bulge test of sheet metal. J. Mater. Process. Technol. 2016, 235, 121–133. [Google Scholar] [CrossRef]
  9. Gutscher, G.; Wu, H.-C.; Ngaile, G.; Altan, T. Determination of flow stress for sheet metal forming using the viscous pressure bulge (VPB) test. J. Mater. Process. Technol. 2004, 146, 1–7. [Google Scholar] [CrossRef]
  10. Nam, J.; Han, K.S. Finite element analysis of deep drawing and ironing process in the steel D&I canmaking. ISIJ Int. 2000, 40, 1223–1229. [Google Scholar]
  11. Pepelnjak, T.; Barisic, B. Analysis and elimination of the stretcher strains on TH415 tinplate rings in the stamping process. J. Mater. Process. Technol. 2007, 186, 111–119. [Google Scholar] [CrossRef]
  12. Barisic, B.; Pepelnjak, T.; Kuzman, K. Numerical-stochastic modeling and simulation of deep drawing tinplate rings. Adv. Mater. Res. 2005, 6–8, 329–336. [Google Scholar] [CrossRef]
  13. Hollomon, J.H. Tensile deformation. Aime Trans. 1945, 12, 1–22. [Google Scholar]
  14. Moreira, L.P.; Ferron, G. Finite element implementation of an orthotropic plasticity model for sheet metal forming simulations. Lat. Am. J. Solids Strutcuresfor Sheet Metal Form. Simul. 2007, 4, 149–176. [Google Scholar]
  15. Horta, R.S.; Moreira, L.P.; Oliveira, H.W.d.; Ouverney, T.M.W.; Souza Silva, A.D.; Francisco, A.S. Finite element simulation of the deep-drawing process of a two-piece tinplate can. In Proceedings of the XXXVIII Iberian Latin American Congress on Computational Methods in Engineering; ABMEC Brazilian Association of Computational Methods in Engineering, Santa Catarina, Brazil, 5–8 November 2017. [Google Scholar]
  16. Slota, J.; Šiser, M.; Gajdoš, I. Failure prediction of axi-symmetric cup in deep drawing and expansion processes. Open Eng. 2018, 8, 354–362. [Google Scholar] [CrossRef]
  17. Illera, M.; Lostado, R.; Martinez, R.F.; Mac Donald, B.J. Characterization of electrolytic tinplate materials via combined finite element and regression models. J. Strain Anal. Eng. Des. 2014, 49, 467–480. [Google Scholar] [CrossRef]
  18. Fernández-Martínez, R.; Lostado-Lorza, R.; Illera-Cueva, M.; Escribano-García, R.; Donald, B.J.M. Comparison Analysis of Regression Models Based on Experimental and FEM Simulation Datasets Used to Characterize Electrolytic Tinplate Materials. In International Joint Conference SOCO’14-CISIS’14-ICEUTE’14. Advances in Intelligent Systems and Computing; Springer: Cham, Switzerland, 2014; pp. 279–288. [Google Scholar]
  19. Linnemann, M.; Lieber, T.; Scheffler, C.; Psyk, V.; Müller, R.; Landgrebe, D. Influence of different strain rates on the flow curve and the formability of thin aluminium and tinplate sheets. In Proceedings of the 7th International Conference on High Speed Forming, Dortmund, Germany, 27–28 April 2016; pp. 245–255. [Google Scholar]
  20. Moldovan, I.; Linnepe, M.; Keßler, L.; Köhl, M. Virtual modelling of forming processes in metal packaging industry. In Proceedings of the 12th European LS-DYNA Conference, Koblenz, Germany, 14–16 May 2019; pp. 101–103. [Google Scholar]
  21. Beier, T.; Gerlach, J.; Roettger, R.; Kuhn, P. Possibilities for specific utilization of material properties for an optimal part design. J. Phys. Conf. Ser. 2017, 896, 12014. [Google Scholar] [CrossRef] [Green Version]
  22. DIN. Kaltgewalzte Verpackungsblecherzeugnisse–Elektrolytisch Verzinnter und Spezialverchromter Stahl Deutsche Fassung EN 10202:2001; Beuth Verlag GmbH: Berlin, Germany, 2001. [Google Scholar]
  23. Sylwestrowicz, W.; Hall, E.O. The deformation and ageing of mild steel. Proc. Phys. Soc. Sect. B 1951, 64, 495–502. [Google Scholar] [CrossRef]
  24. Vollertsen, F. Categories of size effects. Prod. Eng. Res. Dev. 2008, 2, 377–383. [Google Scholar]
  25. Raulea, L.V.; Goijaerts, A.M.; Govaert, L.E.; Baaijens, F.P.T. Size effects in the processing of thin metal sheets. J. Mater. Process. Technol. 2001, 115, 44–48. [Google Scholar] [CrossRef]
  26. DIN. Metallische Werkstoffe–Zugversuch—Teil 1: Prüfverfahren bei Raumtemperatur (ISO 6892-1:2019); Beuth Verlag GmbH: Berlin, Germany, 2019. [Google Scholar]
  27. DIN. Metallische Werkstoffe–Blech und Band–Bestimmung der biaxialen Spannung/Dehnung-Kurve durch einen hydraulischen Tiefungsversuch mit Optischen Messsystemen (ISO 16808:2014); Beuth Verlag GmbH: Berlin, Germany, 2014. [Google Scholar]
  28. ISO. Metallic Materials—Sheet and Strip—Determination of Forming-Limit Curves Part. 2: Determination of Forming-Limit Curves in the Laboratory 12004-2; ISO Copyright Office: Geneva, Switzerland, 2008. [Google Scholar]
  29. Kim, S.; Lee, J.; Barlat, F.; Lee, M.-G. Formability prediction of advanced high strength steels using constitutive models characterized by uniaxial and biaxial experiments. J. Mater. Process. Technol. 2013, 213, 1929–1942. [Google Scholar] [CrossRef]
  30. Banabic, D. Sheet Metal. Forming Processes; Springer: Berlin/Heidelberg, Germany, 2010. [Google Scholar]
  31. Neale, M.J. The Tribology Handbook, 2nd ed.; Butterworth Heinemann: Oxford, UK, 1995. [Google Scholar]
  32. Tekkaya, A.E.; Pöhlandt, K.; Lange, K. Determining Stress-Strain Curves of Sheet Metal in the Plane Torsion Test. Cirp Ann. 1982, 31, 171–174. [Google Scholar]
  33. Graser, M.; Lenzen, M.; Merklein, M. On the inverse identification of Lankford coefficients using geometrical changes under quasi-biaxial loading. Int. J. Mater. Form. 2019, 12, 1053–1061. [Google Scholar] [CrossRef]
Figure 1. (a) Test setup for bulge test, Nakajima test and validation experiments (b) geometry of waisted Nakajima specimen exemplary with a remaining width of 100 mm.
Metals 10 01683 g001
Figure 2. (a) Bulge test transformation; Comparison of the extrapolation methods for (b) TH700 and (c) TH620.
Metals 10 01683 g002
Figure 3. Failure in tensile test before reaching homogenous forming state (TH620—transversal direction).
Metals 10 01683 g003
Figure 4. Yield locus for (a) TH700 (b) TH620.
Metals 10 01683 g004
Figure 5. Forming limit curve for TH700 and TH620.
Metals 10 01683 g005
Figure 6. Finite element model results for the validation experiments (a) Nakajima100 specimen (b) limited dome height.
Metals 10 01683 g006
Figure 7. Convergence analysis for Nakajima100 (a) maximum occurring strain (b) punch force curve and limited dome height experiment (c) maximum occurring strain and (d) punch force curve.
Metals 10 01683 g007
Figure 8. Forming limit diagram for Nakajima100 specimen (a) TH700 (b) TH620 and limited dome height experiment (c) TH700 and (d) TH620.
Metals 10 01683 g008
Figure 9. Section (as presented in Figure 5) through Nakajima100 specimen (a) TH700 (b) TH620 and limited dome height experiment (c) TH700 (d) TH620.
Metals 10 01683 g009
Table 1. Input parameters for yield locus models.
Modelσ0σ45σ90r0r45r90σb
von Misesx------
Hill48x--xxx-
Yld2000-2dxxxxxxx
Table 2. Investigated high-strength packaging steels (HSPS) samples.
TemperThicknessYield StrengthProof Strength
temptReHReLRp0.5
TH7000.240 mm727 MPa687 MPa694 MPa
TH6200.235 mm607 MPa571 MPa577 MPa
Table 3. Assessed parameters for selected materials.
tempσ0σ45σ90r0r45r90σbElong. (RD)
TH700694 MPa679 MPa710 MPa0.801.090.85761 MPa7.8%
TH620577 MPa566 MPa-0.59 0.88-609 MPa8.0%
Publisher’s Note: MDPI stays neutral with regard to jurisdictional claims in published maps and institutional affiliations.

