Article

Modification of Alumina Inclusions in SWRS82B Steel by Adding Rare Earth Cerium

1
School of Materials and Metallurgy, Guizhou University, Guiyang 550025, China
2
Guizhou Key Laboratory of Metallurgical Engineering and Process Energy Conservation, Guiyang 550025, China
*
Authors to whom correspondence should be addressed.
Metals 2020, 10(12), 1696; https://doi.org/10.3390/met10121696
Submission received: 29 October 2020 / Revised: 12 December 2020 / Accepted: 16 December 2020 / Published: 21 December 2020

Abstract

:
The aluminum oxide inclusions in SWRS82B steel seriously affect the drawing performance of the steel strand. In this study, the influence of different additions of cerium (within the range of 0–0.034%) on the composition, morphology, size, number, and distribution of alumina inclusions was studied by scanning electron microscope and energy spectrum analyzer. The evolution of the composition of inclusions with different cerium additions was calculated based on classical thermodynamics and Factsage software calculation. The thermodynamic calculated results were consistent with the experimental results. It indicates that the modification route of Al2O3 inclusions in SWRS82B steel by increased cerium additions is as follows: Al2O3 → Ce2S3 + CeAlO3 + Ce2O2S + Al2O3 → Ce2S3 + CeAlO3 + Ce2O2S/Ce2S3 + Ce2O2S → Ce2S3 + Ce2O2S. Besides, when the amount of cerium is in the range of 0.023% to 0.030%, CeAlO3 inclusions gradually disappear. The best characteristics of inclusions in this study were obtained in experimental samples with cerium addition of 0.023%, in which the minimum size of inclusions is in the range of 3.52–4.84 μm and mostly uniform distribution. Finally, the mechanism on the modification by cerium was discussed based on the composition evolution of inclusion during solidification with Factsage calculation and experimental results. The compositions of inclusions were also analyzed based on the inclusion evolution model.

1. Introduction

With the actual needs of automobile high-speed rail and construction steel, higher requirements are put forward for the strength and toughness of metal materials. High drawing strength steel has become the focus of current research. The wire rod will break during the drawing process, affecting the performance of the product. The drawing limit is mainly related to the carbon content and structure of the steel [1]. SWRS82B is a high-strength steel that is widely used in wire ropes and steel strands and it is mainly used in the construction and transportation industries. It has developed rapidly in recent years [2]. A large amount of research shows that [3,4,5] it is important to pay attention to the size, morphology, and deformation of non-metallic inclusions for improving the performance and service life of SWRS82B high-strength steel wire rope and steel strand steel.
Aluminum has such a strong deoxidizing ability that it is often used as a deoxidizer in the steelmaking process. However, the addition amount of aluminum has a great influence on the quality of the molten steel, which is likely to cause nozzle clogging. Calcium treatment is used to modify alumina inclusion, decreasing the detrimental effect of alumina [6]. Many scholars have proposed that calcium treatment can transform high-melting alumina inclusions into low-melting liquid composite inclusions. Although calcium treatment can alleviate the problem of nozzle clogging, liquid inclusions have no capability for providing heterogeneous nuclei that can provide structure control [7], and the notch effect depends on the shape factor and volume fraction. Ye et al. [8] proposed a layer-by-layer reaction model for Al2O3 modification by calcium in the order of Al2O3—CA6—CA2—CA—CAX(liq), and, as the activity of Al2O3 decreases, the CaS from the outermost chromatograph prevented the modification reaction from proceeding further, resulting in the alumina inclusions not being completely modified into a liquid state. Rare Earth Metals (REM) compares very favorably with calcium regarding ease of dissolution [9]. REM has a very high affinity for both oxygen and sulfur. REM can also form oxysulfides (REM)202S, which are more stable than any of the other sulfides [10]. Therefore, it could be expected that REM is capable of reaching almost all oxygen and sulfur, whether in solution or in some form of less stable inclusions [11]. Magnesium treatment can reduce the number and size of the inclusions in steel, and the volatilization of magnesium can play a stirring role. However, the formation of magnesium aluminum spinel inclusions in steel is harmful to the quality of the steel. Therefore, it is necessary to look for a new solution. It is found that cerium has a more obvious effect on the purification of molten steel. Spherical inclusions with smaller sizes formed in the steel with cerium addition and they can be used as a nucleating agent in the molten steel, refining grain. Hirata [12] and Yang [13] et al. found that cerium can modify the alumina inclusions with higher hardness in cerium oxysulfide with lower hardness. Gao et al. [14] found that the spherical inclusions generated and the inclusion size decreased in IF steel with 0.02% cerium due to the transformation from alumina inclusions into Ce-Al-O-S inclusion. They also proposed that Ce2O3 and Ce2O2S with hexagonal crystal systems have a low degree of mismatch with δ-Fe. Wen et al. [15] found that the type of inclusions in SS400 low-carbon steel can be controlled by changing the S/O ratio and the cerium content. Li et al. [16] found that when the amount of added cerium into low-carbon high-manganese steel is up to 0.034%, the size of the inclusions tends to increase and the modification effect decreases. Wang et al. [17] found that when the amount of added cerium to spring steel exceeds 0.017%, all the inclusions in the molten steel will be completely modified into rare earth inclusions. Li et al. [18] found that spherical and liquid inclusions were generated in rare earth-treated 253MA steel at 1500 °C. The size of the inclusions has a greater influence on the fatigue resistance of the material, and the inclusions with small size and low hardness do little harm to the fatigue fracture of the steel, which is beneficial to the service life of high-carbon steel.
There are many thermodynamic studies on the treatment of alumina inclusions with rare earth in molten steel [19,20,21,22,23,24,25,26,27]. However, limited works are focused on the rare earth treatment of high-carbon steel. The mechanism on the evolution of the inclusions modified by rare earth in high-carbon steel needs to be analyzed. The effect of the amount of added cerium on the compositions and characteristics of inclusions was studied in SWRS82B steel. The modification process and transformation mechanism on inclusions in SWRS82B steel treated by cerium were discussed based on classical thermodynamic calculations and Factsage software calculation. This study will provide a reference for solving the problem of modification of alumina inclusions in high-carbon steel.

2. Materials and Methods

2.1. Experimental Materials and Procedures

An intermediate frequency induction furnace (Wangxin Precision Industry CO. LTD., Guangzhou, Guangdong, China) was used for the experiment. The molten steel was prepared by melting industrial pure iron (purity 99.5%. % represents mass percentage, hereinafter), recarburizer (C ≥ 98.5%, S ≤ 0.05%), and Fe-68%Mn alloy in the intermediate frequency induction furnace (170 mm OD × 150 mm ID × 280 mm HT) for melting. The capacity of the alumina crucible used in this experiment was 20 kg. The total weight of the materials placed in the crucible in each experiment was 7 kg. When the intermediate frequency induction furnace was heated to 1873 K, the materials were stirred to completely melt. After 10 min, the Al bar was added to deoxidize (Al ≥ 98%, Si ≤ 0.6%, Fe ≤ 0.7%) and stir the molten steel. After 10 min, cerium particles (Purity 99.9%) were added and the molten steel was stirred. Five minutes later, the molten steel was poured into the dry mold coated with talcum powder to cool and demold. Table 1 shows the chemical composition of the experimental SWRS82B steel. In the first furnace, only aluminum flakes were added during the smelting, and no cerium was added. The second furnace sample was smelted with 0.008% cerium particles. The third furnace sample was smelted with 0.023% cerium particles. The fourth furnace sample was smelted with 0.034% cerium particles. The cerium yield was very low. The final cerium contents in each sample and yield are shown in Table 2. The carbon, silicon, manganese, phosphorus, sulfur, and aluminum content were measured by inductively coupled plasma emission spectrometry (ICP), and the total oxygen content was measured by inert gas fusion pulse-infrared absorption spectroscopy.

2.2. Sample Processing

Samples (10 mm × 10 mm × 10 mm) were taken from the center of cylindrical steel ingot and ground with SiC sandpaper from 400 mesh to 2000 mesh. The surface of the samples was cleaned with ethanol. A German Zeiss ΣIGMA+X-Max20 (Baden-Wurttemberg, Germany) scanning electron microscope (SEM) with energy dispersive spectrometer (EDS) was used to analyze the size, morphology, and chemical composition distribution of the inclusions. Two hundred eighty-nine consecutive SEM pictures were taken under 1000 times magnification, corresponding to a total area of 4.6 mm × 4.6 mm. Image-ProPlus image processing software (Image-Pro Plus6.0, Rockville, Media Cybernetics, MD, USA) was used to analyze the size, number, and distribution of the inclusions on the surface of the photographed sample.

3. Results and Discussion

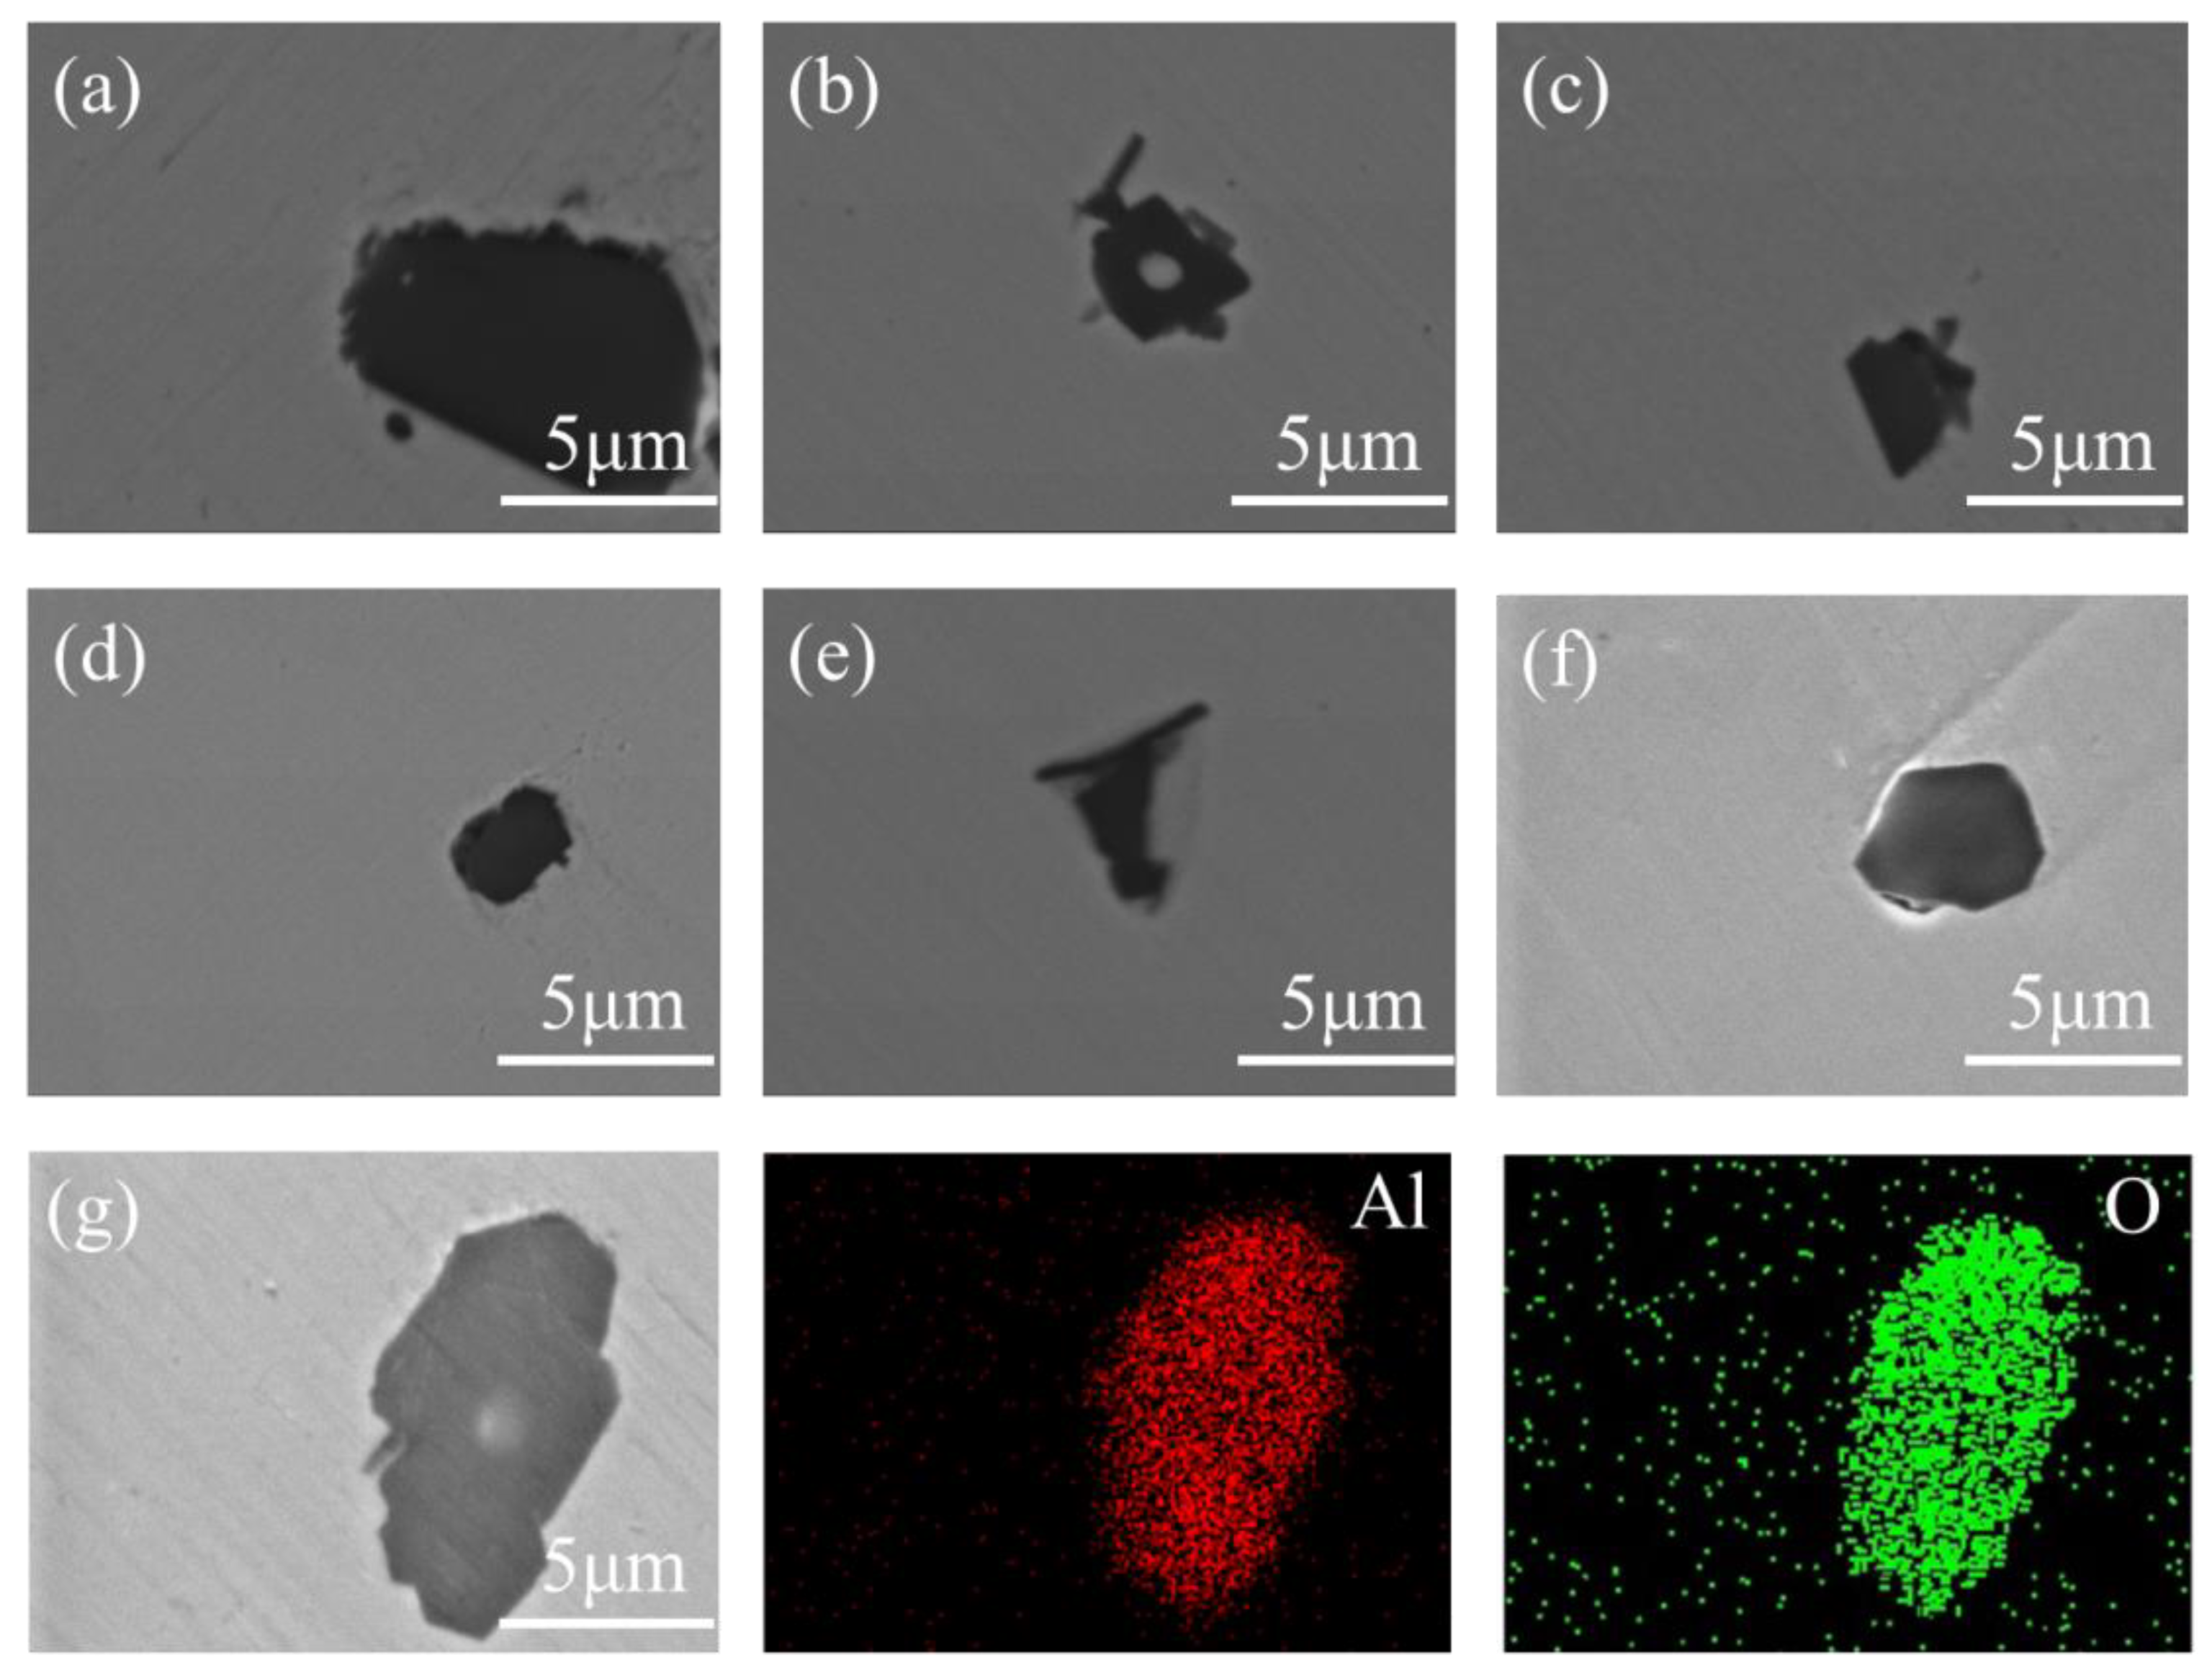
3.1. Change in Composition of Inclusions

SEM and EDS were used to observe the inclusions on the sample and the results are shown in Figure 1 and Figure 2. The typical inclusions of sample S1 and their map scanning are shown in Figure 1. The type of inclusions detected by SEM/EDS is alumina inclusions. It can be seen from Figure 1a–g that there are many alumina inclusions with various morphology in sample S1. The distribution of elements in typical inclusions in samples S2–S4 are shown in Figure 2. The element distribution of typical inclusion in sample S2 is shown in Figure 2a,b. When the amount of cerium is 0.008%, the contents of Ce and S in the outer layer of typical inclusions are higher and the content of Al in the inner layer is relatively higher. The inclusion with cerium oxysulfide wrapping Al2O3 formed, indicating that the Al2O3 inclusions are modified by cerium. The morphology of the inclusions is still irregular in S2 with 0.008% Ce and it suggests that the amount of added cerium is insufficient. The element distribution of typical inclusion in sample S3 is shown in Figure 2c,d. There are mainly cerium oxysulfides with less Al2O3 in sample S2 with 0.023% Ce. The element distribution of typical inclusion in sample S4 is shown in Figure 2e,f. When the addition amount of cerium is 0.034%, no composite inclusions with Al2O3 as the core were detected. It was observed that the size of the inclusions increased slightly compared to the sample S3. It can be concluded that the inclusions are mainly large-particle irregularly shaped Al2O3 inclusions in the steel with no cerium addition. To further confirm the composition of Ce-Al-O-S inclusions, the main constituent elements were homogenized. The inclusions are mainly Ce2S3 + Ce2O2S + CeAlO3 + Al2O3 composite inclusions in the steel with cerium addition of 0.008%. The main inclusions are composed of Ce2S3 + Ce2O2S + CeAlO3 and Ce2O2S in the steel with a cerium addition of 0.023%. When the amount of cerium is 0.034%, the main inclusions are Ce2S3 + Ce2O2S type inclusions in the steel with cerium addition of 0.034%. The addition of cerium has a modification effect on the alumina inclusions. With the increase of the cerium content, the transition route of inclusions is as follows: Al2O3 → Ce2S3 + CeAlO3 + Ce2O2S + Al2O3 → Ce2S3 +CeAlO3 + Ce2O2S/Ce2S3 + Ce2O2S → Ce2S3 + Ce2O2S.

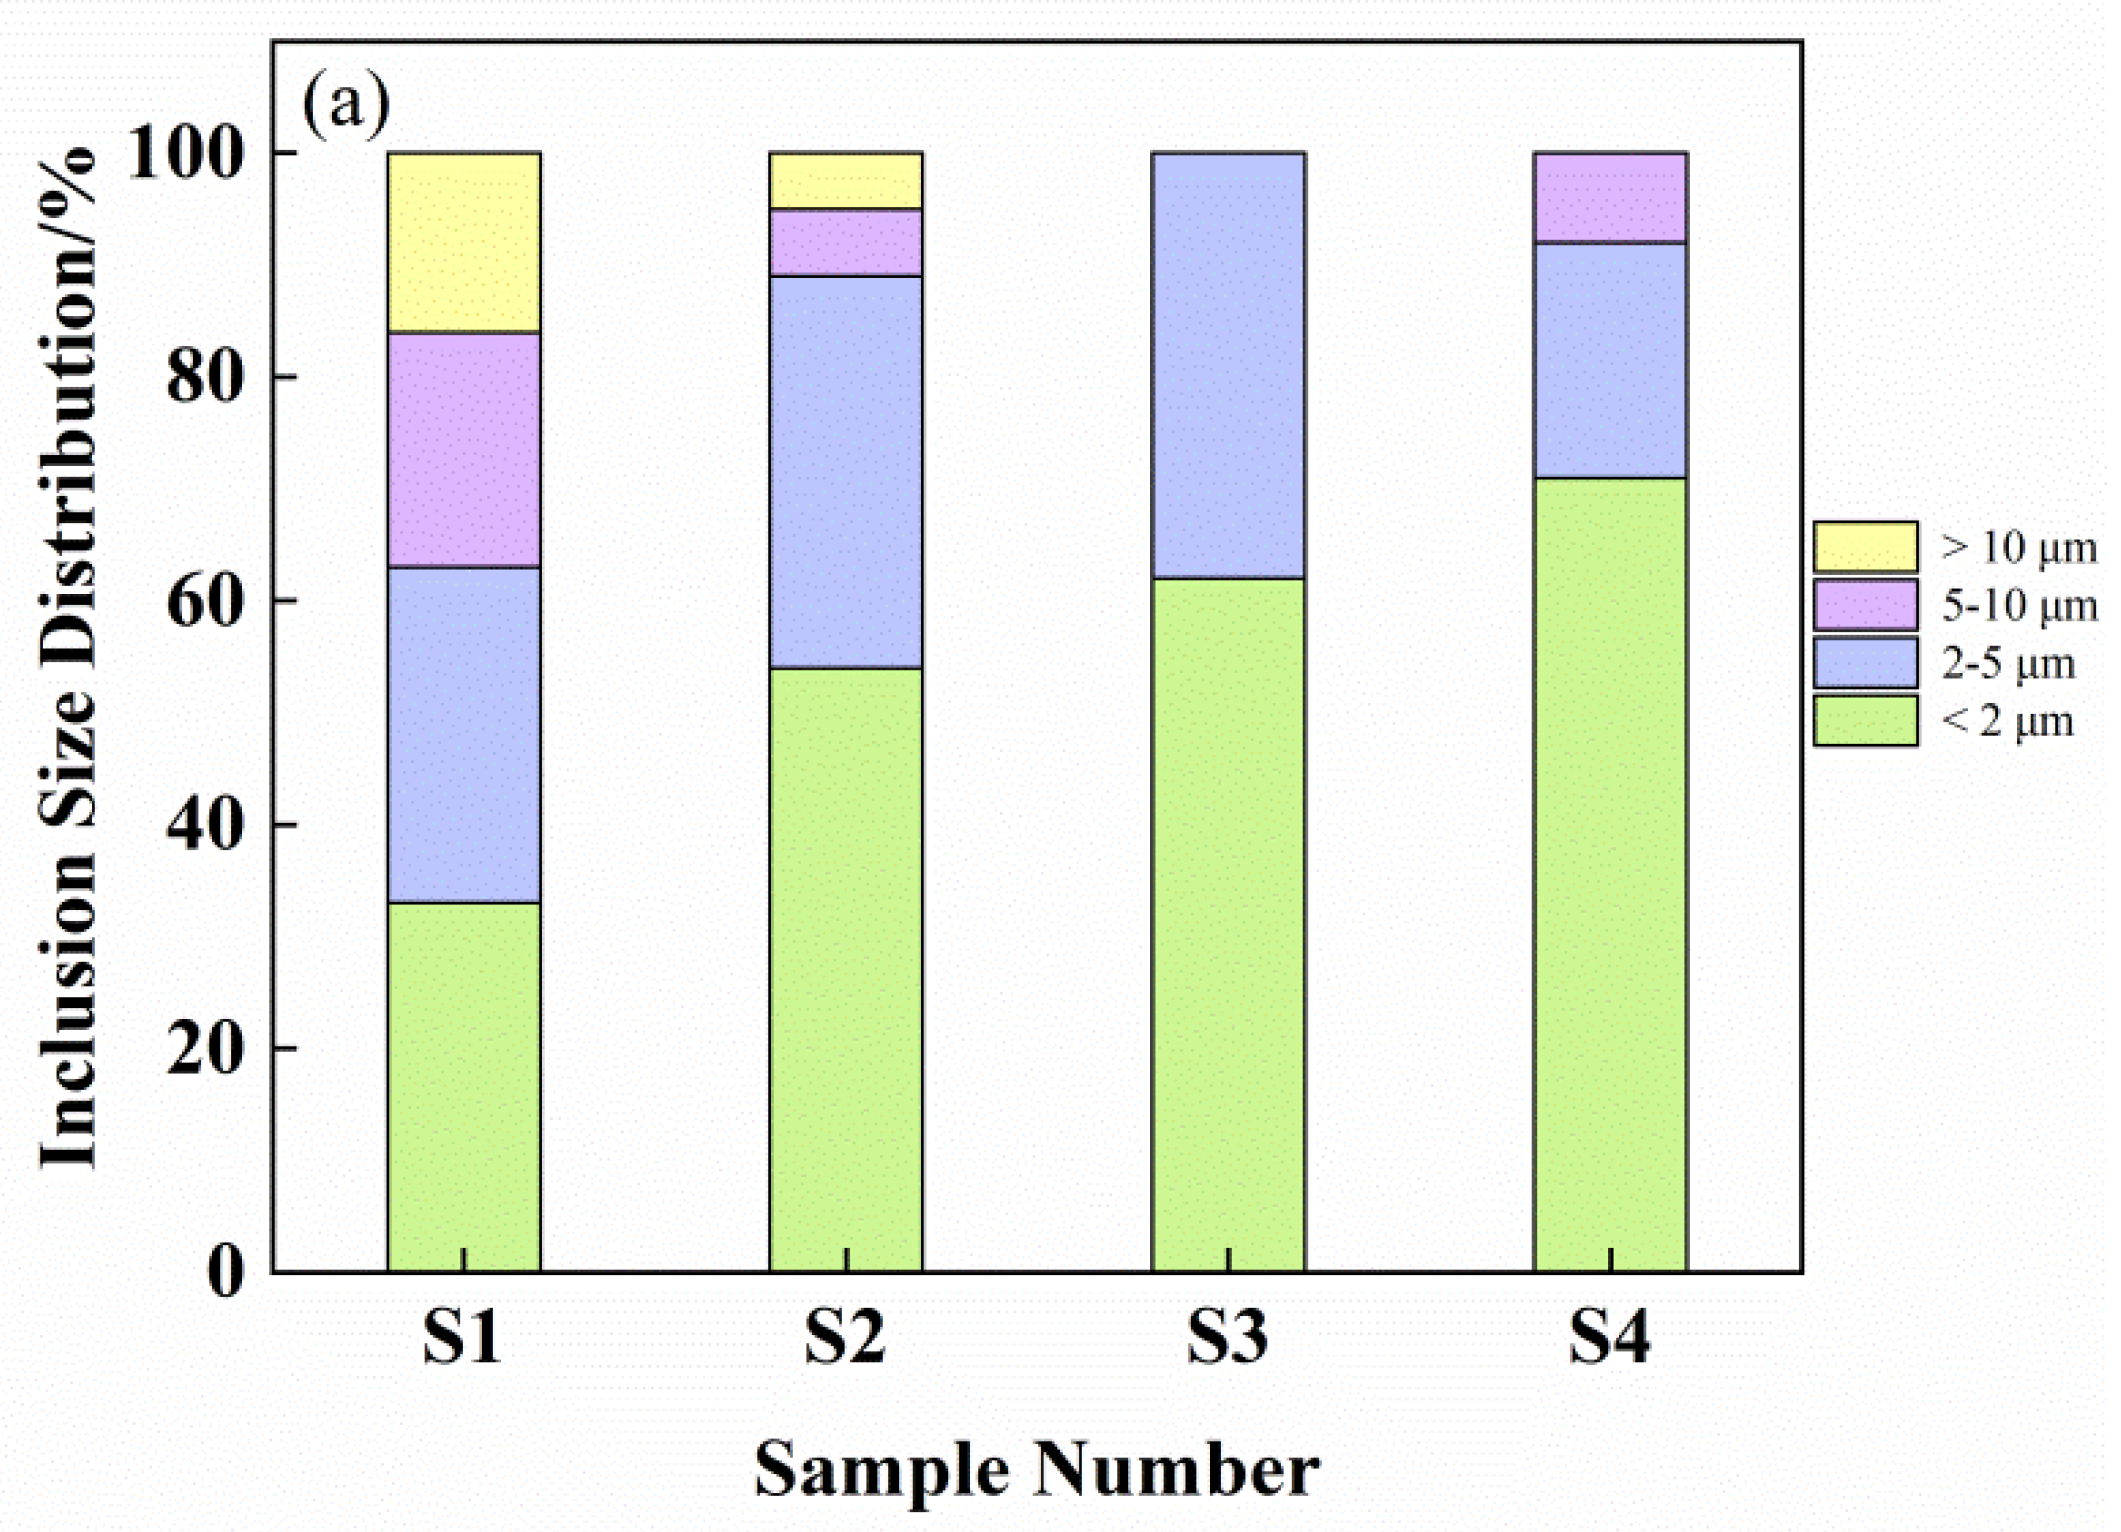
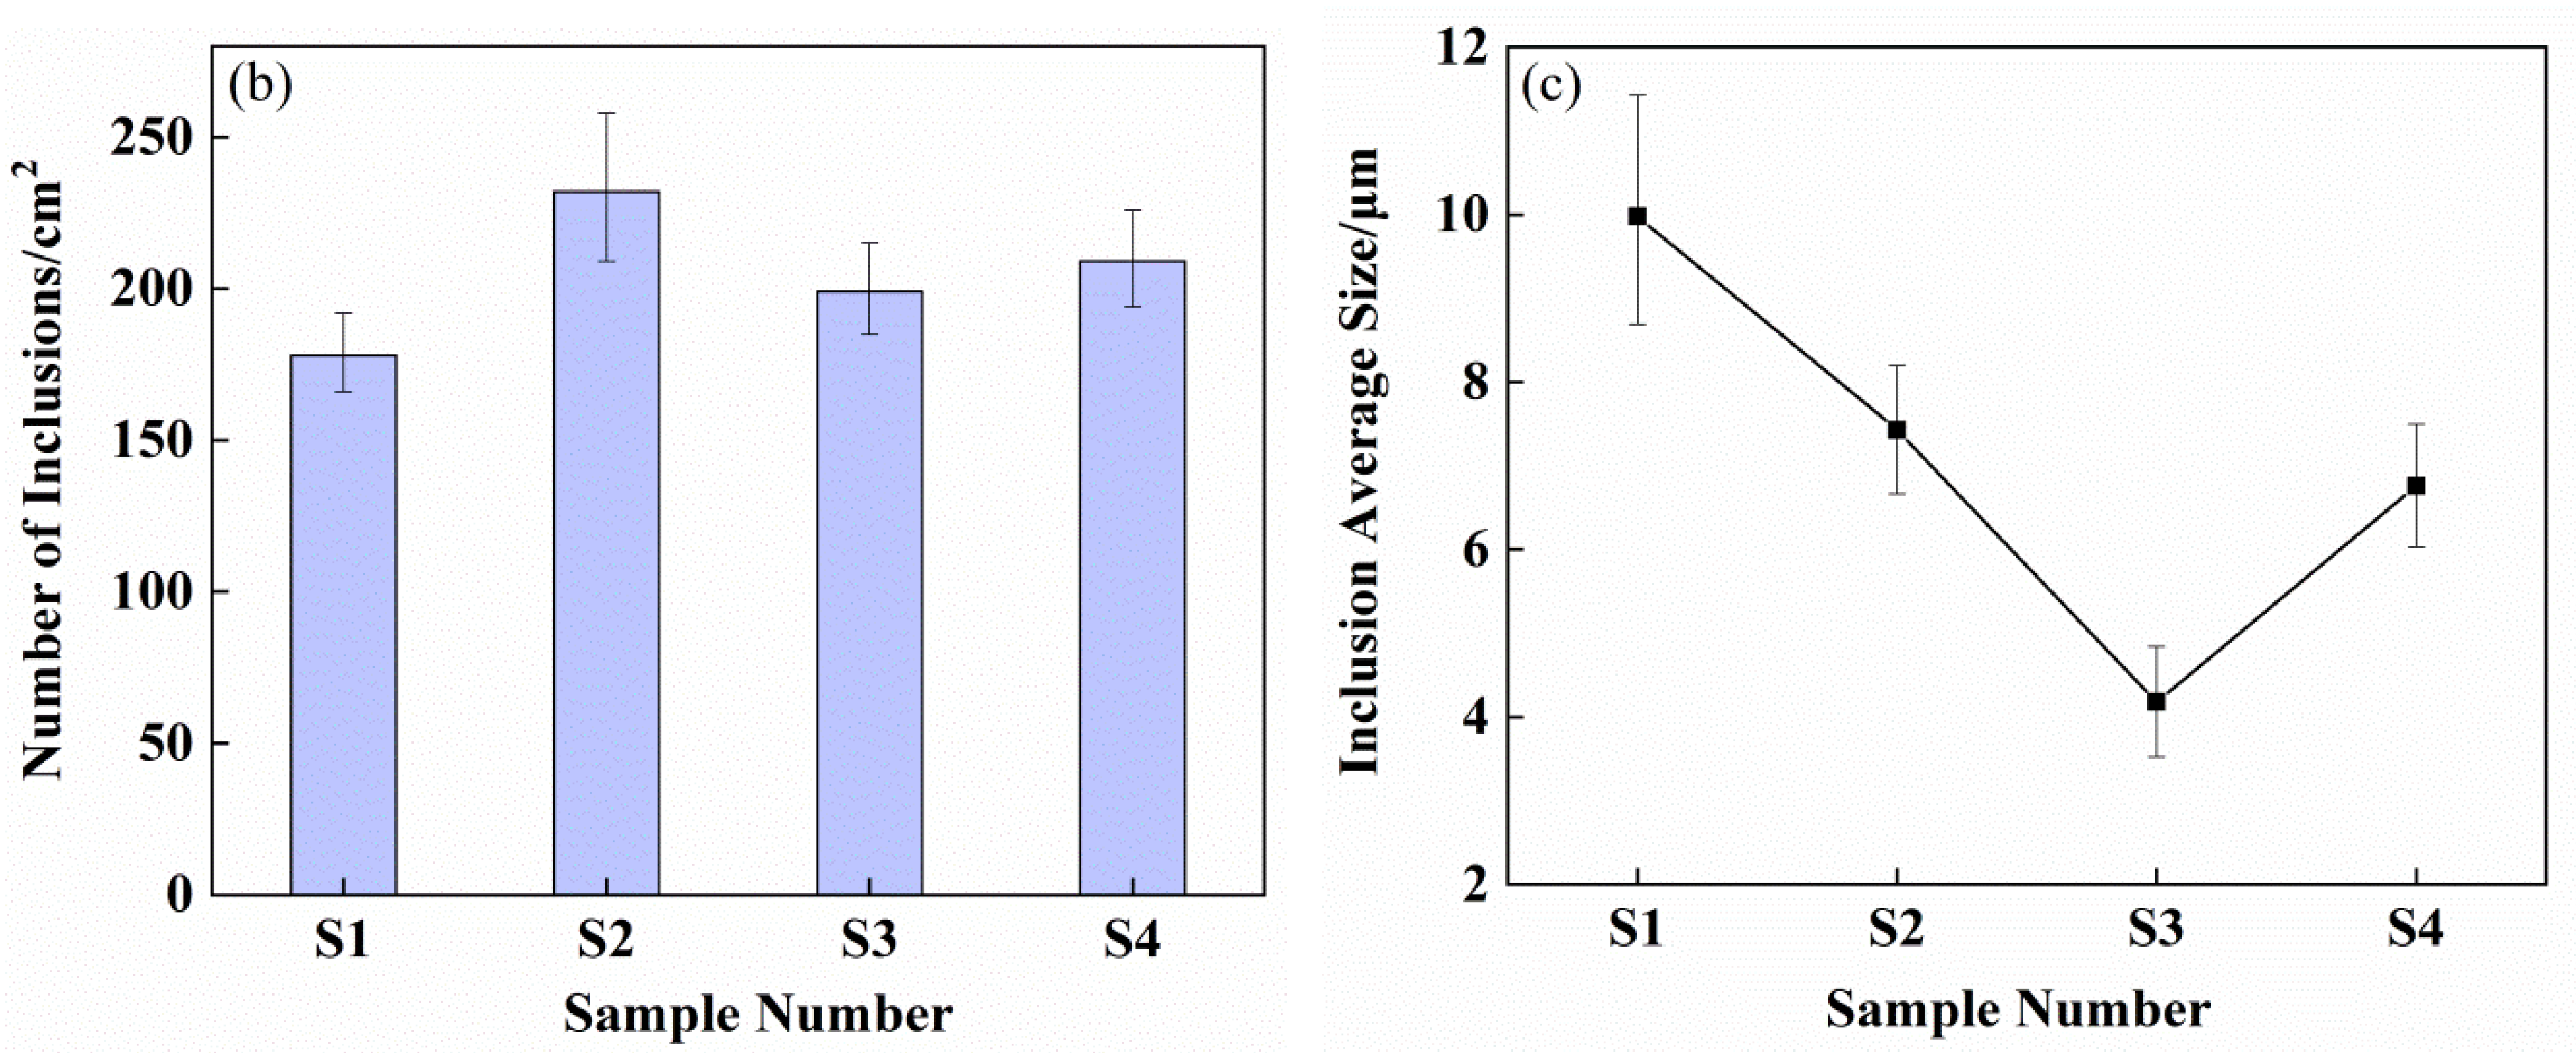
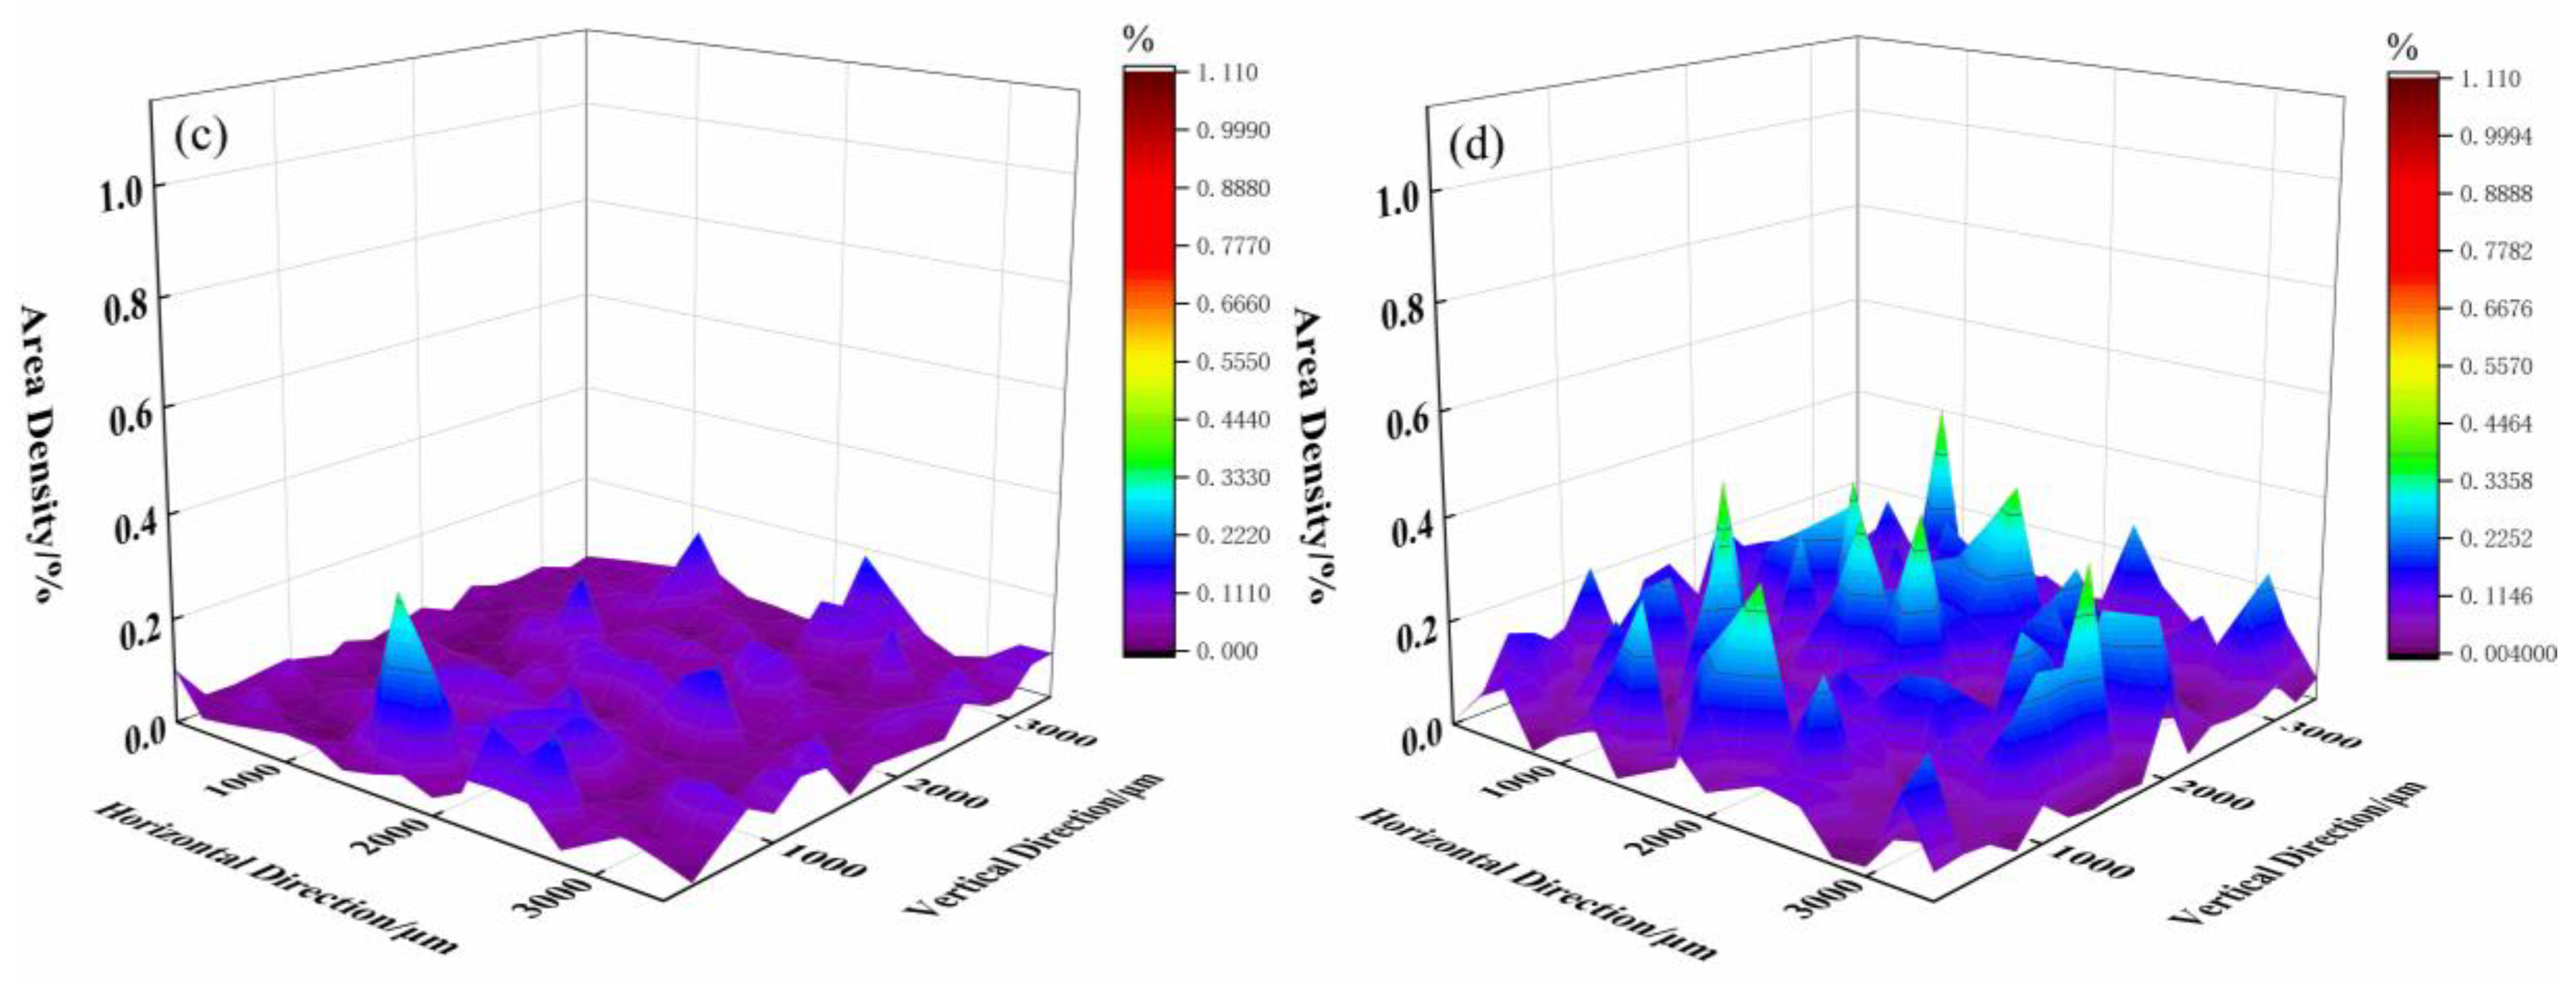
3.2. Number, Size, and Area Density of Inclusions

The size and number density distribution of the inclusions was obtained using a scanning electron microscope and Image-ProPlus image processing software as shown in Figure 3. In Figure 3a, the number of inclusions smaller than 2 μm is gradually increasing with the increase of cerium, indicating the inclusions are refined. The number of inclusions larger than 10 μm gradually decreases, and the inclusions with a size larger than 10 μm were only detected in samples S1 and S2 samples. The number density of inclusions in all these four samples was in the range of 166–258 cm2 as shown in Figure 3b. The number of inclusions in sample S2 is the largest with a number range of 209–258 cm2, while the number of inclusions in sample S1 is the smallest with a number range of 166–192 cm2. In Figure 3c, the average size range of inclusions is reduced from 8.65–11.32 μm to 3.52–4.84 μm, and then increased to 6.01–7.5 μm, and the average size of the inclusions in sample S3 is the smallest.
In order to observe the distribution trend of the inclusions in the steel more intuitively, the area density distribution of the inclusions is analyzed by Image-ProPlus software, as shown in Figure 4. In Figure 4a, the distribution of the inclusions is uneven. There are inclusions with large size and the maximum areal density in Sample S1 accounts for 1.1%. It can be seen from Figure 4 that the distribution of inclusion in samples tend to be more uniform, as follows: S1 < S2 < S4 < S3. The area density of the inclusions in sample S1 is large and the distribution is uneven, mainly because the inclusions in sample S1 are mainly alumina inclusions. The alumina inclusions are not easily wettable with molten steel, resulting in the aggregation of inclusions to form large-size inclusions. In addition, the force between the alumina inclusions is large, and the inclusions are easily attracted to each other, resulting in an uneven distribution of inclusions. With the increase of the cerium content in the inclusions, the growth rate of the inclusions slows down. Because alumina is gradually modified into cerium oxysulfide, the attractive force between inclusions becomes weak and their distribution is more even. The main factor affecting the area density and distribution of the inclusions is the interactive force acting on the inclusions, which is related to the composition and size of inclusions.
Based on the data in Figure 3b,c, the “measured volume of inclusions” (average volume x number) of samples S1–S4 are as follows: 56,626 μm3–145,753 μm3, 32,165 μm3–74,446 μm3, 4177 μm3–9975 μm3, 22040 μm3–49897 μm3. Through comparison, there seems to be a good agreement between Figure 3 and Figure 4 and oxygen contents in Table 1. Of course, these values only show the approximate inclusion content. The relationship between total oxygen content and inclusion volume needs to be explored more deeply, but they should be comparable anyway.

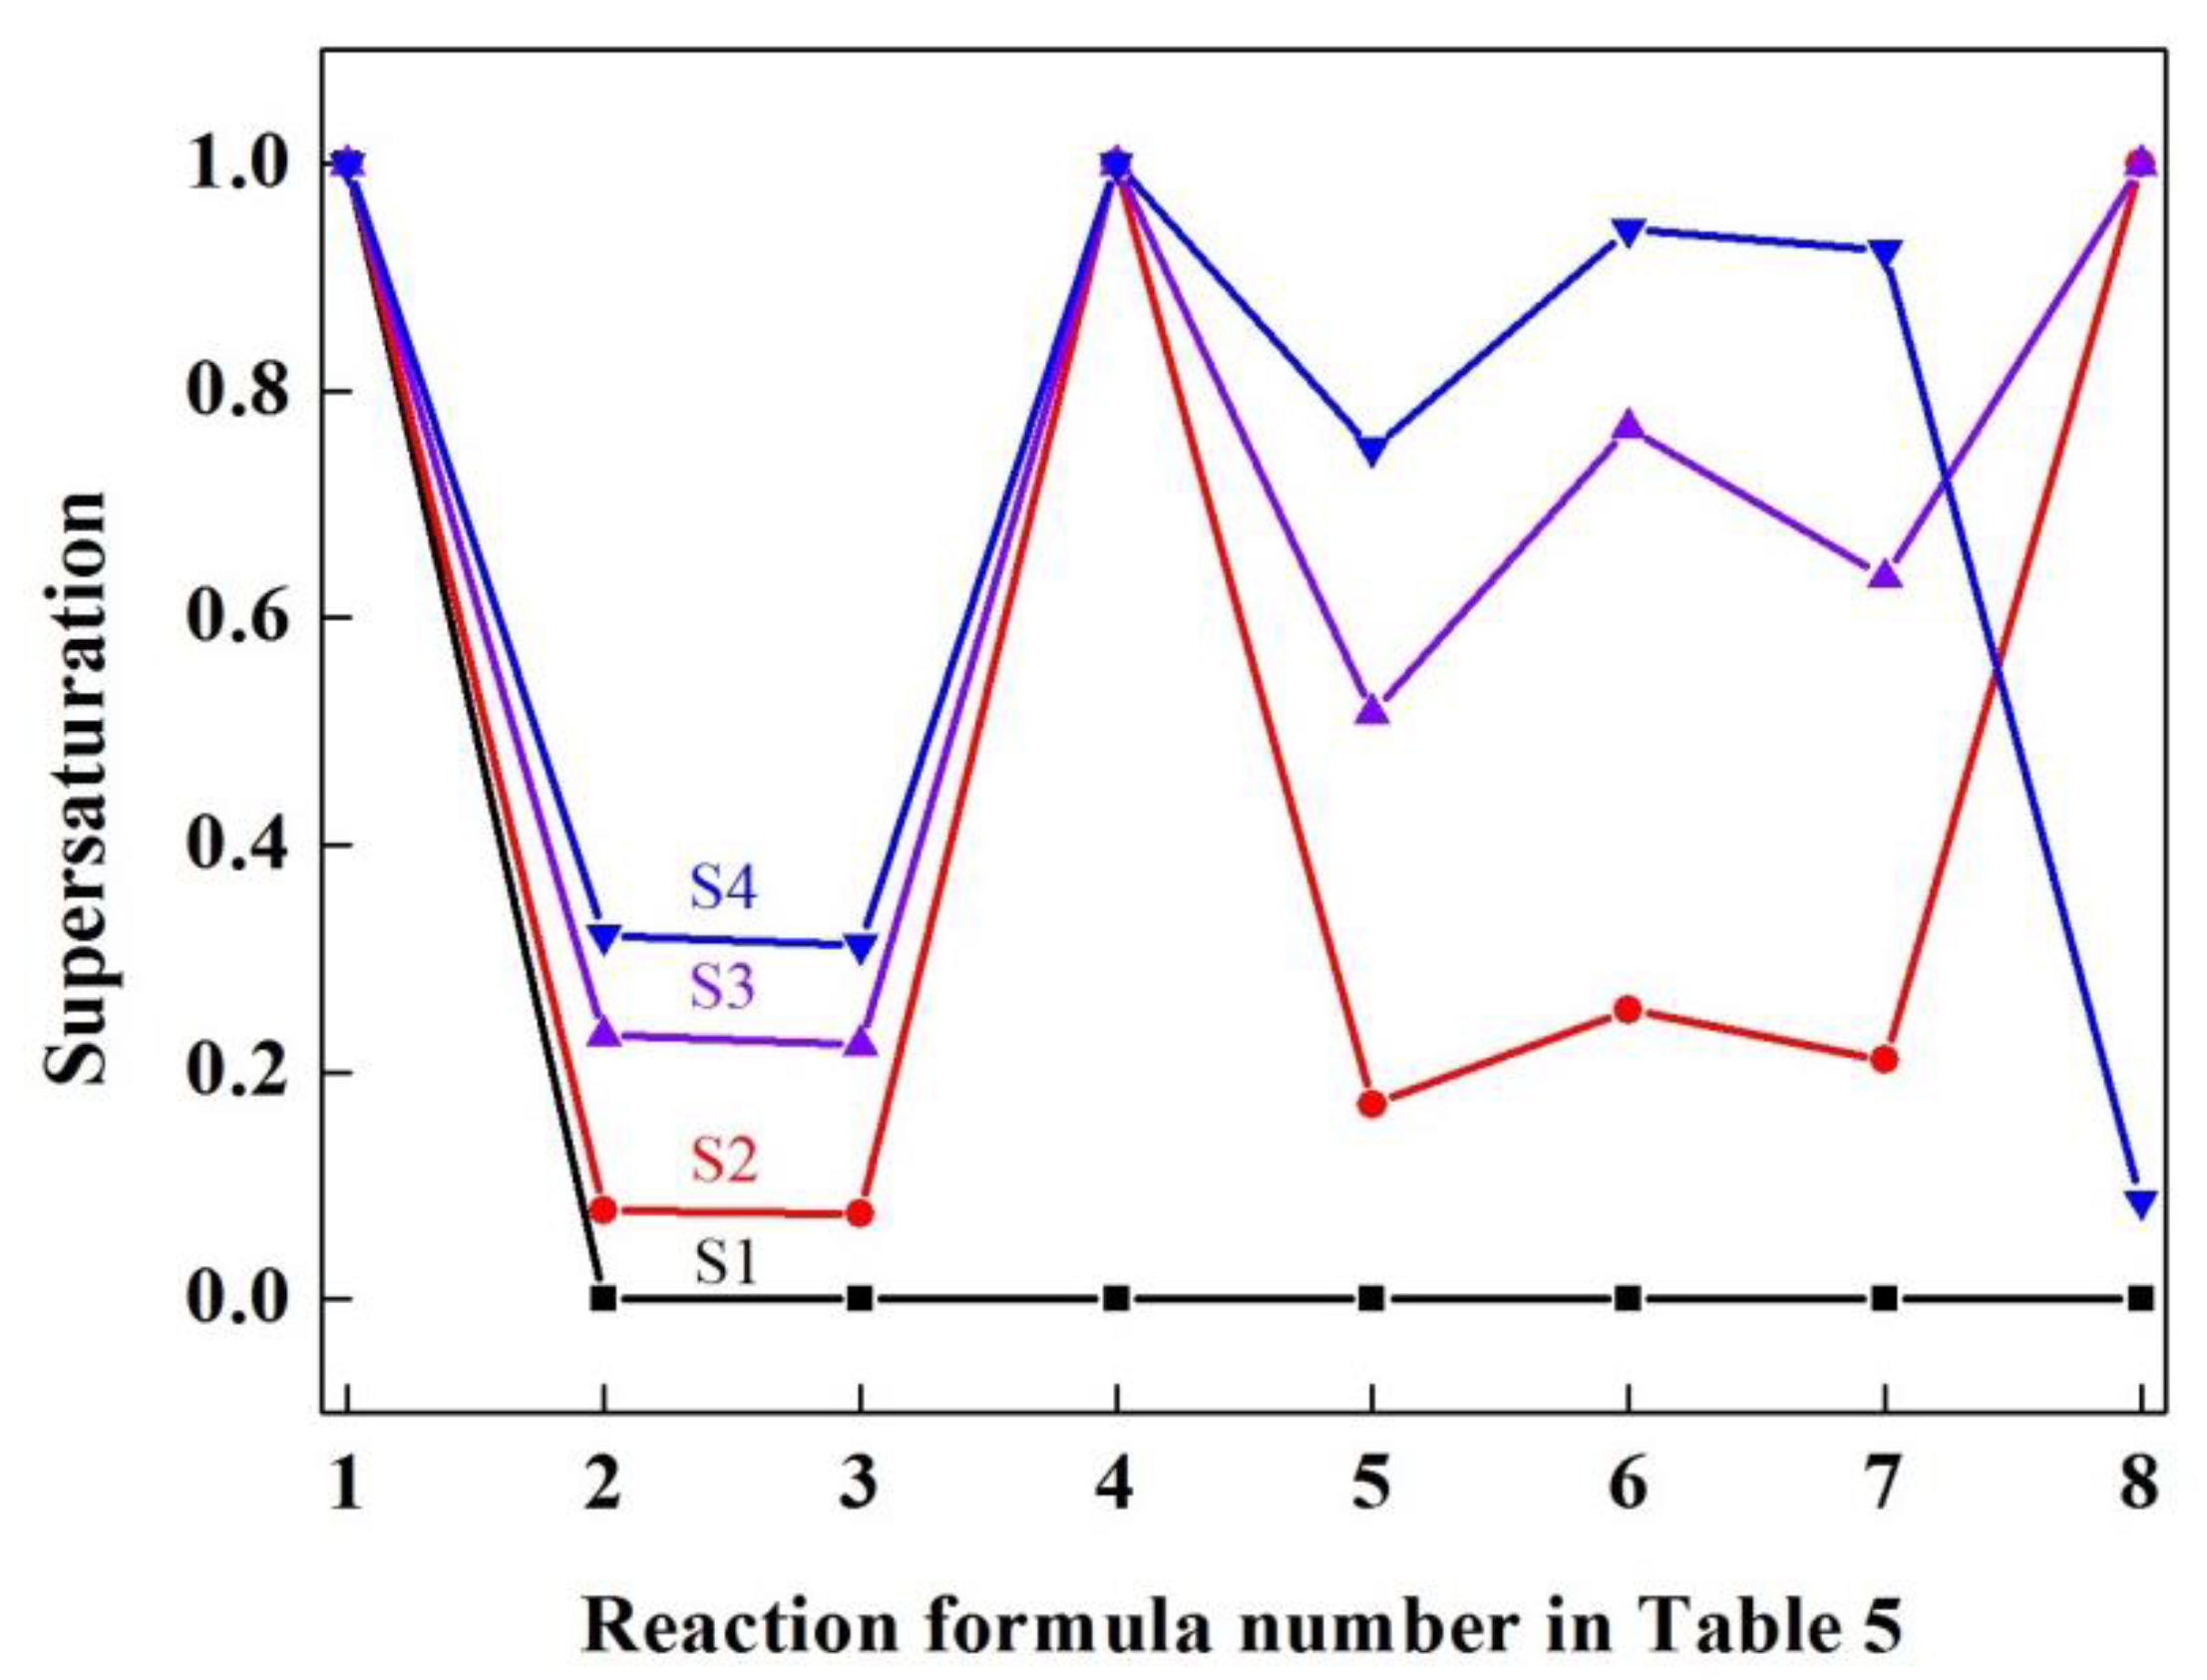
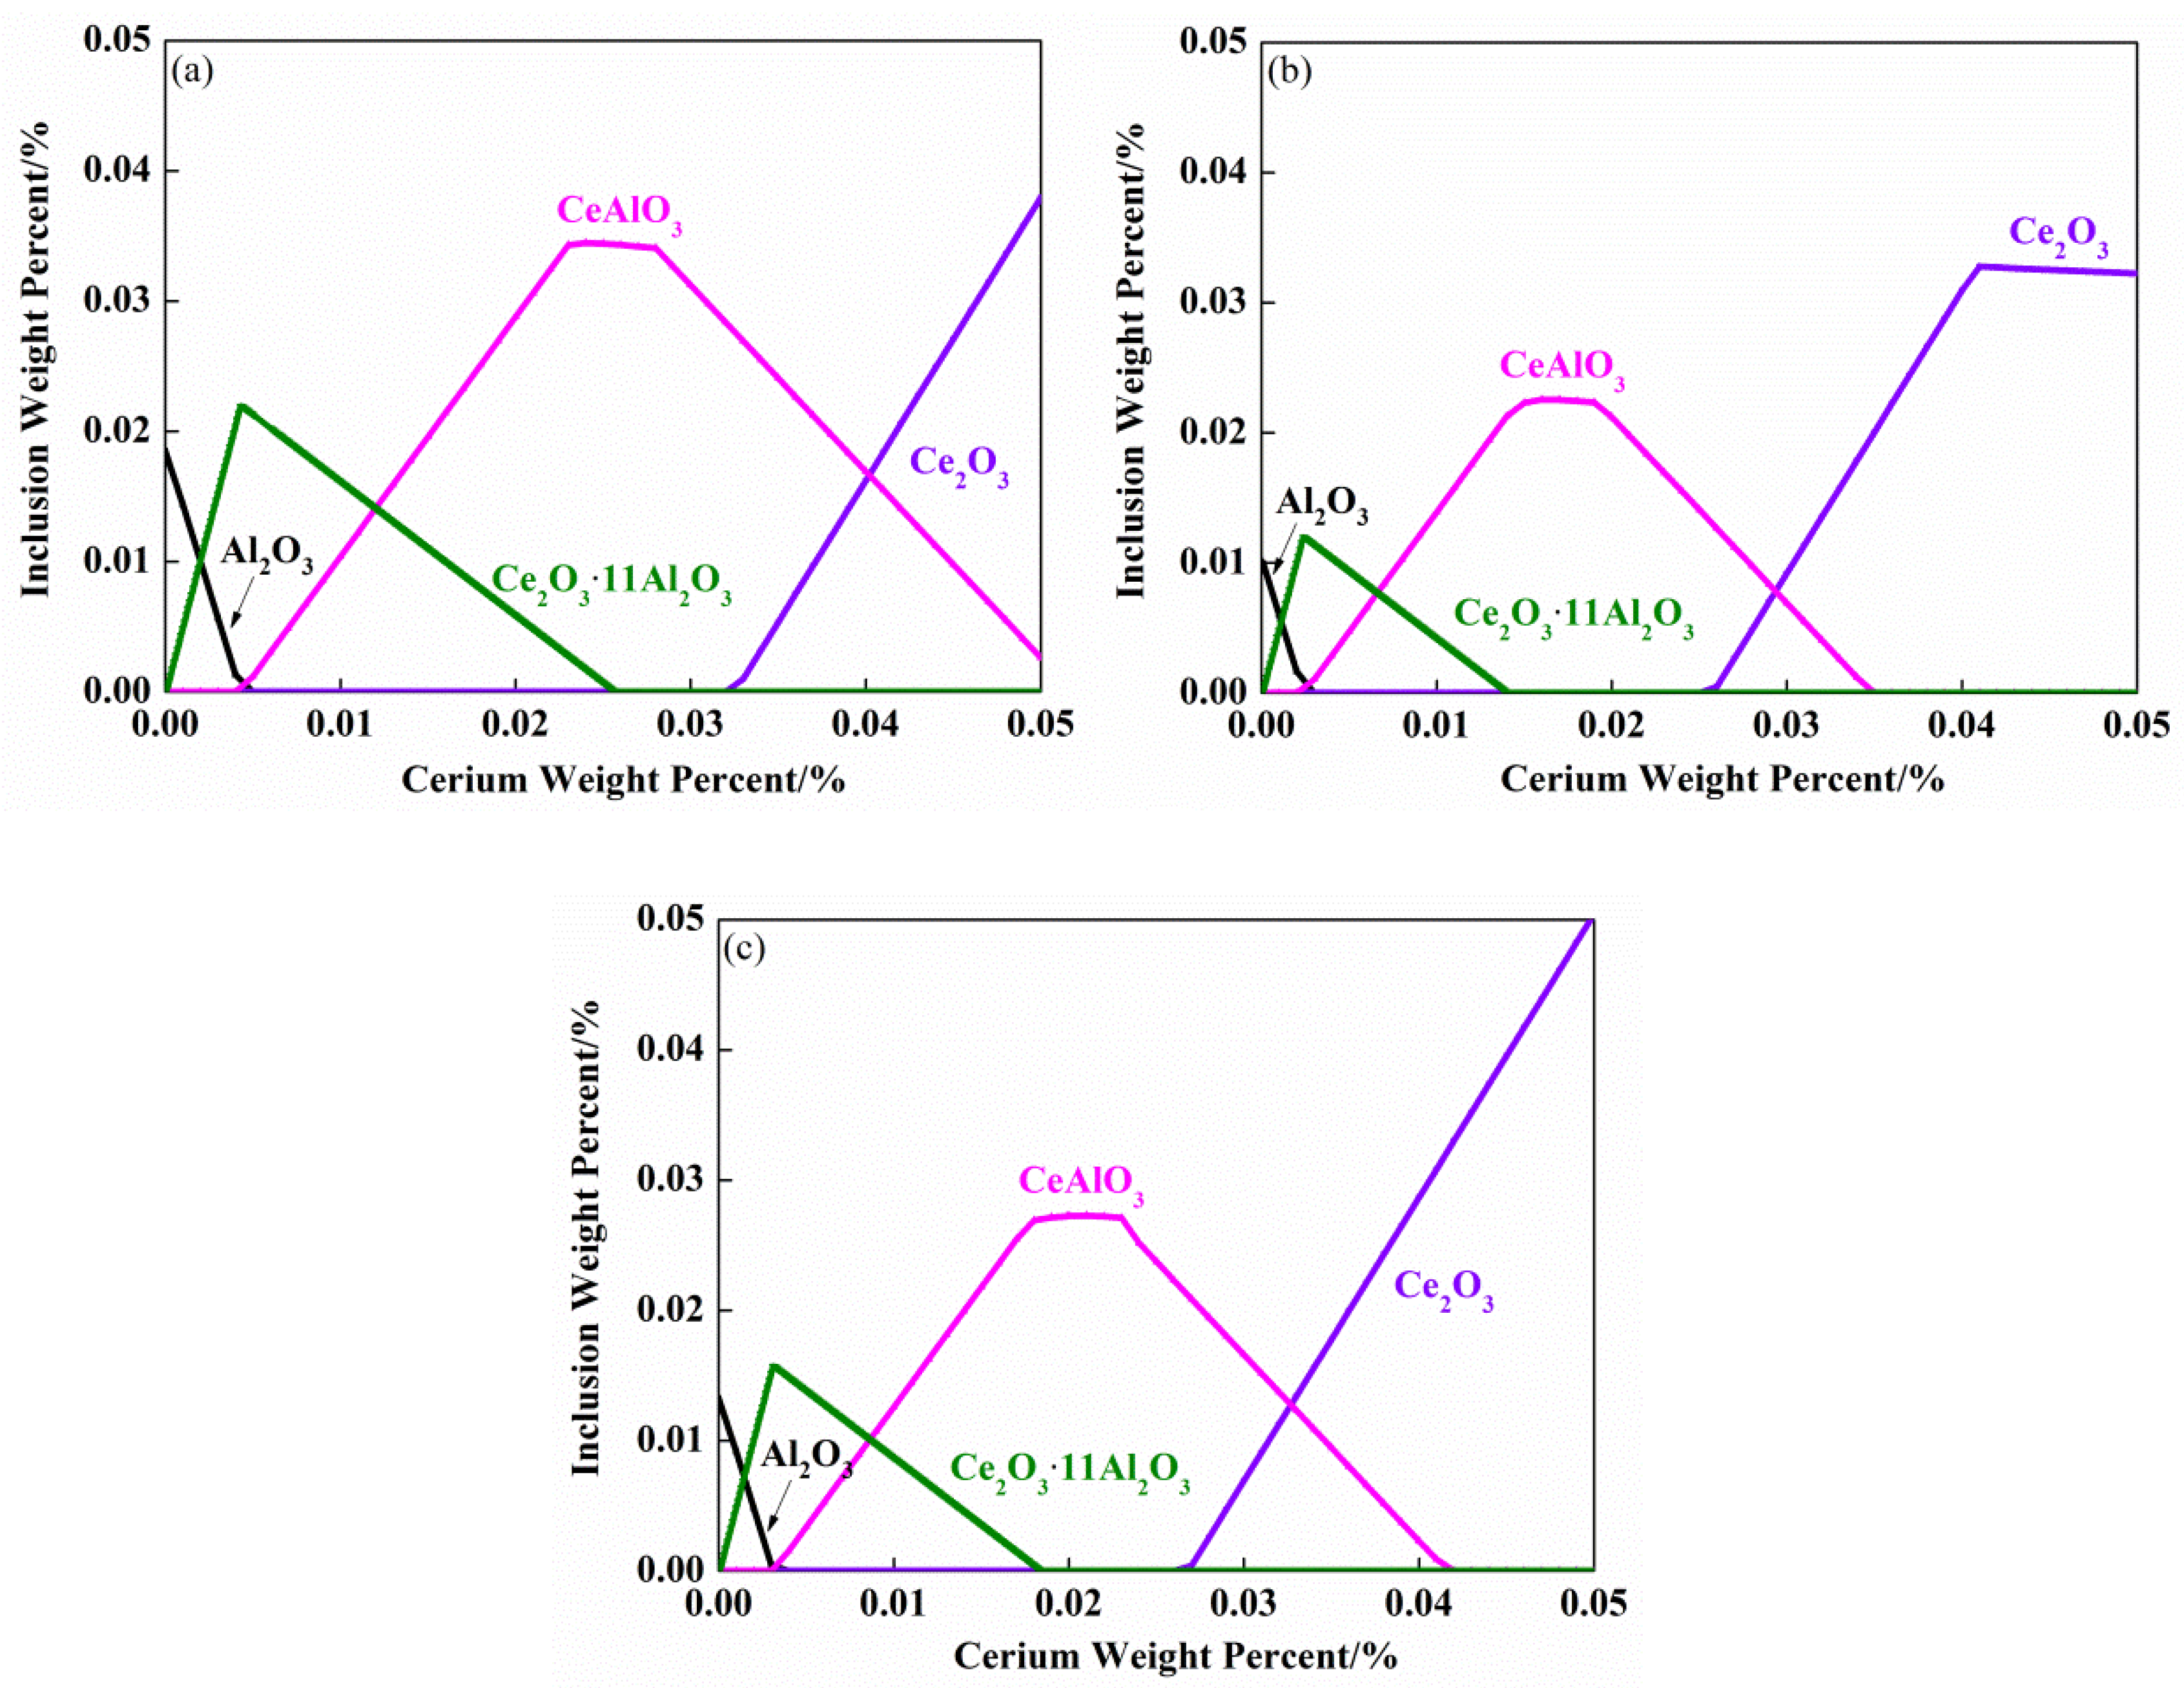
3.3. Thermodynamic Calculation of Inclusions

To determine the evolution mechanism of the inclusion with alumina modified by cerium, we should consider the formation of inclusions in the actual reaction process. The interaction coefficients of elements in the SWRS82B steel at 1873 K are shown in Table 3 [28]. According to the Wagner’s model formula in Equation (1), the calculated activity coefficient of [O], [S], [Ce], and [Al] element, and then according to the activity formula in Equation (2), the calculated activities of [O], [S], [Ce], and [Al] are shown in Table 4. The reactions of inclusion transformation and the standard Gibbs free energy of these reactions in molten SWRS82B steel are listed in Table 5 [29,30,31,32,33].
lg f i = j n e i j w ( j % )
a i = f i · w ( i % )
where fi activity coefficient, w(i%) and w(j%) represent the mass percentages of i and j, e i j is the activity interaction coefficient of i on j, and a i represents the activity of substance i degree.
When the temperature is 1873 K, according to the classical thermodynamic calculation method, the formation of inclusions in the actual reaction process is calculated. Combining Table 4 and Table 5 and the Equations (3) and (4), we calculated the actual active product and equilibrium active product of inclusions in samples S1–S4, and judged the actual active product in steel. If the ratio between actual active product and balanced active product is greater than 1, then the inclusions meet the forming conditions, and the calculation results are shown in Figure 5 (values with ratios greater than 1 in Figure 5 are written as 1). Without considering MnS, the only possible substances in sample S1 are Al2O3. The possible substances in sample S2 are Al2O3, CeAlO3, and Ce2O2S. The possible substances in sample S3 are Al2O3, CeAlO3, and Ce2O2S. The possible substances in sample S4 are Al2O3, Ce2O2S.
Δ G θ = RTln k
ε = a A / a B
where ΔGθ is the Gibbs free energy of the reaction system under standard conditions, R is the molar gas constant, the value is 8.314, T is the temperature, k is the reaction equilibrium constant, ε is the activity ratio, and a A   is the activity of the actual reaction process, a B   represents the activity in the equilibrium state.
According to the composition of samples S2–S4 in Table 1, Factsage software (FACTSAGE7.2, Thermfact/CRCT and GTT-Technologies, Montréal and herzogenrath, Canada and Germany) was used to calculate the equilibrium. When the temperature is 1873 K, the evolution of the inclusion composition with different amounts of cerium is shown in Figure 6. In Figure 6a–c, as the content of cerium increases, three types of inclusions Ce2O3∙11Al2O3, CeAlO3, and Ce2O3 are generated. In Figure 6a, the weight percentages of oxygen, sulfur, and aluminum used in the calculation are 0.0093%, 0.007%, and 0.0253%, respectively. Ce2O3∙11Al2O3 and CeAlO3 formed when the cerium content is 0.008%, Ce2O3∙11Al2O3 inclusions may decompose into Al2O3 and Ce2O3 inclusions. In Figure 6b, the weight percentages of oxygen, sulfur, and aluminum used in the calculation are 0.0053%, 0.007%, and 0.0254%, respectively. CeAlO3 is formed when the cerium content is 0.023%. In Figure 6c, the weight percentages of oxygen, sulfur, and aluminum used in the calculation are 0.0068%, 0.009%, and 0.0254%, respectively. Ce2O3 formed when the cerium content is 0.034%. However, no CeAlO3 inclusions were found with SEM, which may be because the content of CeAlO3 inclusions is lower than Ce2O3 inclusions, CeAlO3 can continue to combine with oxygen and sulfur to form Ce2O2S, and CeAlO3 inclusions are difficult to find. Therefore, combined with the actual amount of cerium during the experiment, the inclusions are transformed according to the following route: Al2O3 → Al2O3 + CeAlO3 + Ce2O3 → CeAlO3 + Ce2O3 → Ce2O3. Since there is no data for cerium oxysulfide in the Factsage software database, the transition route of inclusions needs to be modified in conjunction with classical thermodynamic calculations. Combining the classical thermodynamic results and Factsage thermodynamic results, the composition of inclusions in SWRS82B steel at 1873 K transforms with cerium addition as follows: Al2O3 → Al2O3 + CeAlO3 + Ce2O2S → CeAlO3 + Ce2O2S → Ce2O2S.

3.4. Transformation of Inclusions during Cooling and Solidification

According to the composition of molten steel, as shown in Table 1 and Table 2, Factsage software (FACTSAGE7.2, Thermfact/CRCT and GTT-Technologies, Montréal and herzogenrath, Canada and Germany) is used to calculate the equilibrium state of different cerium additions and the evolution of inclusions composition at different temperatures, as shown in Figure 7. In Figure 7a, the weight percentages of oxygen, sulfur, and aluminum used in the calculation are 0.015%, 0.008%, and 0.0254%. In Figure 7b, the weight percentages of oxygen, sulfur, and aluminum used in the calculation are 0.0093%, 0.007%, and 0.0253%. In Figure 7c, the weight percentages of oxygen, sulfur, and aluminum used in the calculation are 0.0053%, 0.007%, and 0.0254%. In Figure 7d, the weight percentages of oxygen, sulfur, and aluminum used in the calculation are 0.0068%, 0.009%, and 0.0254%. At 1873 K, when cerium is not added to the SWRS82B steel, the inclusions were mainly composed of Al2O3. MnS inclusions began to precipitate at 1633 K(1360 °C) during the solidification of molten steel. The reaction is described by reactions (5) and (6), as shown in Figure 7a. At 1873 K, when the sample steel is added with 0.008% cerium, the inclusions are mainly CeAlO3 inclusions. During the solidification of molten steel, when the temperature is 1643 K (1370 °C), the CeAlO3 will partly decompose into Al2O3, while the original content of CeAlO3 will decrease, and MnS inclusions begin to precipitate. When CeAlO3 disappears at about 1170 °C, Ce2S3 inclusions begin to precipitate. During solidification, the inclusions change according to the following route: CeAlO3 → CeAlO3 + Al2O3 + MnS → Al2O3 + MnS + Ce2S3, the reaction is described by reactions (5)–(7), as shown in Figure 7b. At 1873 K, when the sample steel is added with 0.023% cerium, the inclusions are mainly composed of Ce2O3 and CeAlO3. When the temperature is 1713 K (1440 °C), the concentration of Ce2O3 will decompose into Ce2S3 and CeAlO3, while the original content of Ce2O3 decreases, and the content of Ce2S3 and CeAlO3 increases, CeAlO3 disappears completely when it decreases to 1383K (1110 °C). During the solidification process, the inclusions are transformed according to the following route: CeAlO3 → CeAlO3 + Ce2S3 → Ce2S3 + Al2O3, the reaction is described by reactions (5)–(8), as shown in Figure 7c. At 1873 K, when the sample steel is added with 0.034% cerium, the inclusions are mainly composed of Ce2O3. As the temperature decreases at about 1673 K (1400 °C), Ce2S3 and CeAlO3 inclusions start to precipitate successively. During the solidification process, the inclusions are transformed according to the following route: Ce2O3 →CeAlO3 + Ce2S3 + Al2O3, the reaction is described by formula (5)–(9), as shown in Figure 7d.
2[Al] + 3[O] = Al2O3(s)
[Mn] + [S] = MnS
2[Ce] + 3[S] = Ce2S3(s)
Ce2O3(s) = 2[Ce] + 3[O]
[Ce] + Al2O3 = CeAlO3 + [Al]

3.5. Inclusion Evolution Model

Combining the SEM/EDS results and the relevant calculation results in Figure 5, Figure 6 and Figure 7 for analysis, the evolution of inclusions can be roughly divided into three routes according to different cerium additions, as shown in Figure 8. (I) Add a small amount of cerium to the molten steel, and the cerium reacts with Al2O3 to form CeAlO3 inclusions. Due to the incomplete reaction, it also contains Al2O3 inclusions. As the reaction proceeds, Ce2O2S inclusions formed in the outer layer. The reaction is shown in reactions (10)–(11). During the solidification process, Ce2S3 inclusions precipitated in the outer layer of inclusions. According to reactions (1)–(3), the thermodynamically stable order of inclusions that may be formed in liquid steel is Ce2O2S > Ce2S3. It can be seen that Ce2S3 is not stable, and may combine with sulfur and oxygen to form Ce2O2S. The reaction is described by reaction (12). Compared with the alumina inclusions before modification, the morphology and size of the modified inclusions have changed significantly. The average size of the composite inclusions is reduced in the range of 2 μm–3.12 μm, the morphology changes to nearly spherical. (II) When 0.023% cerium is added to the molten steel, the core Al2O3 of the composite inclusion nucleation is completely covered by CeAlO3 inclusions. This may be due to the fact that the reaction in reaction (10) is relatively completed and converted to other substances, and Ce2S3 inclusions formed during the solidification process. Compared with the morphology of alumina inclusions, the edges and corners of the composite inclusions gradually degenerate into a smooth spherical surface. The average size of the composite inclusions is reduced in the range of 5.13 μm–6.48 μm compared with the Al2O3 inclusions. The fine dispersion effect is the best. (III) When 0.0034% cerium is added to molten steel, Ce2O2S inclusions formed at 1873 K, and CeAlO3 and Ce2S3 inclusions formed during the solidification process. The reaction is described by reactions (10)–(13). Because the reaction did not reach a completely ideal equilibrium state, the actual results and the calculated results are within the expected deviation, which is basically consistent with the experimental results.
[Ce] + Al2O3 = CeAlO3 + [Al]
6[Ce] + 3[S] + 2Al2O3(s) = 3Ce2O2S(s) + 4[Al]
Ce2S3 + 2[O] ⇌ Ce2O2S + 2[S]
Ce2O3 + [S] ⇌ Ce2O2S + [O]

4. Conclusions

The influence of the addition of cerium in SWRS82B in the range of 0–0.034% on the modification of alumina inclusions was studied. Through experiments and theoretical calculations, the conclusions are as follows:
(1)
Before the addition of cerium, the average size of the inclusions is in the range of 8.65 μm–11.32 μm and the shape is irregular. When cerium is added, the inclusions gradually become spheroidized and the average size of the inclusions varies in the range of 3.52 μm–8.19 μm, and if the cerium content exceeds 0.023%, the inclusions will grow excessively.
(2)
Compared with Al2O3 inclusions in sample S1, the average size of inclusions produced by adding 0.023% cerium is reduced in the range of 5.13 μm–6.48 μm, and the best characteristics of inclusions in this study were obtained in experimental samples with cerium addition of 0.023%, in which the minimum size of inclusions is in the range of 3.52 μm–4.84 μm and most uniform distribution.
(3)
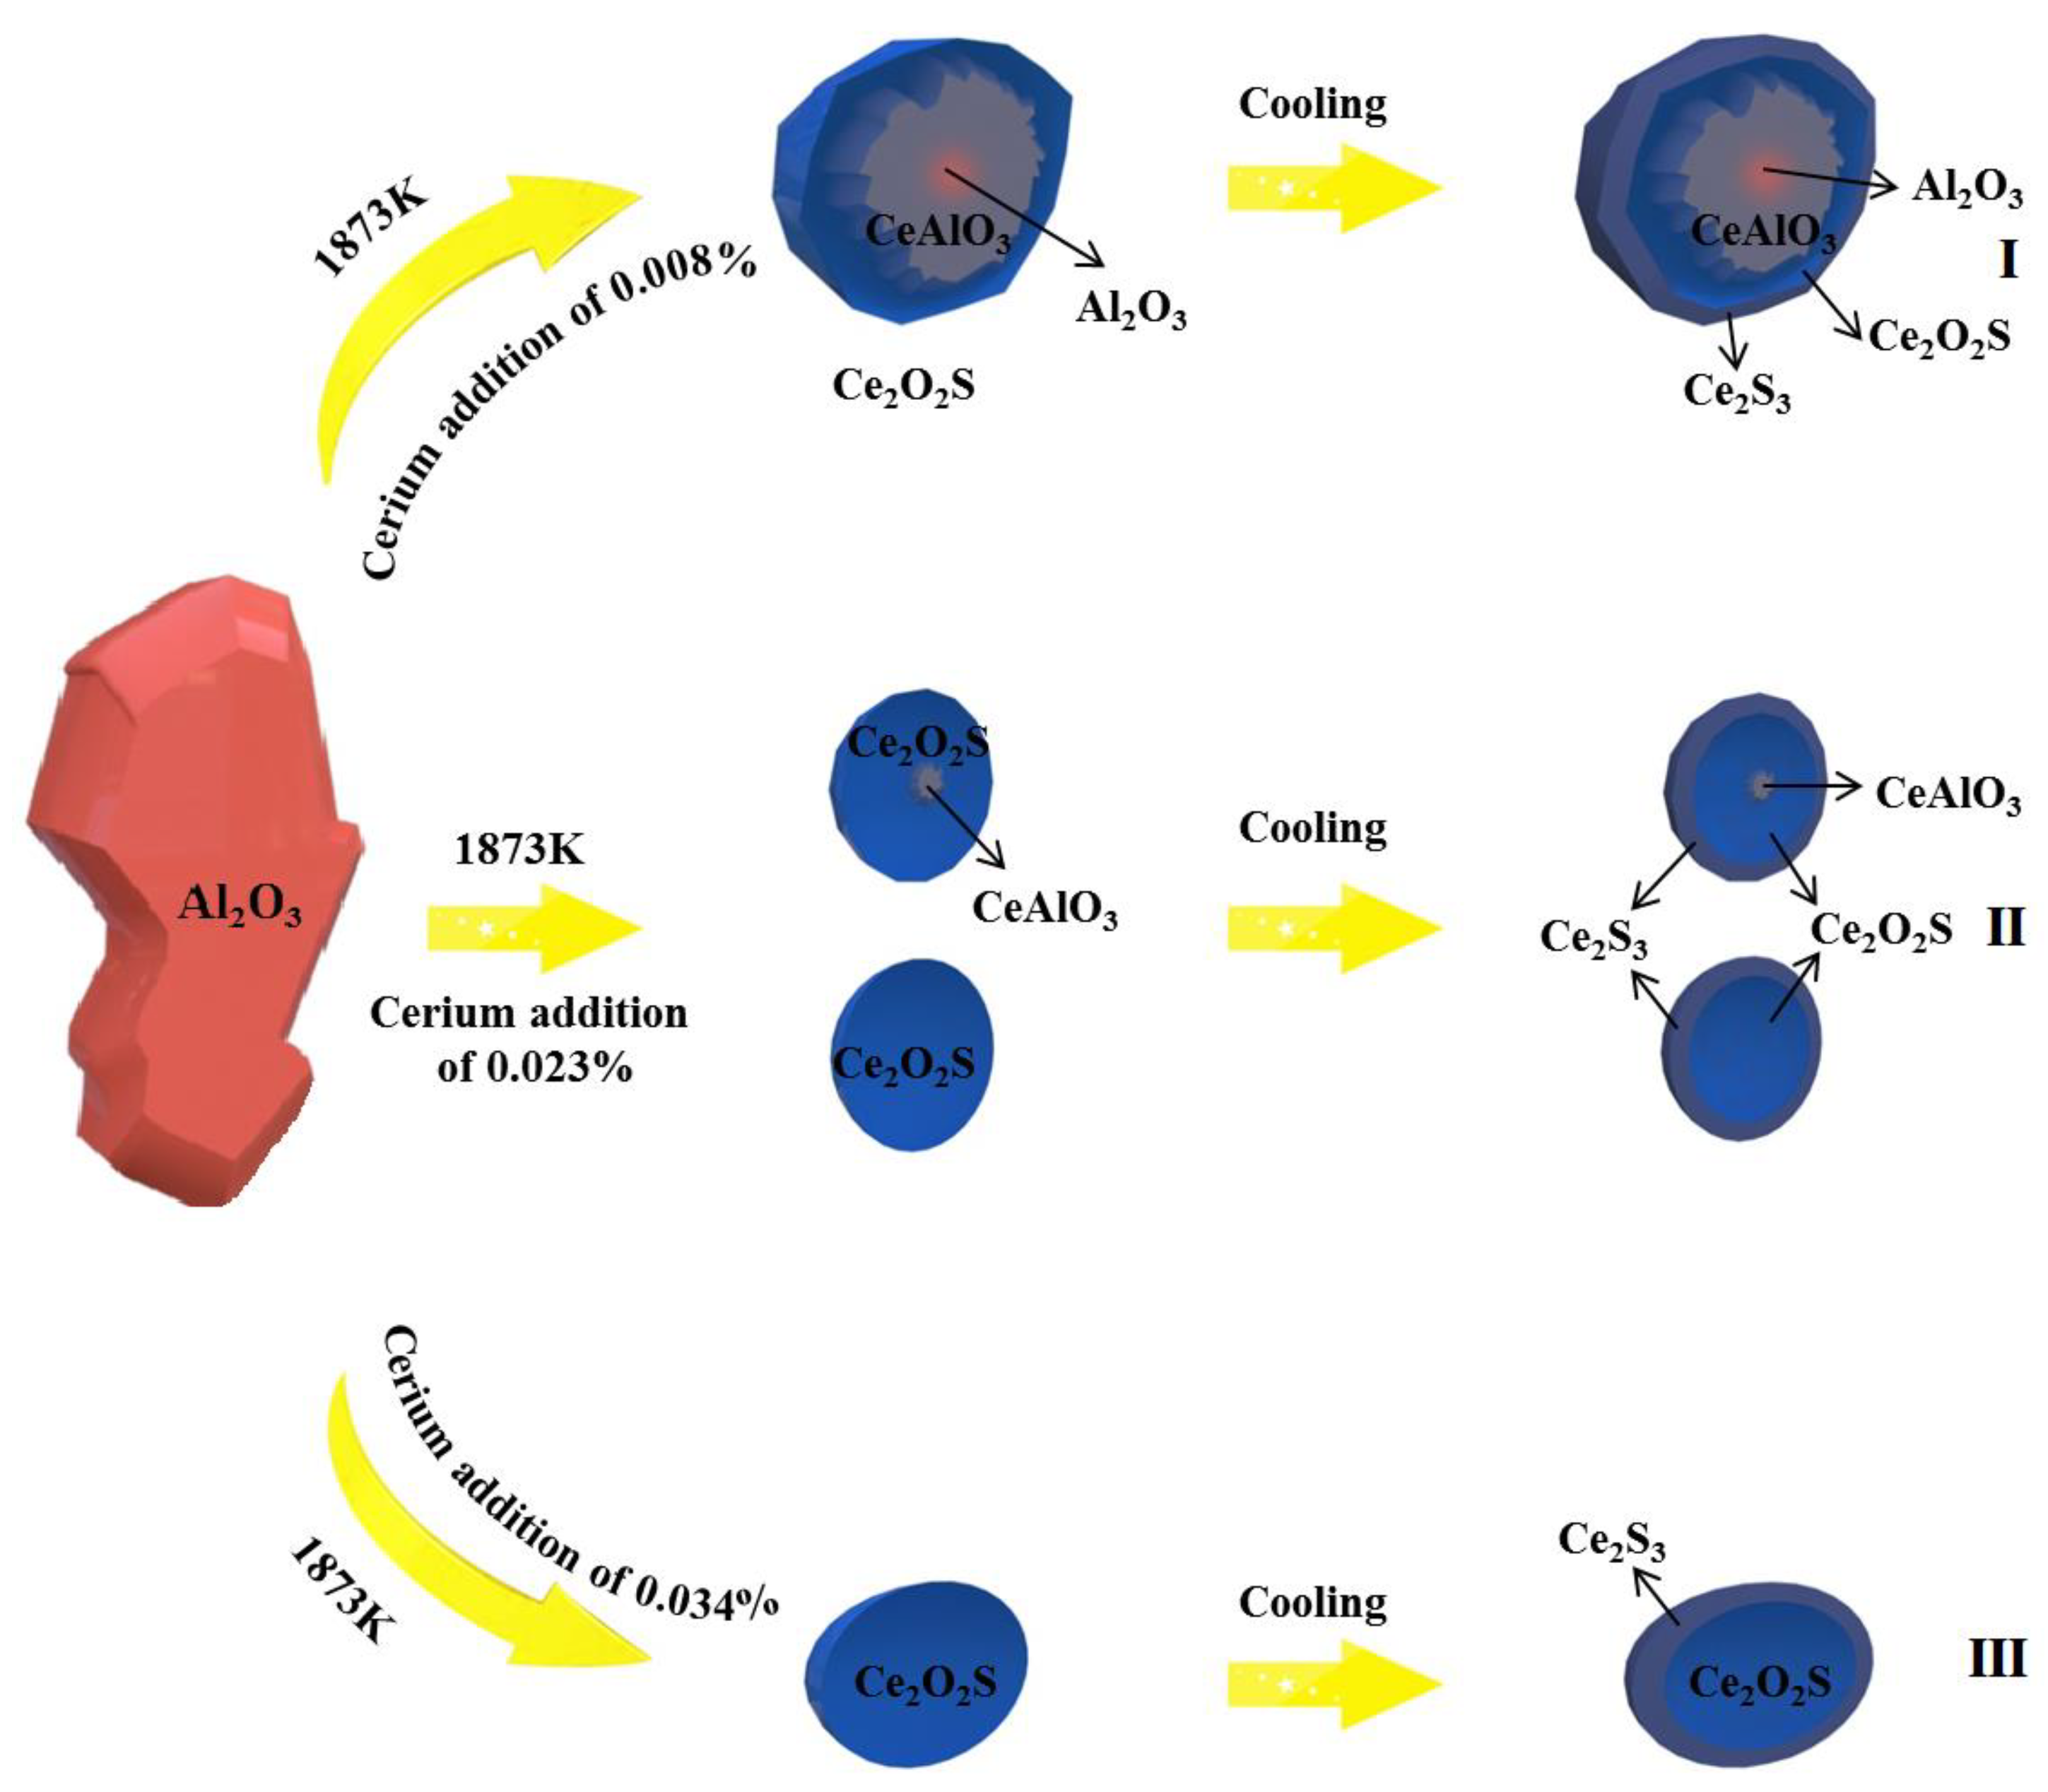
The classical thermodynamic calculation results are basically consistent with the experimental composition results, and the transition route of inclusions in SWRS82B steel at 1873 K is as follows: Al2O3 → Ce2O2S + CeAlO3 + Al2O3 → CeAlO3 + Ce2O2S/Ce2O2S → Ce2O2S.
(4)
Ce2S3 precipitated during solidification. The modification route of Al2O3 inclusions in SWRS82B steel by increased cerium additions is as follows: Al2O3 → Ce2S3 + CeAlO3 + Ce2O2S + Al2O3 → Ce2S3 + CeAlO3 + Ce2O2S/Ce2S3 + Ce2O2S → Ce2S3 + Ce2O2S.

Author Contributions

Conceptualization, Y.W. and C.L.; methodology, Y.W., L.W.; software, Y.W., X.X., and L.C.; writing—original draft preparation, Y.W. and L.W.; writing—review and editing, L.W. and C.L.; funding acquisition, C.L. and C.Z. All authors have read and agreed to the published version of the manuscript.

Funding

This project is s financially supported by the National Science Foundation of China with the grant No. 51864013, 52074095, 51704083, and 52064011.

Conflicts of Interest

The authors declare no conflict of interest.

References

  1. Zhang, J.Q.; Liang, Y.L.; Xiang, S.; Yang, X.D.; Yang, M. Effect of Heat Treatment Process on Microstructure and Mechanical Properties of SWRS82B Wire Rod. Adv. Mater. Res. 2010, 97, 752–755. [Google Scholar] [CrossRef]
  2. Amouyal, Y.; Mao, Z.; Seidman, D.N. Combined atom probe tomography and first-principles calculations for studying atomistic interactions between tungsten and tantalum in nickel-based alloys. Acta Mater. 2014, 74, 296–308. [Google Scholar] [CrossRef]
  3. Tanaka, Y.; Pahlevani, F.; Moon, S.C.; Dippenaar, R.; Sahajwalla, V. In situ characterisation of MnS precipitation in high carbon steel. Sci. Rep. 2019, 9, 1798–1810. [Google Scholar] [CrossRef] [PubMed] [Green Version]
  4. Yang, C.Y.; Luan, Y.K.; Li, D.Z.; Li, Y.Y. Effects of rare earth elements on inclusions and impact toughness of high-carbon chromium bearing steel. J. Mater. Sci. Technol. 2019, 35, 1298–1308. [Google Scholar] [CrossRef]
  5. Wang, H.P.; Xiong, L.; Zhang, L.; Wang, Y.; Shu, Y.Y.; Zhou, Y.H. Investigation of RE-O-S-As Inclusions in High Carbon Steels. Metall. Mater. Trans. B 2017, 48, 2849–2858. [Google Scholar] [CrossRef]
  6. Khurana, B.; Spooner, S.; Rao, M.B.V.; Roy, G.G.; Srirangam, P. In situ observation of calcium oxide treatment of inclusions in molten steel by confocal microscopy. Metall. Mater. Trans. B 2017, 48, 1409–1415. [Google Scholar] [CrossRef] [Green Version]
  7. Wilson, W.G.; Heaslip, L.J.; Sommerville, I.D. Rare Earth Additions in Continuously Cast Steel. JOM 1985, 37, 36–41. [Google Scholar] [CrossRef]
  8. Ye, G.; Jonsson, P.; Lund, T. Thermodynamics and Kinetics of the Modification of Al2O3 Inclusions. ISIJ Int. 1996, 36, S105–S108. [Google Scholar] [CrossRef]
  9. Tugrul, E.T. Ladle deoxidation, desulphurisation and inclusions in steel-Part II: Observations in practice. Archiv. Dassenhuttenwesen 1983, 54, 45–52. [Google Scholar]
  10. Fruehan, R.J. The free energy of formation of Ce2O2S and the nonstoichiometry of cerium oxides. Metall. Mater. Trans. B 1979, 10, 143–148. [Google Scholar] [CrossRef]
  11. Nicholson, A.; Howarth, D.J.; Turton, J. Metallurgical Development of Ultra Clean and Low Sulphur Steel at BSC River Don Works. Ironmak. Steelmak. 1983, 10, 185–192. [Google Scholar]
  12. Hirata, H.; Isobe, K. Steel Having Finely Dispersed Inclusions. U.S. Patent US20060157162 A1, 20 July 2006. [Google Scholar]
  13. Yang, X.H.; Wu, P.F.; Cheng, G.G. Behavior of rare earth on modifying inclusion in special steel. J. Chin. Rare Earth Soc. 2010, 28, 612. [Google Scholar]
  14. Gao, S.; Wang, M.; Guo, J.L.; Wang, H.; Zhi, J.G.; Bao, Y.P. Characterization Transformation of Inclusions Using Rare Earth Ce Treatment on Al-Killed Titanium Alloyed Interstitial Free Steel. Steel Res. Int. 2019, 90, 1900194. [Google Scholar] [CrossRef]
  15. Wen, B.; Song, B. In Situ Observation of the Evolution of Intragranular Acicular Ferrite at Ce-Containing Inclusions in 16Mn Steel. Steel Res. Int. 2012, 83, 487–495. [Google Scholar]
  16. Li, H.; Yu, Y.C.; Ren, X.; Zhang, S.H.; Wang, S.B. Evolution of Al2O3 inclusions by cerium treatment in low carbon high manganese steel. J. Iron Steel Res. Int. 2017, 24, 925–934. [Google Scholar] [CrossRef]
  17. Wang, L.J.; Liu, Y.Q.; Wang, Q.; Chou, K.C. Evolution Mechanisms of MgO center dot Al2O3 Inclusions by Cerium in Spring Steel Used in Fasteners of High-speed Railway. ISIJ Int. 2015, 55, 970–975. [Google Scholar] [CrossRef] [Green Version]
  18. Li, Y.D.; Zhang, T.S.; Liu, C.J.; Jiang, M.F. Thermodynamic and Experimental Studies on Al Addition of 253MA Steel. Metals 2019, 9, 433. [Google Scholar] [CrossRef] [Green Version]
  19. Šuler, B.; Burja, J.; Medved, J. Modification of non-metallic inclusions with rare-earth metals in 50CrMoV13-1 steel. Mater. Tehnol. 2019, 53, 441–447. [Google Scholar] [CrossRef]
  20. Yan, H.H.; Hu, Y.; Zhao, D.W. Analysis of the microstructure and properties of AISI 1026 steel containing rare earth elements. Mater. Res. Express 2019, 6, 106–115. [Google Scholar] [CrossRef]
  21. Li, Y.D.; Liu, C.J.; Zhang, T.S.; Jiang, M.F.; Peng, C. Liquid Inclusions in Heat-Resistant Steel Containing Rare Earth Elements. Metall. Mater. Trans. B 2016, 48, 956–965. [Google Scholar] [CrossRef]
  22. Gundersen, H.J.G. Stereology of arbitrary particles. A review of unbiased number and size estimators and the presentation of some new ones, in memory of William, R. Thompson. J. Microsc. 1986, 143, 3–45. [Google Scholar] [CrossRef] [PubMed]
  23. Li, T.; Shimasaki, S.I.; Taniguchi, S.J.; Uesugi, K.; Narita, S.S. Stereological Analysis of Nonspherical Particles in Solid Metal. Metall. Mater. Trans. B 2013, 44, 750–761. [Google Scholar] [CrossRef]
  24. Zhang, D.; Shen, P.; Xie, J.B.; An, J.M.; Huang, Z.Z.; Fu, J.X. A method for observing tridimensional morphology of sulfide inclusions by non-aqueous solution electrolytic etching. J. Iron Steel Res. Int. 2018, 26, 275–284. [Google Scholar] [CrossRef]
  25. Bi, Y.Y.; Karasev, A.; Jönsson, P.G. Three-Dimensional Investigations of Inclusions in Ferroalloys. Steel Res. Int. 2014, 85, 659–669. [Google Scholar] [CrossRef]
  26. Zhang, X.W.; Zhang, L.F.; Yang, W.; Wang, Y.; Liu, Y.; Dong, Y.C. Characterization of the Three-Dimensional Morphology and Formation Mechanism of Inclusions in Linepipe Steels. Metall. Mater. Trans. B 2017, 48, 701–712. [Google Scholar] [CrossRef]
  27. Wang, Y.; Karasev, A.; Jönsson, P.G. An Investigation of Non-Metallic Inclusions in Different Ferroalloys using Electrolytic Extraction. Metals 2019, 9, 687. [Google Scholar] [CrossRef] [Green Version]
  28. Huang, X.H. Principles of Iron and Steel Metallurgy, 3rd ed.; Metallurgical Industry Press: Beijing, China, 1981; p. 426. ISBN 7-5024-2861-5. [Google Scholar]
  29. Li, X.; Jiang, Z.; Geng, X.; Chen, M.J.; Peng, L.Z. Evolution Mechanism of Inclusions in H13 Steel with Rare Earth Magnesium Alloy Addition. ISIJ Int. 2019, 59, 1552–1561. [Google Scholar] [CrossRef] [Green Version]
  30. Liu, X.; Yang, J.C.; Yang, L.; Gao, X.Z. Effect of Ce on Inclusions and Impact Property of 2Cr13 Stainless Steel. J. Iron Steel Res. Int. 2010, 17, 62–67. [Google Scholar] [CrossRef]
  31. Li, G.; Lan, P.; Zhang, J.Q. Solidification Structure Refinement in TWIP Steel by Ce Inoculation. Acta Metall Sin. 2020, 56, 704–714. [Google Scholar]
  32. Straumanis, M.E.; Kim, C.D. Phase extent of gallium arsenide determined by the lattice constant and density method. Acta Cryst. 1965, 19, 256–259. [Google Scholar] [CrossRef]
  33. Kolitsch, U.; Seifert, H.J.; Ludwig, T.; Aldinger, F. Phase equilibria and crystal chemistry in the Y2O3–Al2O3–SiO2 system. J. Mater. Res 1999, 14, 447–455. [Google Scholar] [CrossRef]
Figure 1. SEM/EDS image of alumina inclusions in the sample S1. (ag) SEM image of alumina inclusions in the sample S1.
Metals 10 01696 g001
Figure 2. SEM/EDS image of typical inclusions in the sample S1–S4. (a,b) sample S2, (c,d) sample S3, (e,f) sample S4.
Metals 10 01696 g002aMetals 10 01696 g002b
Figure 3. The number and average size of inclusions. (a) inclusion size distribution, (b) number of inclusions, (c) inclusion average size.
Metals 10 01696 g003aMetals 10 01696 g003b
Figure 4. Density distribution of the inclusions on the cross-section. (a) Sample S1 area density distribution, (b) Sample S2 area density distribution, (c) Sample S3 area density distribution, (d) Sample S4 area density distribution.
Metals 10 01696 g004aMetals 10 01696 g004b
Figure 5. Comparison chart of activity product and equilibrium activity product of different reaction formulas at 1873 K.
Metals 10 01696 g005
Figure 6. Evolution process of Al2O3 inclusions when adding cerium at 1873 K. Calculations performed for (a) sample S2 steel composition; (b) sample S3 steel composition; (c) sample S4 steel composition.
Metals 10 01696 g006
Figure 7. Calculation results by thermodynamic software. Effect of cerium addition on inclusions, (a) w(Ce%) = 0; (b) w(Ce%) = 0.008%; (c) w(Ce%) = 0.023%; (d) w(Ce%) = 0.034%.
Metals 10 01696 g007
Figure 8. Inclusion evolution model.
Metals 10 01696 g008
Table 1. Chemical composition of the test steel (weight precent/%).
ElementCSiMnPSAlO
S10.8260.210.830.0190.0080.02540.015
S20.8230.210.820.0180.0070.02530.0093
S30.8240.200.830.0190.0070.02540.0053
S40.8210.210.830.0190.0090.02540.0068
Table 2. Actual cerium contents and measured yields.
SampleActual Content/%CeActual Yield/%
S100
S20.0089.34
S30.02310.07
S40.0349.53
Table 3. Interaction coefficients of elements in the SWRS82B steel at 1873 K [28].
e i j CSiMnPAlOSCe
O−0.45−0.133−0.0210.07−3.9−0.20−0.133−0.57
S0.110.063−0.0260.0290.035−0.27−0.026-
Ce−0.077-0.131.77−2.58−106−10.320.0069
Al0.0910.0056--0.045−6.60.03-
Note: i = O, S, Ce, Al; j = C, Si, Mn, P, Al, O, S, Ce.
Table 4. Activities of [O], [S], [Ce], and [Al] in all samples used at 1873 K.
Numbera[O]a[S]a[Ce]a[Al]
S10.004540.0096700.02419
S20.004520.009640.007180.02625
S30.004500.009650.021630.02801
S40.004380.009650.031420.02737
Table 5. Reaction equation and the standard Gibbs free energy [29,30,31,32,33].
NumberEquationΔGθ/(J·mol−1)
12[Al] + 3[O] = Al2O3(s)−1,225,196 + 393.78T
2[Ce] + 2[O] = CeO2(s)−852,720 + 249.96T
3[Ce] + 3/2[O] = 1/2Ce2O3(s)−714,380 + 179.74T
4[Ce]+[O] + 1/2[S] = 1/2 Ce2O2S(s)−675,700 + 165.5T
5[Ce] + 3/2[S] = 1/2Ce2S3(s)−536,420 + 163.86T
6[Ce] + 4/3[S] = 1/3Ce3S4(s)−497,670 + 146.3T
7[Ce] + [S] = CeS(s)−422,100 + 120.38T
8[Ce] + 3[O] + [Al] = CeAlO3(s)−1,366,460 + 364.3T
Publisher’s Note: MDPI stays neutral with regard to jurisdictional claims in published maps and institutional affiliations.

