Article

Control of Density and Grain Structure of a Laser Powder Bed-Fused Superelastic Ti-18Zr-14Nb Alloy: Simulation-Driven Process Mapping

by
Vladimir Brailovski
1,*,
Victoria Kalinicheva
2,
Morgan Letenneur
1,
Konstantin Lukashevich
2,
Vadim Sheremetyev
2 and
Sergey Prokoshkin
2
1
Department of Mechanical Engineering, École de Technologie Supérieure, 1100 Notre-Dame Street West, Montreal, QC H3C 1K3, Canada
2
Metal Forming Department, National University of Science and Technology MISIS, 119049 Moscow, Russia
*
Author to whom correspondence should be addressed.
Metals 2020, 10(12), 1697; https://doi.org/10.3390/met10121697
Submission received: 6 November 2020 / Revised: 4 December 2020 / Accepted: 14 December 2020 / Published: 21 December 2020
(This article belongs to the Special Issue Shape Memory Alloys 2020)

Abstract

:
This study focuses on the control of density and grain structure of a superelastic Ti-18Zr-14Nb (at. %) alloy subjected to laser powder bed fusion. It starts with the production and characterization of a Ti-18Zr-14Nb powder feedstock and printing of a series of calibration specimens. These specimens are next subjected to chemical, structural, phase and texture analyses in order to collect experimental data needed to build simulation-driven processing maps in the laser energy density–material build rate coordinates. The results of this study prove that, once calibrated, the simulation-driven processing maps can be used to relate the main LPBF parameters (laser power, scanning speed, hatching distance and layer thickness) to the density and grain structure of the printed material, and the process productivity (build rate). Even though this demonstration is made for a specific material–system combination (TiNbZr & TruPrint 1000), such a process mapping is feasible for any material–system combination and can, therefore, be exploited for the process optimization purposes and for manufacturing of functionally graded materials or parts with intentionally seeded porosity.

1. Introduction

Over the past decade, additive manufacturing came out on top when selecting a manufacturing technique capable of producing metallic parts with complex geometry [1]. This technology allows an easy scaling from a prototype to a mass-customized product, which is frequently needed in the field of biomedical implants [1,2,3]. Additive manufacturing is especially suited for the manufacture of porous (cellular or lattice) structures, which offer a unique possibility of expanding the effective range of functional properties attainable with convectional materials. Several manufacturing techniques could be used to produce lattice structure with controlled pore and strut/wall size, shape, orientation and distribution, including the creation of hierarchical and functionally graded lattice structures [4]. Among them, laser powder bed fusion (LPBF) offers the best-in-class control of geometric attributes and mechanical properties of such structures made of a multitude of metal and metallic alloys. In this process, a high-power laser follows a certain path, determined by a selected laser scanning strategy and a numerical model of the part, to consolidate the part by fusing powder particles layer-by-layer [5].
Shape memory alloys (SMAs) provide additional functionality to common materials, such as the superelasticity and shape memory effects. For example, in medicine, porous superelastic implants can reduce the risk of complications associated with their integration into the implantation site [6], and such materials can be 3D printed and morph over time under the influence of thermal, mechanical or other external stimuli (4D printing [7]). In terms of their functional characteristics, titanium nickelide (Ti-Ni) SMAs are unsurpassed (recoverable strains of up to 10% and recovery stress of up to 1200 MPa), but they contain ~50% of nickel, which makes the release of this toxic metal into the human body a possibility [8].
In this context, the best candidates for long-term biomedical applications are metastable β nickel-free Ti alloys, such as Ti-Nb-(Zr, Ta or Mo) [9,10,11,12]. They can manifest either temperature- or stress-induced reversible thermoelastic βα″ transformations, with the former being responsible for the shape memory effect, while the latter mimicking a low-stiffness plateau-like superelastic behavior of biological tissues [8,9]. The results of a background research confirm the possibility of producing these alloys with relatively high recovery stresses (600–700 MPa) and recoverable strains (6–7%), but without the toxic nickel [12].
Among numerous metastable Ti alloys, Ti-18Zr-14Nb (in at. %) represents one of the best candidates for biomedical implants because it fulfills the following four criteria: (a) biocompatibility of all constitutive elements, (b) recoverable strain at body temperature (superelasticity) comparable to that of the reference Ti-Ni SMA, (c) mechanical properties comparable to those of the commonly used α + β Ti-6Al-4V alloy and (d) Young’s modulus close to that of cortical bone [9].
It appears evident that new opportunities for the development of high-performance biomedical implants could be envisaged by synergistically combining the exceptional functional properties of superelastic nickel-free Ti alloys with the design flexibility offered by additive manufacturing. It should, however, be noted that the functional properties of SMAs (temperature range of martensitic transformation, recoverable strains and recovery stresses) are much more structural and, therefore, processing-dependent than the mechanical properties of common materials [13,14]. For example, increasing laser energy density of the LPBF process may result not only in higher impurity content but also in the evaporation of certain alloy elements [7], which makes the control of the SMA transformation temperature range difficult. Another difficulty related to the use of LPBF arises from processing-induced porosity. The latter is frequently due to suboptimal technological conditions of laser fusion and a limited quality of raw materials (presence of inclusions and inadequate powder particle size distribution and morphology). The problem of residual porosity can be attenuated by subsequent hot isostatic pressing, but this approach is not without drawbacks, such as undesirable structure coarsening, for example [15]. Other processing-induced flaws, such as cracks, microstructural heterogeneity and segregation, could also impact the service properties of printed components and must, therefore, be thoroughly controlled [16].
It is also known that the as-built density and microstructure of printed components may be controlled by selecting a right combination of LPBF processing parameters, such as laser power, scanning speed, hatching distance and layer thickness. To produce components with a controlled density, grain structure, phase state and texture, the processing–structure interaction must be studied for each new powdered material, and this task is almost impossible to complete without numerical simulations [17,18]. In this context, a simplified numerical algorithm allowing rapid melt pool simulations for thousands of printing conditions was developed and experimentally validated for Fe, AlSiMg, IN625, Ti64 and 316L alloys. It was then successfully applied to control the processing-induced porosity [19,20,21] and the grain structure [22] of the selected alloys.
The above combination of the melt pool modeling and the design of experiment approach has also been applied to the Ti-18Zr-14Nb superelastic alloy, but without a specific focus on the grain structure of printed components [23]. To begin filling this gap, this study starts with the characterization of a Ti-18Zr-14Nb powder feedstock. Next, a processing window for the selected LPBF system is defined, and calibration specimens are printed using different sets of laser powder fusion parameters, strategically distributed within the limits of the processing window. Furthermore, the printed specimens are subjected to chemical, structure, phase and texture analyses. Finally, all the experimental data obtained are employed to build the density and the grain structure processing maps using a proprietary simulation-driven algorithm.

2. Methodology

2.1. LPBF Process Calibration Experiment

In this study, a TruPrint 1000 (TRUMF GmbH, Ditzingen, Germany) laser powder bed fusion system equipped with a 200 W ytterbium fiber laser (spot diameter of 30 μm) was used. As a first step, the processing window was delimited by varying the main processing parameters of this printing system within their operational borders: the laser power from 40 to 200 W, the laser speed from 200 to 4000 mm/s and the hatching space from 60 to 200 μm, while keeping a constant layer thickness of 30 μm. This processing window was built using the energy density (E)–build rate (BR) coordinates, as shown in Figure 1:
E ( J / m m 3 ) = P v × h × t   ;   B R ( c m 3 / h ) = v × h × t
where p (W) is the laser power, v (m/s) is the laser speed, h (µm) is the hatching space and t (µm) is the layer thickness.
Next, within the limits of this E–BR window, the processing conditions for fourteen (14) calibration specimens were determined (see Table 1). These specimens were regrouped into two sets. The main idea behind the use of the two sets of specimens was to cover the entire process window as widely as possible with the smallest number of specimens to be printed and analyzed. With this objective in mind, the first set, Specimens 1 to 4, was designed to first guess the conditions leading to the printing of a fully dense Ti-18Zr-14Nb alloy. This set was established by keeping the laser energy density in the process midrange of 73 ± 5 J/mm3, while varying the build rate from 3.2 to 9.2 cm3/h. The second specimen set, Specimens 5 to 14, was designed to explore the influence of LPBF processing conditions on the main subjects of this study: the density and the grain structure of printed material. This set was established by varying both the laser energy density (25–110 J/mm3) and the build rate (18.7–4.3 cm3/h) as widely as possible, while keeping the laser power constant (130 W).

2.2. Powder Production and Analysis

To obtain the powder feedstock used in this study, a 50 mm-diameter, 600 mm-long Ti-18Zr-14Nb alloy ingot supplied by Flowserve Corp. Comp (Irving, TX, USA) was gas-atomized by TLS Technik GmbH (Bitterfeld-Wolfen, Germany). The particle size distribution was measured using a Shimadzu SALD 7500 nano (Shimadzu Corp., Kyoto, Japan) laser scattering particle size analyzer. The powder morphology was qualified using a TESCAN VEGA LMH scanning electron microscope (TESCAN, Brno, Czech Republic).

2.3. LPBF Printing and Analyses of Printed Specimens

Fourteen 10 × 10 × 10 mm cubic specimens were printed and contoured (Figure 2a,c). The entire print field was divided into 4 × 4 mm squares. Each square was successively filled with tracks in 60/110 μm increments. To reduce distortions, a 90° hatch rotation scanning strategy between two successively built layers was adopted (Figure 2b).
After printing, the as-built cubic specimens were cut from the platform and subjected to the following analyses: chemical composition, density, phases, grain structure and crystallographic texture. The chemical composition of major elements in the powder and the printed specimens was measured using a TESCAN VEGA LMH scanning electron microscope (TESCAN, Brno, Czech Republic) equipped with an energy-dispersive X-ray microanalyzer (XCITE, Oxford Instruments, Abingdon-on-Thames, Royaume-Uni). The oxygen and nitrogen contents were controlled using a LECO TC600 analyzer. The density of the printed specimens was measured using Archimedes’s technique (ASTM B962) and presented in percentage to the Ti-18Zr-14Nb alloy bulk density (5.66 g/mm3).
Samples for the phase and structural analyses were cut from the printed specimens. The cross-sectional surfaces of the samples were prepared using an ATM Saphir 560 grinding/polishing machine (ATM GmbH, Mammelzen, Germany). Grinding (2 min, 10 N) was carried out on SiC paper with a grain size of 320–600–1200–2400 mesh. Polishing (20 min, 30 N) was realized using Eposil F suspensions (silicon oxide with a particle size of 0.1 μm) deposited on an ATM Iota cloth. During the polishing process, ammonia, hydrogen peroxide, liquid soap and diamond lubricant were added to improve the surface quality. Samples for the X-ray diffractometry analysis (XRD) and optical and scanning electron microscopy were polished mechanically and then etched in 1HF:3HNO3:6H2O solution to remove a damaged surface layer.
To study structural defects in the printed specimens, a Union Versamet-2 optical microscope equipped with a Nikon D90 camera (Nikon, Tokyo, Japan) was used, whereas an Ultima IV Rigaku diffractometer (monochromatic CuKα-radiation; 2θ ranges from 30 to 90 deg) was employed to study their phase state. To study a grain structure and texture, a TESCAN VEGA LMH scanning electron microscope (SEM) equipped with an electron backscatter diffraction (EBSD) unit was used. The texture evolution was characterized using Oxford Instruments’ AZtec EBSD software (Oxford Instruments, Abingdon-on-Thames, Royaume-Uni) by tilting the samples by 70° and scanning them at 20 kV with a 2 μm step. The average grain size was measured from the EBSD images using a standard linear intercept procedure [24]. The measurements were performed on the vertical (parallel to the build direction, dxz) and horizontal (perpendicular to the build direction, dxy) faces of the specimens, and the grain aspect ratio GAR = dxz/dxy was calculated.

2.4. Printed Density and Grain Structure Processing Maps

The experimental results relating to the density and grain structure of printed specimens were used to build the density, the grain size and the grain aspect ratio processing maps for a TruPrint 1000 LPBF system. To this end, a combined melt pool model and experimental design was applied (see details in [20,22]). In this approach, LPBF melt pool temperature field calculations were carried out using the analytical model (École de technologie supérieure, Montreal, Canada) of a semi-infinite solid with a moving Gaussian heat source [25]. This model has been successfully used for the density prediction in specimens manufactured from FeC [19], Ti-Zr-Nb [21], AlSiMg, IN625, Ti64 and 316L alloy powders [20]. The Gaussian model involves a symmetrical distribution of laser irradiance across the beam. The energy from the laser is assumed to be applied on the powder bed surface for a time interval defined by the scanning speed and the laser spot size. The physical properties of a Ti-Zr-Nb alloy in the bulk and powdered form used to calculate the temperature distribution T(x, y, z) in the powder bed are collected in Table 2. The powder bed density (φ) was estimated based on the measurements reported in [23]. Finally, to establish the relationship between the LPBF processing parameters and the printed material density and grain structure, the correlation equations developed in [20,22] were used.

3. Results and Discussion

3.1. Powder Analysis

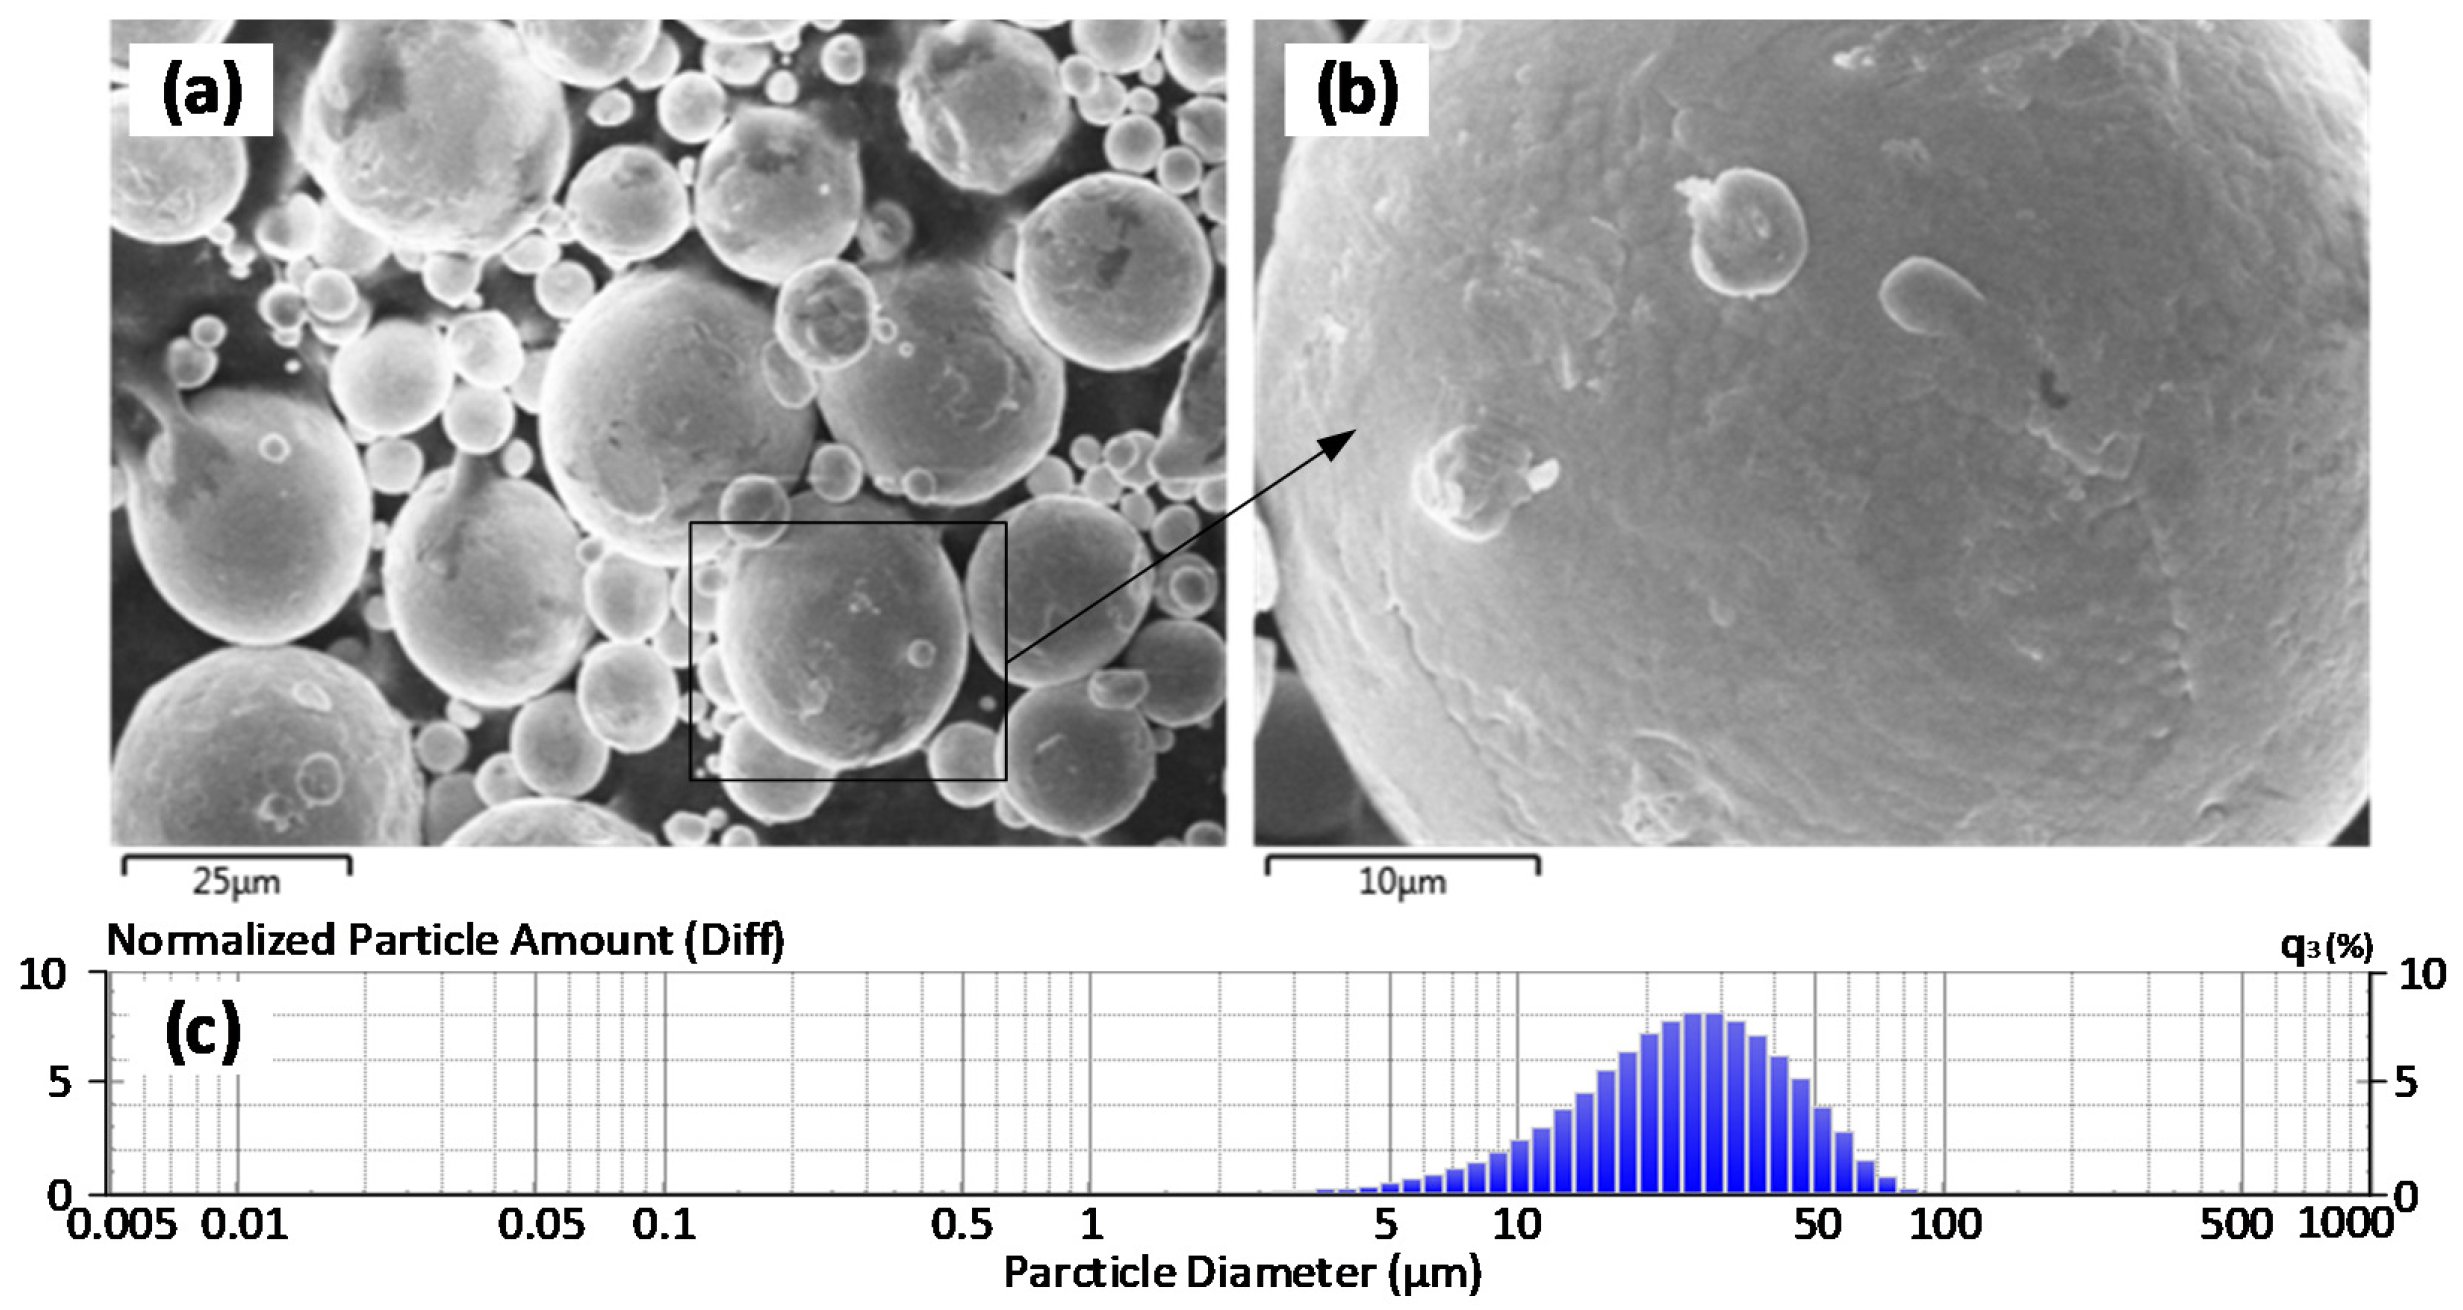
The particle size distribution (PSD) of the gas-atomized Ti-18Zr-14Nb powder is shown in Table 3 (d10 = 11 μm, d50 = 26 μm, d90 = 51 μm); the apparent powder density is 2.8 g/cm3 (ISO 3923-1:2008). The majority of the particles are under 25 μm in equivalent diameter and a large number of small particles are attached to large particles, thus forming satellites (Figure 3a). A fine solidification microstructure is observed in powder particles, and larger particles demonstrate a cellular microstructure with an average cell size of ∼1.5 μm (Figure 3b).

3.2. Analyses of Printed Specimens

3.2.1. Chemical Composition

The concentrations of the main and interstitial elements in the Ti-Zr-Nb powder and selected printed specimens (3, 4, 5, 14) are shown in Table 3. It can be seen that the printed specimens show lower titanium contents than the precursor powder, while the oxygen and nitrogen concentrations reveal the opposite trend. In Specimen 14, which is printed with the highest energy density of this study (E = 110 J/mm3), both phenomena are the most striking: almost a 3.0 at. % loss in titanium is accompanied by 0.025 and 0.012 (wt. %) gains in oxygen and nitrogen, respectively. When printing with higher energy densities, this combined effect could lead to a significant depression of the martensite start temperature.

3.2.2. Density

Figure 4 shows the relative density of the printed specimens as a function of the laser energy density. It can be observed that the laser energy density must be ranged between 40 and 70 J/mm3 to obtain a material density >99.5%. At lower and higher energy densities, the level of porosity increases (the numerical values of printed density are reported in Section 3.2.5). It should be noted that pores formed during low-energy printing are called the lack-of-fusion pores. These pores are filed with unmelted powder particles, generally follow the laser scan tracks and are more critical from a mechanical resistance viewpoint, as compared to uniformly distributed high energy-printed pores filled with gas [26]. Note also that the 40–70 J/mm3 energy density range corresponds to many specimens of this study, thus primarily reflecting the robustness of the LPBF process to produce dense components. Secondly, this indicates the opportunity for the optimization of the process not only in terms of printed density, but also considering other criteria, such as material isotropy and process productivity, for example, as it will be shown later.

3.2.3. Phases

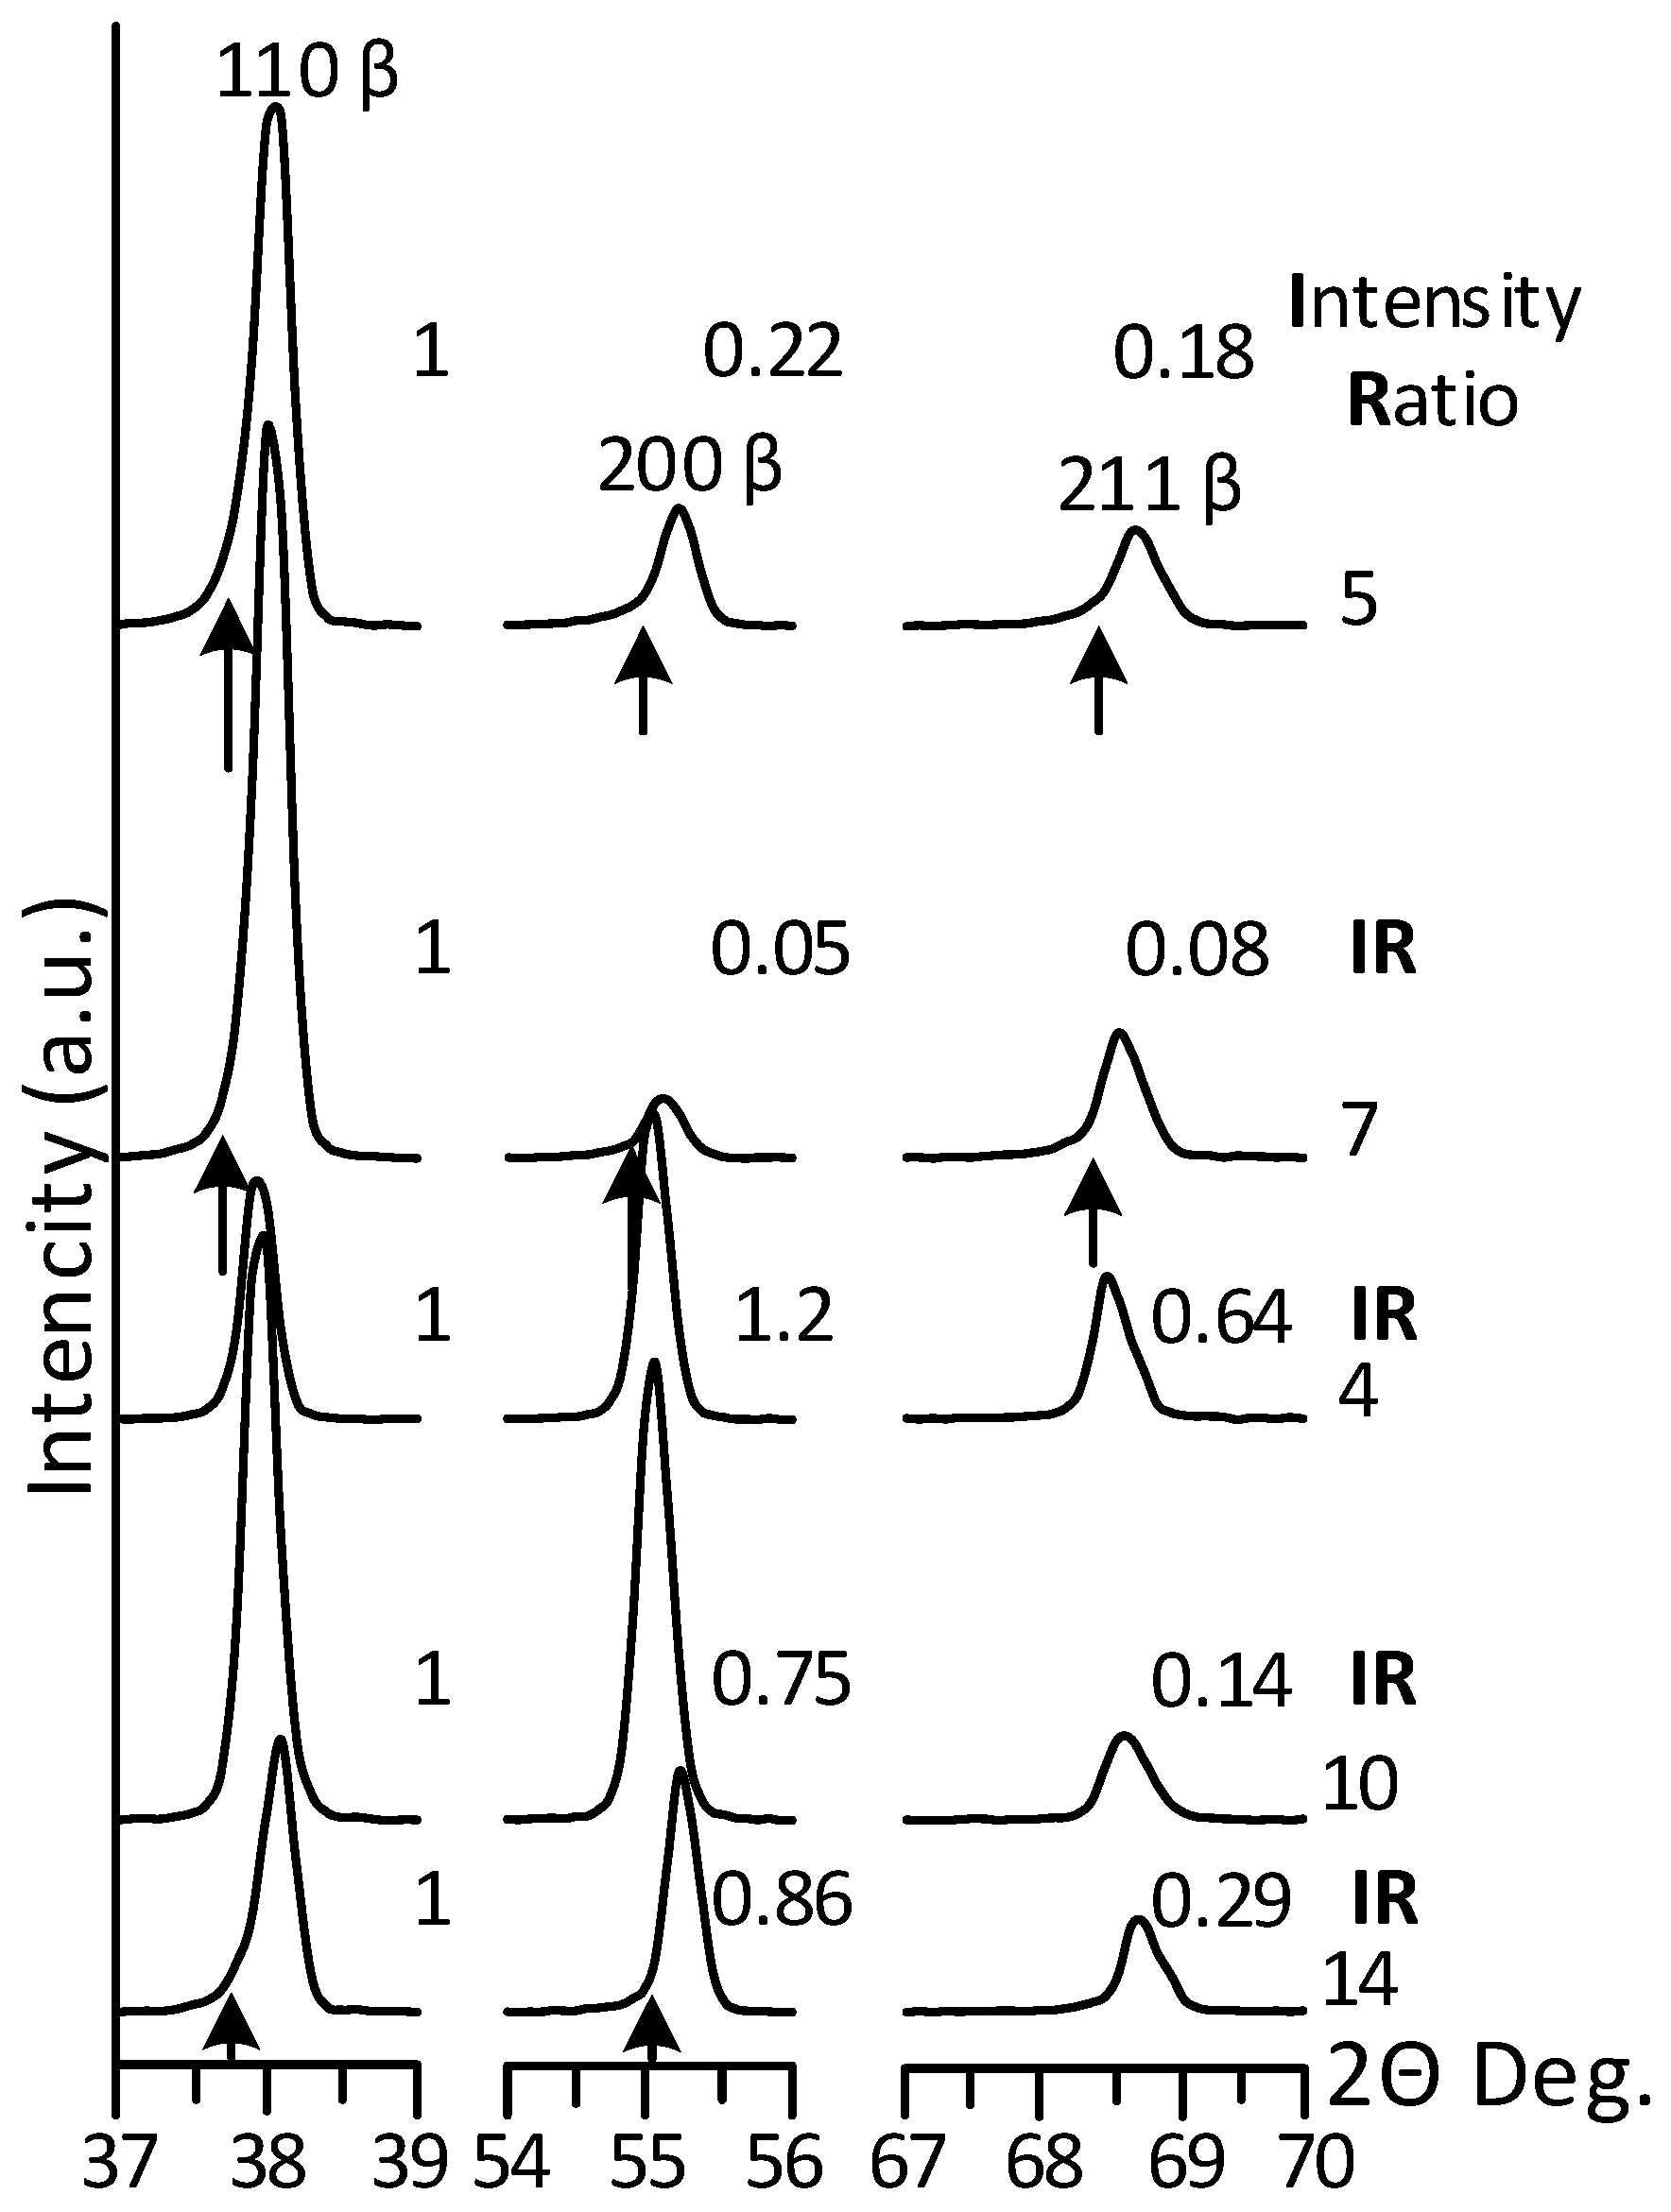
X-ray diffractograms of five selected specimens printed with different sets of processing parameters (4, 5, 7, 10 and 14) are shown in Figure 5. These specimens are separated into two groups with the first group (Specimens 4 and 10) printed with close levels of energy density, but different build rates, and the second group (Specimens 5, 7 and 14) printed with gradually increasing energy densities. An analysis of the diffraction patterns shows that the main phase component in all the specimens is β-phase; no additional peaks that could be attributed to any other phase are observed. The lattice parameters of β-phase calculated using the extrapolation method [27] do not significantly differ from each other (Table 4). Their average value of 0.3348 ± 0.0003 nm is, however, somewhat larger than that for the same alloy subjected to conventional processing, 0.3343 ± 0.0002 nm [28]. This discrepancy appears to be a consequence of the Zr- and Nb-enrichment of solid solution during processing (see Table 3). The second explanation is a high level of oriented residual stresses of the dislocation substructure generated during solidification of printed specimens [29].
The peak intensity ratio of Specimen 7 is typical for a state close to isotropic: very strong {110}, weak {200} and medium-strong {211} (Figure 5 and Table 4). The peak intensity ratios in Specimens 4, 10, 14 are typical for a state with a strong texture (in this case, the {100} plane is oriented mainly parallel to the irradiated surface, producing abnormally weak {110} and abnormally strong {200} peaks), or/and large grains. There are also signs of solid solution inhomogeneity, which is manifested by a slight extension of the left side of the peak soles towards smaller 2θ angles (indicated by arrows in Figure 5). Distortions of the X-ray lines are probably caused by the existence of Zr- and or Nb-enriched zones (solid solution separation phenomenon), which are more pronounced in Specimens 5 and 7, printed with lower energy densities and higher build rates [23].

3.2.4. Microstructure and Crystallographic Texture

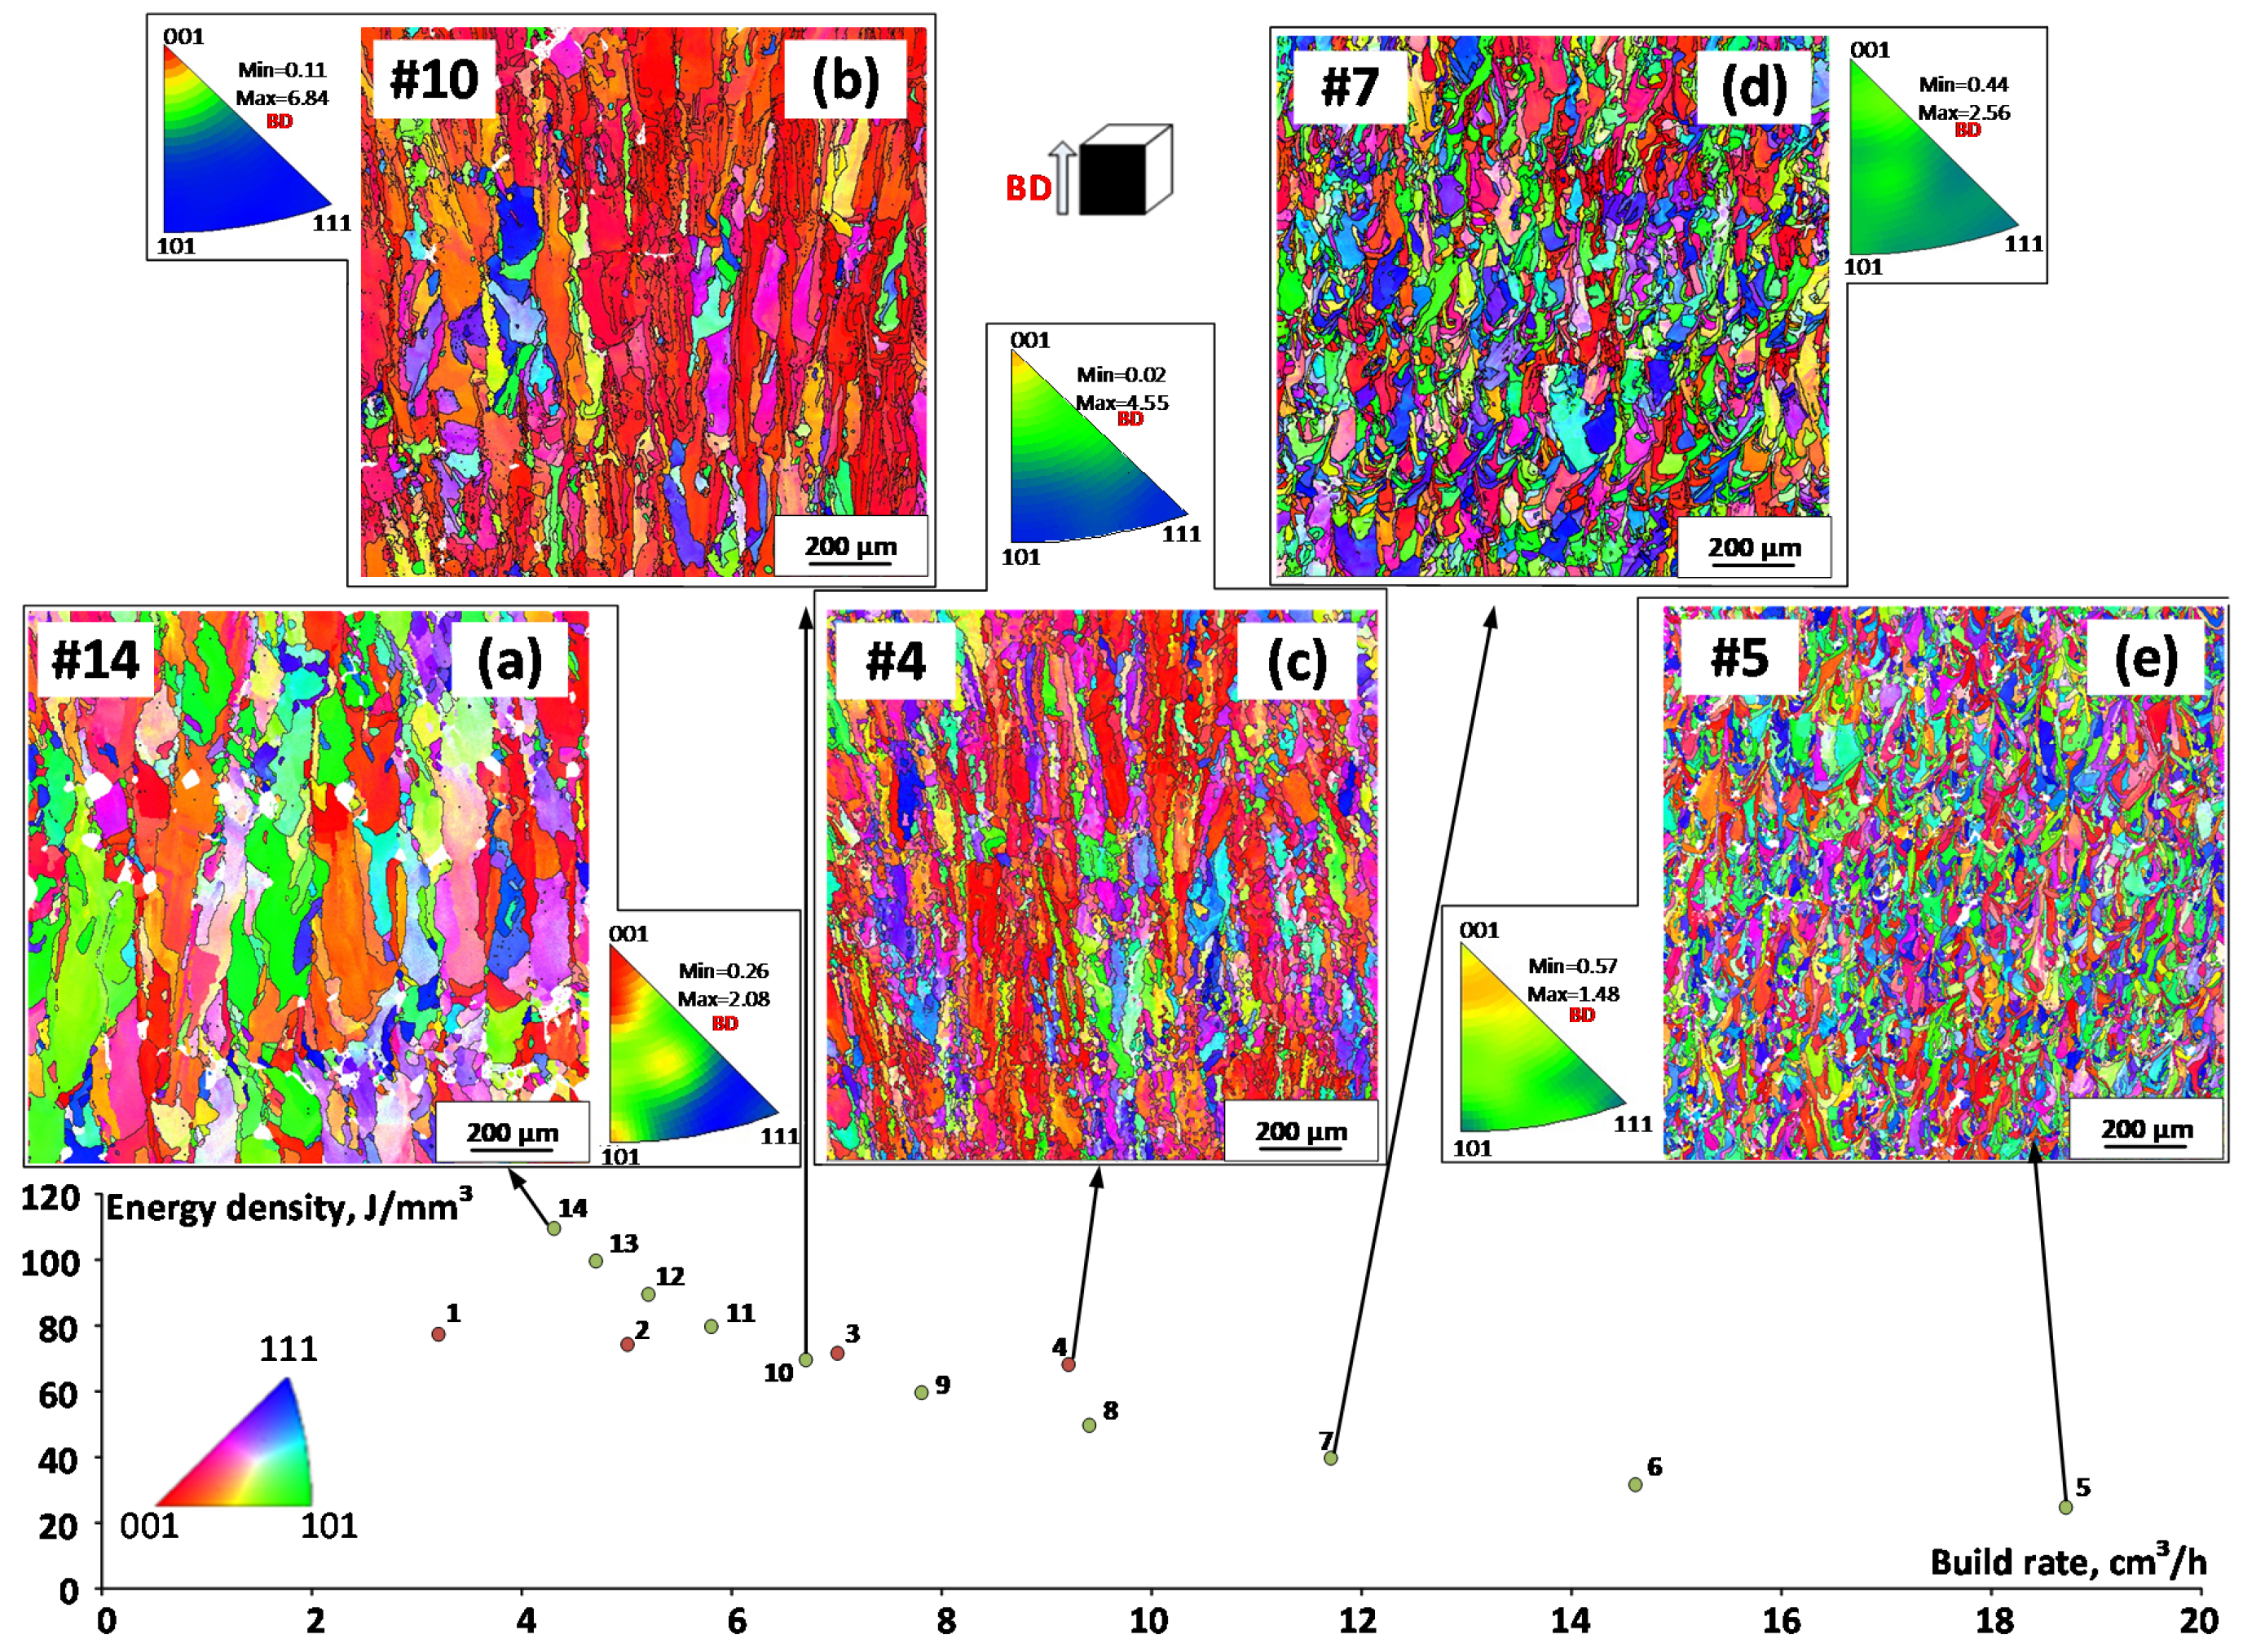
EBSD analysis is performed for the same five specimens as those used for the XRD analysis: 4, 5, 7, 10 and 14. The microstructure of the selected samples in the E–BR coordinates is presented in Figure 6, where black lines correspond to high angle boundaries, i.e., angles >15°. The results of the grain structure analysis, including the grain size in the vertical and horizontal planes, the grain aspect ratio and the maximum texture intensity, are presented in decreasing power density order in Table 5. In can be seen that, overall, the lower the energy density and the greater the build rate, the finer and the more equiaxed the microstructure (see Figure 6 and Table 6).
Overall, the higher the laser energy density, the coarser and the more elongated the grain structure; conversely, the lower the laser energy density, the finer and the more equiaxed the grain structure. However, the grain structures of Specimens 10 and 4, printed with similar energy densities (E = 70 and 68.5 J/mm3, respectively), but different build rates (BR = 6.7 and 9.2 cm3/h, respectively), are not identical: Specimen 4, printed with a higher build rate, shows a significantly finer grain structure than Specimen 10, built with a lower build rate: dxz = 97 ± 7 µm for the first, as compared to dxz = 151 ± 7 µm, for the second. These observations are supported by similar ones found in [30] and are explained by the fact that for a given laser energy density, the greater the build rate, the smaller the melt pool, the higher the cooling rate, and therefore, the finer the microstructure. The inverse pole figures of the as-built specimens are also presented in Figure 6. Overall, the lower the energy density, the higher the build rate, and the less textured the material, which is manifested by a decreasing <100>||BD direction texture intensity from 6.84, for Specimen 10, to 1.48, for Specimen 5.
An apparent exception is Specimen 14, printed with the highest energy density and the lowest build rate and containing the highest level of porosity among all the specimens of this study, ~2%. This specimen manifests a moderately elongated grain aspect ratio of 2.88 and a relatively low texture intensity of 2.08. The reason for this discrepancy for Specimen 14 stems from a significant amount of small equiaxed grains surrounding pores and shifting the average grain aspect ratio to lower values. A similar bimodal grain size distribution in highly porous printed specimens was also observed in [31].

3.2.5. Porosity, Grain Size and Grain Aspect Ratio Processing Maps

Exploiting the obtained experimental results, the density and grain structure processing maps are built using a simulation-driven approach described in [19,21,22] (see Figure 7). These maps demonstrate that the laser energy density and the build rate must range from 50 to 75 J/mm3 and from 3 to 10 cm3/h (Figure 7a), respectively, to print parts with the highest possible material density. Moreover, both the grain size and the grain aspect ratio decrease when the build rate increases and the laser energy density decreases (Figure 7b,c). The discrepancies between the experimentally measured and the numerically predicted densities, grain sizes and grain aspect ratios are calculated and collected in Table 6, and they do not exceed 2% for the printed density, 15% for the grain size and 3% for the grain aspect ratio (excluding Specimen 14). As a matter of fact, Specimen 14 manifests a bimodal grain size distribution as mentioned previously, which cannot be predicted by the model developed in the framework of this study.
Maps presented in Figure 7 can therefore be used to control the grain size and the grain aspect ratio of specimens printing on TruPrint 1000 LPBF systems from Ti-Zr-Nb powders. It is important to note that in order to simplify the representation, the maps shown in Figure 7 have only been plotted for a hatching space of 110 µm, which corresponds to Specimens 5 to 14 (the position of Specimen 14 is shown on the density map only, see previous explanations). The same methodology can be used to plot processing maps for other values of hatching space.

4. Discussion

The processing maps built using the experimental results of this study allow the selection of LPBF processing parameters with different objectives in mind. For example, the capacity of printing components with a controlled level of porosity could be used to build a database containing information on how the processing-induced porosity impacts the mechanical properties of printed components. This database could in turn serve for the quality control of printed components [31]. Moreover, the capacity to control the grain size and the grain aspect ratio could be used to obtain an appropriate balance between the structure features of printed components and the process productivity. Note, however, that these processing maps are only valid for the powder and the LPBF system of this study. If the same powder must be used with another LPBF system, these maps must be adjusted by printing a series of calibration specimens similar to those printed in this study. The reasons for this could be divided into two groups: the first, considering the powder spreading conditions, and the second, considering the laser printing conditions. Since each LPBF system is equipped with a specific powder spreading mechanism (roller, blade, etc.), the powder bed density and uniformity would differ, which in turn would inevitably influence the amount of laser energy absorbed by the powder and, therefore, the printing outcome. Moreover, the laser exposure and heat exchange conditions would also be different and dependent on the laser power and laser focus diameter, the build chamber geometry, the building plate temperature, the protective gas flow conditions, etc. Globally, more than 130 parameters would influence the printing outcome [32].
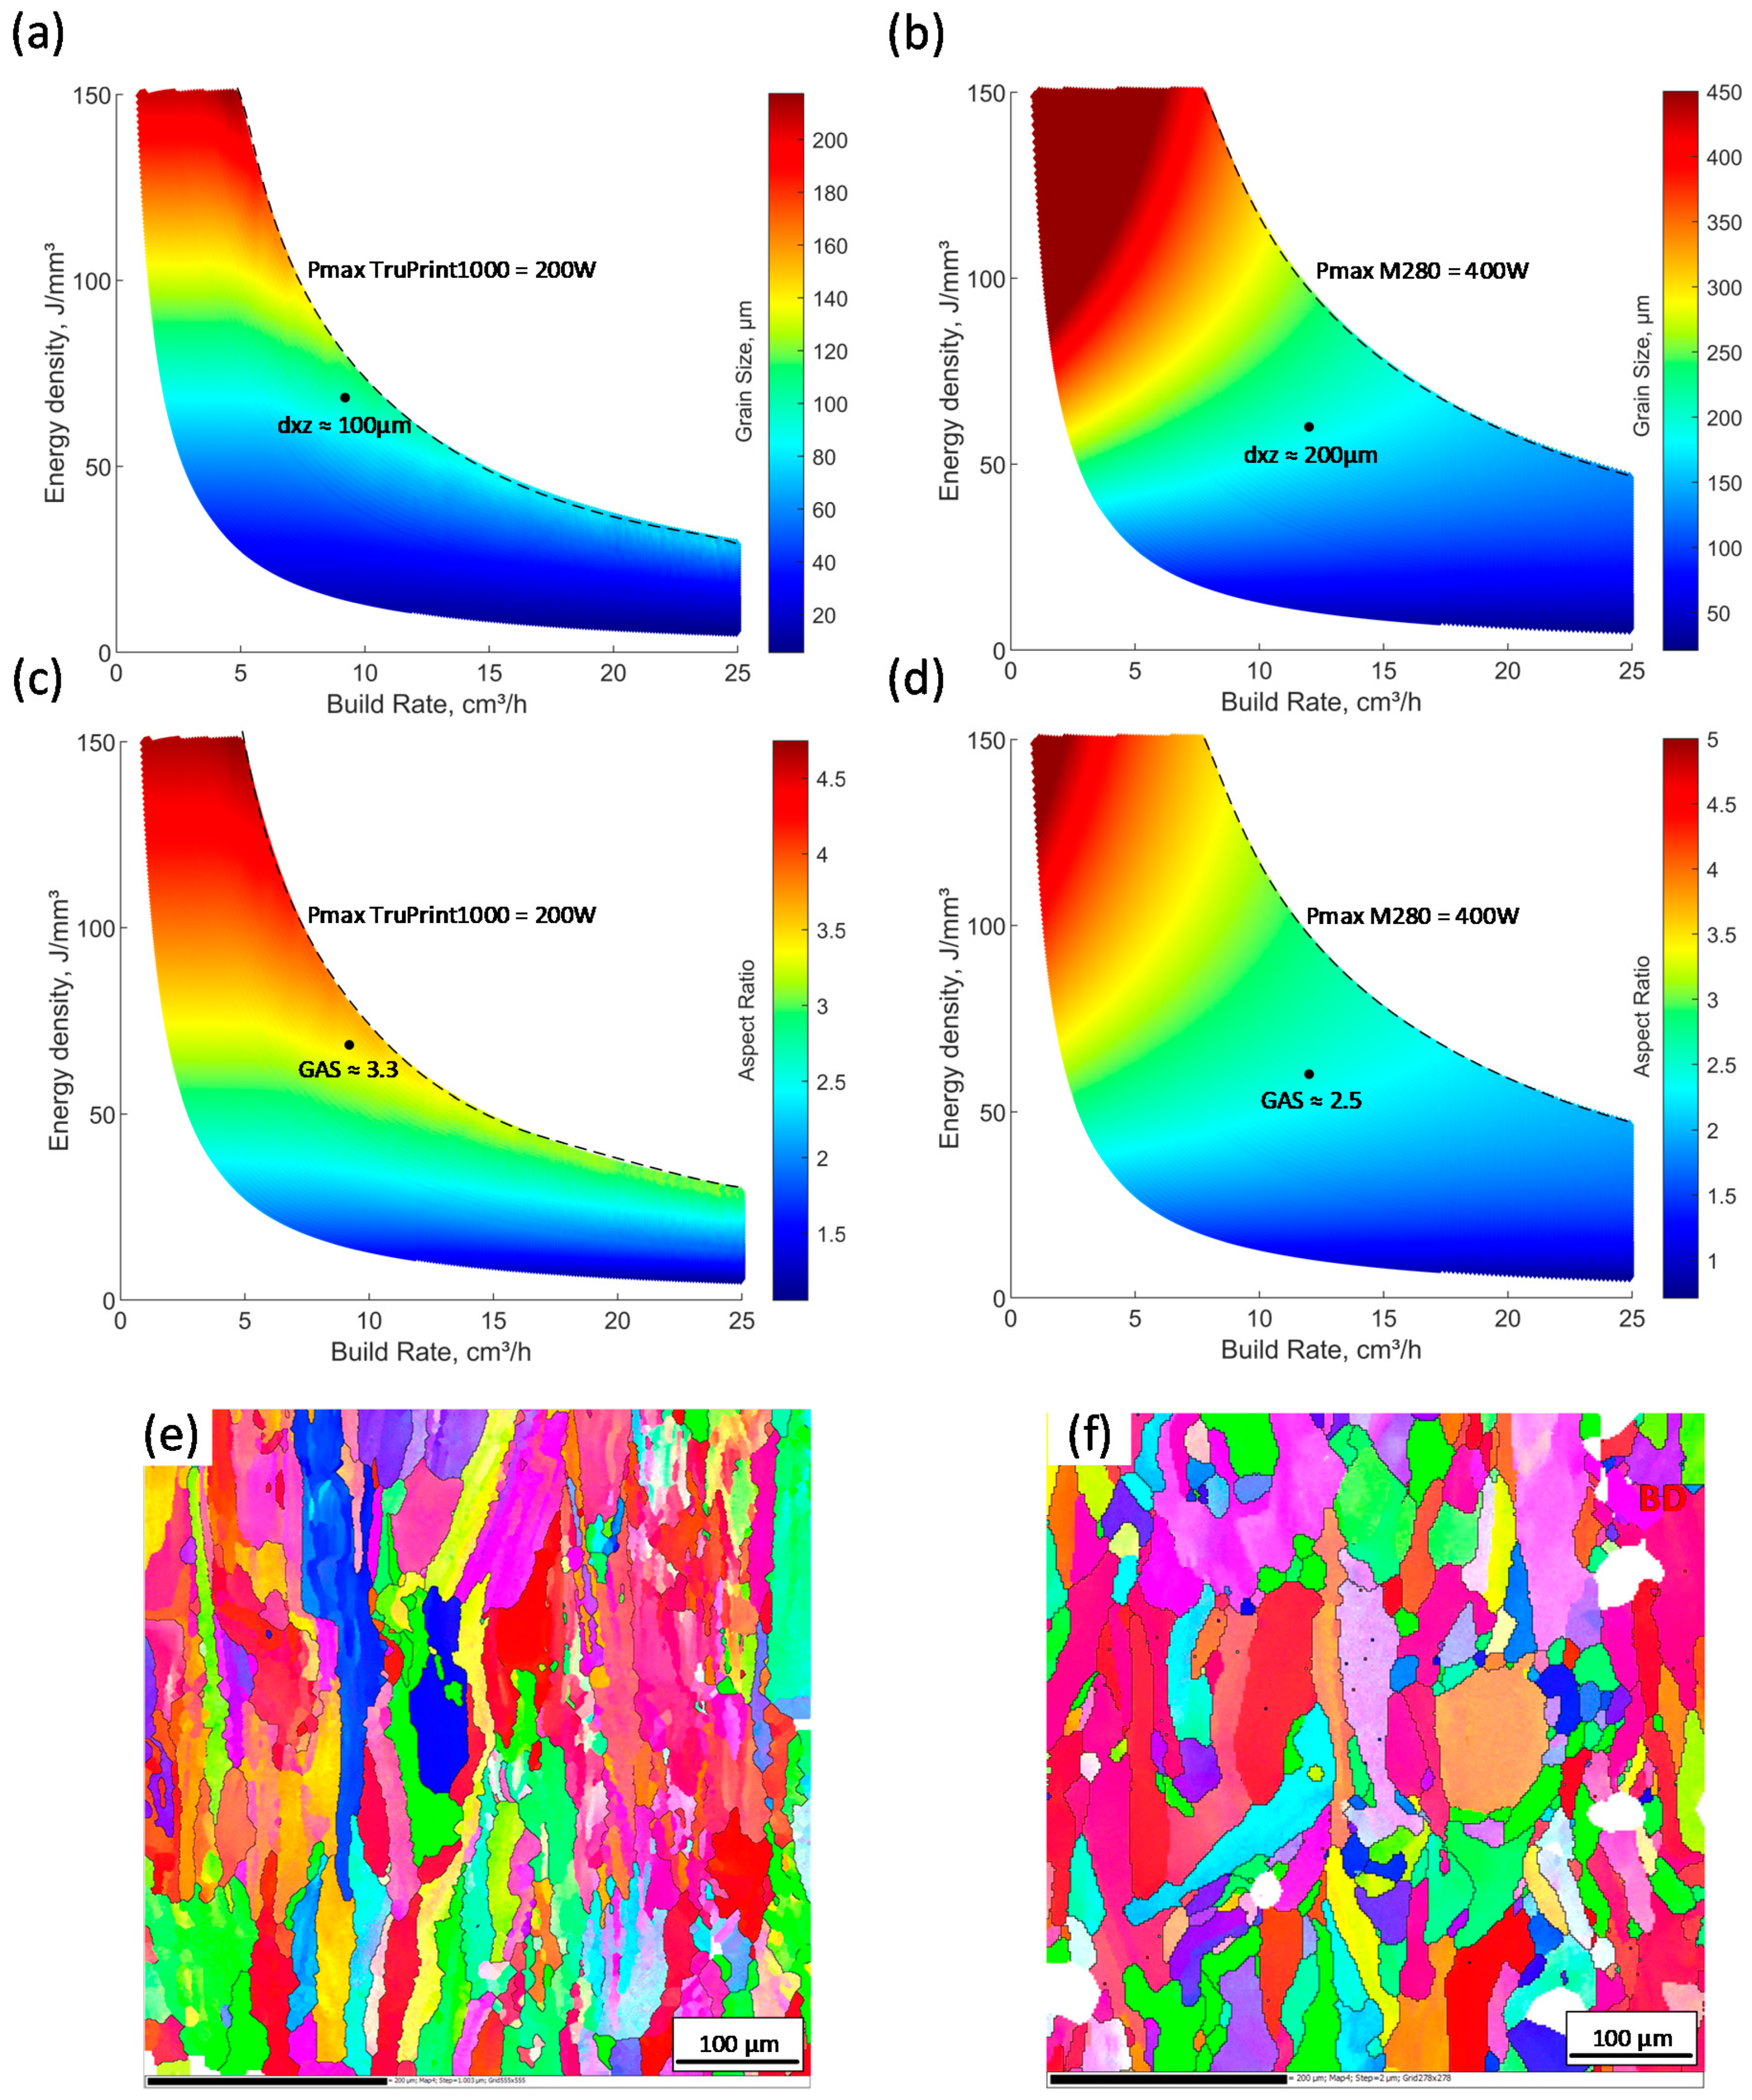
To support this point, consider the same Ti-Zr-Nb powder but two different LPBF systems: a TruPrint 1000 of this study and an EOS M280 from our preceding work [21]. The grain size and grain aspect ratio processing maps for these systems are compared in Figure 8a,c and Figure 8b,d, respectively. It can be seen that the higher the maximum laser power of a system, the larger the available processing window. Next, when comparing the grain structures of specimens printed with these two systems using similar printing conditions (TruPrint 1000 with E = 68.5 J/mm3 and BR = 9.2 cm3/h, and M280 with E = 60 J/mm3 and BR = 12 cm3/h), the first printing results in a grain structure that is significantly finer, while more elongated, than the second printing can be observed: TruPrint 1000 with dxz     100 µm and GAR     3.3 as compared to M280 with dxz     200 µm and GAR     2.5 (Figure 8a–d). These discrepancies could, at least partially, be explained by the differences in the laser exposure conditions: a smaller laser focus diameter (∅50 µm) in the first system as compared to a larger laser focus diameter (∅100 µm) in the second system results in smaller melt pools, higher cooling rates and finer grain structures. This difference is definitely not the only one that impacts the printing outcome, but since it is virtually impossible to numerically simulate all the discrepancies between different LPBF systems, experimental calibration of a specific system represents the only viable solution. However, once calibrated, simulation-driven processing maps of this study can be generated for any material–system combination and can be exploited for the process optimization purposes and can also be used to manufacture functionally graded materials [33] or parts with intentionally seeded porosity [15,34].
Finally, the recent development of AI looks to be a promising solution for many modeling issues faced in additive manufacturing. Although the use of this approach is currently limited to in-process tuning of the processing parameters [35], it could eventually be able to solve such multiprinter/multipowder modeling issues.
It must also be mentioned that the as-printed Ti-Zr-Nb alloy cannot be used without postprocessing treatment. In addition to a stress relief thermal treatment commonly applied to all LPBF parts to prevent their distortions during removal from the build plate, structural conditions promoting thermoelastic phase transformation must be created by subjecting printed specimens to a specific thermal treatment. The latter is necessary to allow benefiting from the functional properties of shape memory and superelasticity of these materials. It is known that for conventional mechanically deformed metastable near-beta Ti-based alloys, this thermal treatment involves 30–60 min annealing in the 450–550 °C temperature range, followed by rapid cooling [35]. However, since the thermal histories of deformed alloys and their laser powder bed-fused equivalents differ, the influence of postprocessing thermal treatments on the structure and properties of printed specimens must be studied and optimized accordingly. This last issue is actually under investigation.

5. Conclusions

  • When the laser powder bed fusion parameters of Ti-Zr-Nb alloy powders vary within the operational borders of TruPrint 1000 systems: the laser power from 40 to 200 W, the laser speed from 200 to 4000 mm/s, the hatching space from 60 to 200 μm, while keeping a constant layer thickness of 30 μm; the higher the laser power density, the lower the titanium and the higher the oxygen and nitrogen contents in the alloy: up to 3.0 at. % loss in titanium and 0.025 and 0.012 (wt.%) gains in oxygen and nitrogen, as compared to the precursor powder.
  • A printed density greater than 99.5% is obtained for specimens printed within the 25 to 110 J/mm3 laser densities and the 3.2 to 18.7 cm3/h build rates.
  • The phase state in all the specimens is parent β-phase, with the lattice parameter slightly larger than that of the conventionally processed alloys; this phenomenon is mainly caused by the enrichment of solid solution in Zr and Nb.
  • The lower the laser density energy and the greater the build rate, the finer and the more equiaxed the grain structure of printed specimens, and the less textured the material. In this study, dxz grain size varies from 200 to 50 μm and the grain aspect ratio varies from 4 to 2.
  • Using the experimental data obtained and the dedicated processing simulation algorithm, the density and the grain structure processing maps were built. Discrepancies between the experimentally measured and numerically calculated values do not exceed 2% for the printed density, 15% for the grain size and 11% for the grain aspect ratio.
  • The Ti-Zr-Nb alloy density, grain size and grain aspect ratio processing maps of this study can be used to control the structure of printed specimens and the process productivity, when using a TruPrint 1000 LPBF systems.

Author Contributions

V.B.: project conceptualization, results interpretation, manuscript preparation and editing; V.K.: optical microscopy and data treatment; M.L.: process modeling/calibration and manuscript preparation; K.L.: specimen manufacturing; V.S.: specimen manufacturing, results interpretation and manuscript preparation; S.P.: XRD analysis, results interpretation and editing. All authors have read and agreed to the published version of the manuscript.

Funding

CONMET LLC (Russian Federation). Natural Science and Engineering Research Council of Canada. Russian Science Foundation (project № 20-79-00299).

Acknowledgments

The authors express their gratitude to A. Konopatsky for assistance in chemical analyses and A. Kreitcberg for useful discussions.

Conflicts of Interest

The authors declare that there is no conflict of interest.

References

  1. Zafar, M.Q.; Zhao, H. 4D Printing: Future Insight in Additive Manufacturing. Met. Mater. Int. 2019, 26, 564–585. [Google Scholar] [CrossRef]
  2. Murr, L.E.; Gaytan, S.M.; Medina, F.; Lopez, H.; Martinez, E.; Machado, B.I.; Hernandez, D.H.; Martinez, L.; Lopez, M.I.; Wicker, R.B.; et al. Next-generation biomedical implants using additive manufacturing of complex, cellular and functional mesh arrays. Philos. Trans. R. Soc. A Math. Phys. Eng. Sci. 1917, 368, 2000–2032. [Google Scholar] [CrossRef] [PubMed] [Green Version]
  3. Bobbert, F.S.L.; Lietaert, K.; Eftekhari, A.A.; Pouran, B.; Ahmadi, S.M. Additively manufactured metallic porous biomaterials based on minimal surfaces: A unique combination of topological, mechanical, and mass transport properties. Acta Biomater. 2017, 53, 572–584. [Google Scholar] [CrossRef] [PubMed] [Green Version]
  4. Metal Foams: Fundamentals and Applications; Dukhan, N. (Ed.) DEStech Publications: Lancaster, PA, USA, 2013; 423p. [Google Scholar]
  5. Sun, S.; Brandt, M.; Easton, M. Powder Bed Fusion Processes: An Overview; Elsevier: Amsterdam, The Netherlands, 2017; pp. 55–77. [Google Scholar]
  6. Dadbakhsh, S.; Speirs, M.; Van Humbeeck, J.; Kruth, J.-P. Laser additive manufacturing of bulk and porous shape-memory NiTi alloys: From processes to potential biomedical applications. MRS Bull. 2016, 41, 765–774. [Google Scholar] [CrossRef] [Green Version]
  7. Ma, J.; Franco, B.; Tapia, G.; Karayagiz, K.; Johnson, L.; Liu, J. Spatial Control of Functional Response in 4D-Printed Active Metallic Structures. Sci. Rep. 2017, 7, 46707. [Google Scholar] [CrossRef]
  8. Yoneyama, T.; Miyazaki, S. SMA for Biomedical Applications; Woodhead: Cambridge, UK, 2008; p. 352. [Google Scholar]
  9. Miyazaki, S.; Kim, H.; Hosoda, H. Development and characterization of Ni-free Ti-base shape memory and superelastic alloys. Mater. Sci. Eng. A 2006, 438, 18–24. [Google Scholar] [CrossRef]
  10. Kim, H.Y.; Ikehara, Y.; Kim, J.I.; Hosoda, H.; Miyazaki, S. Martensitic transformation, shape memory effect and superelasticity of Ti–Nb binary alloys. Acta Mater. 2006, 54, 2419–2429. [Google Scholar] [CrossRef]
  11. Li, S.; Cui, T.; Hao, Y.; Yang, R. Fatigue properties of a metastable β-type titanium alloy with reversible phase transformation. Acta Biomater. 2008, 4, 305–317. [Google Scholar] [CrossRef]
  12. Konopatsky, A.; Dubinskiy, S.; Zhukova, Y.; Sheremetyev, V.; Brailovski, V.; Prokoshkin, S.; Filonov, M. Ternary Ti-Zr-Nb and quaternary Ti-Zr-Nb-Ta shape memory alloys for biomedical applications: Structural features and cyclic mechanical properties. Mater. Sci. Eng. A 2017, 702, 301–311. [Google Scholar] [CrossRef]
  13. Kudryashova, A.; Sheremetyev, V.; Lukashevich, K.; Cheverikin, V.; Inaekyan, K.; Galkin, S.; Prokoshkin, S.; Brailovski, V. Effect of a combined thermomechanical treatment on the microstructure, texture and superelastic properties of Ti-18Zr-14Nb alloy for orthopedic implants. J. Alloy. Compd. 2020, 843, 156066. [Google Scholar] [CrossRef]
  14. Prokoshkin, S.; Brailovski, V.; Dubinskiy, S.; Zhukova, Y.; Sheremetyev, V.; Konopatsky, A.; Inaekyan, K. Manufacturing, structure control, and functional testing of Ti–Nb-based SMA for medical application. Shape Mem. Superelast. 2016, 2, 130–144. [Google Scholar] [CrossRef] [Green Version]
  15. Poulin, J.-R.; Kreitcberg, A.; Terriault, P.; Brailovski, V. Long fatigue crack propagation behavior of laser powder bed-fused inconel 625 with intentionally-seeded porosity. Int. J. Fatigue 2019, 127, 144–156. [Google Scholar] [CrossRef]
  16. Yang, C.; Zhang, Z.; Li, S.; Liu, Y.-J.; Sercombe, T.; Hou, W.; Zhang, P.; Zhu, Y.; Hao, Y.; Zhang, Z.; et al. Simultaneous improvement in strength and plasticity of Ti-24Nb-4Zr-8Sn manufactured by selective laser melting. Mater. Des. 2018, 157, 52–59. [Google Scholar] [CrossRef]
  17. Ghosh, S. Predictive modeling of solidification during laser additive manufacturing of nickel superalloys: Recent developments, future directions. Mater. Res. Express 2018, 5, 012001. [Google Scholar] [CrossRef] [Green Version]
  18. Ahmed, A.; Wahab, M.S.; Raus, A.A.; Kamarudin, K.; Bakhsh, Q.; Ali, D. Effects of Selective Laser Melting Parameters on Relative Density of AlSi10Mg. Int. J. Eng. Technol. 2016, 8, 2552–2557. [Google Scholar] [CrossRef] [Green Version]
  19. Letenneur, M.; Brailovski, V.; Kreitcberg, A.; Paserin, V.; Bailon-Poujol, I. Laser Powder Bed Fusion of Water-Atomized Iron-Based Powders: Process Optimization. J. Manuf. Mater. Process. 2017, 1, 23. [Google Scholar] [CrossRef] [Green Version]
  20. Letenneur, M.; Kreitcberg, A.; Brailovski, V. Optimization of Laser Powder Bed Fusion Processing Using a Combination of Melt Pool Modeling and Design of Experiment Approaches: Density Control. J. Manuf. Mater. Process. 2019, 3, 21. [Google Scholar] [CrossRef] [Green Version]
  21. Kreitcberg, A.; Brailovski, V.; Prokoshkin, S. New biocompatible near-beta Ti-Zr-Nb alloy processed by laser powder bed fusion: Process optimization. J. Mater. Process. Technol. 2018, 252, 821–829. [Google Scholar] [CrossRef]
  22. Letenneur, M.; Kreitcberg, A.; Brailovski, V. The Average Grain Size and Grain Aspect Ratio in Metal Laser Powder Bed Fusion: Modeling and Experiment. J. Manuf. Mater. Process. 2020, 4, 25. [Google Scholar] [CrossRef] [Green Version]
  23. Kreitcberg, A.; Brailovski, V.; Sheremetyev, V.; Prokoshkin, S. Effect of Laser Powder Bed Fusion Parameters on the Microstructure and Texture Development in Superelastic Ti–18Zr–14Nb Alloy. Shape Mem. Superelast. 2017, 3, 361–372. [Google Scholar] [CrossRef]
  24. ASTM Standard. ASTM E112-10: Standard Test Methods for Determining Average Grain Size; ASTM International: West Conshohocken, PA, USA, 2010. [Google Scholar]
  25. Schuöcker, D. Handbook of the Eurolaser Academy; Springer Science & Business Media: Berilin, Germany, 1998; Volume 2. [Google Scholar]
  26. Kundin, J.; Mushongera, L.; Emmerich, H. Phase-field modeling of microstructure formation during rapid solidification in Inconel 718 superalloy. Acta Mater. 2015, 95, 343–356. [Google Scholar] [CrossRef]
  27. Nelson, J.B.; Riley, D.P. An experimental investigation of extrapolation methods in the derivation of accurate unit-cell dimensions of crystals. Proc. Phys. Soc. 1945, 57, 160–177. [Google Scholar] [CrossRef]
  28. Kim, H.; Fu, J.; Tobe, H.; Kim, J.; Miyazaki, S. Crystal structure, transformation strain, and superelastic property of Ti–Nb–Zr and Ti–Nb–Ta alloys. Shape Mem. Superelast. 2015, 1, 107–116. [Google Scholar] [CrossRef] [Green Version]
  29. Kreitcberg, A.; Sheremetyev, V.; Tsaturyants, M.; Prokoshkin, S.; Brailovski, V. Optimization of Post-processing Annealing Conditions of the Laser Powder Bed-Fused Ti–18Zr–14Nb Shape Memory Alloy: Structure and Functional Properties. Shape Mem. Superelast. 2019, 5, 172–181. [Google Scholar] [CrossRef]
  30. Gockel, J.; Beuth, J.; Taminger, K. Integrated control of solidification microstructure and melt pool dimensions in electron beam wire feed additive manufacturing of Ti-6Al-4V. Addit. Manuf. 2014, 1–4, 119–126. [Google Scholar] [CrossRef]
  31. Cherry, J.A.; Davies, H.M.; Mehmood, S.; Lavery, N.; Brown, S.G.R.; Sienz, J. Investigation into the effect of process parameters on microstructural and physical properties of 316L stainless steel parts by selective laser melting. Int. J. Adv. Manuf. Technol. 2015, 76, 869–879. [Google Scholar] [CrossRef] [Green Version]
  32. Yadroitsau, I. Selective laser melting: Direct manufacturing of 3D-objects by selective laser melting of metal powders. Lambert Acad. Publ. 2009, 55, 551–560. [Google Scholar]
  33. Popovich, V.; Borisov, E.; Sufiiarov, V.; Masaylo, D.; Alzina, L. Functionally graded Inconel 718 processed by additive manufacturing: Crystallographic texture, anisotropy of microstructure and mechanical properties. Mater. Des. 2017, 114, 441–449. [Google Scholar] [CrossRef]
  34. Poulin, J.R.; Letenneur, M.; Terriault, P.; Brailovski, V. Influence of Intentionally Induced Porosity and Postprocessing Conditions on the Mechanical Properties of Laser Powder Bed–Fused Inconel 625. Struct. Integr. Addit. Manuf. Parts 2018, STP1620, 294–312. [Google Scholar]
  35. Silbernagel, C.; Aremu, A.; Ashcroft, I. Using machine learning to aid in the parameter optimisation process for metal-based additive manufacturing. Rapid Prototyp. J. 2019, 26, 625–637. [Google Scholar] [CrossRef]
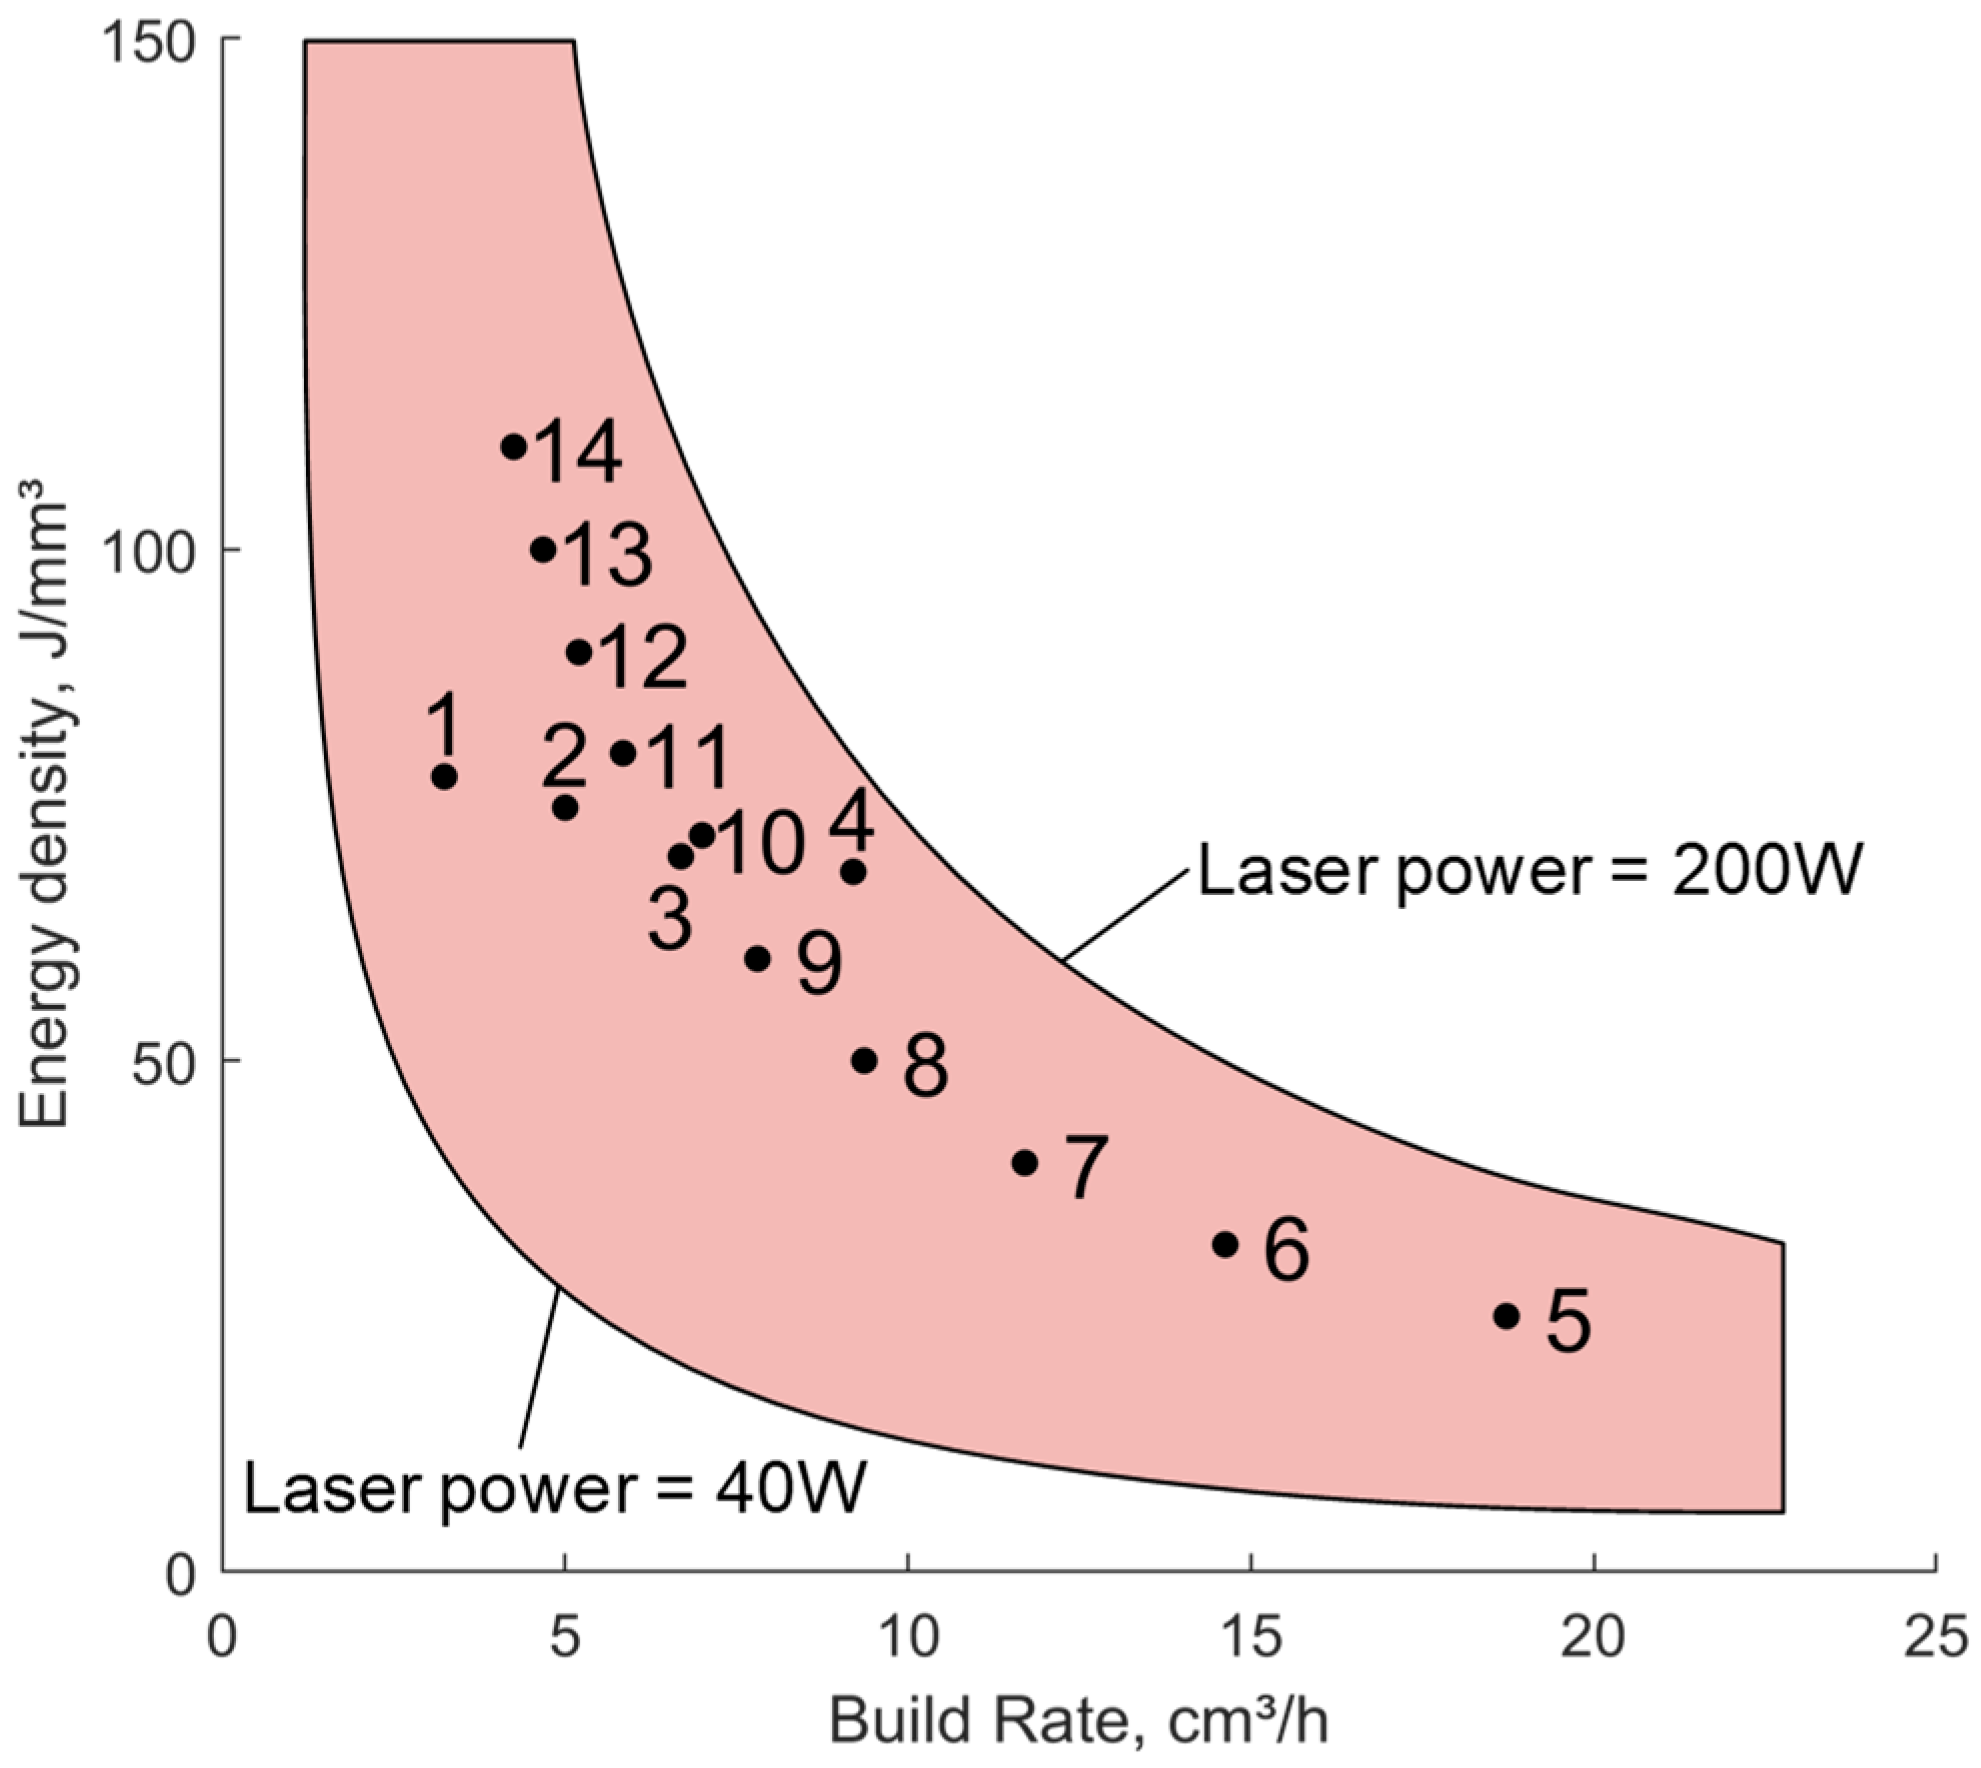
Figure 1. Energy density–build rate window with processing conditions of 14 Ti-18Zr-14Nb calibration specimens (TruPrint 1000).
Metals 10 01697 g001
Figure 2. (a) Schematic presentation of the specimens on the build plate, (b) LPBF scanning strategy (dimensions in mm) and (c) result of the build.
Metals 10 01697 g002
Figure 3. SEM images of gas-atomized Ti-18Zr-14Nb alloy powder: (a,b) morphology and microstructure of powder particles; (c) particle size distribution (PSD) of the Ti-18Zr-14Nb powder.
Metals 10 01697 g003
Figure 4. Relative density of the Ti-18Zr-14Nb specimens as a function of the laser energy density.
Metals 10 01697 g004
Figure 5. X-ray diffractograms of the selected as-built Ti-18Zr-14Nb samples; increasing power density from top to bottom.
Metals 10 01697 g005
Figure 6. Microstructure and inverse pole figures of the as-built alloy presented in decreasing laser power density order: (a) 14, (b) 4, (c) 10, (d) 7 and (e) 5.
Metals 10 01697 g006
Figure 7. Processing maps for the Ti-Zr-Nb alloy: (a) density, (b) grain size and (c) grain aspect ratio; (hatching distance 110 µm; Specimen 14 is shown in (a), but not in (b,c) (explanations in text)).
Metals 10 01697 g007
Figure 8. Microstructure and inverse pole figures of the Ti-Zr-Nb alloy printed using different LPBF systems: (a,c,e) TruPrint 1000 (Trumpf) and (b,d,f) M280 (EOS).
Metals 10 01697 g008
Table 1. Processing parameters for 14 Ti-Zr-Nb calibration specimens (constant layer thickness of t = 30 µm).
SetSpecimensPower, WSpeed, m/sHatch Distance, mmE, J/mm3BR, cm3/h
1st set 1705000.0677.83.2
21047720.0674.75.0
314010800.0672.07.0
417514200.0668.59.2
2nd set 513015760.1125.018.7
613012310.1132.014.6
71309850.1140.011.7
81307880.1150.09.4
91306570.1160.07.8
101305630.1170.06.7
111304920.1180.15.8
121304380.1189.95.2
131303940.11100.04.7
141303580.11110.04.3
Table 2. Physical properties of the Ti-Zr-Nb alloy in bulk and powdered forms used for process modeling.
Material CharacteristicsBulkPowder (t = 30 μm; φ = 60%)
Density, kg/m356603396
Thermal conductivity *, W/mK7.23.6
Specific heat *, J/kg.K560560
Laser absorptivity **0.460.91
Melting temperature ***, °C16501650
* Values correspond to Ti-6Al–4V (AZoMaterials, 2002); ** Calculated with equations provided in Letenneur et al. (2020); *** Calculated in Prokoshkin et al. (2016).
Table 3. Chemical compositions of the Ti-Zr-Nb powder and selected printed specimens.
Printing ConditionsChemical Composition
Main Elements (at. %)Interstitial Elements (wt. %)
SpecimenPower Density (W/mm3)TiZrNbON
37265.518.915.60.2130.011
468.565.618.815.50.2180.019
52565.619.015.40.2000.010
1411064.719.515.80.2130.025
Powder68.617.813.60.1890.013
Table 4. Beta-phase lattice parameters and X-ray peak intensity ratios of the selected as-built samples presented in decreasing power density order.
SpecimenE, J/mm3BR, cm3/ha, nmPeak Intensity Ratio
I110:I200:I211
141104.30.3347 ± 0.00031:0.88:0.42
10706.70.3347 ± 0.00011:0.88:0.22
468.59.20.3351 ± 0.00011:1.32:0.85
74011.70.3349 ± 0.00011:0.10:0.27
52518.70.3347 ± 0.00031:0.27:0.26
Table 5. Results of the structural analysis of selected specimens presented in decreasing laser power density order.
SpecimenE, J/mm3BR, cm3/hdxz, µmdxy, µmGARText Int (Max)
141104.3199 ± 650 ± 62.882.08
10706.7151 ± 741 ± 53.286.84
468.59.297 ± 737 ± 43.174.55
74011.766 ± 330 ± 42.622.56
52518.750 ± 331 ± 42.341.48
Table 6. Measured and calculated density, grain size and grain aspect ratio, and their deviations.
SpecimenE, J/mm3BR, cm3/hDensity, %Grain Size (XZ), µmGrain Aspect Ratio
Meas.Calc.Dev.Meas.Calc.Dev., %Meas.Calc.Dev., %
177.83.298.2999.641.35-75--2.86-
274.75.099.0799.640.57-76--2.88-
372.07.099.6999.640.05-85--3.01-
468.59.299.6199.640.0397 ± 79703.173.190.6
525.018.798.3098.300.0050 ± 3547.42.342.282.6
632.014.699.3198.930.39-65--2.45-
740.011.799.4899.410.0766 ± 37815.42.622.651.1
850.09.499.6199.610.00-94--2.86-
960.07.899.1999.580.39-112--3.06-
1070.06.799.2599.290.05151 ± 712914.63.283.252.5
1180.15.899.3299.290.03-147--3.43-
1289.95.298.6198.730.12-166---3.60-
13100.04.796.9398.731.83-186--3.77-
14110.04.398.1198.030.08199 ± 6XX2.88XX
X: bimodal grains distribution, the model is nonapplicable.
Publisher’s Note: MDPI stays neutral with regard to jurisdictional claims in published maps and institutional affiliations.