Article

Metallurgical Interaction among BNi-9 and Waspaloy, FSX-414 or 304-Type Stainless Steel under TLP Cycle

by
Norma Yolanda Flores-Escareño
1,
Manuel de Jesús Castro-Román
1,*,
Héctor Manuel Hernández-García
2 and
Martín Herrera-Trejo
1
1
The Center for Research and Advanced Studies of the National Polytechnic Institute, Saltillo Campus, Av. Industria Metalúrgica, 1062, Parque Industrial Saltillo-Ramos Arizpe, Ramos Arizpe 25900, Coahuila, Mexico
2
Mexican Corporation for Investigation of Materials, Ciencia y Tecnología No. 790, Fracc. Saltillo 400, Saltillo 25290, Coahuila, Mexico
*
Author to whom correspondence should be addressed.
Metals 2020, 10(3), 306; https://doi.org/10.3390/met10030306
Submission received: 20 November 2019 / Revised: 20 December 2019 / Accepted: 24 December 2019 / Published: 26 February 2020

Abstract

:
The metallurgical interaction of BNi-9 filler metal paste with Waspaloy, Ni-coated Waspaloy, FSX-414, and 304-SS is studied in a brazing treatment under an argon atmosphere with an isothermal hold for one hour at 1150 °C. The Waspaloy alloys were brazed under both solubilized and aging conditions. Before brazing, some Waspaloy samples were electrochemically coated with an Ni layer 35-40 μm thick. The microstructures of the FSX-414 and 304-SS alloys showed that the thickness of the isothermal solidification zones was approximately 50 μm, while this thickness was not well defined in the Waspaloy samples. The Ni-coated solubilized Waspaloy showed a wider diffusive zone, which was associated with an increase in the penetration extension of the liquid films. The analysis of grain orientation in all brazed zones of the Waspaloy samples showed aleatory characteristics. Plastic factors in the different brazed zones were also obtained by nanoindentation under 350 mN loads. It was observed that the plastic factor was low when the width of the diffusive zone increased. The plastic factor in the Ni-coated Waspaloy was the lowest, while the diffusive zone in this sample had the largest width. The BNi-9 wettability is better in FSX-414, and 304-SS than in Waspaloy. Ni coating in Waspaloy improves BNi-9 wettability.

Graphical Abstract

1. Introduction

Gas turbine elements are manufactured from nickel superalloys (Waspaloy; blades and vanes), cobalt superalloys (FSX-414; vanes), and stainless steel (304-SS; stationary blades). These materials have exceptional mechanical resistances that cover the operating temperature range of turbine components. During service, these components are also subjected to severe stresses and deformations, impacts by foreign particles and corrosive attacks [1]. Brazing is used for the union between the various turbine components, due to, among other advantages, the large weld surface that it achieves.
Because of its versatility, BNi-9 (MBF 80, Nicobraz 150) has been extensively studied in base Ni alloys, base Co alloys and stainless steel. This filler material can be applied as either a foil or paste, each one having a specific application; an amorphous foil provides more uniform joints assemblies [1], and powders mixed with a binder and paste are used to repair cracks and wear defects [2,3,4,5,6,7]. In Table 1, the experimental conditions of some of these studies have been summarized.
As shown in Table 1, the application of BNi-9 has been studied under different process conditions. In general, the treatment temperatures are in the 1065–1225 °C range, a vacuum of approximately 1.33 × 10⁻³ Pa is applied, and most of the thickness gaps are in the 20–200 μm range. Argon atmospheres have also been used [15,18,19]. Wu et al. [22] used 5% hydrogen and 95% Ar for wide gap brazing. Even an air atmosphere has been used to study 304-SS bonding with cobalt foils [23]. The time of brazing treatment varies depending on the study focus.
Among the main features in the microstructure of the brazing zone, the time for full isothermal solidification in the union zone is relevant. In the case of nickel-based alloys, when applying BNi-9 foils, different times have been reported, depending on the weld material and foil thickness where the filler has already solidified. Bai et al. [8] reported 6 min with a 40-μm-thick foil applied to IN 718; Arham et al. [9] reported 90 min to solidify a 75-μm foil in IN 939; Wikstrom et al. [10] and Tokoro et al. [11] reported 360 min to solidify a 100-μm foil in Waspaloy; and Bakhtiari et al. [16] reported 5 min to solidify a 50-μm-thick foil in a base cobalt alloy FSX-414.
Some studies have focused on modeling the solidification of filler metal using different approaches. Ramirez and Liu [24] developed a model based on the resolution of the transient diffusion equation in the binary system Ni-B. Riggs et al. [12] performed a thermodynamic and kinetic calculation that took the multicomponent composition of the materials into account to predict the microstructural evolution of BNi2 and BNi-9 when applied as filler metal powder to CMSX-4. Bai et al. [8] used a similar approach to model the solidification of BNi-9 in Inconel 718. Yuan et al. [17] used a Nernst-Brunner equation to fit the data of solidification of an amorphous foil of MBF-80 applied to duplex stainless-steel blanks. They provided values of the apparent activation energy for this experimental case. In all former cases, it was reported that the models’ results agreed well with the experimental data.
Concerning the microstructural evolution of the brazed zone, in general, two-phase or three-phase eutectics are reported as the main constituent in the solid if it is not isothermally solidified [10,11,25,26,27,28,29,30,31,32]. This phenomenon occurs when the initial gap thickness overcomes the isothermal solidified layer. This eutectic constituent is composed of a Ni-based solution and Ni and Cr Borides [10,11,12,13,18,33]. The morphology and distribution of the eutectic constituent could be changed by nanoparticle additions, as observed by Hernandez et al. [15,18,19]. These authors studied the effect of Si or W nanoparticles added to BNi-9. The filler metal with Si nanoparticles was applied to 304-SS [19], while the effect of W nanoparticles addition was studied in 304-SS [18] or Inconel 725 [15].
The repairing of gas turbine components has been studied elsewhere, with filler metal paste or powder blend with a binder. Wide gap reparation was investigated by Henhoeffer et al. [33] and Wu et al. [22]. They incorporated a metal powder onto a filler paste to improve the brazing treatment. Ye et al. [7,34] studied the repair of simulated cracks in IN738LC with BNi-1 paste and mixed filler alloy. They found an isothermal solidified gap of approximately 1000 μm with a six-hour treatment. Nicolaus et al. [3,4,5] developed a hybrid process for repairing high-pressure turbine blades.
Although the main general features of the brazing process are well understood, the application of this technique for repairing turbine components requires more experimental studies that will further allow for process optimization. In this context, this study was performed to provide information regarding the possibilities of the brazing process for repairing purposes by applying BNi-9 paste to either Waspaloy, Ni-coated Waspaloy, FSX-414, and 304-SS. The same brazing treatment was then applied to the different material couples to study brazing microstructure evolution, the wedge-samples, and the wettability of BNi-9, the drop-samples, in these materials.

2. Materials and Methods

2.1. Base Alloys and the BNi-9 Filler Metal Paste

The grain size number, G, of base metals was 6.5, 6, 5.5 and 00 for Sol-Wasp, Age-Wasp, SS-304, and FSX-414, respectively. These G values were determined according to the linear intercept method as per ASTM standard E112.
Inspection of solubilized Waspaloy samples in a field scanning emission microscope Jeol JSM-7401F revealed the presence of some γ’ precipitates in them.
Table 2 shows the chemical composition of the materials used in this study. A chemical analysis of the metallic alloys was obtained by optical emission spectrometry (Lab S, SPECTRO Analytical Instruments Inc., Irvine, CA, USA), while the filler metal paste was analyzed via atomic absorption (ICE 3300, Thermo Fisher Scientific, Cambridge, United Kingdom) and plasma atomic emission (Optima 8300, PerkinElmer, Inc., Waltham, MA, USA). In all materials, the contents of C and S were obtained by infrared absorption (CS230, LECO Corporation, St. Joseph, MI, USA), and the contents of oxygen, nitrogen, and hydrogen that are shown in Table 3 were measured by combustion with detection by infrared absorption and thermal conductivity (ONH 2000, ELTRA elemental analyzers, Hann, Germany).
The contents of the elements in all materials are in the range of the composition indicated in the respective standards, except for Si in 304-SS and C in BNi-9, either as received or in the calcinated BNi-9.

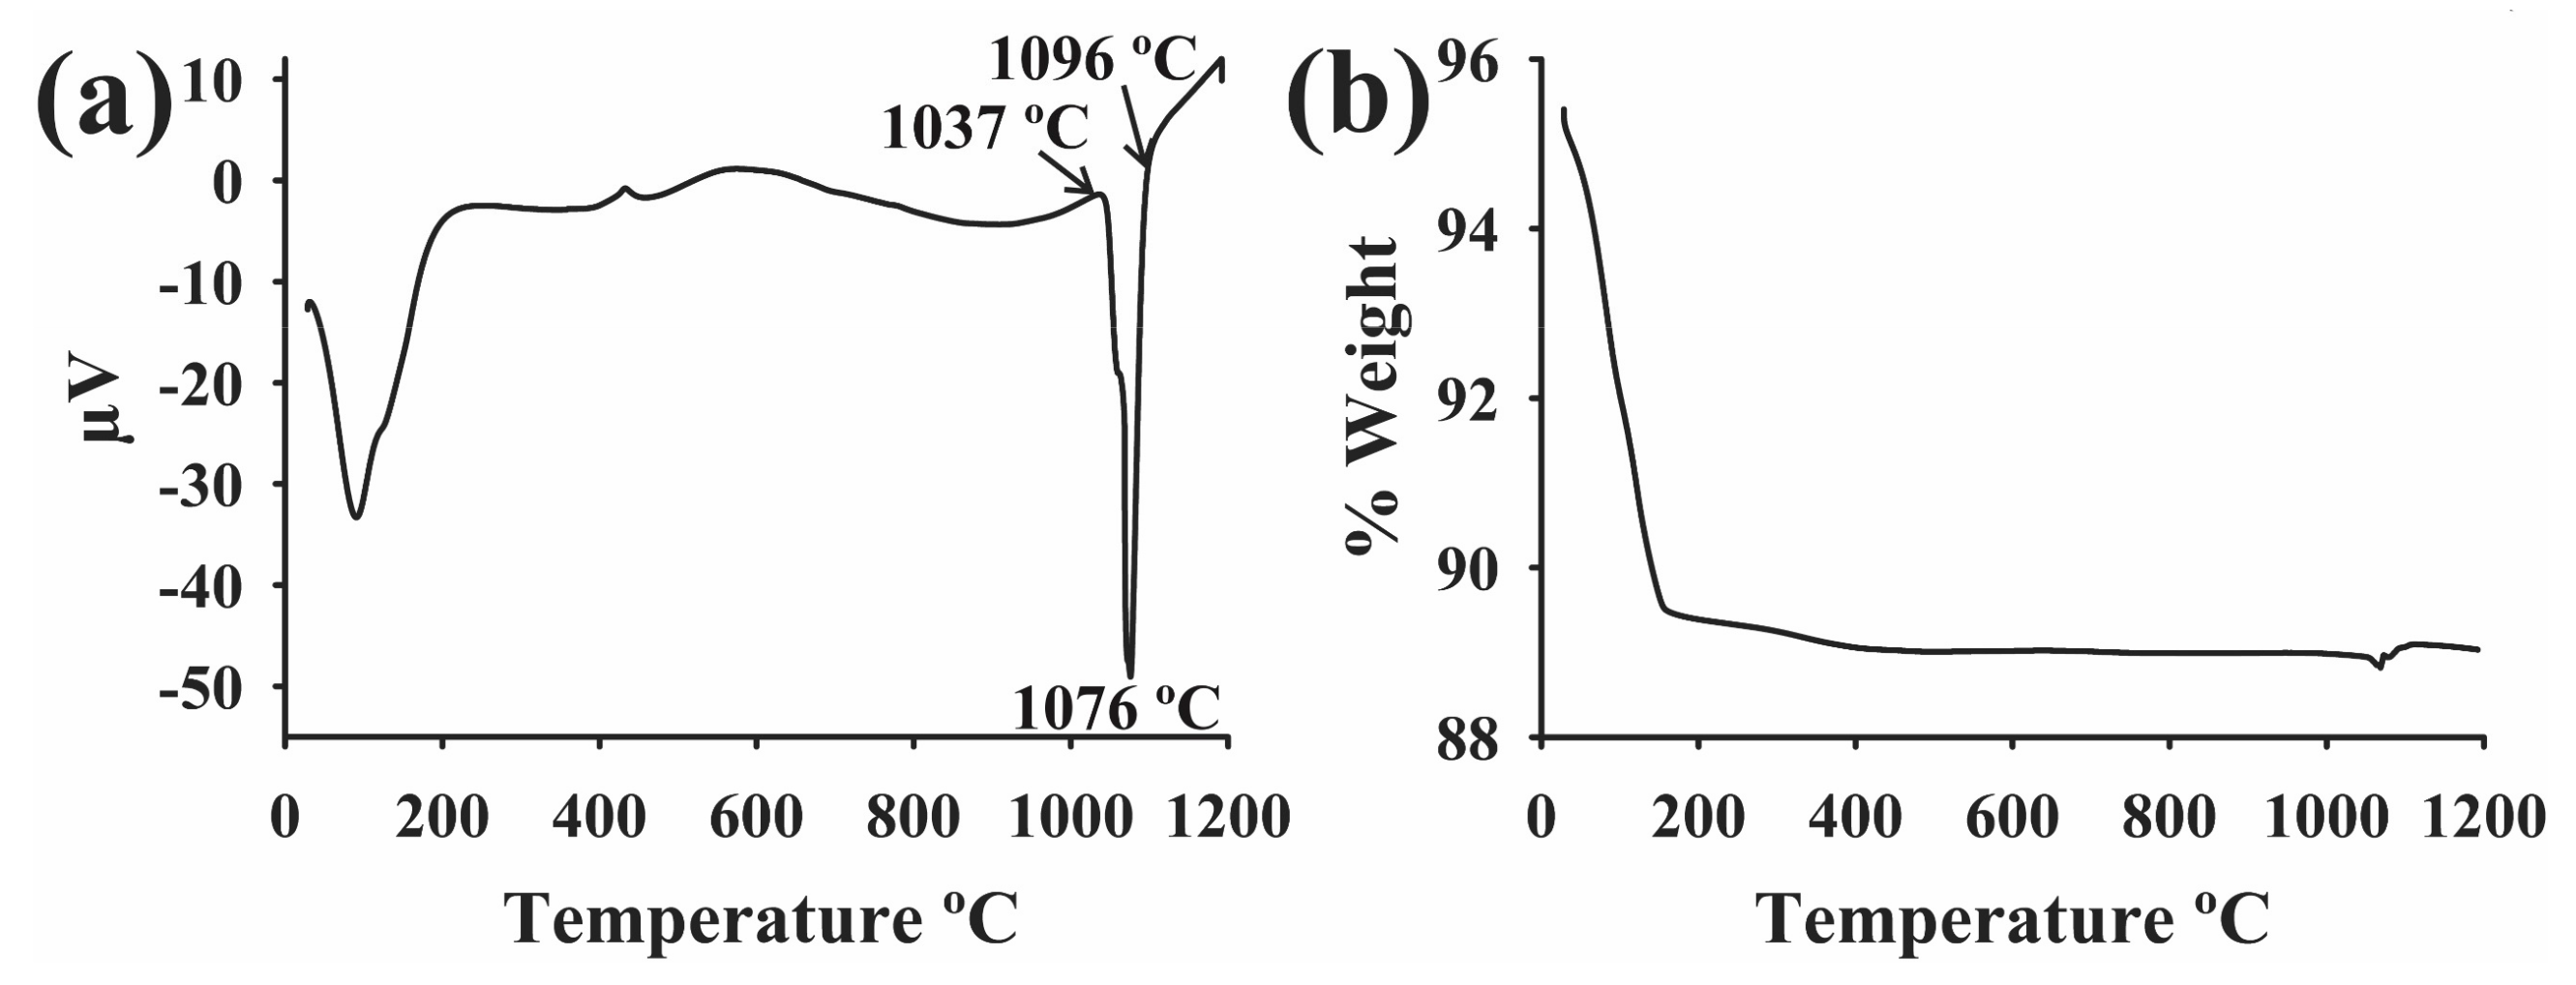
2.2. Characterization by Differential Scanning Calorimetry of the BNi-9 Filler Metal Paste

For this study, the alloy systems studied were brazed with BNi-9 filler metal paste (Nicobraz 150, Wall Colmonoy, Swansea, UK). Figure 1 shows a differential scanning calorimetry and thermogravimetric analysis (DSC-TG) performed in a SDT Q600, (TA Instruments, New Castle, DE, USA), at heating rates of 10 °C/min from ambient at 1200 °C. According to these data, the melting point of the BNi-9 paste begins at 1037 °C and ends at 1076 °C. An important weight loss of 12% occurs from the start of heating until 157 °C. From this temperature to 400 °C, an additional small weight loss of 0.5% occurs. It is interesting to note that the observed weight loss corresponds to the inert binder content (12 wt.%) [35] denoted in the typical analysis of the used filler metal paste.

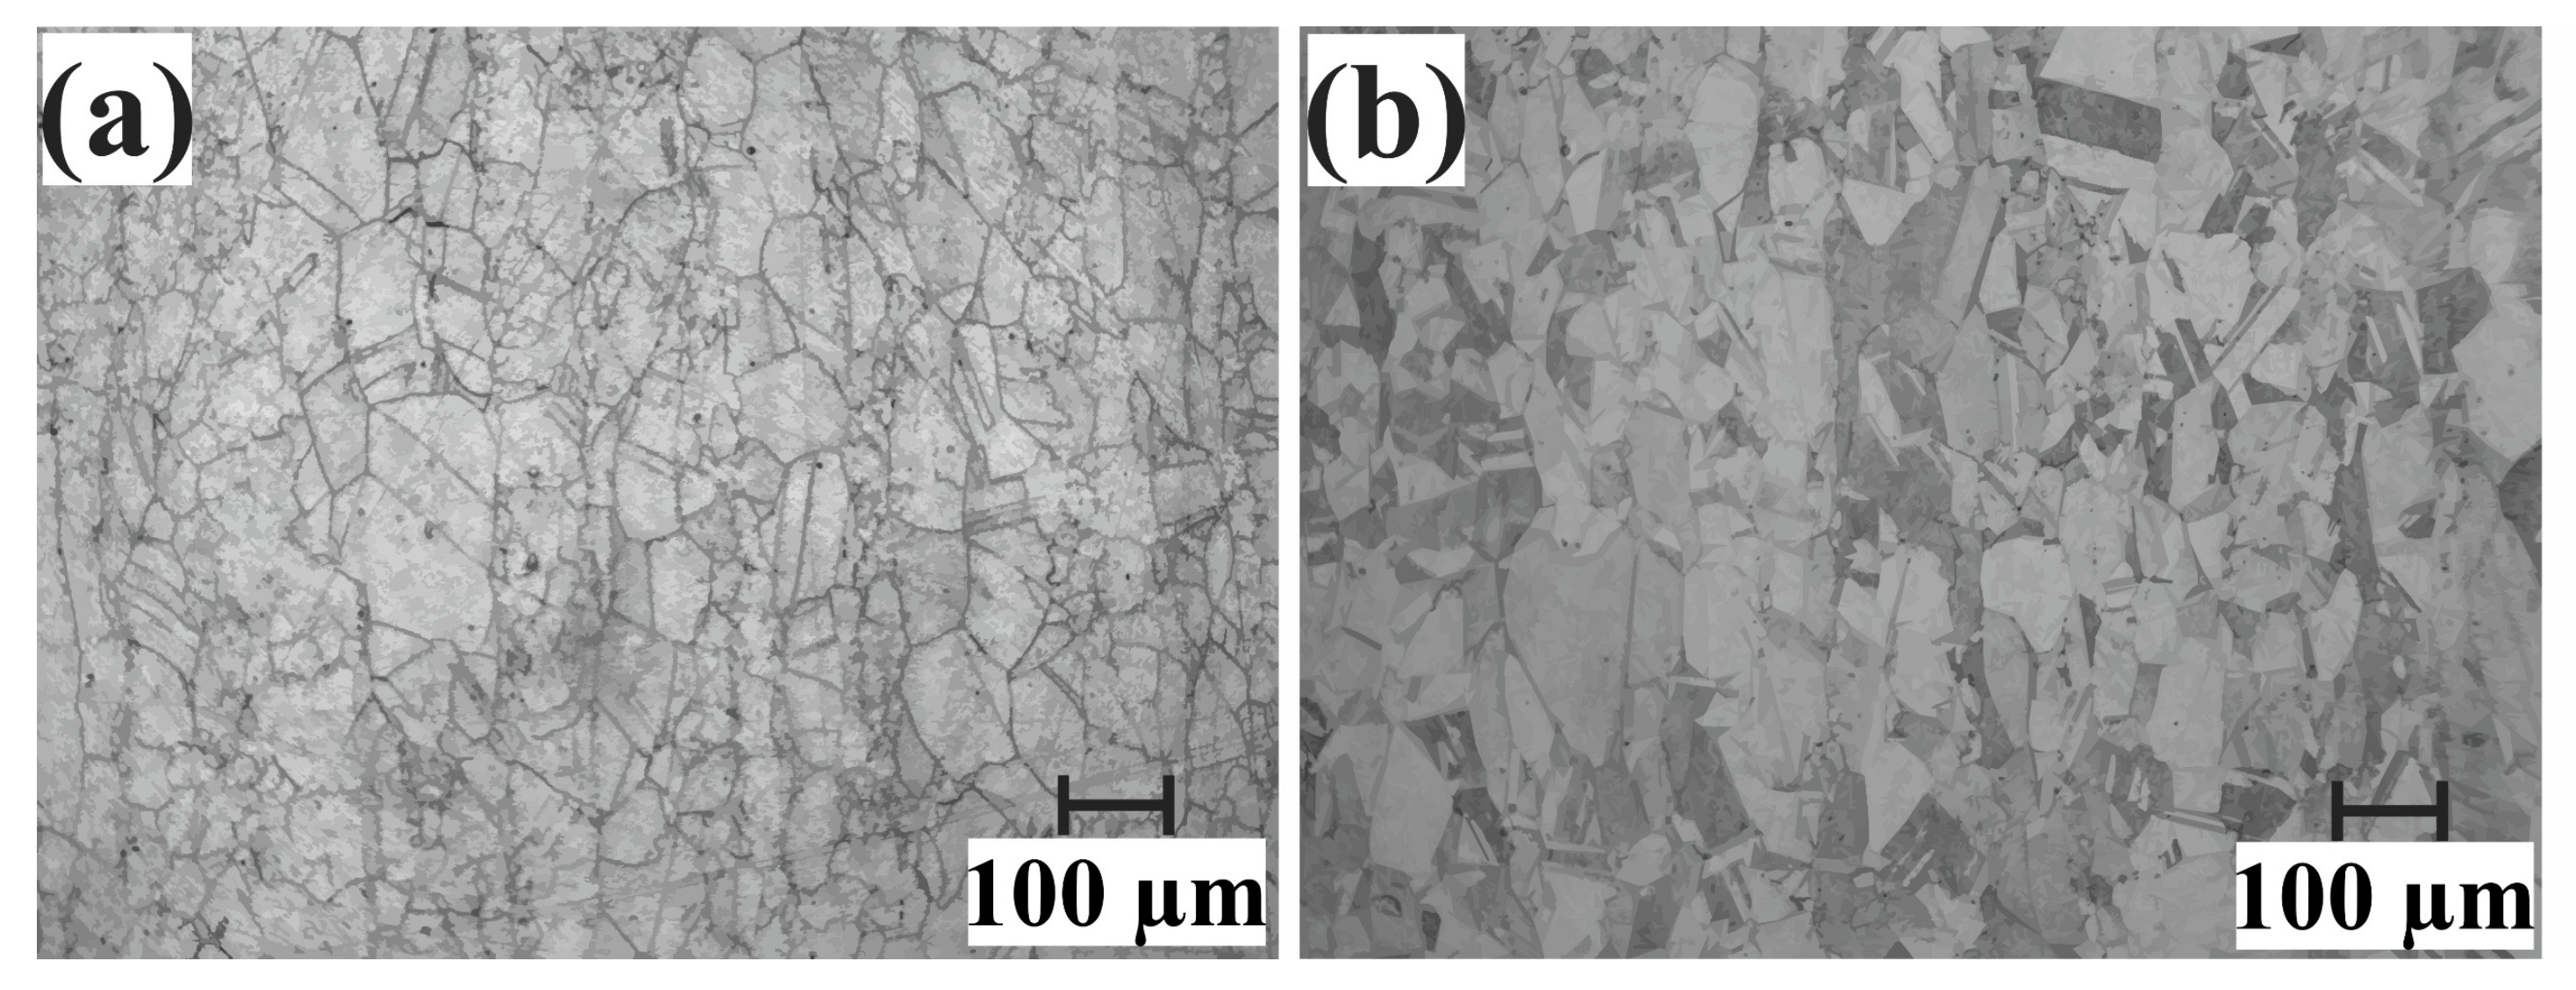
2.3. Aging Heat-Treatment of Waspaloy

To obtain the Age-Wasp, part of the Sol-Wasp was subjected to the thermal cycle proposed in Handbook vol. 4, (Heat Treating, ASM International, Materials Park, OH, USA) in a furnace under an argon atmosphere [36]. The Sol-Wasp material was first heated at 10 °C/min and maintained at 845 °C for four h, followed by air cooling to room temperature (25 °C). In parallel, the furnace was cooled to 760 °C. The previously cooled samples were then reintroduced to the furnace and kept there at 760 °C for 16 h, then they were extracted from the oven and air-cooled to room temperature. The microstructural condition of the Sol-Wasp and Age-Wasp are shown in Figure 2; the latter shows twins and recrystallized grains.

2.4. Surface Preparation and Ni Coating

2.4.1. Surface Preparation

The samples for brazing were extracted from the different materials by cutting slices in a Struers Accutom-50 with a diamond disc. Subsequently, the samples were sanded with 180 grit SiC sandpaper to remove rust, dirt and provide a flat surface finish. Then, to remove the rest of the impurities, the samples were immersed in alcohol contained in a beaker to apply an ultrasonic treatment for 10 min. Next, the samples were sanded with 80 grit sandpaper to form a grid to make the surface rougher. After that, ultrasound cleaning was again applied to the samples, which were subsequently immersed in nitric acid at 64% w/w (AR) for 20 s. The samples were immediately placed into a solution with Citranox®, and ultrasound was applied for 5 min. After that, the samples were placed in acetone and put into an ultrasonic bath for 10 min. Finally, they were dried in hot air.

2.4.2. Ni Coating

Forty minutes of Ni electrolytic deposition in some Waspaloy sheets was performed using the procedure proposed by Watts [37] to obtain coatings that were approximately 35–40 μm thick.
The topographic appearance of the coating was analyzed using atomic force microscopy (Nanite, Nanosurf, Liestal, Switzerland). Figure 3a,b show the 3D morphological aspect of the coating on the nickel-plated solubilized Waspaloy alloy (Ni-Sol-Wasp) and nickel-plated aged Waspaloy alloy (Ni-Age-Wasp). Some variations in the particle size, as well as rhomboid morphologies, can be seen in Figure 3c,d.
However, the surface roughness, (arithmetic mean) Ra, measured in 10 fields of each sample, does not change significatively between samples; in all cases, it is approximately 329 ± 0.5 nm.

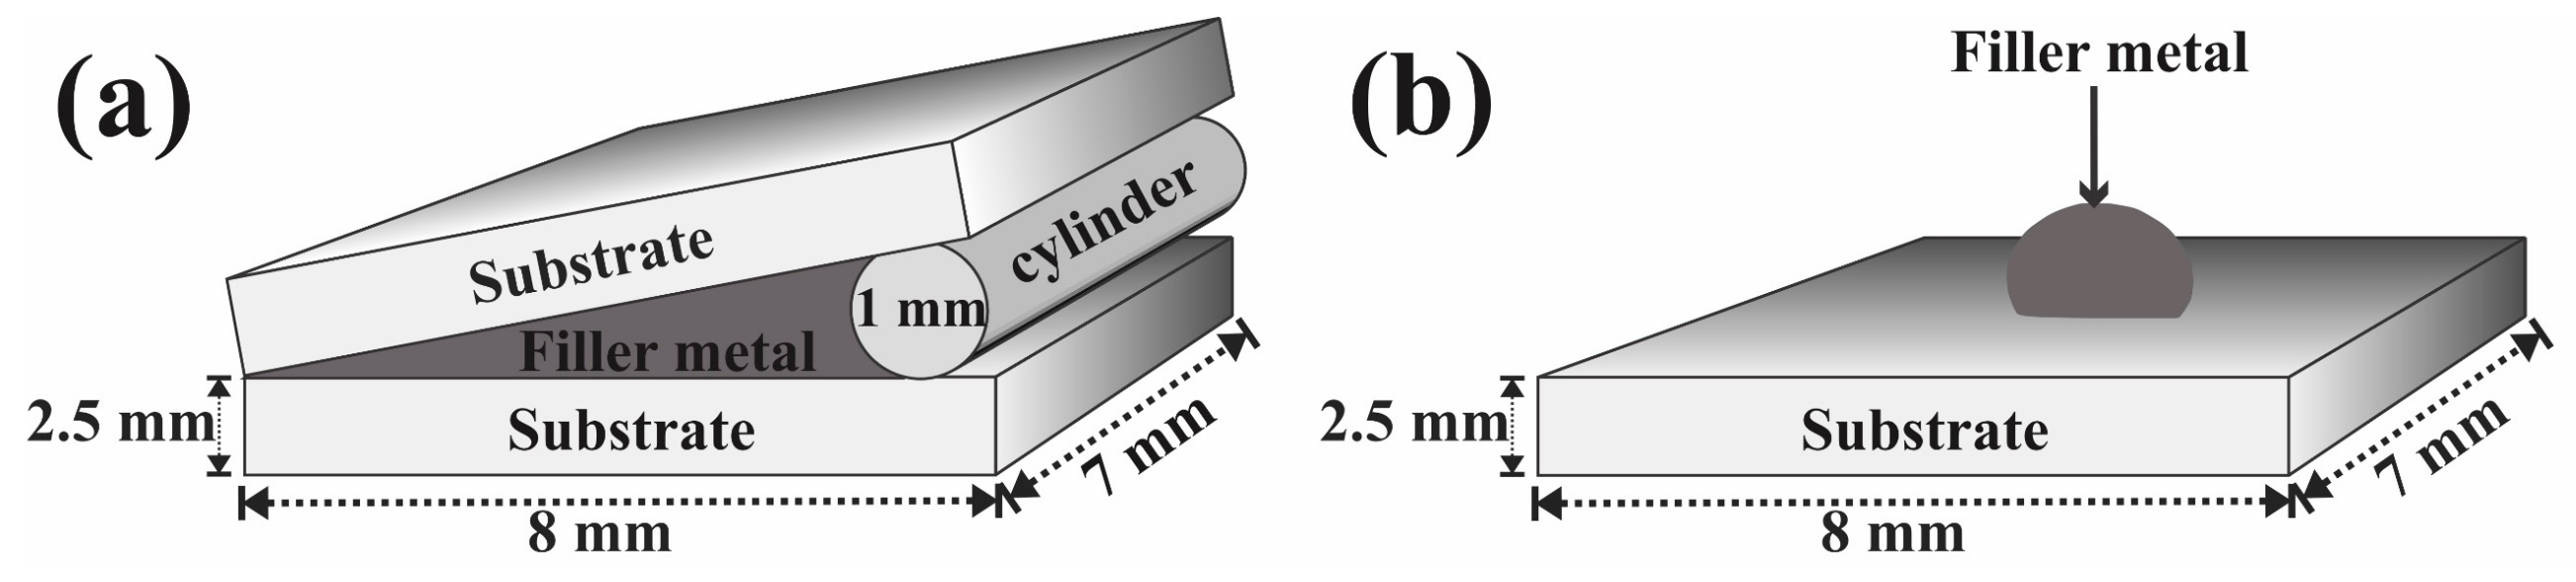
2.5. Preparation of the Wedge and Drop Samples

The wedge-samples were built with two small sheets of the same alloy. The BNi-9 paste was spread on one face of these sheets to obtain a butt weld. The two sheets were then put in contact at an extreme and then gradually closed, leaving an ascending space from a few microns to approximately 1000 µm. This opening distance was assured by using a Ni-based needle (Figure 4a). In the drop-samples, 0.06 g of the brazing paste was deposited as a drop on the surface of a sheet of the different alloys employed in this study (Figure 4b).

2.6. Brazing Treatment

The brazing process was performed in a 101-20-230 Thermcraft furnace (Thermcraft incorporated, Winstom Salem, NC, USA) and implemented with a tube of alumina hermetically closed at both ends to control the atmosphere of treatment. At first, the brazed sample was introduced into the furnace, then a primary vacuum of approximately 1.33 × 10⁻¹ Pa was applied. After that, the chamber was filled with an ultra-high purity, UHP, Ar. This operation was repeated twice more. Later, the sample in the furnace was heated at 10 °C/min from room temperature to 1150 °C, and was kept at this temperature for one hour. The temperature was measured close to the sample. Some preliminary tests were performed to assess the temperature difference between the sample and furnace control and to obtain the right treatment temperature in the sample. During all treatments, 236 mL/min of UHP Ar was introduced into the atmosphere chamber to avoid air from entering. Finally, the sample was extracted from the furnace to be immediately air-cooled.

2.7. Microstructural Characterization

After the brazing process, the samples were metallographically prepared following the standard guide ASTM E3-11. Grinding was done using sandpaper from 80 to 1200 grit. The samples were polished using diamond abrasives of 3 µm and 1 µm, successively. Finally, the microstructures of the brazing samples were inspected in an optical microscope, Vanox AHMT3 (Olympus Corporation, Tokyo, Japan)
In all the samples, the average width of both zone 1 (Z1) and the precipitation zone (PZ) were measured in 4 micrographs taken at 40× in different regions in the brazed zone. The reported values of Z1 and PZ correspond to an average of 80 values, further corresponding to 20 measurements taken in each micrograph.
Secondary arm dendritic spacing (SDAS) was measured in 3 micrographs of the melting zone (MZ) taken in each sample at 100× magnification. The SDAS values reported correspond to an average of 15–30 measurements, each one containing four complete and two half dendrite arms, as shown in Figure 5.
The chemical microanalyses of the selected zones were performed in a scanning electron microscope (SEM) Philips XL-30 ESEM (Thermo Fisher Scientific, Cambridge, UK) with dispersive energy X-ray spectrometry (EDX) with an SDD type detector Apollo X (Leica, Wetzlar, Germany). Furthermore, automatic crystal orientation mapping (ACOM) via electron backscattered diffraction (EBSD) of the Sol-Wasp, Ni-Sol-Wasp and Ni-Age-Wasp samples were performed on a JSM-6500F SEM (JEOL, Inc., Peabody, MA, USA) equipped with a DigiView digital EBSD camera energy dispersive spectroscopy (EDAX Smart Insight, Mahwah, NJ, USA).

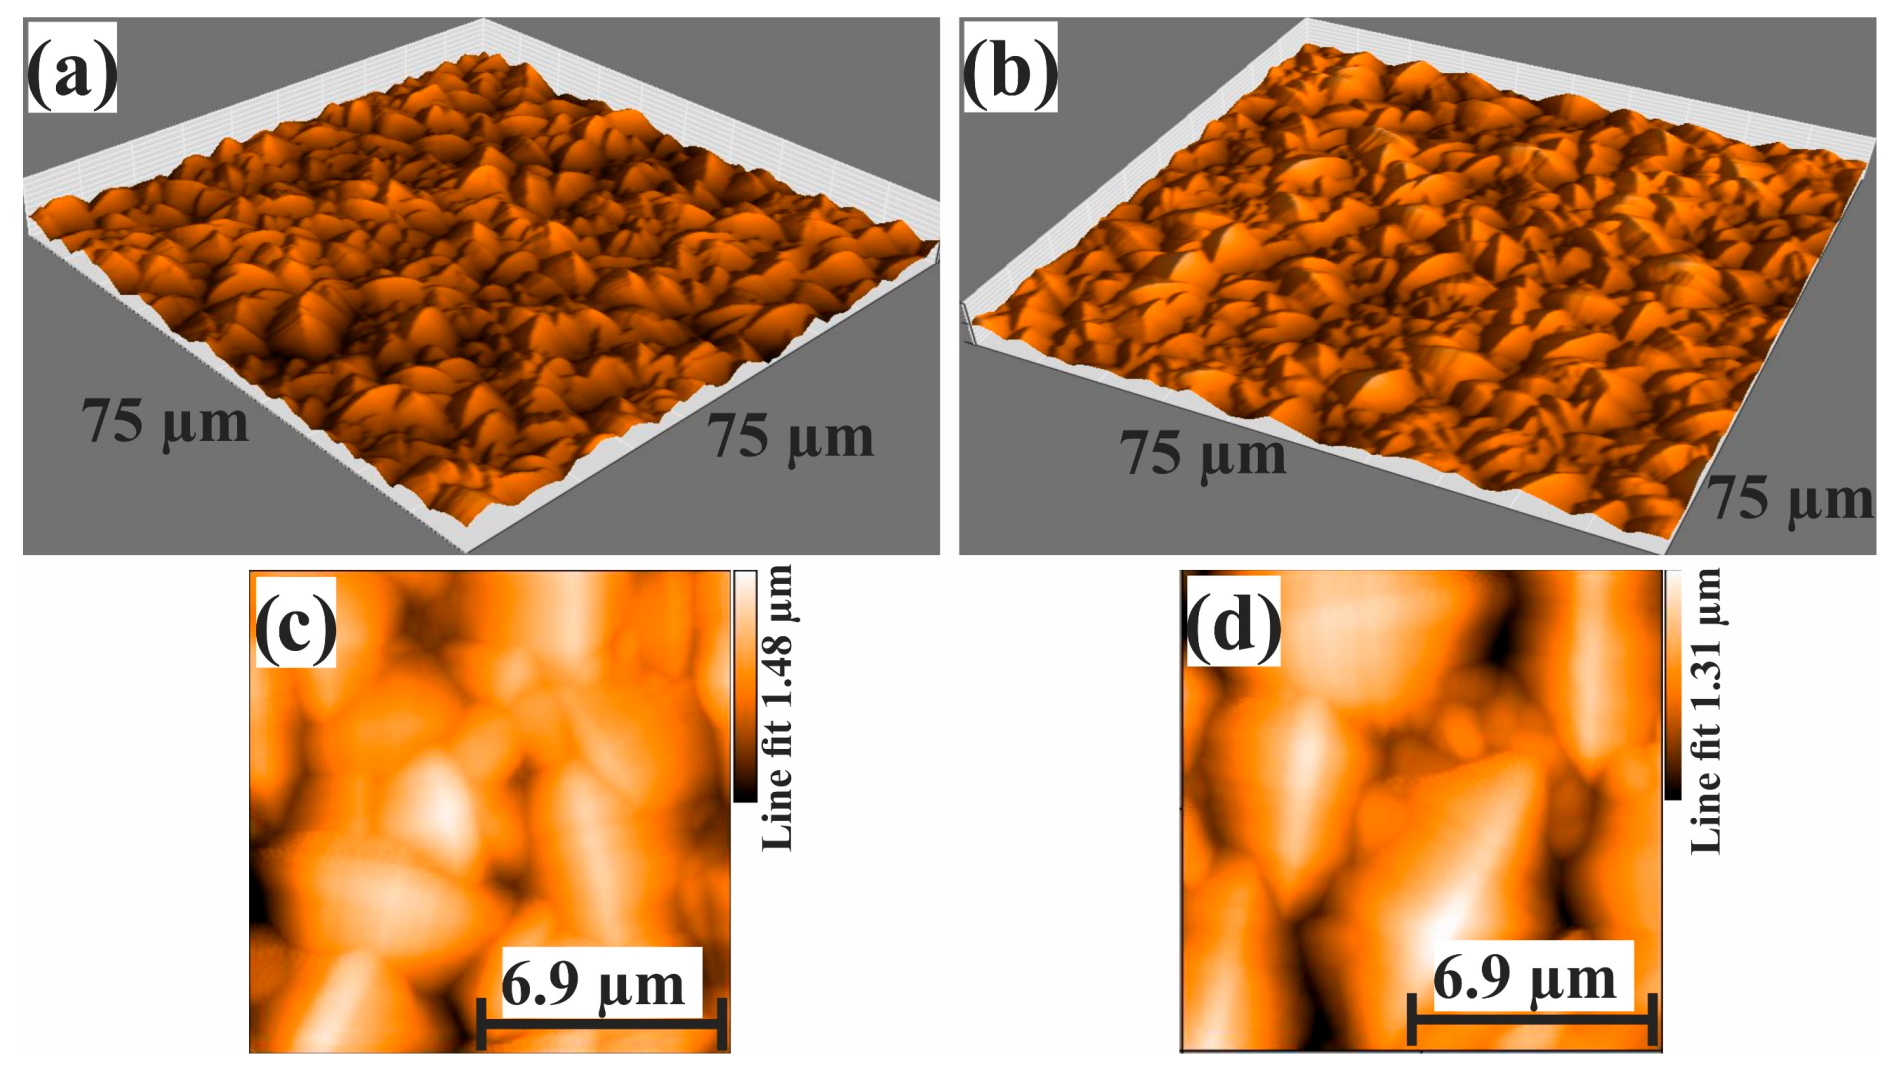
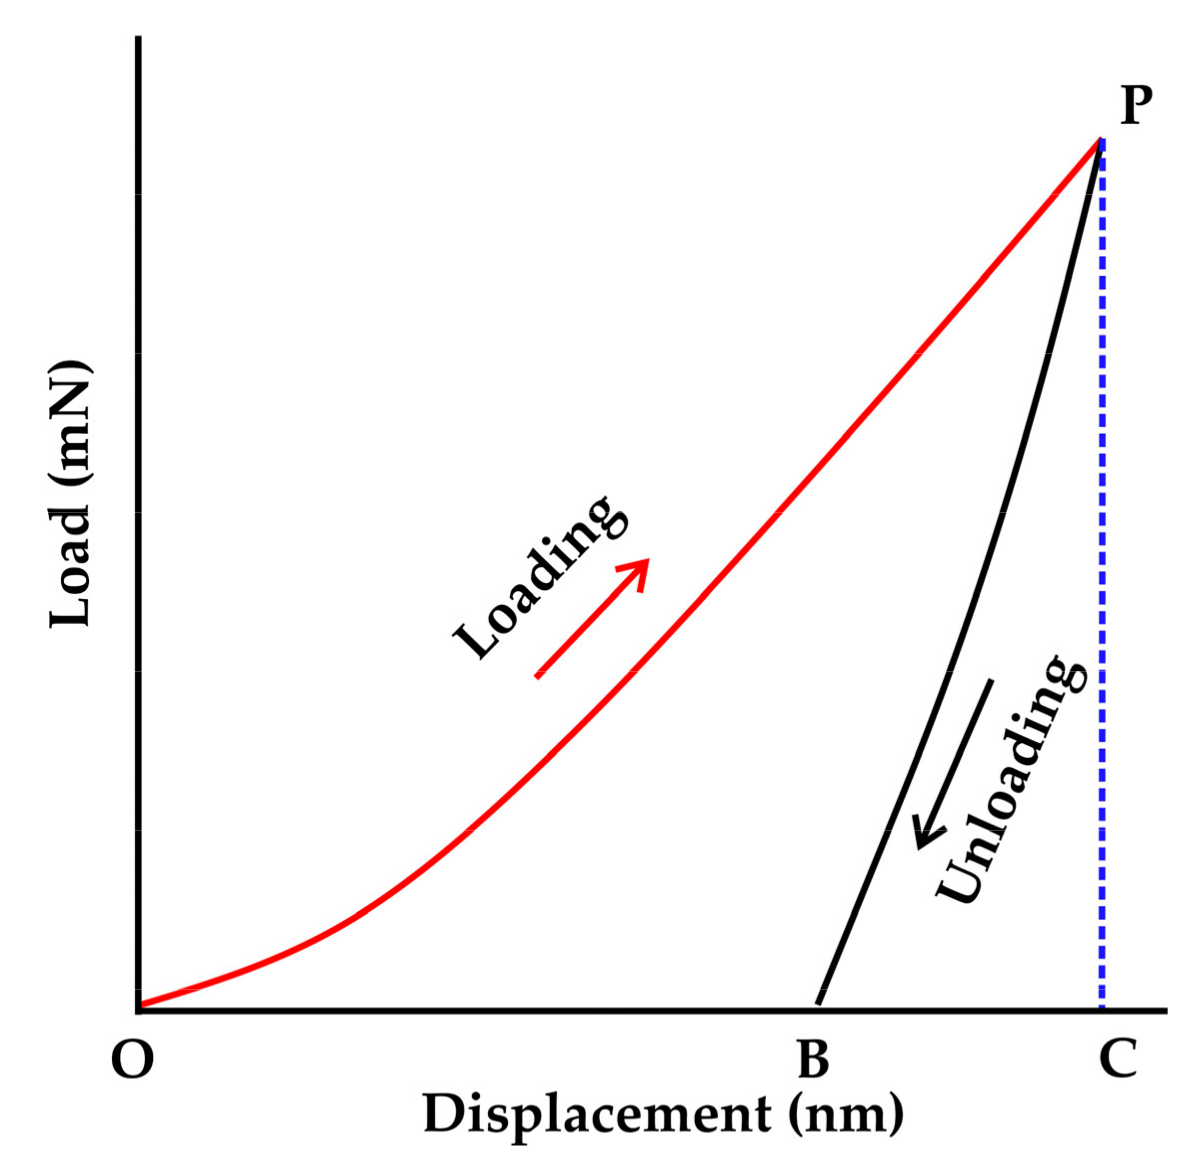
2.8. Evaluation of the Elastic and Plastic Properties by Nanoindentation

The application of a load P to the indenter and the resulting displacement represents work done on the system, which is manifested as both heat (via plastic flow) and elastic strains within the samples. During unloading, work is done by the system as the material in part recovers elastically. The results of the tests are presented in a load-displacement curve, as graphed in Figure 6, where the arrows specify the loading and unloading curves. The plastic deformation work (WP) is estimated by using the area enclosed by the loading and unloading curves (such as OPB) and the total deformation work (WT) is estimated by using the total area enclosed (such as OPC) to calculate the plasticity factor and the elastic moduli. In this sense, the nanoindentation tests were performed using Rtec Instruments equipment with a Berkovich tip at room temperature (25 °C), and the tests were performed at 350 mN for 5 s of holding time on the specific zones of the selected brazed samples: Sol-Wasp, Ni-Sol-Wasp, and Ni-Age-Wasp, in order to calculate the plasticity factor and elastic moduli. On the other hand, the existence of plastic flow can be corroborated by the plasticity factor (ηp), which is estimated using the ratio of the plastic deformation work (WP) to the total deformation work (WT), as follows [38]:
η p % = W p W T x 100 ,
All nanoidentation tests were performed in the nickel-rich solid, including the nickel dendrites observed in the melting zone.

3. Results

3.1. Wedge-Samples

In all the wedge-samples, three microstructural zones affected by brazing phenomena are easily observed; the Melting Zone, MZ, the Precipitated Zone, PZ, and the zone located between them, which is referred to here as Z1.
The MZ corresponds to the material that was liquid when the sample was extracted from the furnace. The solidification microstructure of the MZ was formed at a higher cooling rate compared to the isothermally solidified metal, so it is easier to contrast them, see Figure 7. The MZ [18] has been referred to by other authors as the Athermal Solidification Zone [8,12,39,40], or interlayer [41]. The thickness of the MZ increases when the gap between the plates is augmented, as previously reported by Cook [42].
The MZ is composed of dendrites (nickel-base solid solution), observed in Figure 8, and the eutectic constituent formed by nickel-rich boride, chromium-rich boride, and nickel-base solid solution [10], as well as porosities of different sizes, see Figure 7.
Secondary dendrite arm spacing, SDAS, of dendrites depends on both the cooling rate and the chemical composition of the liquid. The SDAS value diminishes when the cooling rate increases. The quantitative relationship between the cooling rate and the SDAS depends on the chemical composition of the liquid [43]. The SDAS values measured in wedge-samples are shown in Figure 9. The smaller SDAS value corresponds to the FSX-414 sample, while the 304-SS sample has the largest value. Because the cooling rate of the MZ is approximately the same in all samples, the difference observed in the SDAS values indicates changes in the liquid composition. These chemical differences arise from the interaction of the liquid metal with the BM.
The porosity size in the wedge-samples increases when the thickness of the brazing gap increases. The porosity quantity in the wedge-samples was similar in all alloys, except in Age-Wasp where large cavities formed, see Figure 7b. The microstructural evolution of Z1 in contact with these cavities or large pores is limited compared with Z1 in contact with BNi-9, which indicates that these pores were formed during an early stage of treatment.
Several authors [8,16,21,39,40] have defined the PZ as the zone where intragranular precipitates are observed. In this work, it is observed that the PZ presents different features depending on the base metal. The PZ is the narrowest in the FSX-414 and 304-SS, and it presents a high density of small precipitates. The precipitates are found in a wider PZ in Sol-Wasp and Age-Wasp. In the Ni-Age-Wasp and Ni-Sol-Wasp, intergranular precipitates are observed in the widest PZ. In these later materials, it is observed in the PZ that small precipitates are concentrated in a narrow zone close to the base metal, BM, then the precipitates become larger and coexist with a film constituent, and finally become scarce until they disappear. The PZ [18,44] has been referred to by other authors as the Diffusion Affected Zone [8,12,13,16,21,40,45,46].
It is worth mentioning that in the Waspaloy samples, Z1 contains a region with intergranular films of a constituent with eutectic morphology; see Figure 10. These films have been named a eutectic mixture [47], liquid penetration [48], or liquid film [24]. They were liquid until the sample was extracted from the furnace, as inferred from its resemblance with the interdendritic constituent observed in the MZ.
The average thicknesses of Z1 and the PZ in the wedge-samples are presented in Figure 11. It was not possible to obtain comparable data corresponding to the Age-Wasp samples, due to lack of filler metal paste in the joint, as illustrated in Figure 7b. The thickness of Z1 in the Waspaloy alloys has values of 200–300 µm, in contrast to alloys FSX-414 and 304-SS, which have values of approximately 50 µm, as shown in Figure 11a.
Concerning the thickness of the PZ, in the Sol-Wasp it presents values between 200–300 µm and increases to 600–700 µm in the Ni-Age-Wasp and Ni-Sol-Wasp samples, which shows that the nickel plating affects the thickness of the PZ more than that of Z1 (Figure 11b). It should be noted that the thickness of the PZ in the different base metals does not follow the same tendency observed on Z1. According to Pouranvari et al. [45], the net effect of increasing the content of Cr + Mo + W + Nb in base metal accelerates the diffusion flux by promoting the in situ precipitation. The following order: SS-304, Sol-Wasp, and FSX-414 was obtained when the base metals were ordered by increasing content of the above-mentioned elements, or by the increase of their PZ width, which is in good agreement with Pouranvari’s idea. Ni-coated Waspaloy samples are excluded from this analysis, because they present a groove phenomenon that could enhance the extension of PZ, as will be seen later.
Furthermore, in Figure 8b, it can be observed that the precipitates in the PZ in the FSX-414 alloy appear between the initial dendritic tissue arms, while in 304-SS, Figure 8c, the precipitates follow the grain limit. It should be noted that, as a consequence of the solidification process, microsegregation between the dendritic arms appears. In the casting metals, such as FSX-414, this microsegregation could be revealed by metallographic etching.

3.2. Drop-Sample Characterization

Figure 12 shows the optical microscope images taken in the cross-section of the drop-samples. These micrographs show that the drop shape after treatment varies depending on the base metal, BM. In the Waspaloy samples, the BNi-9 drop maintains a spherical cap shape, but its radius of curvature depends on the presence of the Ni coating; this radius is smaller in Sol-Wasp and Age-Wasp than in Ni-Sol-Wasp and Ni-Age-Wasp. In alloys FSX-414 and 304-SS, the BNi-9 acquires a thin layer shape. These results indicate that the wettability of BNi-9 is better in FSX-414 and 304-SS than Ni-coated Waspaloys that, in turn, have a better wettability of BNi-9 than Waspaloy samples without Ni coating. According to the differences observed in the wettability behavior, cracks repairing in the Waspaloy parts must be more limited than in FSX-414 and 304-SS.
The modification of the thickness of filler metal paste, caused by the differences of wettability in the different materials, significantly influences the evolution of filler metal paste solidification. As revealed by several studies, it could be expected that the thickness of the filler metal paste solidified as a function of the root of the treatment time [24]. One hour of treatment was enough to solidify the BNi-9 drops in the 304-SS and FSX-414 samples, while in the in Sol-Wasp and Age-Wasp samples, the drop-samples show an MZ similar to that observed in the wedge-samples. The drops in the Ni-Sol-Wasp and Ni-Age-Wasp seem to be in an advanced solidification step with the solid, separated by a liquid interlayer. The dendritic aspect observed in these drops is not to be confounded with that corresponding to a solidified liquid when the sample is taken out from the furnace.
The drop-samples show pores whose size rises when the drop thickness increases, which is also observed when the MZ increases in the wedge-samples. In the samples of Sol-Wasp, Age-Wasp, Ni-Sol-Wasp, and Ni-Age-Wasp, there are large pores with diameters of approximately 100–600 μm, while in 304-SS and FSX-414, where there is no MZ, and the pores in the ISZ have a diameter smaller than 100 μm. Some other porosities with a dendritic contour, the shrinkage pores, are also observed in the Sol-Wasp, Age-Wasp, 304-SS and the FSX-414 samples.

3.3. Chemical Microanalyses

The linear profiles of the elemental composition were obtained by the Energy Dispersive X-Ray Spectroscopy, EDS technique, throughout the BM, Z2, PZ, Z1, and MZ zones found in the central part of selected drop-samples and wedge-samples. The Z2 is the zone between PZ and BM, where interstitial diffusion could yet occur. The linear profiles are presented to give an idea of the tendency of the concentration profile, considering that EDS analyses, when applied without calibration with a standard sample, give a semiquantitative value for certain elements such as Ni, Cr, Co, etc., while for other elements, such as B, N, O, C, this technique gives results that are of a rather comparative nature.
Figure 13 shows the line scan of the composition corresponding to the drop-sample of Ni-Sol-Wasp. This figure shows that for this sample, elements such as Cr, Co, Ti, Mo, and Al diffuse from the BM to MZ, while Ni moves in the inverse direction. Boron tends to go from the MZ to the BM, and oxygen seems to do the opposite; an unclear tendency is observed in the rest of the analyzed elements. Figure 13 shows that from the MZ to the BM, the more pronounced changes in the solute profile of the substitutional elements occur in Z1 and the PZ. It could be expected that a diffusion zone, Z2, unrevealed by the linear scan, must be present between the BM and the PZ because interstitial elements such as B have higher diffusivities than substitutional elements. Using a similar EDS procedure to other authors [10,11,26,27,28,30], the presence of boron was detected in the precipitates around the grain boundary of small internal grains observed in Z2 of Ni-Sol-Wasp and Ni-Age-Wasp samples. This feature indicates that boron is present in this zone.
The feature of the main change in the concentration profiles of the substitutional elements observed in the PZ and Z1 was also observed in all the Waspaloy samples, as shown in Figure 14 and Figure 15. Be aware that the scale on the solute profile is not the same in all samples because the complete height of the drop was taken for the line scan; the height of the drop changes between drop-samples, as was previously pointed out.

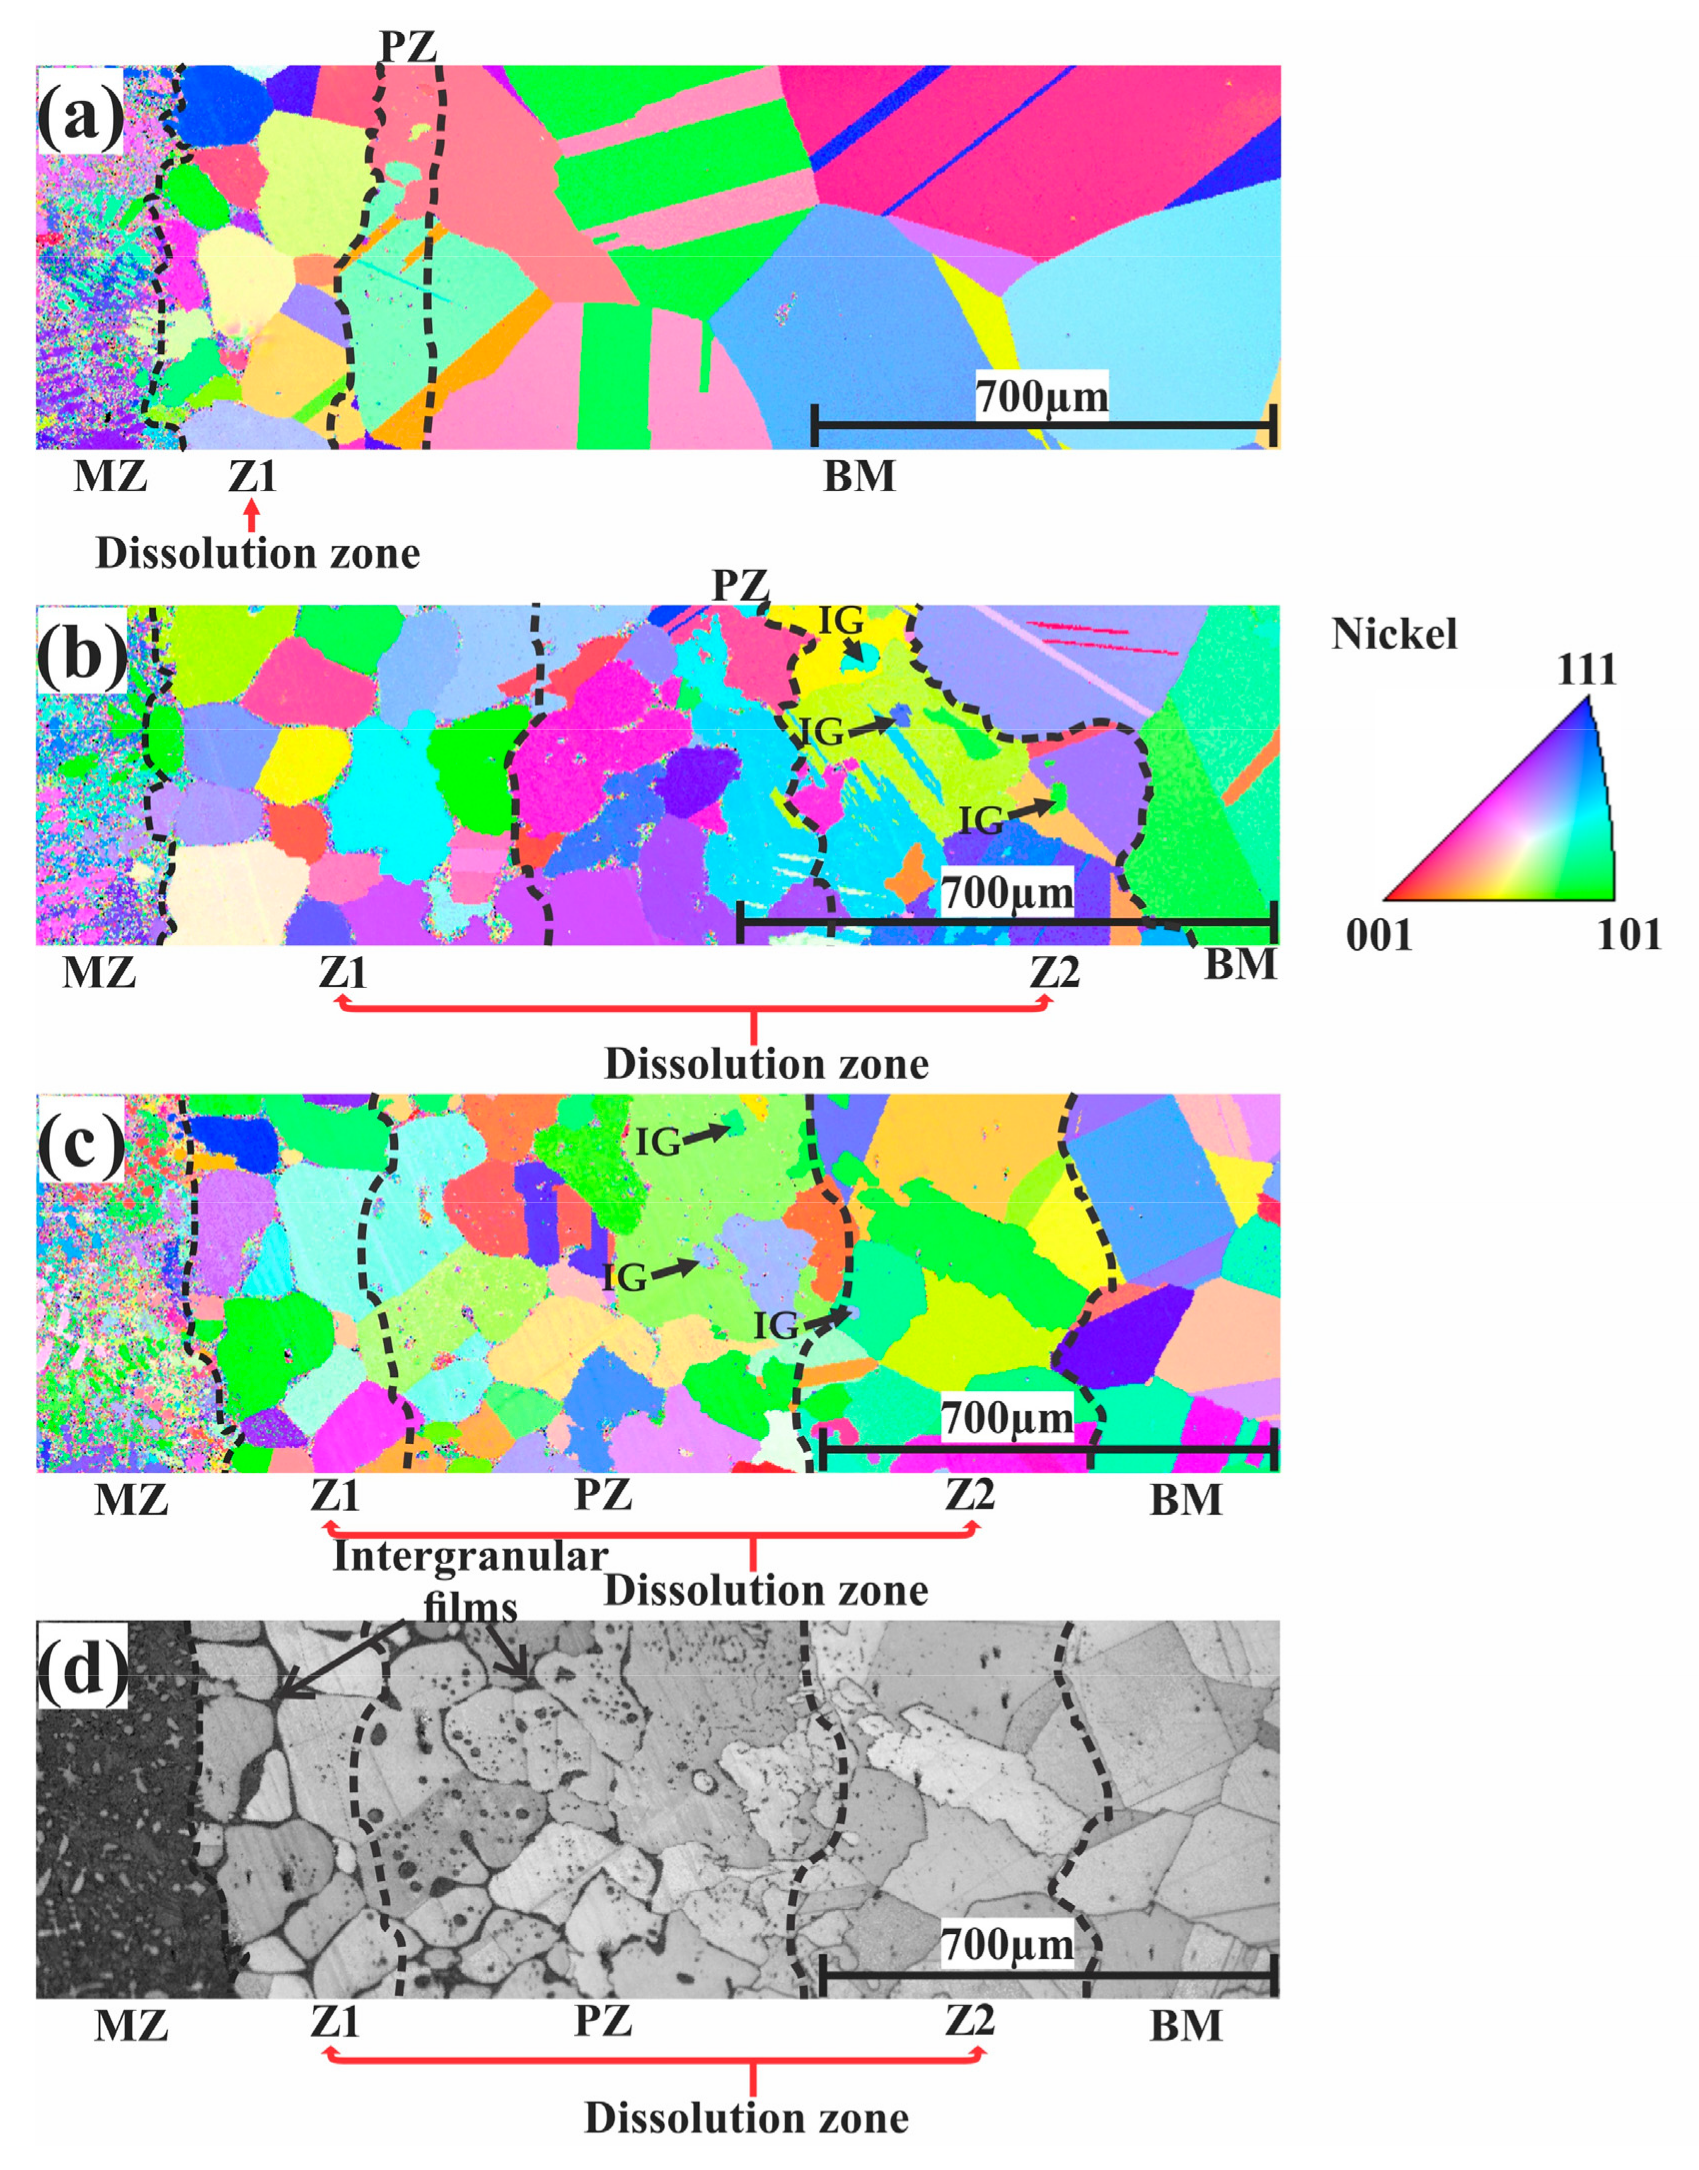
3.4. Evaluation of the Microstructural Orientation of the Brazed Waspaloy by EBSD

The ACOM map obtained by the EBSD technique reveals the grain orientation in the joint zone, which belongs to the following samples: Sol-Wasp, Ni-Sol-Wasp, and Ni-Age-Wasp (Figure 16). In all the samples, the ACOM maps reveal the absence of epitaxy among the base metal grains and small grains observed in the jointed zone. Furthermore, the inverse pole figure shows an aleatory grain orientation. Some twins are observed in the base metal grain, as well as small inner grains, IG, in the precipitation zone corresponding to the Ni-Sol-Wasp and Ni-Age-Wasp samples. In the samples of Ni-Age-Wasp and Ni-Sol-Wasp in Figure 16b,c, a zone with an intermediate size grain without twins is observed after PZ, which could be associated with the Z2 presence. This kind of zone is not observed in uncoated samples (Sol-Wasp), Figure 16a. It should be mentioned that the zones demarcated in the ACOM map in Figure 16c are consistent with the corresponding metallographic microstructure shown in Figure 16d.

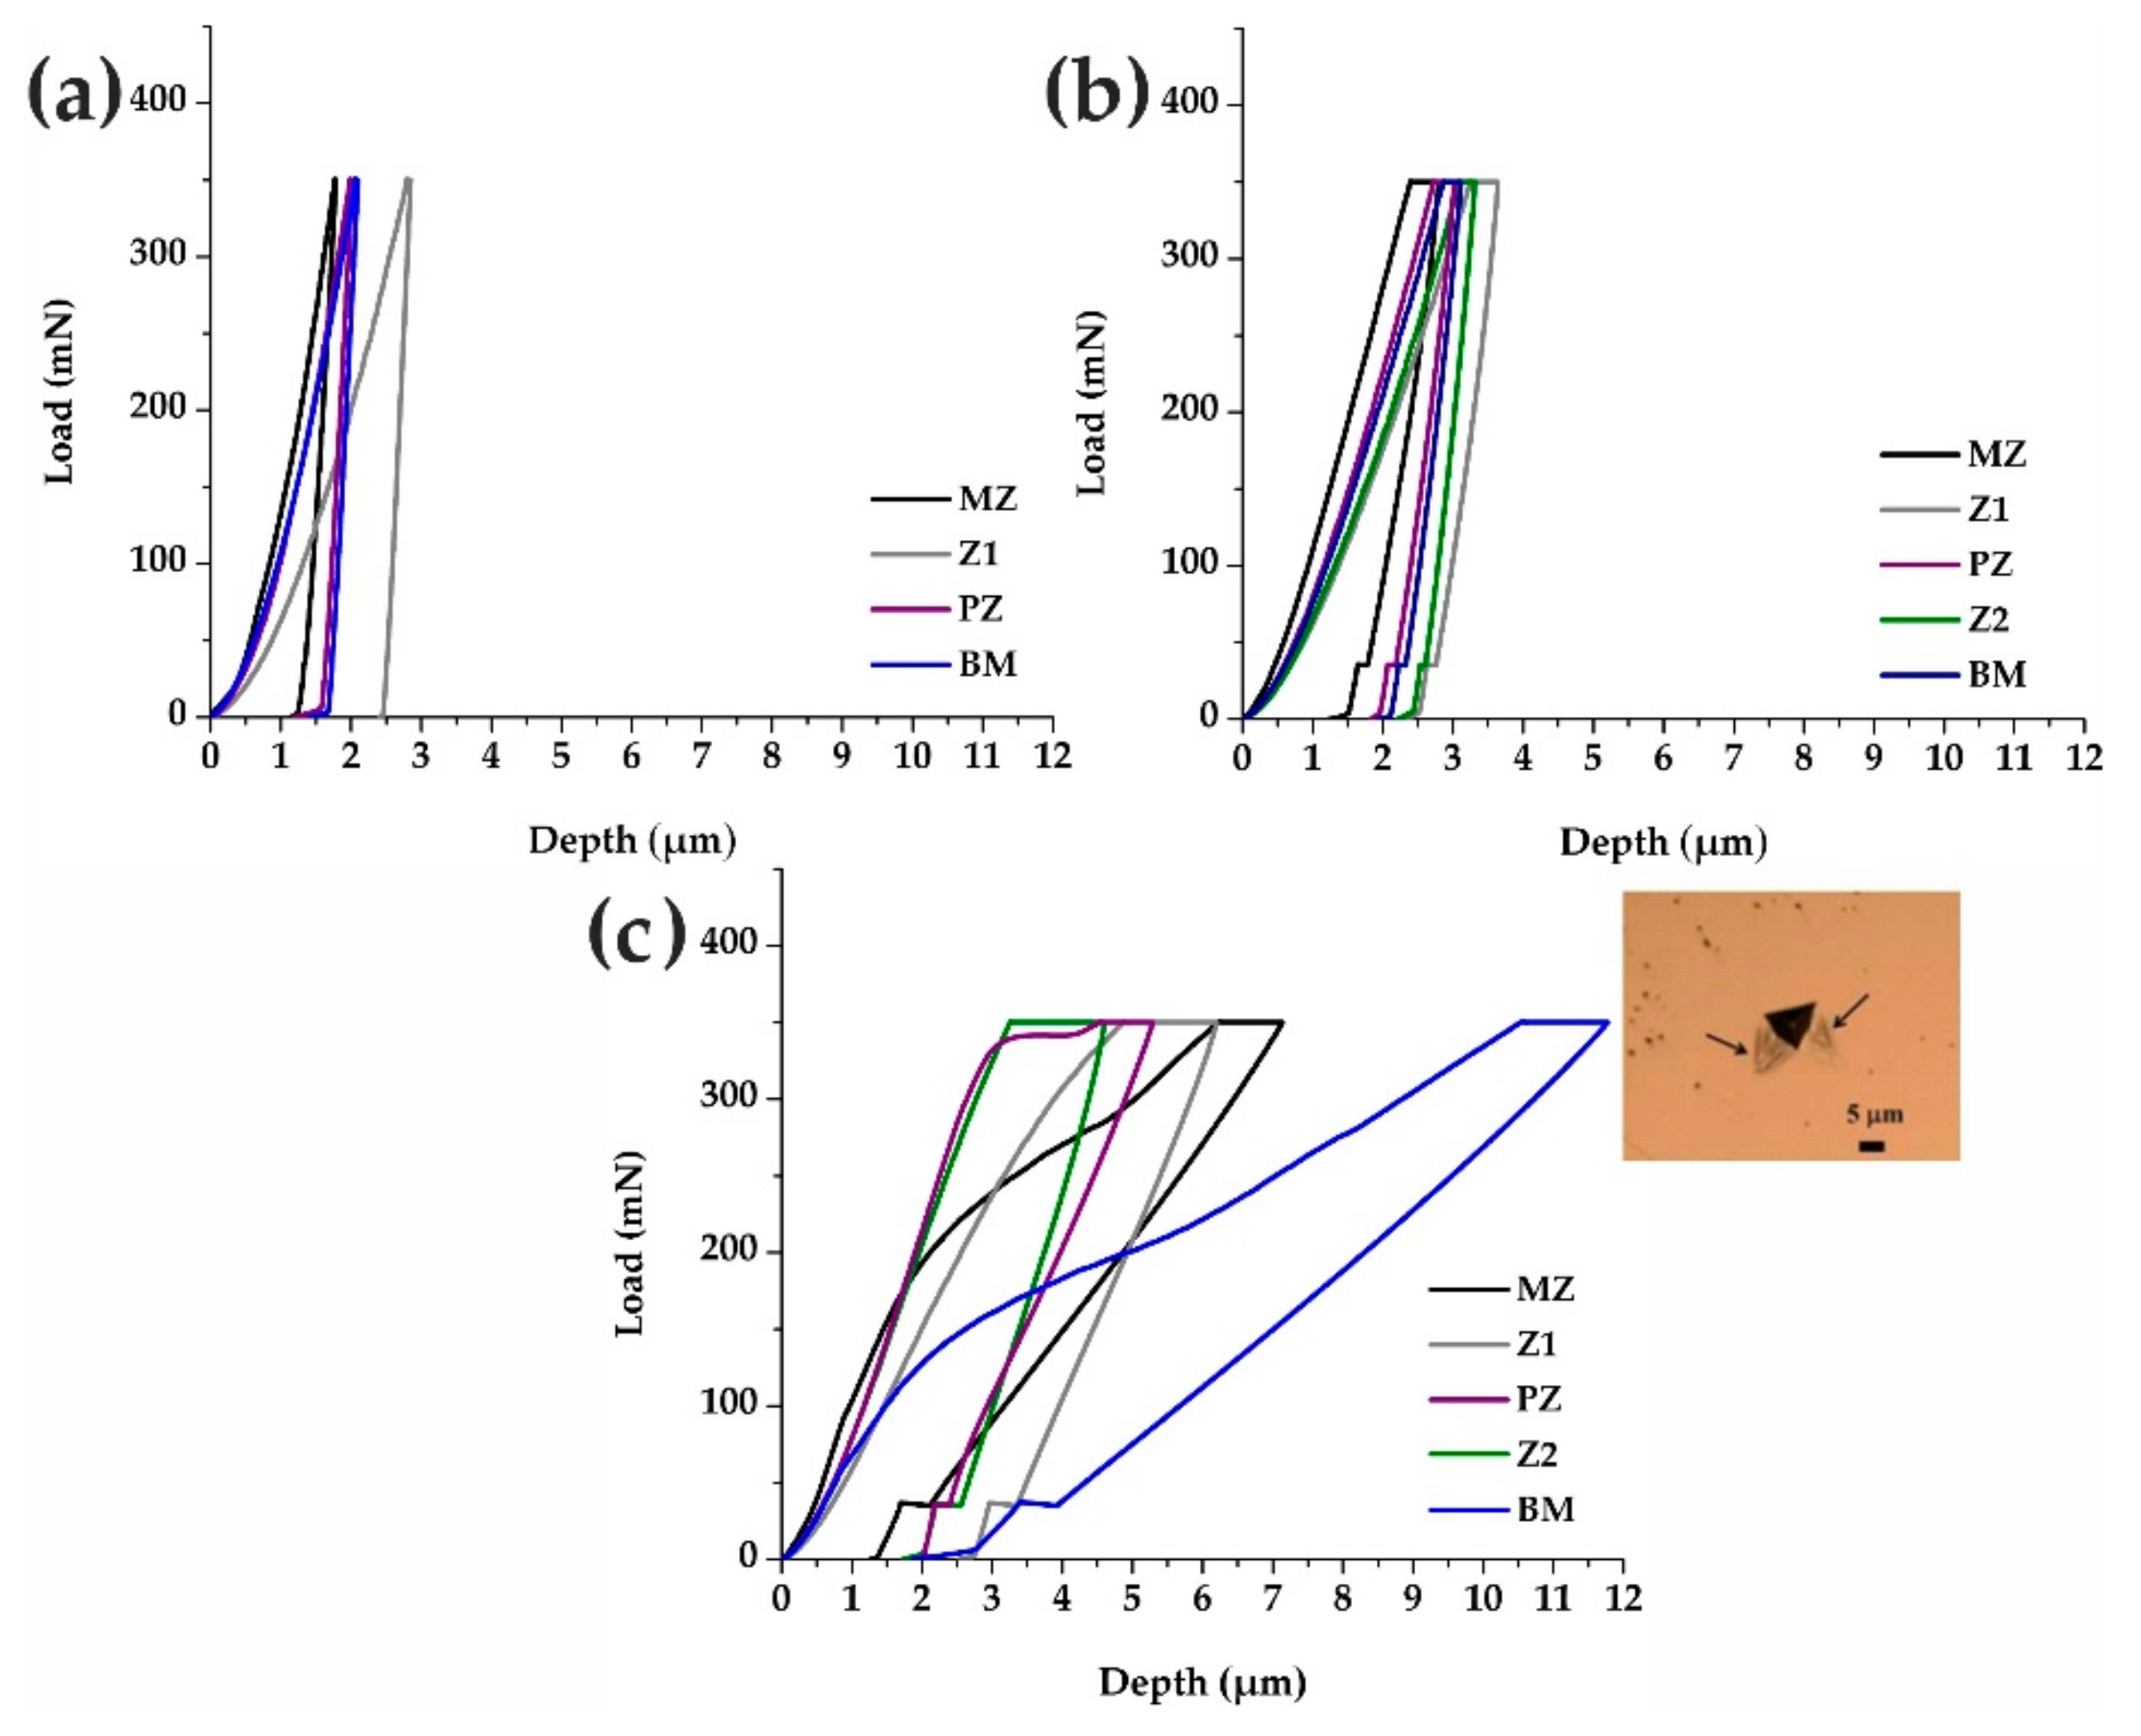
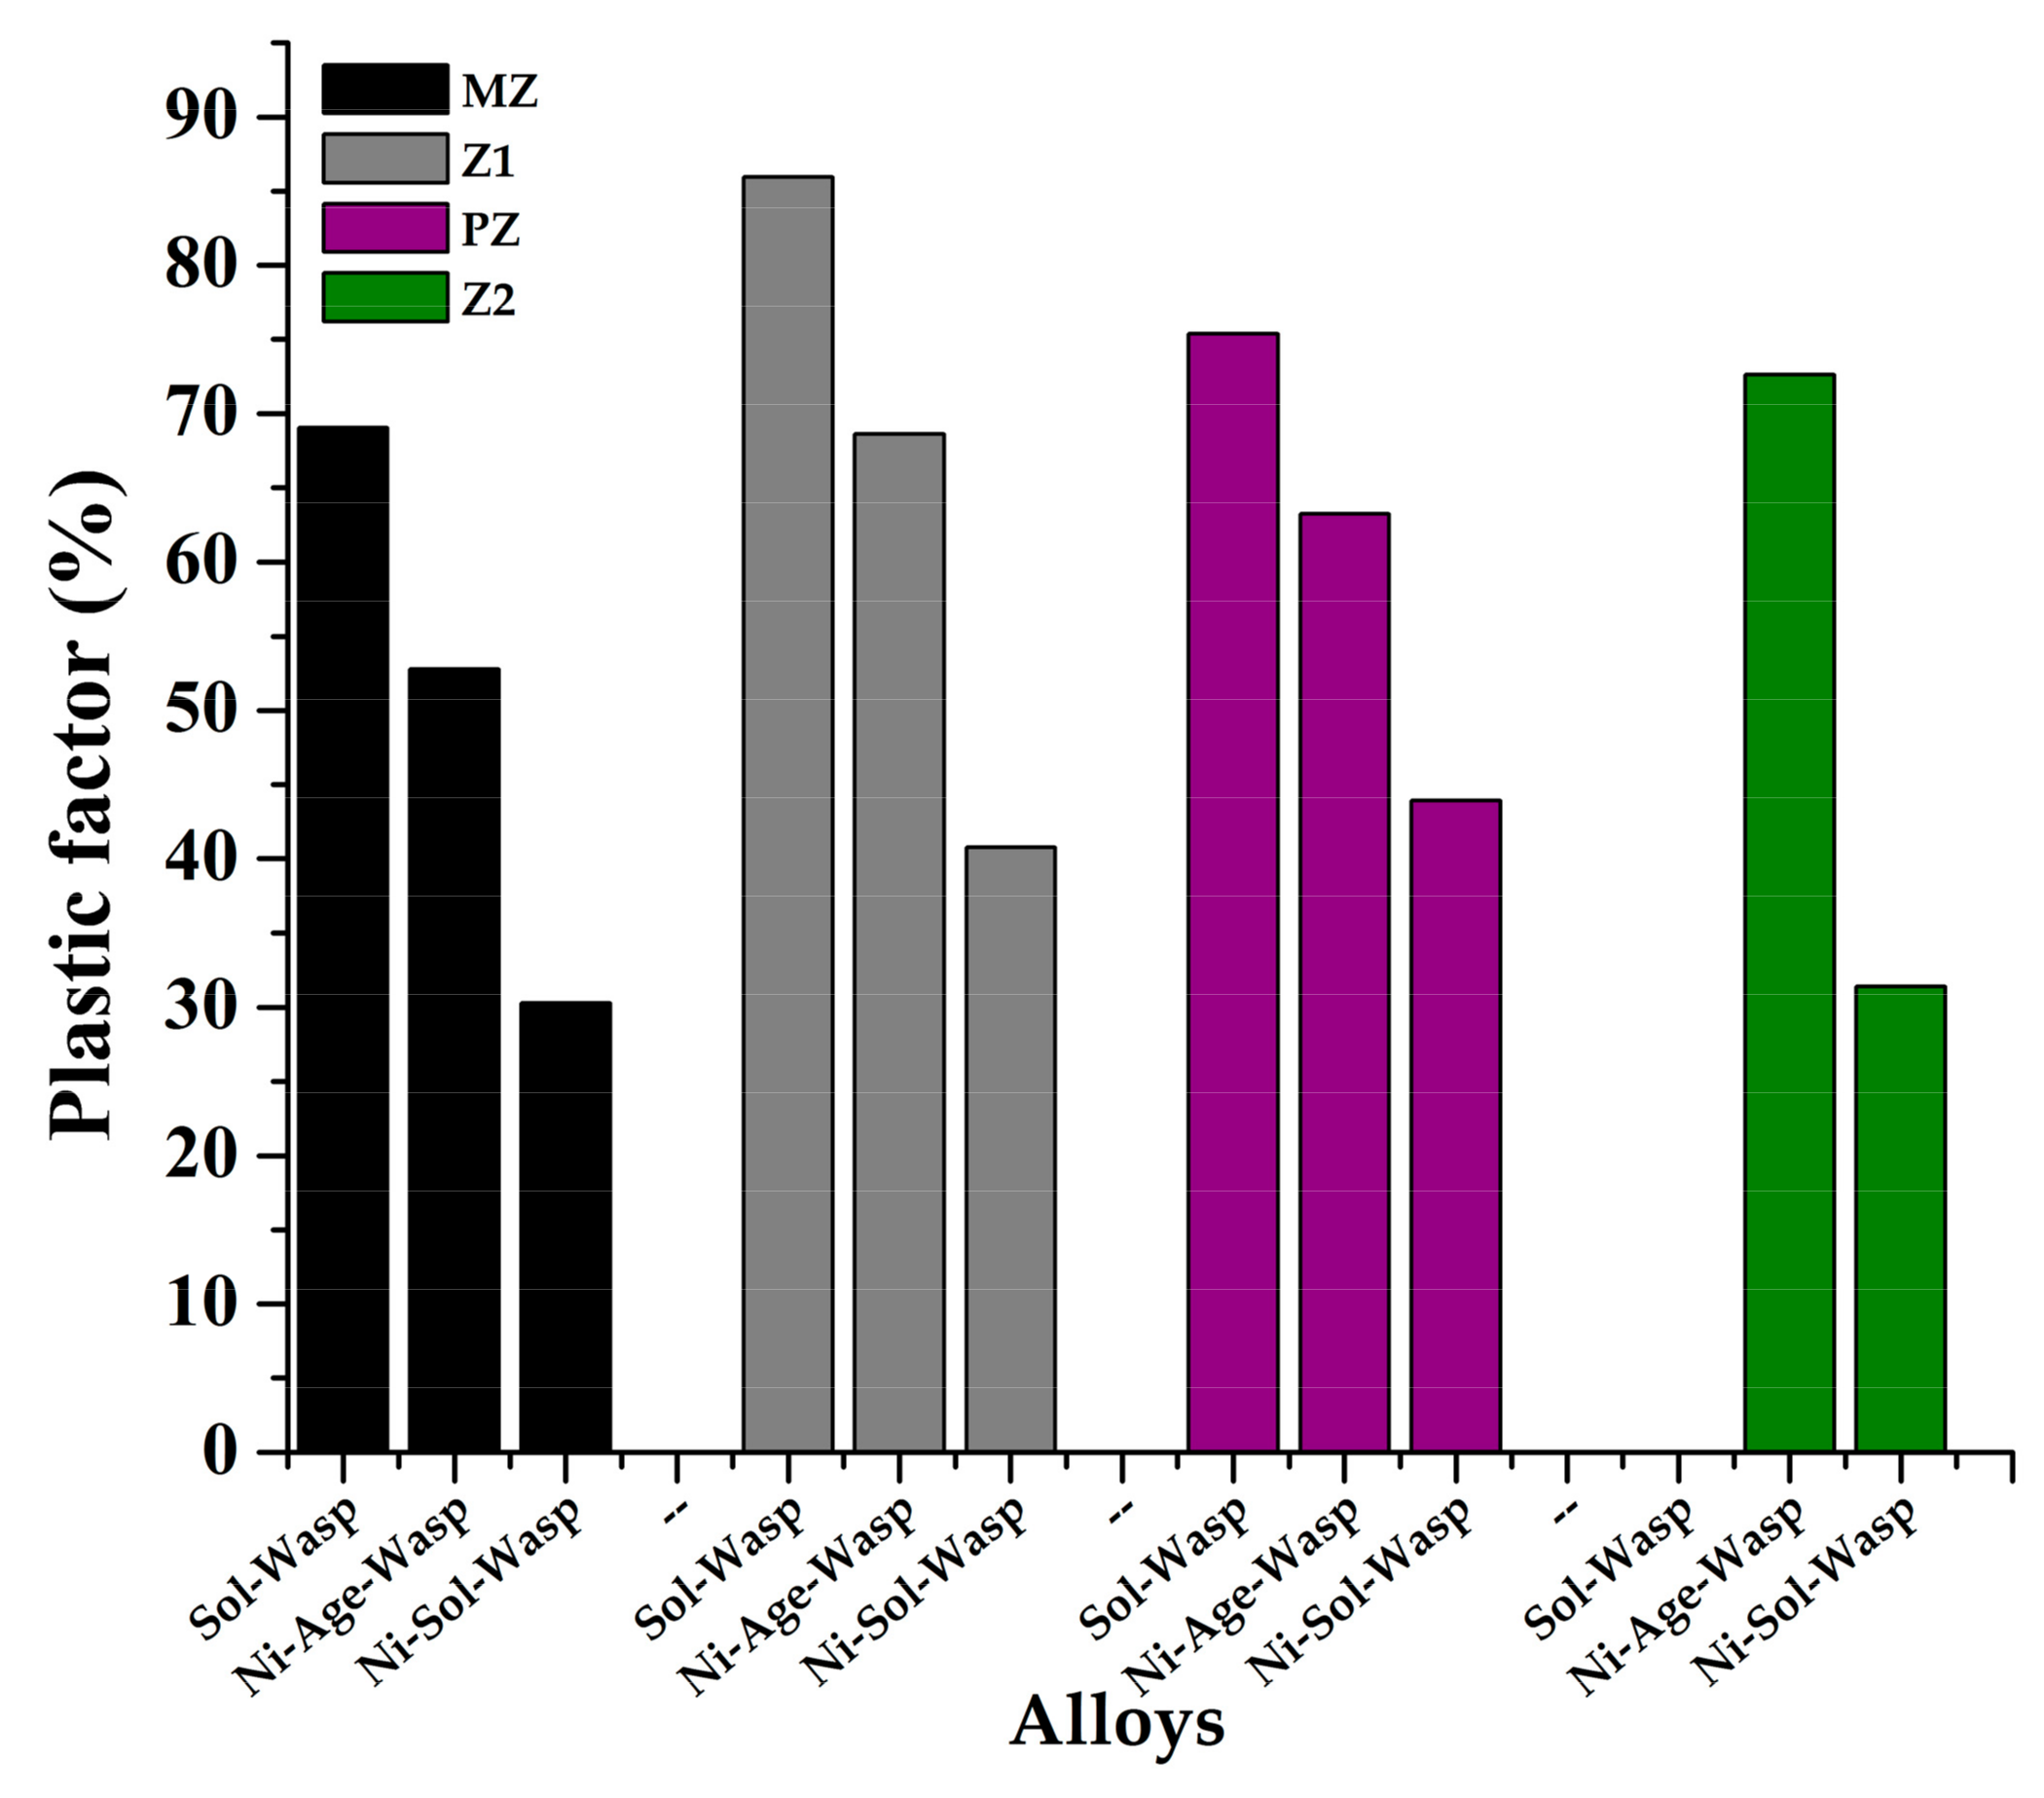
3.5. Evaluation of the Mechanical Properties of the Brazed Waspaloy by Nanoindentation
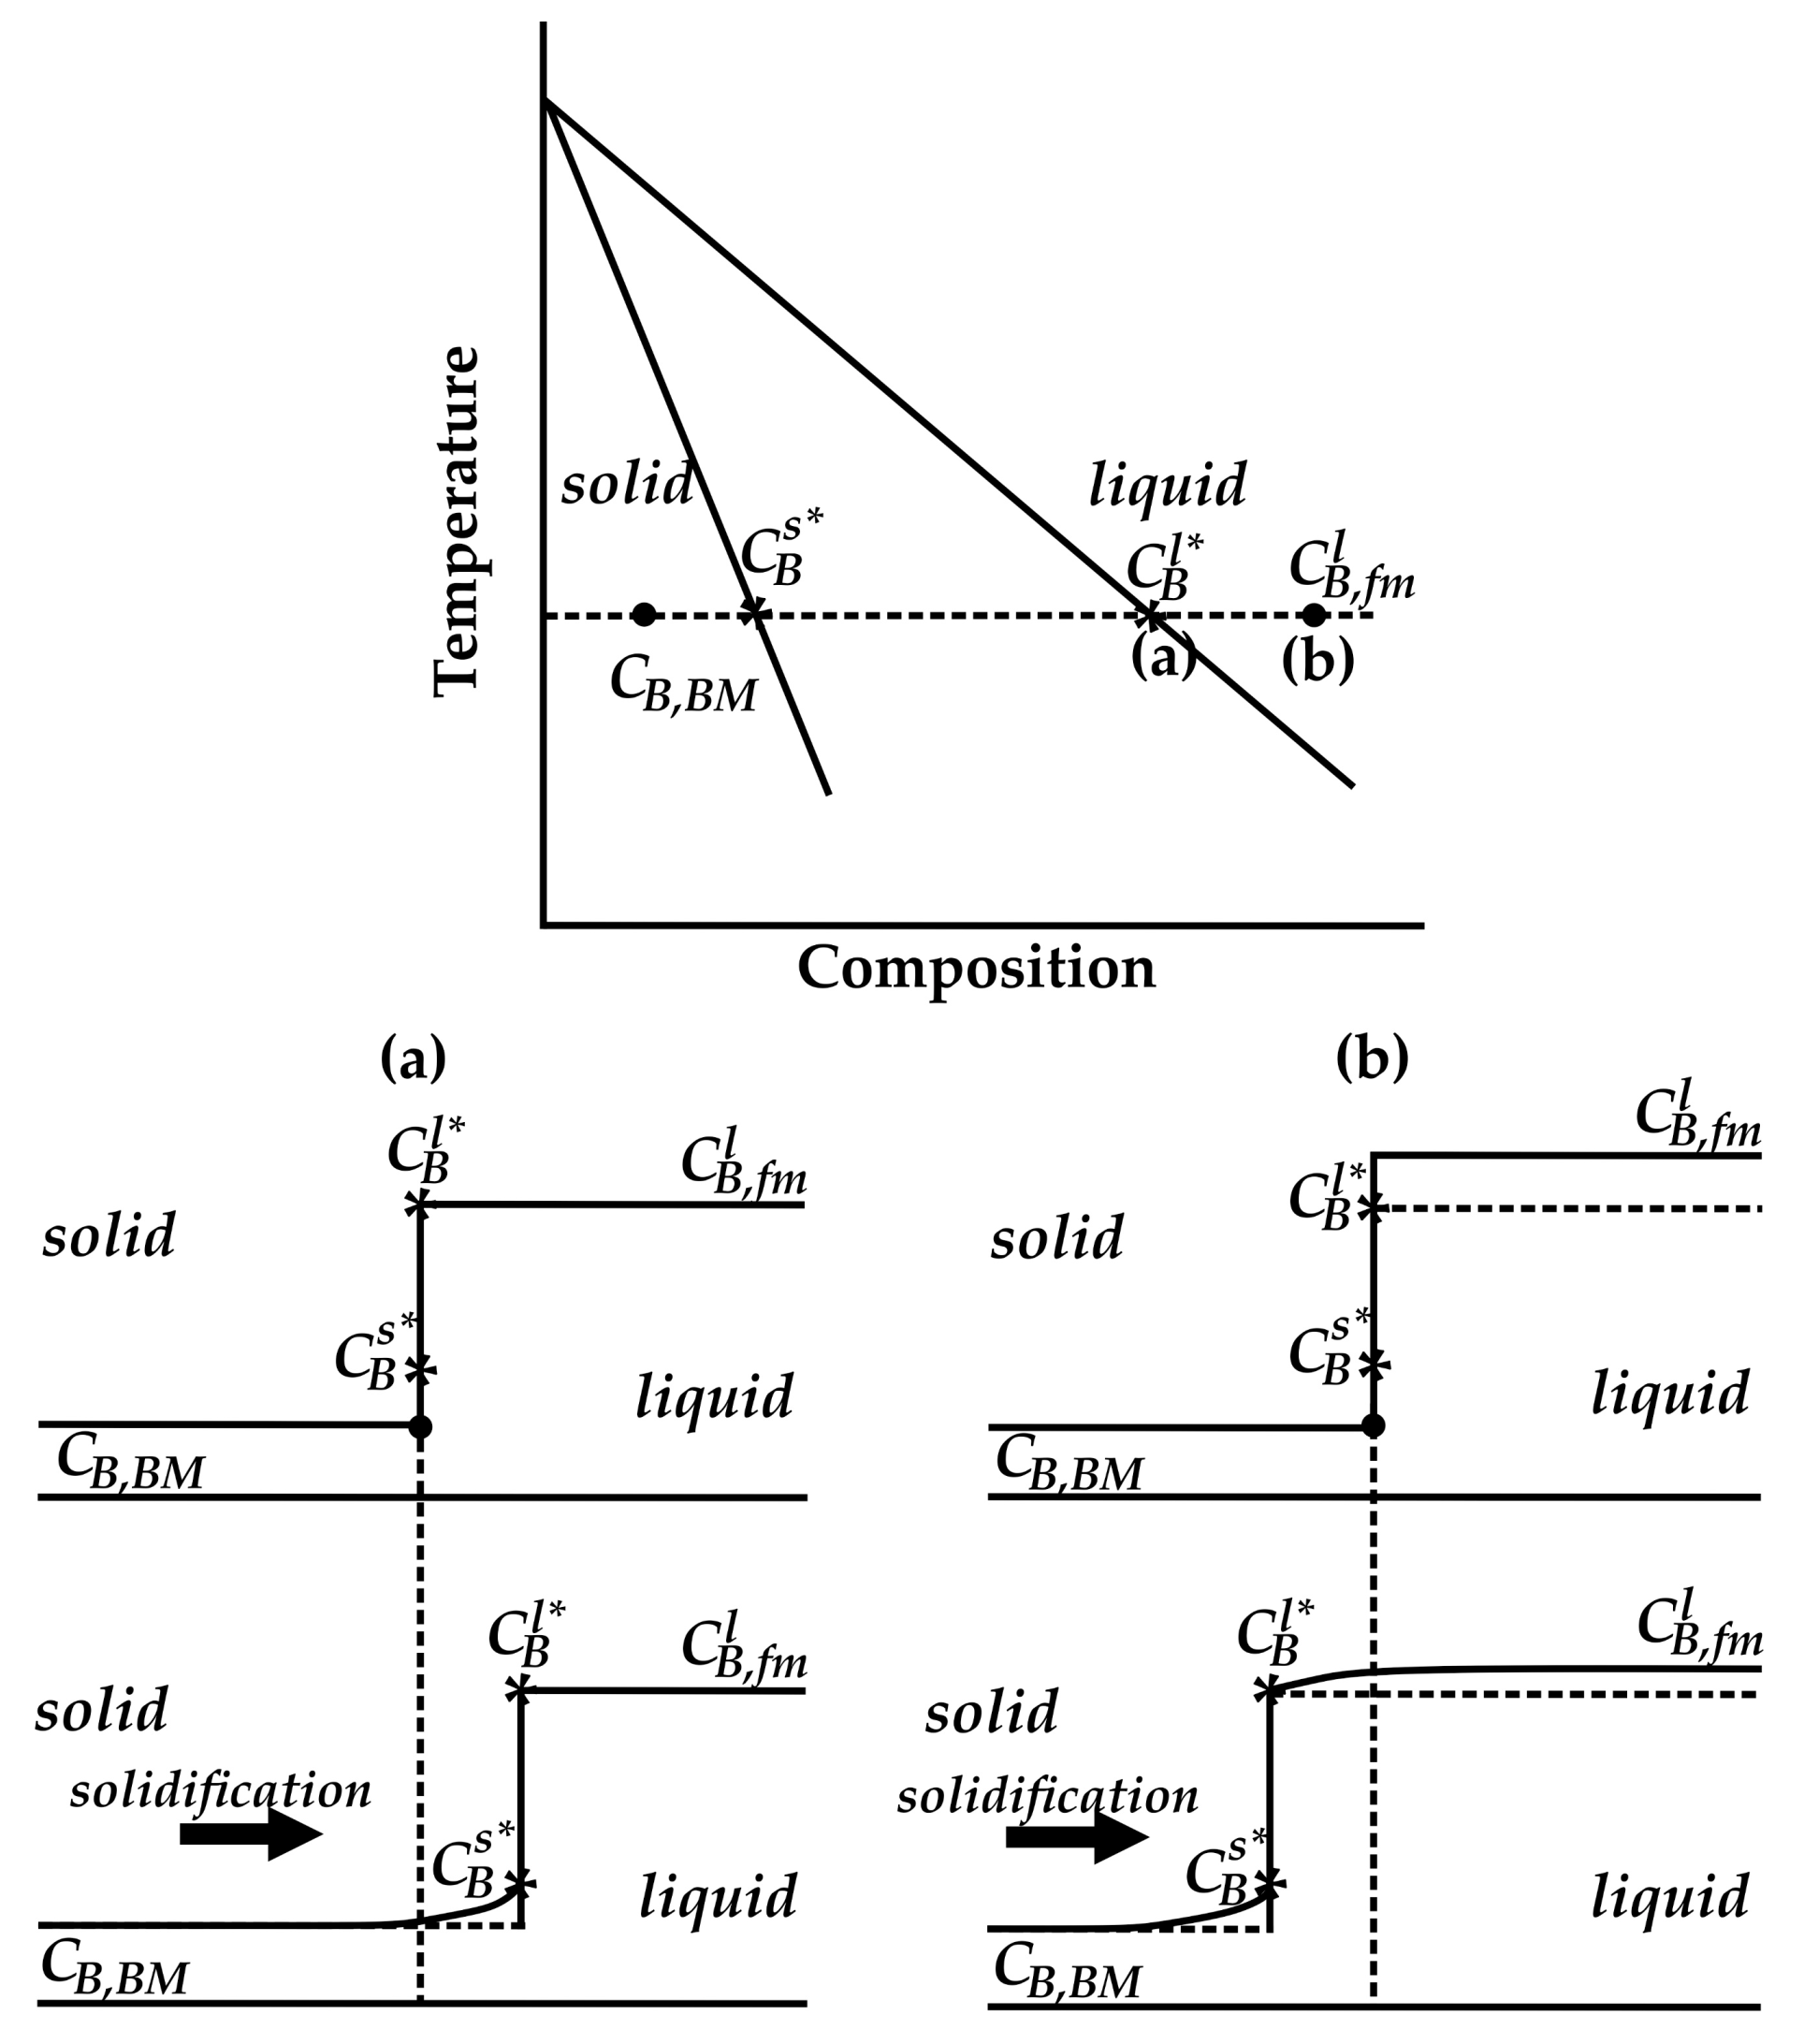
To further investigate the effect of coating in the possible formation of the two diffusion zones, Z1 and Z2, load-unload curves with nanoindentation were developed in brazed samples of Sol-Wasp, Ni-Age-Wasp, and Ni-Sol-Wasp. The load-depth curves of nanoindentation performed in selected microstructural zones are shown in Figure 17. The brazed Sol-Wasp, Figure 17a, shows an elastic behavior in all tested zones, i.e., the loading part of the indentation cycle consists of an initial elastic contact, followed by plastic flow at 350 mN. In addition, the brazed Ni-Age-Wasp, Figure 17b, shows a behavior as a viscoelastic solid [49,50] at 350 mN. Unlike the brazed Ni-Sol-Wasp, Figure 17c evidence an atypical shape of the load-depth curves because they show non-linear events, such as a permanent deformation that involves a plastic flow. Comparatively, the tested zones for Ni-Age-Wasp and Ni-Sol-Wasp (see Figure 17b,c) had different amounts of creep displacement at the maximum force hold time. The Ni-Age-Wasp had the least amount of creep and Ni-Sol-Wasp had the most, because it had the plastic deformation at the maximum load hold time. This creep is associated with the dislocation motion [51].
Figure 18 shows the plasticity factor of each zone for Sol-Wasp, Ni-Age-Wasp, and Ni-Sol-Wasp. In Z1, a higher plasticity factor of approximately 86%, corresponds to the Sol-Wasp sample, followed by Ni-Age-Wasp sample with 69% ηΡ, while Ni-Sol-Wasp shows the lowest ηΡ value of 41%. When comparing the ηΡ values in the same zone of the different samples, similar rankings are observed. In the case of Z2, the plasticity factor of the Ni-Age-Wasp sample is higher than the Ni-Sol-Wasp sample.

4. Discussion

Due to the relatively long duration of isothermal brazing, the diffusion phenomena are relevant when explaining the microstructure formation during this process. From the thermodynamic point of view, the system reaches equilibrium when the chemical potential of each element, x, y, z..., in different phases, 1, 2, 3…, are equal, i.e.:
μ x 1 = G 1 n x = μ x 1 = μ x 2 = μ x 3 ; μ y 1 = G 1 n y = μ y 1 = μ y 2 = μ y 3 ; μ z 1 = G 1 n z = μ z 1 = μ z 2 = μ z 3
Then, the brazing microstructure results from system evolution towards such an equilibrium, which is not achieved because of limits imposed by time in the diffusional phenomena, leading to chemical heterogeneities.
During brazing, the diffusion of both substitutional elements, Ni, Cr, Co and Mo, and interstitial elements, H, B, C, N, and O, occurs. Typically, the latter has diffusion coefficients one thousand times higher than the former [52].
Several authors [24,47,53] have analyzed the evolution of isothermal solidification in the brazing process. The main ideas needed for this discussion are the following. In the solidification process, it is considered that thermodynamic equilibrium is established at the liquid/solid interface, l/s. The brazing temperature is then chosen to avoid an incipient melt of the base metal and allows the filler metal paste to be fully liquid. Considering the binary system Ni-B, let us assume that liquid is at the instant heat and put in contact with a-based metal at the same temperature. Ideally, if the paste filling metal has a composition that corresponds to liquidus, then the isothermal solidification implies that the concentration of boron in the solid at the l/s interface evolves to equilibrium, as schematized in Figure 19a. Another possible situation is that the boron content in the liquid exceeds the liquidus composition. In this case, before isothermal solidification occurs, partial melting of the base metal could occur to obtain liquid with a liquidus composition at the l/s interface, see Figure 19b.
The general behavior of isothermal solidification of binary alloys must be applicable in the brazing of industrial alloys. However, additional complexity appears later because of the introduction of more degrees of freedom. In poly constituted alloys, the composition at the interface liquid/solid could progress by a set of tie lines; i.e., it is not restricted to only one tie line, as occurs in a binary system. Additionally, paraequilibrium could be present. In paraequilibrium, only the more mobile elements are equilibrated, while the slow ones behave as a single element [54,55].
According to the aforementioned, the segregation of chemical elements in the brazed zone could provide some ideas for brazing evolution. As shown previously, Figure 14, in the FSX-414 and 304-SS samples, the concentration profile presents a more pronounced change compared to the Waspaloy samples, and this change is related to the transition between Z1 and the PZ. Furthermore, an inspection of the microstructure of samples suggests that in samples FSX-414 and 304-SS, Z1 corresponds to isothermally solidified metals. In this case, the grains of the BM and PZ are easily distinguished when compared with the Z1 grains. The solute profile in these samples indicates that a solid with a chemical composition different from that of the base metal is produced by isothermal solidification, as could be expected by the important differences in the chemical composition of the BM and BNi-9. The Z1 values in FSX-414 and 304-SS samples are around 50 μm, see Figure 11, which means that the whole width gap that could be treated in these materials under tested conditions is 100 μm, 50 μm solidified from each side.
In the Waspaloy samples, Figure 14 and Figure 15, based on the chemical composition profiles, it is not possible to determinate whether all of Z1 corresponds to isothermally solidified metal.

4.1. Microstructural Evolution of Z1

In the samples of FSX-414 and 304-SS, the solidification front, where the MZ change to Z1, presents a characteristic structure of cellular growth front, i.e., some protuberances maintain a morphological similarity along the solid/liquid; see Figure 7e,f. Cellular growth is obtained with relatively low solidification rates [56], compared to those associated with the dendritic structure found in castings. In the case of brazing performed, considering as a first approximation the thickness values Z1 as ISZ, a growth rate of 48–51 µm/h is found for the FSX-414 and 304-SS samples. This low growth rate results from the growing dependence on the diffusional phenomena [8].
In the case of Waspaloy alloys, small grains are observed in the solidification front close to MZ, and below these other grains are observed, which sometimes seem similar to a continuation of the even larger grains found in the BM, as shown in the Figure 7a,c,d. MacDonald [57] mentioned that similar morphologies observed in the copper-silver system are instead due to the action of grain boundary grooving caused by surface tension coupled with the migration of the l/s interface. However, in Waspaloy samples, the grain size close to the MZ is smaller than the grain size in the BM, grooving must therefore proceed in more sites than the boundary grain. As will be seen later, the formation of new solid is in some ways complex, and perhaps several phenomena are involved in its development. The cellular growing possibility is analyzed here because it could at least apply to the start-up of isothermal solidification.
The origin of cellular growth is the diffusion path established by elements involved in isothermal solidification, as schematized in Figure 20. Some elements, such as Ni and B, go from liquid to solid. It is expected that this transport direction must stabilize a planar front of solidification. On the other hand, some elements, such as Cr, Co, Mo, etc., move from solid to liquid. This diffusional process promotes instability of the solid/liquid interface because ahead of this interface the liquid can absorb more of these elements. Similar reasoning must be applicable in the cellular front formation in the FSX-414 and 304-SS samples. According to Kurz and Fisher [58], when the temperature is the same for the entire l/s interface, the local interface curvature must be adapted following the local solute concentration to maintain thermodynamic equilibrium. Negative curvature, as in grooves, appears when the solute concentration depresses the local liquidus temperature. This groove could grow in the opposite direction of the isothermal solidification.
Following this idea, in Waspaloy samples, isothermal growth is realized in such a way and groove development is so important that the microstructure of the brazing zone shows more complex features than those observed in the FSX-414 or 304-SS samples. Additionally, the experimental results suggest that for some reason groove development is more intensive in the Waspaloy samples with Ni coating than without it. Such behavior could explain, for example, that Z1 is more extended in the samples with Ni coating than in samples without this coating. It could be that the surface roughness obtained by the Ni coating improves the groove development, a feature perhaps related to the wettability improvement of the BNi-9 compared with Waspaloy without Ni coating.
With cellular growth, an epitaxy between the BM grains and ISZ grains could be expected; then, its absence, as revealed by ACOM maps (Figure 16), suggests that cellular growth does not apply to the complete microstructure evolution; the presence of a small inner grain shows that some recrystallization could be possible, which shows that the obtained brazed microstructure could be a result of the combination of several phenomena. More work is needed to elucidate this microstructural evolution.
When comparing the ηΡ values corresponding to Sol-Wasp and Ni-Sol-Wasp, it is revealed that Ni coating lowers the plastic factors of all the tested zones. That could be a consequence of the more intensive penetration of liquid films observed in Ni-Sol-Wasp. The availability of a higher concentration of solutes, such as B, seems to reduce the strengthening mechanisms. In this case, the diffusion of B from a filler metal paste to the solid can improve the formation of compounds or coherent phases in the Ni-rich matrix, since the mechanical properties can depend on the lattice mismatch among the precipitates and matrix as well as its orientation dependence [59,60]. This effect of the increase in boron content could be associated with the lower ηΡ value, corresponding to Z2 of the Ni-Sol-Wasp samples, compared with the Ni-Age-Wasp samples, see Figure 18. In the Ni-Sol-Wasp samples, the liquid film penetration is the most extensive.
The differences observed in the ηΡ values of different samples suggest that the isothermally solidified metal could present some differences depending on the interaction between the liquid and solid, which might lead to different conditions of the local thermodynamic equilibrium established in the corresponding liquid/solid interface.

4.2. Microstructural Evolution of the MZ

It is known that there are two mechanisms of formation of porosity during solidification: shrinkage and gas [56]. Gas porosity appears during solidification via the oversaturation of liquid metal by dissolved gases. This occurs if dissolved gases are more soluble in the molten alloy than in the formed solid. In this case, during solidification the gas dissolved in the solidified liquid is expelled to the remaining liquid; consequently, the gas concentration in the melt increase. The gas porosity in the liquid appears if the pressure of the gas corresponding to equilibrium with the dissolved element, Peq, exceeds, to some extent, the pressure applied to the melt, Pm. The amount of this excess pressure depends on the energy needed to overcome the capillarity effects in the nucleation of the gas pore. When the gas pore is formed in the melt, it has a spherical morphology, as observed in the MZ of all brazed samples obtained in this work. That means that the initial melt had an important quantity of dissolved gases [61,62,63,64]. Some chemical reactions in the melt could also produce gases, such as the formation of CO.
The brazing paste used in this study, even in the calcinated form, has a relatively high concentration of oxygen, nitrogen, hydrogen, and C, as shown in Table 3. If only dissolved gases promote pore formation, then the pore formation could be avoided if Pm is increased when using a similar braze paste. Unfortunately, the device used in this work does not allow for a safe increase in argon pressure to test this idea. However, some trials with lower pressure were performed, and as expected, the brazed samples showed more porosity. While which gas promotes pore formation still has to be determined, it is worth mentioning that nitrogen may not be responsible for the porosity observed because it has been reported that in some Ni or Co-based alloys [65], nitrogen is more soluble in the solid than in the liquid. The formation of CO, for example, cannot be discounted for further works.
When using both the same brazing paste and Pm, the quantity of gas porosity must depend on a global solute balance between the initial gas dissolved in the melt, the gas into the pores, the gas leaked to the furnace atmosphere, and the gas kept in the solid. The similitude on the quantity of gas porosity observed in all wedge-samples, with the exception of the Age-Wasp samples, means that such a balance gives quite similar results in all of these samples. More work is needed to determine the reason for the dissimilar behavior of the Age-Wasp samples.
In the drop-samples, porosity by gas is also observed, see Figure 12. However, some shrinkage pores are also observed. It is expected than the shrinkage pores appear in the last stage of isothermal solidification of BNi-9. As pointed out before, as a consequence of wettability, the height of the drop is diminished from the Wasp samples to the Ni-Wasp samples, then to FSX-414 and finally to 304-SS. As changes in the isothermal solidification mechanism are not expected, the observed shrinkage pores mean that the solidification velocity is enough to complete solidification in the drops with a short height, as observed in the FSX-414 and 304-SS samples. Shrinkage is a factor to keep in mind because it favors the porosity at a given gas level in BNi-9.

5. Conclusions

Under the experimental conditions tested in this study, repairing gas turbine components by brazing with BNi-9 paste is more favorable for FSX-414 and 304-SS than for Waspaloy because of their better wettability with the melt of this paste. However, the wettability of this melt in the Waspaloy samples is enhanced with Ni coating, which increases the possibility of applying this repairing technique in such materials.
The results also suggest that both a filler metal paste less prone to expelling gaseous species during its solidification and high-pressure brazing treatment is needed to obtain suitable crack repairing using this filler metal paste.
The isothermally solidified metal could not be clearly defined in the Waspaloy samples, as was the case in the FSX-414 and 304-SS samples. The microstructural evolution of the treatment-affected zone of the Waspaloy samples is rather complex. In these samples, small grains surrounded by a liquid film were observed closer to the Z1.
The zone where the liquid films between the grains are observed in the Waspaloy was more extended in Waspaloy with Ni coating than in Waspaloy without this coating. This feature shows that the Ni coating improves the groove’s growth, which could provide a way to shorten the time of the brazing treatments, considering that the brazing is limited by solutes transport. The groove development seems to proceed at other locations instead of only in the boundaries of the initial grains.
The ACOM maps performed in the Waspaloy samples do not reveal an epitaxial relationship between the small grains in contact with the melting zone and the grains under them, which shows the complexity of the brazing phenomena in these types of alloys. While cellular growth could explain the size regularity of these small grains, the absence of texture revealed by the ACOM maps shows that some other phenomena, such as recrystallization, are involved in the formation of the observed microstructure. This recrystallization could take place in the diffusional zone, as suggested by the small internal grains that appear after the precipitation zone in the Ni-Age-Wasp and Ni-Sol-Wasp. Further work is needed to elucidate the involved mechanisms that form the microstructure of the jointed zone.
The higher plasticity factor (ηΡ) in Z1 corresponds to the Sol-Wasp sample with a value of 86%, i.e., it has the highest plastic strain resistance, followed by the Ni-Age-Wasp sample with an ηΡ value of 69% and the Ni-Sol-Wasp with an ηΡ value of 41%. This tendency is correlated with the width of the diffusive zone; the np value is low when the width of this zone increases. The effect of the extension of the diffusive zone is also stated in Z2, where the plasticity factor of the Ni-Sol-Wasp sample is lower than the Ni-Age-Wasp sample.

Author Contributions

N.Y.F.-E. performed the experiments and characterization as part of her PhD activities; M.J.C.-R. and H.M.H.-G. provided the materials and supervised the development of the methodology; N.Y.F.-E., M.d.J.C.-R., H.M.H.-G., and M.H.-T. analyzed the data and wrote the manuscript together. All authors have read and agreed to the published version of the manuscript.

Funding

This research was funded by PEI Mexican Program, grant number 213605.

Acknowledgments

The author Norma Yolanda Flores-Escareño acknowledges the scholarship provided by the National Council of Science and Technology (CONACyT) for the realization of this work.

Conflicts of Interest

The authors declare no conflict of interest.

References

  1. Rabinkin, A. High-temperature brazing: Filler metals and processing. In Advances in Brazing; Elsevier: Amsterdam, The Netherlands, 2013; pp. 121–159. [Google Scholar]
  2. Van Esch, H.; Stover, J.T. Review of the State of the Art of High-Temperature Brazing for Combustion Turbine Components; Electric Power Research Institute (EPRI): Palo Alto, CA, USA, 2003. [Google Scholar]
  3. Nicolaus, M.; Möhwald, K.; Maier, H.J. A Combined Brazing and Aluminizing Process for Repairing Turbine Blades by Thermal Spraying Using the Coating System NiCrSi/NiCoCrAlY/Al. J. Therm. Spray Technol. 2017, 26, 1659–1668. [Google Scholar] [CrossRef]
  4. Nicolaus, M.; Möhwald, K.; Maier, H.J. Regeneration of high pressure turbine blades. Development of a hybrid brazing and aluminizing process by means of thermal spraying. Procedia CIRP 2017, 59, 72–76. [Google Scholar] [CrossRef] [Green Version]
  5. Nicolaus, M.; Rottwinkel, B.; Alfred, I.; Möhwald, K.; Nölke, C.; Kaierle, S.; Maier, H.J.; Wesling, V. Future regeneration processes for high-pressure turbine blades. CEAS Aeronaut. J. 2018, 9, 85–92. [Google Scholar] [CrossRef]
  6. Alfred, I.; Nicolaus, M.; Hermsdorf, J.; Kaierle, S.; Möhwald, K.; Maier, H.-J.; Wesling, V. Advanced high pressure turbine blade repair technologies. Procedia CIRP 2018, 74, 214–217. [Google Scholar] [CrossRef]
  7. Ye, Y.; Zou, G.; Long, W.; Jia, Q.; Bai, H.; Wu, A.; Liu, L. Diffusion brazing repair of IN738 superalloy with crack-like defect: Microstructure and tensile properties at high temperatures. Sci. Technol. Weld. Join. 2019, 24, 52–62. [Google Scholar] [CrossRef]
  8. Bai, K.; Lan Ng, F.; Tan, T.L.; Li, T.; Pan, D. Understanding non-parabolic solidification kinetics in Ni-based alloys during TLP bonding via thermo-kinetic modelling. J. Alloys Compd. 2017, 699, 1084–1094. [Google Scholar] [CrossRef]
  9. Arhami, F.; Mirsalehi, S.E.; Sadeghian, A.; Johar, M.H. The joint properties of a high-chromium Ni-based superalloy made by diffusion brazing: Microstructural evolution, corrosion resistance and mechanical behavior. J. Manuf. Process. 2019, 37, 203–211. [Google Scholar] [CrossRef]
  10. Wikstrom, N.P.; Egbewande, A.T.; Ojo, O.A. High temperature diffusion induced liquid phase joining of a heat resistant alloy. J. Alloys Compd. 2008, 460, 379–385. [Google Scholar] [CrossRef]
  11. Tokoro, K.; Wikstrom, N.P.; Ojo, O.A.; Chaturvedi, M.C. Variation in diffusion-induced solidification rate of liquated Ni–Cr–B insert during TLP bonding of Waspaloy superalloy. Mater. Sci. Eng. A 2008, 477, 311–318. [Google Scholar] [CrossRef]
  12. Riggs, B.; Alexandrov, B.; Benatar, A.; Xu, R. Metallurgical characterisations of CMSX-4 vacuum-brazed with BNi-2 and BNi-9. Sci. Technol. Weld. Join. 2017, 22, 227–235. [Google Scholar] [CrossRef]
  13. Riggs, B.; Alexandrov, B.; Benatar, A.; Xu, R. Microstructural characterization of single crystal superalloy CMSX-4 brazed joints with BNi-2 and BNi-9 filler metals. In Proceedings of the International Brazing and Soldering Conference, Long Beach, CA, USA, 19–22 April 2015. [Google Scholar]
  14. Riggs, B.B.; Alexandrov, B.B.; Benatar, A.A.; Xu, R.R. Thermodynamic and kinetic simulations of high temperature brazing: Microstructure evolution in CMSX-4 joints. Sci. Technol. Weld. Join. 2017, 22, 428–437. [Google Scholar] [CrossRef]
  15. Hdz-García, H.M.; Muñoz-Arroyo, R.; Martinez, A.I.; González, M.A.; Granda-Gutiérrez, E.E.; Acevedo-Dávila, J.L.; Castro-Roman, M.; García-Vázquez, F. Aging Thermal Treatment in the Inconel 725 Brazed Incorporating Tungsten Nanoparticles. J. Nanomater. 2016. [Google Scholar] [CrossRef]
  16. Bakhtiari, R.; Ekrami, A. The effect of gap size on the microstructure and mechanical properties of the transient liquid phase bonded FSX-414 superalloy. Mater. Des. 2012, 40, 130–137. [Google Scholar] [CrossRef]
  17. Yuan, X.J.; Kang, C.Y. Dissolution and Its Activation Energy during Transient Liquid Phase Bonding of Duplex Stainless Steel: Materials Research Innovations. Volume 17. No sup1. Available online: https://www.tandfonline.com/doi/full/10.1179/1432891713Z.000000000234 (accessed on 4 July 2019).
  18. Hdz-García, H.M.; Pech-Canul, M.I.; Muñoz-Arroyo, R.; Mtz-Enriquez, A.I.; Acevedo-Dávila, J.L.; Castro-Román, M.J.; Reyes-Valdés, F.A. 304 stainless steel brazing incorporating tungsten nanoparticles. J. Mater. Process. Technol. 2015, 215, 1–5. [Google Scholar] [CrossRef]
  19. Hdz-García, H.M.; Martinez, A.I.; Muñoz-Arroyo, R.; Acevedo-Dávila, J.L.; García-Vázquez, F.; Reyes-Valdés, F.A. Effects of Silicon Nanoparticles on the Transient Liquid Phase Bonding of 304 Stainless Steel. J. Mater. Sci. Technol. 2014, 30, 259–262. [Google Scholar] [CrossRef]
  20. Abbasi, K.B.; Asghari, G.; Bakhtiari, R. TLP bonding of dissimilar FSX-414/IN738 system with MBF80 interlayer: Prediction of solid/liquid interface location. Trans. Nonferrous Met. Soc. China 2014, 24, 996–1003. [Google Scholar]
  21. Abbasi, K.B.; Jahanbakhsh, A.; Bakhtiari, R. TLP bonding of dissimilar FSX-414/IN-738 system with MBF-80 interlayer: The effect of homogenizing treatment on microstructure and mechanical properties. Mater. Sci. Eng. A 2016, 651, 93–101. [Google Scholar] [CrossRef]
  22. Wu, X.W.; Chandel, R.S.; Seow, H.P.; Li, H. Wide gap brazing of stainless steel to nickel-based superalloy. J. Mater. Process. Technol. 2001, 113, 215–221. [Google Scholar] [CrossRef]
  23. Sadeghian, M.; Ekrami, A.; Jamshidi, R. Transient liquid phase bonding of 304 stainless steel using a Co-based interlayer. Sci. Technol. Weld. Join. 2017, 22, 666–672. [Google Scholar] [CrossRef]
  24. Ramirez, J.E.; Liu, S. Diffusion brazing in the nickel-boron system. Weld 1992, 71, 365–376. [Google Scholar]
  25. Yuan, X.; Kim, M.B.; Kang, C.Y. Characterization of transient-liquid-phase-bonded joints in a duplex stainless steel with a Ni–Cr–B insert alloy. Mater. Charact. 2009, 60, 1289–1297. [Google Scholar] [CrossRef]
  26. Idowu, O.A.; Richards, N.L.; Chaturvedi, M.C. Effect of bonding temperature on isothermal solidification rate during transient liquid phase bonding of Inconel 738LC superalloy. Mater. Sci. Eng. A 2005, 397, 98–112. [Google Scholar] [CrossRef]
  27. Ojo, O.A.; Richards, N.L.; Charturvedi, M.C. Effect of gap size and process parameters on diffusion brazing of Inconel 738. Sci. Technol. Weld. Join. 2004, 9, 209–220. [Google Scholar] [CrossRef]
  28. Ojo, O.A.; Richards, N.L.; Chaturvedi, M.C. Isothermal solidification during transient liquid phase bonding of Inconel 738 superalloy. Sci. Technol. Weld. Join. 2004, 9, 532–540. [Google Scholar] [CrossRef]
  29. Ojo, O.A.; Abdelfatah, M.M. On deviation from parabolic behaviour during transient liquid phase bonding. Mater. Sci. Technol. 2008, 24, 739–743. [Google Scholar] [CrossRef]
  30. Egbewande, A.T.; Chukwukaeme, C.; Ojo, O.A. Joining of superalloy Inconel 600 by diffusion induced isothermal solidification of a liquated insert metal. Mater. Charact. 2008, 59, 1051–1058. [Google Scholar] [CrossRef]
  31. Abdelfatah, M.M.; Ojo, O.A. On the extension of processing time with increase in temperature during transient-liquid phase bonding. Metall. Mater. Trans. A 2009, 40, 377–385. [Google Scholar] [CrossRef]
  32. Tung, S.K.; Lim, L.C.; Lai, M.O. Solidification phenomena in nickel base brazes containing boron and silicon. Scr. Mater. 1996, 34, 763–769. [Google Scholar] [CrossRef]
  33. Henhoeffer, T.; Huang, X.; Yand, S.; Au, P.; Nagy, D. Microstructure and high temperature tensile properties of wide gap brazed cobalt based superalloy X-40. Mater. Sci. Technol. 2010, 26, 431–439. [Google Scholar] [CrossRef]
  34. Ye, Y.; Wei, J.; Zou, G.; Long, W.; Bai, H.; Wu, A.; Liu, L. Microstructure of diffusion-brazing repaired IN738LC superalloy with uneven surface defect gap width. Sci. Technol. Weld. Join. 2017, 22, 617–626. [Google Scholar] [CrossRef]
  35. Wall Colmonoy Nicrobraz 150 MSDS—Google Search. Available online: https://www.google.com/search?q=Wall+Colmonoy+Nicrobraz+150+MSDS&oq=Wall+Colmonoy+Nicrobraz+150+MSDS&aqs=chrome.69i57j69i60l2.765j0j4&sourceid=chrome&ie=UTF-8 (accessed on 14 August 2019).
  36. Committee, A.I.H. ASM Handbook: Heat Treating; ASM International: Novelty, OH, USA, 1991. [Google Scholar]
  37. Watts, O.P. Rapid nickel plating. Trans. Am. Electrochem. Soc. 1916, 29, 395–403. [Google Scholar] [CrossRef]
  38. Wu, Y.Q.; Yan, M.F. Plasticity characterization of the modified layer produced by plasma nitrocarburizing of nanocrystallized 18Ni maraging steel. Vacuum 2011, 86, 119–123. [Google Scholar] [CrossRef]
  39. Pouranvari, M. Isothermal solidification during transient liquid-phase bonding of GTD-111/Ni-Si-B/GTD-111. Mater. Tehnol. 2014, 48, 113–118. [Google Scholar]
  40. Binesh, B.; Jazayeri, G.A. Transient Liquid Phase Bonding of IN738LC/MBF-15/IN738LC: Solidification Behavior and Mechanical Properties. J. Mater. Sci. Technol. 2016, 32, 1137–1151. [Google Scholar] [CrossRef]
  41. Duan, H.; Koçak, M.; Bohm, K.-H.; Ventzke, V. Transient liquid phase (TLP) bonding of TiAl using various insert foils. Sci. Technol. Weld. Join. 2004, 9, 513–518. [Google Scholar] [CrossRef]
  42. Cook, G.O.; Sorensen, C.D. Overview of transient liquid phase and partial transient liquid phase bonding. J. Mater. Sci. 2011, 46, 5305–5323. [Google Scholar] [CrossRef] [Green Version]
  43. LESOULT, G. Solidification - Cristallisation et microstructures. Available online: https://www.techniques-ingenieur.fr/base-documentaire/materiaux-th11/etude-des-metaux-et-des-alliages-etat-metallique-42345210/solidification-m58/ (accessed on 27 December 2019).
  44. Lin, T.; Li, H.; He, P.; Yang, X.; Huang, Y.; Li, L.; Han, L. Effect of bonding parameters on microstructures and properties during TLP bonding of Ni-based super alloy. Trans. Nonferrous Met. Soc. China 2012, 22, 2112–2117. [Google Scholar] [CrossRef]
  45. Pouranvari, M.; Ekrami, A.; Kokabi, A.H. Role of base-metal composition in isothermal solidification during diffusion brazing of nickel-based superalloys. Sci. Technol. Weld. Join. 2018, 23, 13–18. [Google Scholar] [CrossRef]
  46. Pouranvari, M.; Ekrami, A.; Kokabi, A.H. Diffusion brazing of cast INCONEL 718 superalloy utilising standard heat treatment cycle. Mater. Sci. Technol. 2014, 30, 109–115. [Google Scholar] [CrossRef]
  47. Gale, W.F.; Wallach, E.R. Microstructural development in transient liquid-phase bonding. Metall. Trans. A 1991, 22, 2451–2457. [Google Scholar] [CrossRef]
  48. Kokawa, H.; Lee, C.H.; North, T.H. Effect of grain boundaries on isothermal solidification during transient liquid phase brazing. Metall. Trans. A 1991, 22, 1627–1631. [Google Scholar] [CrossRef]
  49. Oyen, M.L.; Cook, R.F. A practical guide for analysis of nanoindentation data. J. Mech. Behav. Biomed. Mater. 2009, 2, 396–407. [Google Scholar] [CrossRef] [PubMed]
  50. Fischer-Cripps, A.C. Nanoindentation, 3rd ed.; Mechanical Engineering Series; Springer: New York, NY, USA, 2011; ISBN 978-1-4419-9871-2. [Google Scholar]
  51. Shuman, D.J.; Costa, A.L.; Andrade, M.S. Calculating the elastic modulus from nanoindentation and microindentation reload curves. Mater. Charact. 2007, 58, 380–389. [Google Scholar] [CrossRef]
  52. Poirier, D.R.; Geiger, G.H. Transport Phenomena in Materials Processing; Wiley: Hoboken, NJ, USA, 1998; ISBN 978-0-87339-272-3. [Google Scholar]
  53. Gale, W.F.; Butts, D.A. Transient liquid phase bonding. Sci. Technol. Weld. Join. 2004, 9, 283–300. [Google Scholar] [CrossRef]
  54. Liu, Z.-K.; Ågren, J. On the transition from local equilibrium to paraequilibrium during the growth of ferrite in Fe-Mn-C austenite. Acta Metall. 1989, 37, 3157–3163. [Google Scholar]
  55. Hillert, M. Paraequilibrium and other restricted equilibria. MRS Online Proc. Libr. Arch. 1982, 19. [Google Scholar] [CrossRef]
  56. Flemings, M.C. Solidification processing. Metall. Trans. 1974, 5, 2121–2134. [Google Scholar] [CrossRef]
  57. MacDonald, W.D.; Eagar, T.W. Isothermal solidification kinetics of diffusion brazing. Metall. Mater. Trans. A 1998, 29, 315–325. [Google Scholar] [CrossRef]
  58. Kurz, W.; Fisher, D.J. Fundamentals of solidification. Trans. Tech. Publ. Switz. 1989. [Google Scholar] [CrossRef] [Green Version]
  59. Lippold, J.C.; Kiser, S.D.; DuPont, J.N. Welding Metallurgy and Weldability of Nickel-Base Alloys; John Wiley & Sons: Hoboken, NJ, USA, 2011; ISBN 978-1-118-21003-1. [Google Scholar]
  60. Cortial, F.; Corrieu, J.M.; Vernot-Loier, C. Influence of heat treatments on microstructure, mechanical properties, and corrosion resistance of weld alloy 625. Metall. Mater. Trans. A 1995, 26, 1273–1286. [Google Scholar] [CrossRef]
  61. Brŭna, M.; Sládek, A.; Kucharčík, L. Formation of porosity in Al-Si alloys. Arch. Foundry Eng. 2012, 12, 5–8. [Google Scholar] [CrossRef]
  62. Yue, Q.; Liu, L.; Yang, W.; Huang, T.; Zhang, J.; Fu, H.; Zhao, X. Influence of withdrawal rate on the porosity in a third-generation Ni-based single crystal superalloy. Prog. Nat. Sci. Mater. Int. 2017, 27, 236–243. [Google Scholar] [CrossRef]
  63. Whitesell, H.S.; Overfelt, R.A. Influence of solidification variables on the microstructure, macrosegregation, and porosity of directionally solidified Mar-M247. Mater. Sci. Eng. A 2001, 318, 264–276. [Google Scholar] [CrossRef]
  64. Sung, P.K.; Poirier, D.R.; Felicelli, S.D.; Poirier, E.J.; Ahmed, A. Simulations of microporosity in IN718 equiaxed investment castings. J. Cryst. Growth 2001, 226, 363–377. [Google Scholar] [CrossRef]
  65. Mancha, H.; Herrera-Trejo, M.; García, G.; Méndez, M.; Ablitzer, D. Solubility of nitrogen in liquid ASTM F-75 alloys. Mater. Des. 1996, 17, 103–106. [Google Scholar] [CrossRef]
Figure 1. BNi-9: (a) heat flow curve obtained by differential scanning calorimetry; and (b) thermogravimetric curve.
Metals 10 00306 g001
Figure 2. Micrographs of the etched microstructure of the Sol-Wasp alloy (a) and the Age-Wasp alloy (b). Etchant: 10 g CuCl, 40 mL HCl, 60 mL ethanol.
Metals 10 00306 g002
Figure 3. 3D topographies by AFM (atomic force microscopy) of Ni coatings on the Waspaloy alloy: (a,c) Ni-Sol-Wasp, and (b,d) Ni-Age-Wasp.
Metals 10 00306 g003
Figure 4. Illustrative scheme of the brazing samples: (a) wedge-sample, and (b) drop-sample.
Metals 10 00306 g004
Figure 5. Secondary dendrite arm spacing (SDAS) measurements in the melting zone.
Metals 10 00306 g005
Figure 6. The load-displacement curve of the nanoindentation test.
Metals 10 00306 g006
Figure 7. Representative metallographic images of brazing of alloys without etching: (a) Sol-Wasp, (b) Age-Wasp, (c) Ni-Sol-Wasp, (d) Ni-Age-Wasp, (e) FSX-414, and (f) 304-SS, joined with filler metal paste BNi-9 during for one hour at 1150 °C.
Metals 10 00306 g007
Figure 8. Micrographs of etched brazed materials: (a) Ni-Age-Was, (b) FSX-414, and (c) 304-SS. Etchant: 10 g CuCl, 40 mL HCl, 60 mL ethanol.
Metals 10 00306 g008
Figure 9. Values of the secondary dendrite arm spacing, SDAS, measured in the melting zone of the wedge-samples.
Metals 10 00306 g009
Figure 10. SEM (scanning electron microscope) image of Z1 in the sample Ni-Age-Wasp etched. Etchant: 10 g CuCl, 40 mL HCl, 60 mL ethanol.
Metals 10 00306 g010
Figure 11. Graphs of the average thickness of the two zones in the brazed alloys: (a) Z1 and (b) PZ.
Metals 10 00306 g011
Figure 12. Micrographics of drop-samples without being etched: (a) Sol-Wasp, (b) Age-Wasp, (c) Ni-Sol-Wasp, (d) Ni-Age-Wasp, (e) 304-SS, and (f) FSX-414. Brazing treatment at 1150 °C for 1 h.
Metals 10 00306 g012
Figure 13. Linear profile of the chemical composition on a drop-sample of Ni-Sol-Wasp. Data obtained by the EDS technique.
Metals 10 00306 g013
Figure 14. Linear profile by Energy Dispersive X-Ray Spectroscopy of Ni and Co or Fe in the central section of drop-samples of the different alloys studied: (a) Sol-Wasp, (b) Age-Wasp, (c) Ni-Sol-Wasp, (d) Ni-Age-Wasp, (e) FSX-414 and (f) 304-SS. In the two latter ones, there is not an MZ, because they were fully solidified, while some porosity is still present.
Metals 10 00306 g014
Figure 15. Linear profile by EDS of Ni and Co in different sections of wedge-samples: (a) Sol-Wasp narrow section, (b) Sol-Wasp wide section, (c) Ni-Sol-Wasp narrow section, (d) Ni-Sol-Wasp wide section.
Metals 10 00306 g015
Figure 16. ACOM (automatic crystal orientation mapping) mapping of some wedge-samples: (a) Sol-Wasp, (b) Ni-Sol-Wasp and (c) Ni-Age-Wasp, and (d) Micrograph of Ni-Age-Wasp.
Metals 10 00306 g016
Figure 17. Load-depth curves on the different zones of wedge-samples: (a) Sol-Wasp; (b) Ni-Age-Wasp; and (c) Ni-Sol-Wasp.
Metals 10 00306 g017
Figure 18. Bars graph of plasticity factor in the different tested zones of the Sol-Wasp, Ni-Age-Wasp, and Ni-Sol-Wasp wedge-samples.
Metals 10 00306 g018
Figure 19. Boundary conditions at the solid-liquid interface during isothermal solidification. The dotted line indicates the initial position of the s/l interface, when ideally solid and liquid are contacted at the instant of the brazing temperature. In case (a), a new solid is immediately created, while in case (b), to achieve equilibrium at the s/l interface, some melting of the solid occurs before isothermal solidification begins.
Metals 10 00306 g019
Figure 20. Scheme of cellular growth mechanism.
Metals 10 00306 g020
Table 1. Experimental conditions of some studies performed using BNi-9.
Base AlloyAlloysFiller Metal, ThicknessBrazing MicrostructuresBrazing ConditionsReferences
NickelIN 718BNi-9 foil
40 µm
Full solidified at 6 min1.33 × 10−3 Pa
1090 °C
60–3600 s
Bai et al. [8]
IN 939BNi-9 foil
75 µm
Full solidified at 90 min1.33 × 10−2 Pa
1120 °C
45, 60, 75, and 90 min
Arham et al. [9]
WaspaloyBNi-9 foil
100 µm
Full solidified at 6 h 1145 °C
at 8 h 1100 °C
1.33 × 10⁻³ Pa
1100–1225 °C
1–8 h
Wikstrom et al. [10]
WaspaloyBNi-9 foil
80 and 100 µm
80 µm full solidified at 300 min 1065 °C,
and at 240 min-1080 °C,
100 µm full solidified at 360 min 1145 °C
1.33 × 10⁻³ Pa
20, 240, and 300 min at 1065 °C
1145, 1175, 1200 and 1225 °C
during 360 min
Tokoro et al. [11]
CMSX-4BNi-9 powder
80-100 µm
Partial solidified
at 10 min
<1.33 × 10⁻³ Pa
1121 °C
10 min
Riggs et al. [12,13,14]
IN 725BNi-9 paste
1 mm
Partial solidified
at 2 h
Ar
1150 °C
2 h
Hernandez et al. [15]
CobaltFSX-414BNi-9 foil
25, 50, 75 and 100 µm
50 µm interlayer full solidified at 5 min1.33 × 10−2 Pa
1150 °C
1–30 min
Backhtiari et al. [16]
Stainless
Steel
Duplex SSBNi-9 foil
50 and 200 µm
Partial solidified in all conditions1.33 × 10−2 Pa
1075–1115 °C
0–600 s
Yuan et al. [17]
304-SSBNi-9 paste
1 mm
Partial solidified in all conditionsAr
1200 °C
10, 20, 30 and 60 min
Hernandez et al. [18,19]
DissimilarFSX-414/IN738BNi-9 foil
50 µm
Partial solidified in all conditions2.66 × 10−3 Pa
1050, 1075, 1100 and 1150 °C
1200, 600 and 300 s
Abbasi et al. [20,21]
Table 2. Chemical composition (wt. %) of base metals and filler metal paste.
ElementBase MetalsFiller Metal Paste
WaspaloyFSX-414304-SSBNi-9
Std. UNS N07001Meas.Std.Meas. Std. ASTM A240Meas.Std. AWS 5.8Meas.Calcinated
NiBal.Bal.9.5–11.510.818–10.59.25-Bal.Bal.
Co12–1512.55Bal.Bal.---0.005<0.02
Fe<20.186<21.36Bal.Bal.-0.360.396
Cr18–2119.5227–3128.3218–2019.501412.8913.38
Mo3.5–53.98-0.211-----
Al1.2–1.61.27-0.0058---0.00150.019
Ti2.75–3.252.81-----<0.007<0.005
Nb---0.053-----
Cu<0.50.004-0.028-----
Mn<10.0054<10.62<22---
Si<0.750.031<10.709<0.751---
W--6-87.68-----
Zr0.02–0.120.019-----<0.010.0013
V-0.0002-<0.007-----
B0.003–0.01-<0.012---32.833.29
C0.02–0.100.040.2–0.3-<0.070.07<0.11.030.147
P<0.030<0.002<0.035-<0.0450.0450.020.0075-
S<0.030.009<0.0150.022<0.030.015-0.01330.018
Table 3. Oxygen, hydrogen, and nitrogen contents in the Waspaloy alloys for the solubilized and aged Sol-Wasp and Age-Wasp, respectively, FSX-414, 304-SS, and BNi-9 (filler metal paste).
Element/AlloySol-WaspAge-Wasp FSX-414304-SSBNi-9
(Filler Metal Paste)
PasteCalcined Paste
Oxygen11.4 PPM7.9 PPM201 PPM98.7 PPM50580 PPM3050 PPM
Hydrogen2.5 PPM3.8 PPM92 PPM4.7 PPM>1000 PPM270 PPM
Nitrogen19.2 PPM19.8 PPM1189 PPM722.3 PPM740 PPM 130 PPM

