Article

Simulation of Ultrasonic Induced Cavitation and Acoustic Streaming in Liquid and Solidifying Aluminum

Otto-von-Guericke-University Magdeburg, Institute of Manufacturing Technology and Quality Management, Universitätsplatz 2, 39106 Magdeburg, Germany
*
Author to whom correspondence should be addressed.
Metals 2020, 10(4), 476; https://doi.org/10.3390/met10040476
Submission received: 21 February 2020 / Revised: 29 March 2020 / Accepted: 31 March 2020 / Published: 4 April 2020
(This article belongs to the Special Issue Ultrasonic Processing of Alloys)

Abstract

:
Ultrasonic treatment (UST), more precisely, cavitation and acoustic streaming, of liquid light metal alloys is a very promising technology for achieving grain and structure refinement, and therefore, better mechanical properties. The possibility of predicting these process phenomena is an important requirement for understanding, implementing, and scaling this technology in the foundry industry. Using an established (casting) computational fluid dynamics (CFD)-simulation tool, we studied the ability of this software to calculate the onset and expansion of cavitation and acoustic streaming for the aluminum alloy A356, partly depending on different radiator geometries. A key aspect was a holistic approach toward pressure distribution, cavitation, and acoustic streaming prediction, and the possibility of two- and (more importantly) three-dimensional result outputs. Our feasibility analysis showed that the simulation tool is able to predict the mentioned effects and that the results obtained are in good agreement with the results and descriptions of previous investigations. Finally, capabilities and limitations as well as future challenges for further developments are discussed.

1. Introduction

The ultrasonic treatment (UST) of light metal, especially Aluminum (Al) melts, is an effective clean technology for modifying material microstructures and improving the mechanical properties of castings [1,2]. A radiator is used to propagate extreme sinusoidal alternating pressure waves (higher than the cavitation threshold) and provoke cavitation; to be precise, the formation of cavities during extreme negative pressure amplitude phases, pulsating growth, and implosion during a later phase of extreme positive pressure amplitude [3,4,5]. The following energy release leads to shock waves and temperature peaks in the area near the collapsing bubbles [1,6,7]. These effects lead to grain refinement of aluminum primarily via (1) wetting of nonsoluble and nonmetallic particles in the melt (e.g., Al 2 O 3 ) [8,9,10,11], (2) nucleation of aluminum grains caused by the collapse accompanying shock waves [11,12,13,14,15], (3) dendrite fragmentation [1,9,16,17,18,19,20], and (4) de-agglomeration [1,21]. In addition, UST can be used for melt degassing to further increase the density index and improve both the melt and final casting quality. As a result, material-dependent attenuation, cavitation, and the corresponding major effects take place primarily in a limited cavitation zone close to the radiator [20,21,22,23,24,25,26,27,28].
Another important phenomenon is the presence of acoustic streaming and convective flows, which support and increase mass and heat transfer in the bulk of the liquid, and influence the solidification mechanisms of the melt. Thus, acoustic streaming distributes by shock waves newly created Al nucleation sites or other particles throughout the bulk of the melt and ensures a more homogeneous distribution of contents [1,7,9,11,28,29,30]. Together, cavitation and acoustic streaming have high potential for the effective isothermal and solidification-accompanying treatment of an alloy and allow for the improvement of the grain structure and final mechanical properties of casting products [1,7,31,32,33].
So far, one obstacle for the comprehensive entrance of this technology into the foundry industry has been the missing potential for simulating the processing and influence of ultrasonic melt treatments [10,34]. In recent years, many researchers have investigated acoustic streaming using (for instance) particle image velocimetry (PIV) analyses to predict the propagation of acoustic waves, as well as the development of acoustic streaming and its influence on the fluid using simulation tools [8,17,21,35,36,37,38,39,40]. An overview of (some) research publications on the subject of simulation of ultrasonic treatment so far can be taken from [41] and Table 1.
However, to the best of our knowledge, almost none of these solutions offers a comprehensive approach. Some simulations concentrate mainly on acoustic streaming [36,38], but simplify the flow behaviour by neglecting the turbulences or treat the radiator as fluid inlet to evoke acoustic streaming and neglect cavitation to reduce the necessary computational power [21,35,42]. Others focus on the calculation of the occurring acoustic pressure distribution [8,17], sometimes in combination with acoustic streaming [43], or either solely on cavitation [44,45,46]. Nearly all simulation approaches are based on two-dimensional modeling. Therefore, the aim of this investigation was to create a three-dimensional simulation model with the possibility of two-dimensional sectional views using the commercial computational fluid dynamics (CFD) code (CCC) simulation tool FLOW-3D for aluminum alloy A356. This way, it could be possible to predict the beginning and development of cavitation and acoustic streaming, allow for overlap with simulations of the solidification process (as in [47]), or enable preinvestigations for process design. Furthermore, Lebon et al. [41] noted rightly that the modeling behind the results in [48] was not further described. Therefore, a further goal is the more detailed description of the modeling and results behind this work. The overriding aim is to move towards the industrial commercialization of this technology in the foundry industry.

2. Numerical Modeling

2.1. General

The simulation model was created and run using the CCC-simulation software FLOW-3D v11.2, while the results were analyzed with FlowSight v11.2. Both software tools were developed by Flow Science, Inc. (Santa Fe, NM, USA). To enable a straightforward application and adaption of the presented model, the following model description follows the workflow within FLOW-3D.
The simulated time for wave propagation was set to 0.0001 s, which conforms to two full radiator oscillations. Cavitation and acoustic streaming were investigated for the first 0.01 s and 5 s of UST, respectively, to investigate both developments over a proper period of time. Differing times will be mentioned.

2.2. Fluid

Within the scope of the model, UST was simulated for aluminum silicon alloy A356 at 973.15 K because this alloy has significant industrial applications. The main parameters are presented in Table 2.
In the case of FLOW-3D, a linear system of equations to be solved is derived from the continuity equation, which maintains mass conservation of fluid. The general mass continuity equation is
V F ρ t + x ( ρ u A x ) + R y ( ρ v A y ) + z ( ρ w A z ) + ξ ρ u A x x = R D I F + R S O R ,
with V F as the fractional volume open to flow, ρ as the fluid density, R D I F as a turbulent diffusion term, R S O R as a mass source, and R and ξ as mesh-dependent coefficients. A x is the fractional area open to flow in the x-direction, A y and A z are similar area fractions for flow in the y- and z-directions, respectively. The computation of acoustic pressure waves in fluids that would otherwise be treated as incompressible is done by an approximation of the density time derivative:
ρ t 1 c 2 p t ,
where ρ and c are the respective fluid density and adiabatic speed of sound whereas p corresponds to the pressure. Integration of sound velocity is realized by calculation and inclusion of the compressibility factor β according to
β = 1 ρ c 2 .
From Equation (2), a modified continuity equation results as follows:
V F ρ c 2 p t + u A x x + R v A y y + w A z z + ξ ρ u A x x = R S O R ρ .
The complete description of the model can be taken from [70,71].

2.3. Physics

The appropriate choice of physical models directly influences the quality of the simulation model. Besides gravitation and the activation of the general moving object (GMO) model, for the later movement of the radiator, the bubble and phase change model, cavitation model, surface tension model, and viscosity and turbulence model are of primary importance. The respective specific parameters and values used are listed in Table 3.
The influence of the resulting pressure changes is calculated by Equations (2) and (4). Cavitation is solved by a transport equation which calculates advection, production, and dissipation of cavitation volume fraction, according to the following equations [70]:
D V c D t = C a v p r o d u c t i o n - C a v d i s s i p a t i o n ,
C a v p r o d u c t i o n = C e E t u r b σ ρ l ρ v 2 3 p c - p l ρ l ( 1 - f c ) ,
C a v d i s s i p a t i o n = C c E t u r b σ ρ l 2 2 3 p l - p c ρ l f c ,
where V c a v is the computed cavitation volume fraction, C p is the cavitation production coefficient, C e the evaporation coefficient, C c is the condensation coefficient, E t u r b is the turbulent kinetic energy (alternatively, 10% of the total kinetic energy if no turbulence model selected), σ is the surface tension, P c a v is the specified cavitation pressure, P is the local fluid pressure, and f c a v is the mass fraction of cavitation in the cell with ρ l and ρ v as densities of liquid and vapor, respectively. The coefficients used for cavitation production and dissipation are default values (0.02 and 0.01, respectively) that can be adjusted. The gas species inside the cavitation bubbles was assumed to be hydrogen gas at 973.15 K. Gas density was calculated by the general gas equation
p V = n R S T n V = p R S T ,
where p is the gas pressure, V is the gas volume, n is the amount of substance of gas, R m is the universal gas constant, and T is the thermodynamic temperature of the gas [72]. Using the data in Table 4 with the molar mass of H 2 , the gas density of cavitation bubbles amounts to 0.025 kg/ m 3 . Regarding the bubbles, the relationship between pressure, volume, and temperature will follow an adiabatic law.
Pressure p in each void region is evaluated on the void region volume V using the isentropic model of expansion or compression in which p V γ is constant, where γ is the isentropic exponent. Break up, coalesce, receive, and loss of mass and energy at the mesh boundaries are approximated by the bubble pressure model. The pressure in each bubble will be inversely proportional to its volume to the power of the isentropic exponent γ . If a bubble neither breaks up nor coalesces, the p V γ relation determines the new pressure. For an accurate solution, the bubbles must be resolved by a minimum of three cells across the diameter [70]. Since this criterion is not met to ensure acceptable computing times, bubble opening and pulsation are neglected. For the same reason, the effect of nonequilibrium evaporation and condensation at the bubble wall was also not taken into account. This simplification is appropriate as, in the case of aluminum and hydrogen, evaporation and condensation of gas within the bubbles are negligible at the involved pressures and temperatures. Hence, the model still allows taking the surface tension and density of cavitation bubbles into account. Regarding the turbulence model, a laminar flow model was chosen, because no differences were observed in comparisons of different models (e.g., k - ϵ or RNG) with the chosen cell size. The streaming is provoked by the radiator movement and the resulting pressure changes that were calculated by the GMO-model and controlled by a sinusoidal translational velocity component in the z-direction, corresponding to an ultrasonic system with 20 kHz and a peak-to-peak amplitude of 35 μ m. The sinusoidal translational velocity is calculated by
v ( t ) = ω · s 0 · c o s ( ω t + ϕ 0 ) ,
with
ω = 2 π f ,
where v ( t ) corresponds to the angular frequency, ω is the angular frequency with f as the frequency, s 0 is the amplitude (17.5 μ m), and ϕ 0 is the phase angle. The GMO-model calculates the kinetic energy, which is caused by the radiator movement, and its transfer on the fluid by momentum and mass conservation. For moving object/fluid coupling, the explicit numerical method was chosen, in which the fluid and GMO motions—i.e., the radiator—of each time step are calculated using force and velocity data from the previous time step.
To investigate the influence of acoustic streaming on distribution of potential oxide particles and dendrite fragments, additionally, a particle model was activated. Two kinds of particles were defined: Al 2 O 3 with a particle size of 0.1 μ m and a density of 3950 kg/ m 3 ; as well as pure Al with a particle size of 20 μ m and a density of 2700 kg/ m 3 . Such considerations with regard to particle distribution could, for example, be helpful in the simulation-based investigation of UST-supported production of aluminum matrix composites (AMC).

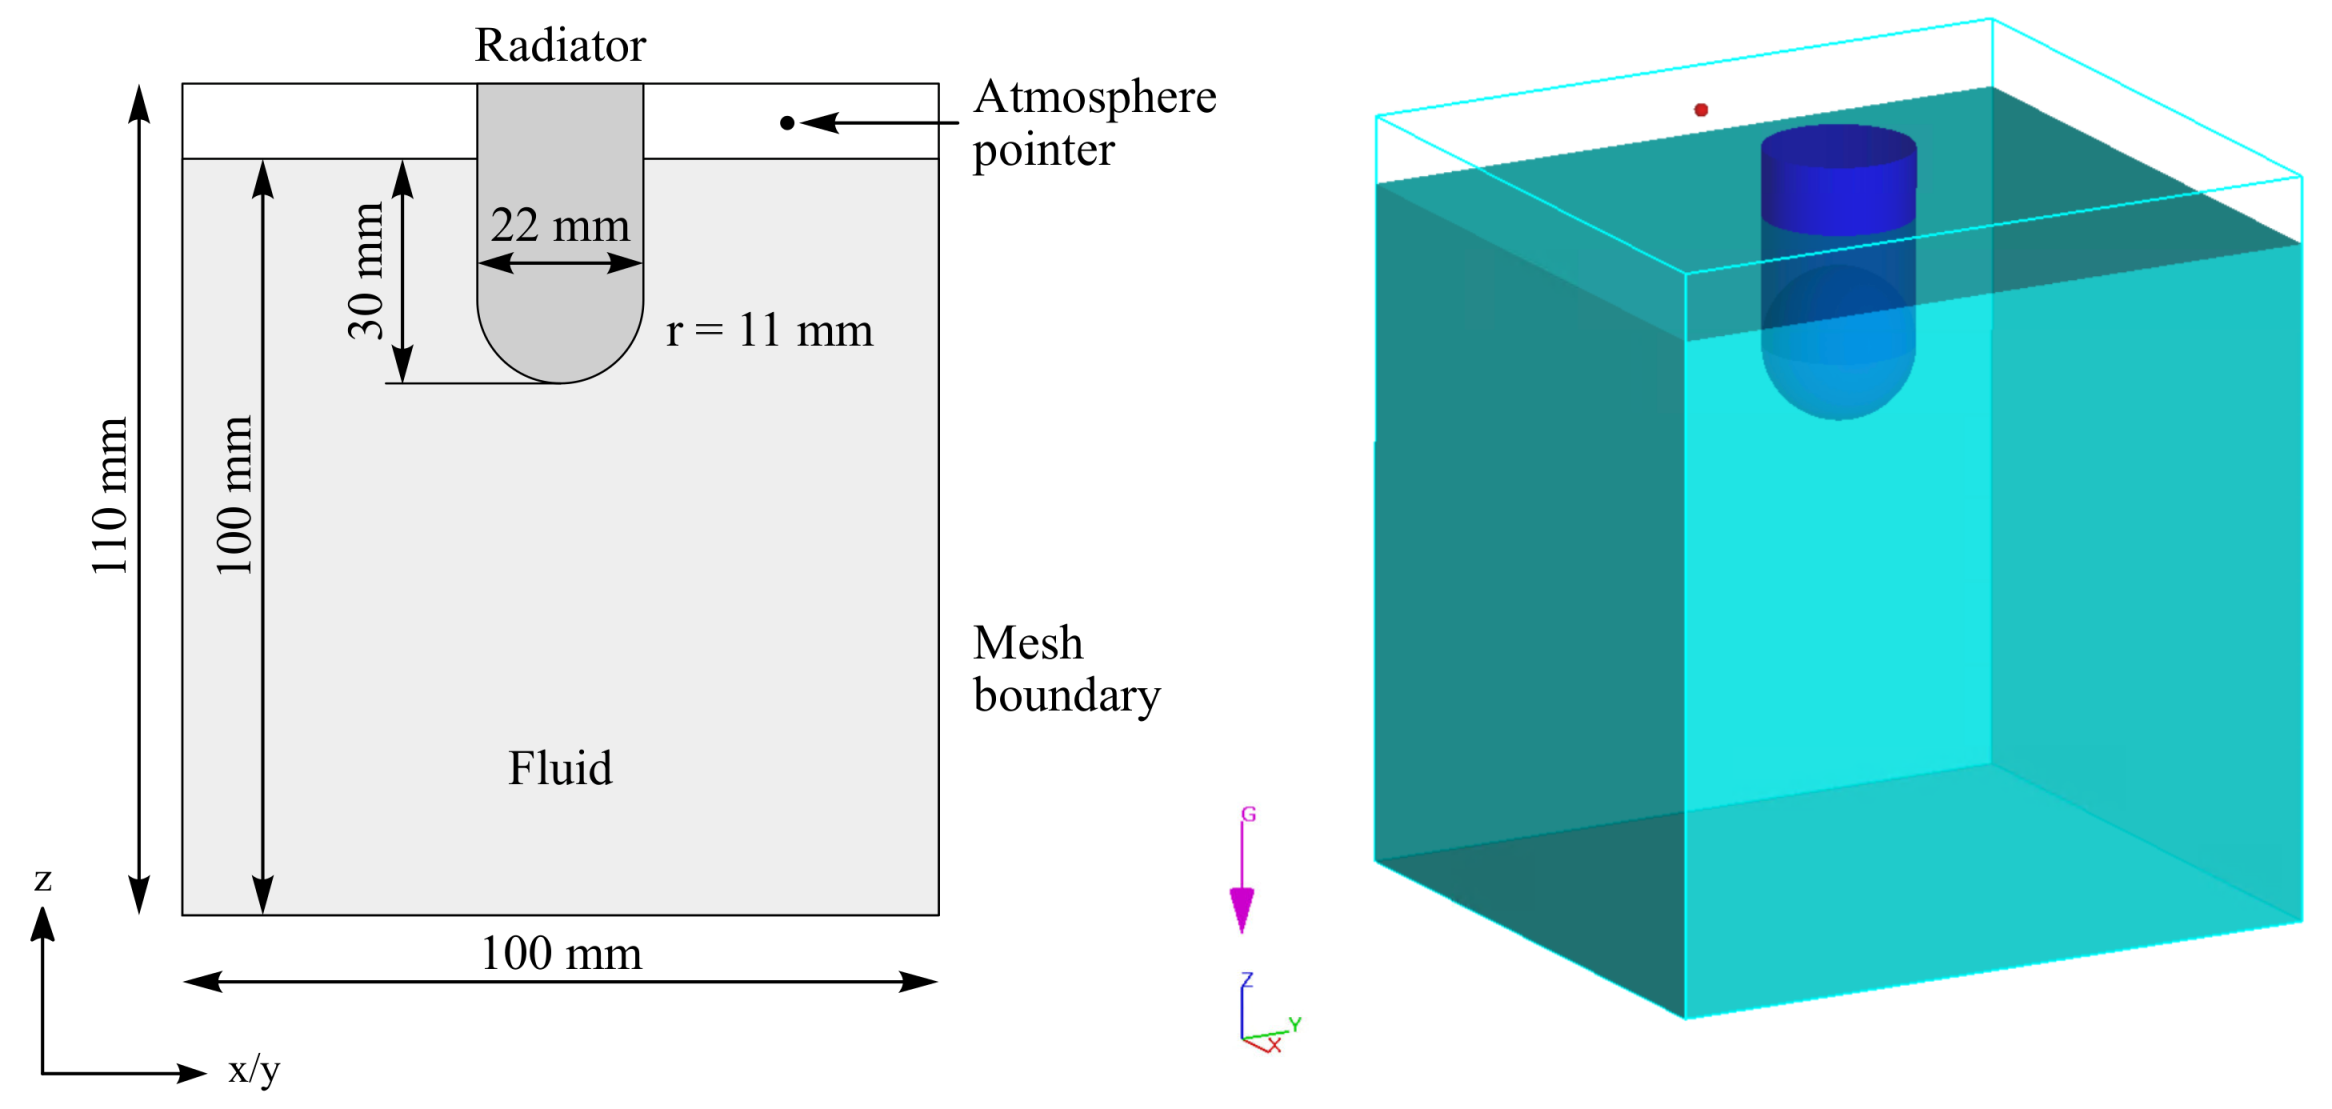
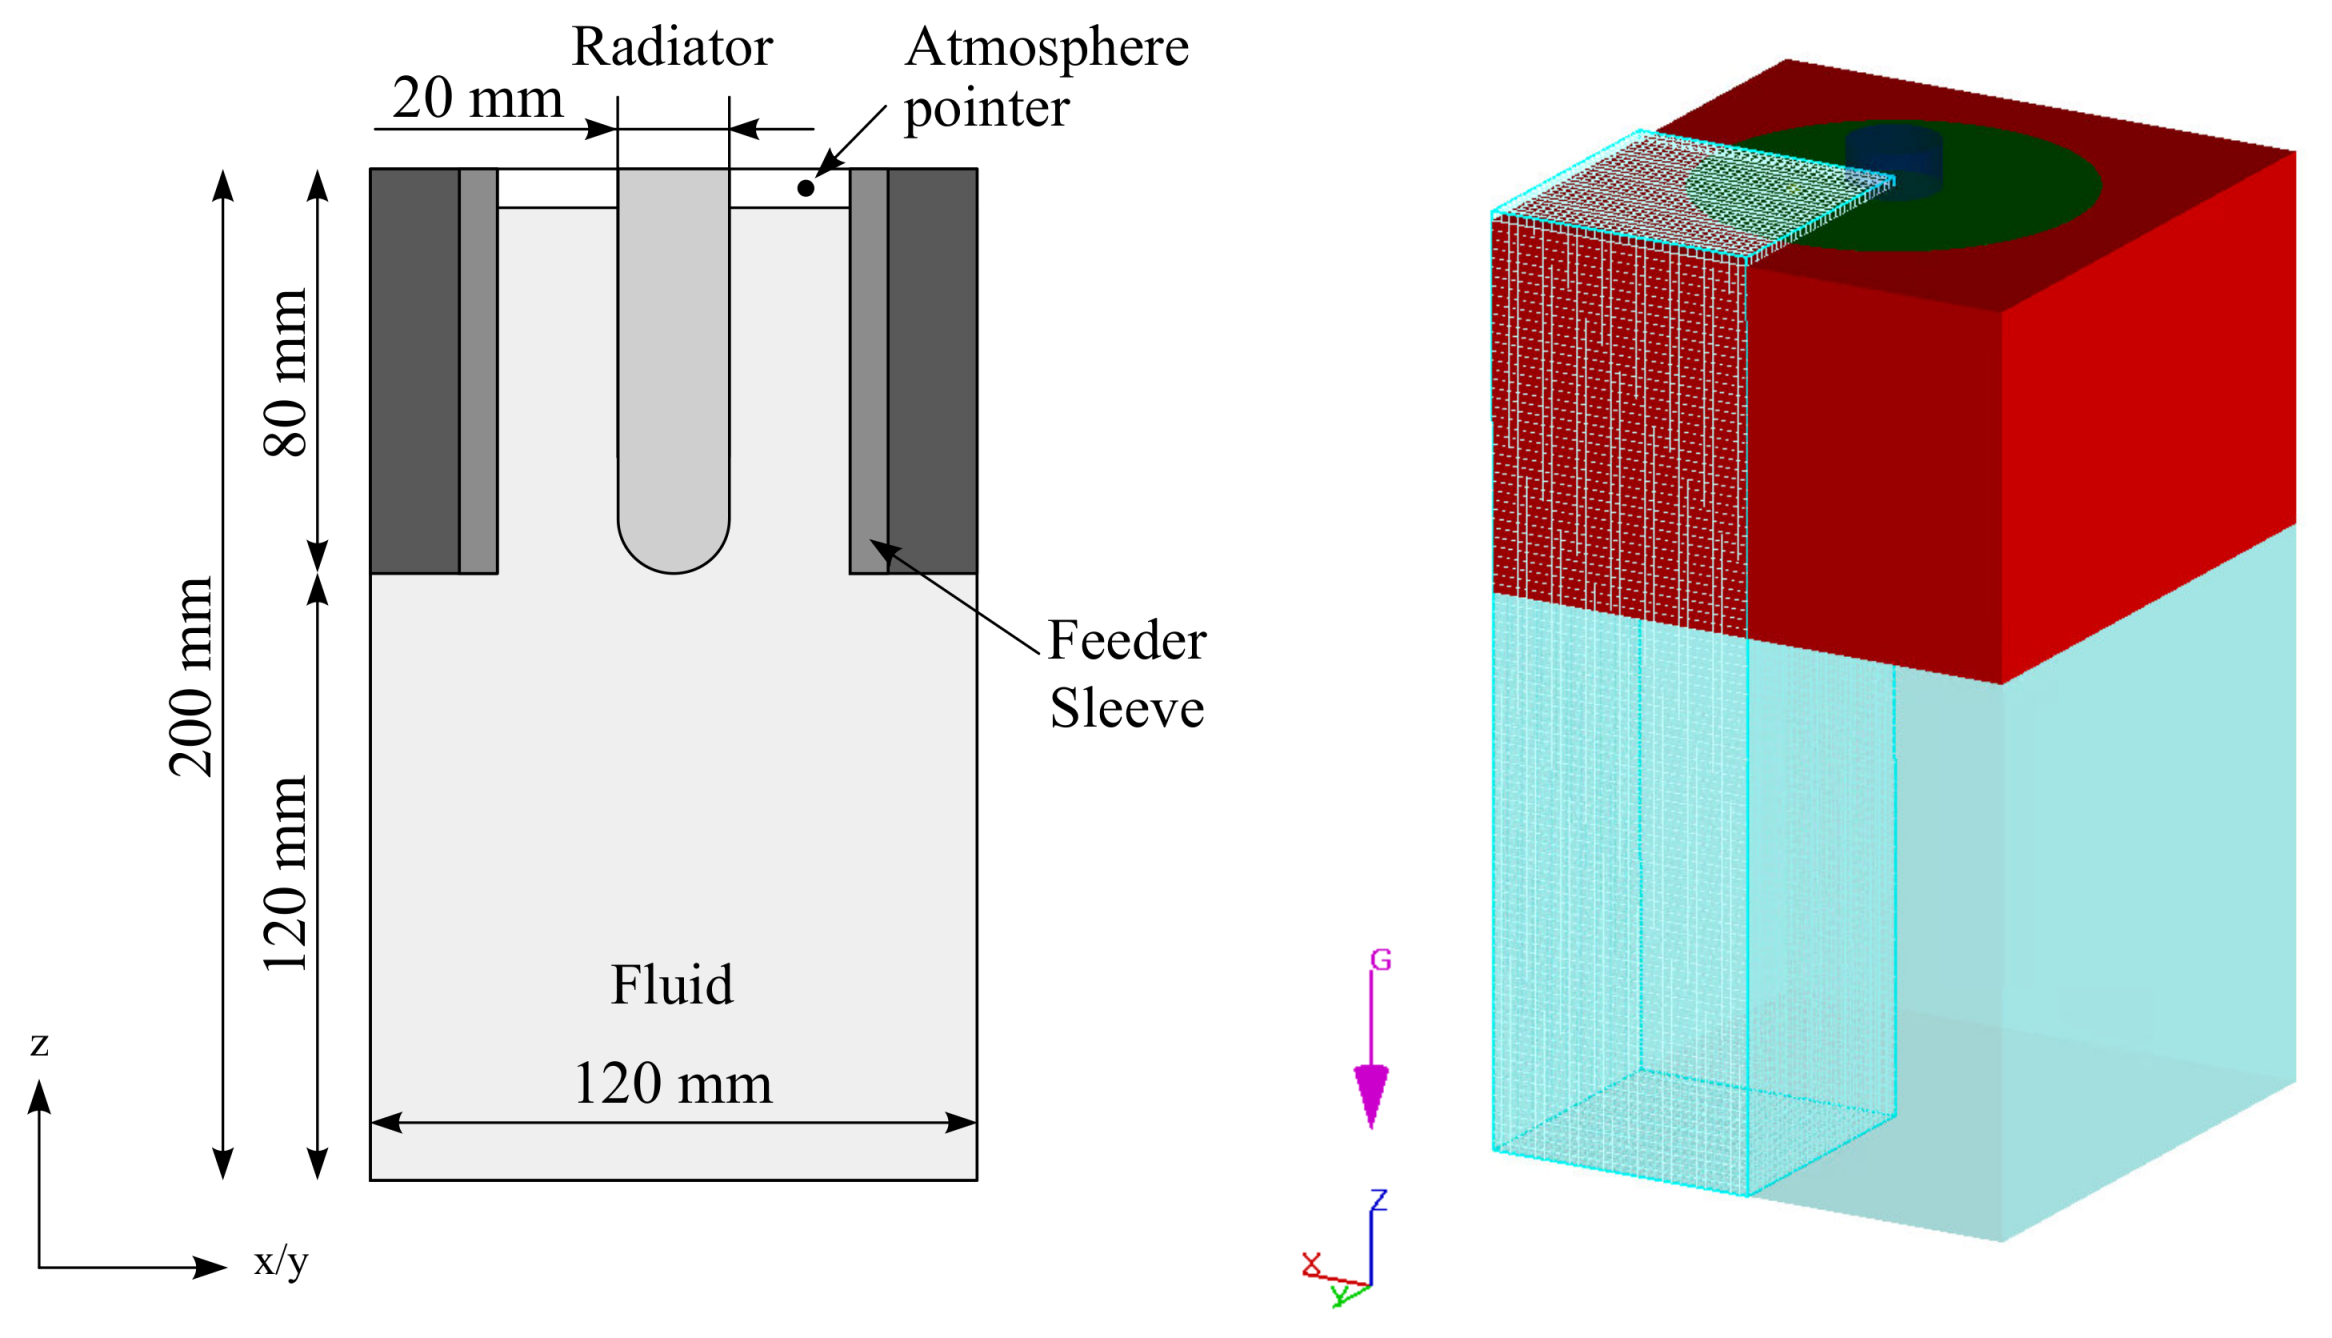
2.4. Geometry and Movement

To reduce the required calculation time, only essential geometric elements were simulated, without neglecting the basic conditions of a real system. Therefore, the vessel wall was defined as a boundary without heat transfer, to avoid additional cells for the mesh and calculation of heat transfer. At the mesh boundaries, full reflection of sound waves/without any losses was calculated. The fluid volume was 100 × 100 × 100 mm (xyz), for a total volume of 1000 c m 3 (less volume of immersed radiator) with temperature for aluminum of 973.15 K. The modeled radiator consists of a ceramic material that has a length of 60 mm, a diameter of 22 mm and, unless otherwise mentioned, the same temperature as the fluid. The radiator was positioned in the middle of the vessel at an immersion depth of 30 mm. The atmospheric pressure and temperature were set to 101,325 Pa and 293.15 K, respectively. The particle source was placed directly below the radiator tip and had a size of 10 × 10 × 2 mm. A total of 800 particles per second (400 Al 2 O 3 and 400 Al) were produced with a uniform generation rate. Fluid motion affects the particles, but not vice versa. To obtain adequate simulation results, a minimum cell size of 1 mm was necessary. The overall three-dimensional system, discretized with 1,100,000 cells, can be seen in Figure 1.
The simulation setup for the solidification-accompanying UST can be taken from Figure 2. To achieve a precise simulation, the cooling curve was calculated in advance using the ThermoCalc software and was afterwards implemented in FLOW-3D. The simulation started at a melt temperature of 890 K (liquidus temperature). The mold wall was defined as a boundary with heat transfer and a starting temperature of 673 K. Similar to the isothermal model, at the mesh boundaries, full reflection of sound waves/without any losses was calculated. According to the experimental setup in [48], the radiator had a frequency of 20 kHz, a peak-to-peak amplitude of 35 μ m, a temperature of 473 K and was placed concentrically directly above the mold cavity. The same simulation was performed without UST to use the results as a reference. As a result of the additional effort for the calculation of solidification and due to the symmetrical setup, only one-fourth of the model was discretized with a cell size of 2 mm to show the qualitative influence and simulation potential.

2.5. Time Step Definition

In view of the calculation time steps, it is important to also take the frequency into account. For calculation of the correct sinusoidal movement of the radiator, the defined time steps have to hit characteristic, positive and negative equally distributed spots on the curve, depending on the frequency of the radiator, but at least the peak points of the curves. The reduction of the time step is largely unproblematic. The smaller the time step, the higher the accuracy of simulation but the calculation periods of the model as well, whereas the maximum time step is limited by frequency, especially in the scope of larger simulation durations. For this reason, with the chosen frequency (20 kHz), a minimum of 80,000 calculation steps per second is necessary to adequately calculate the radiator’s movement. Table 5 contains an overview of the chosen time steps for the following simulations.

3. Results

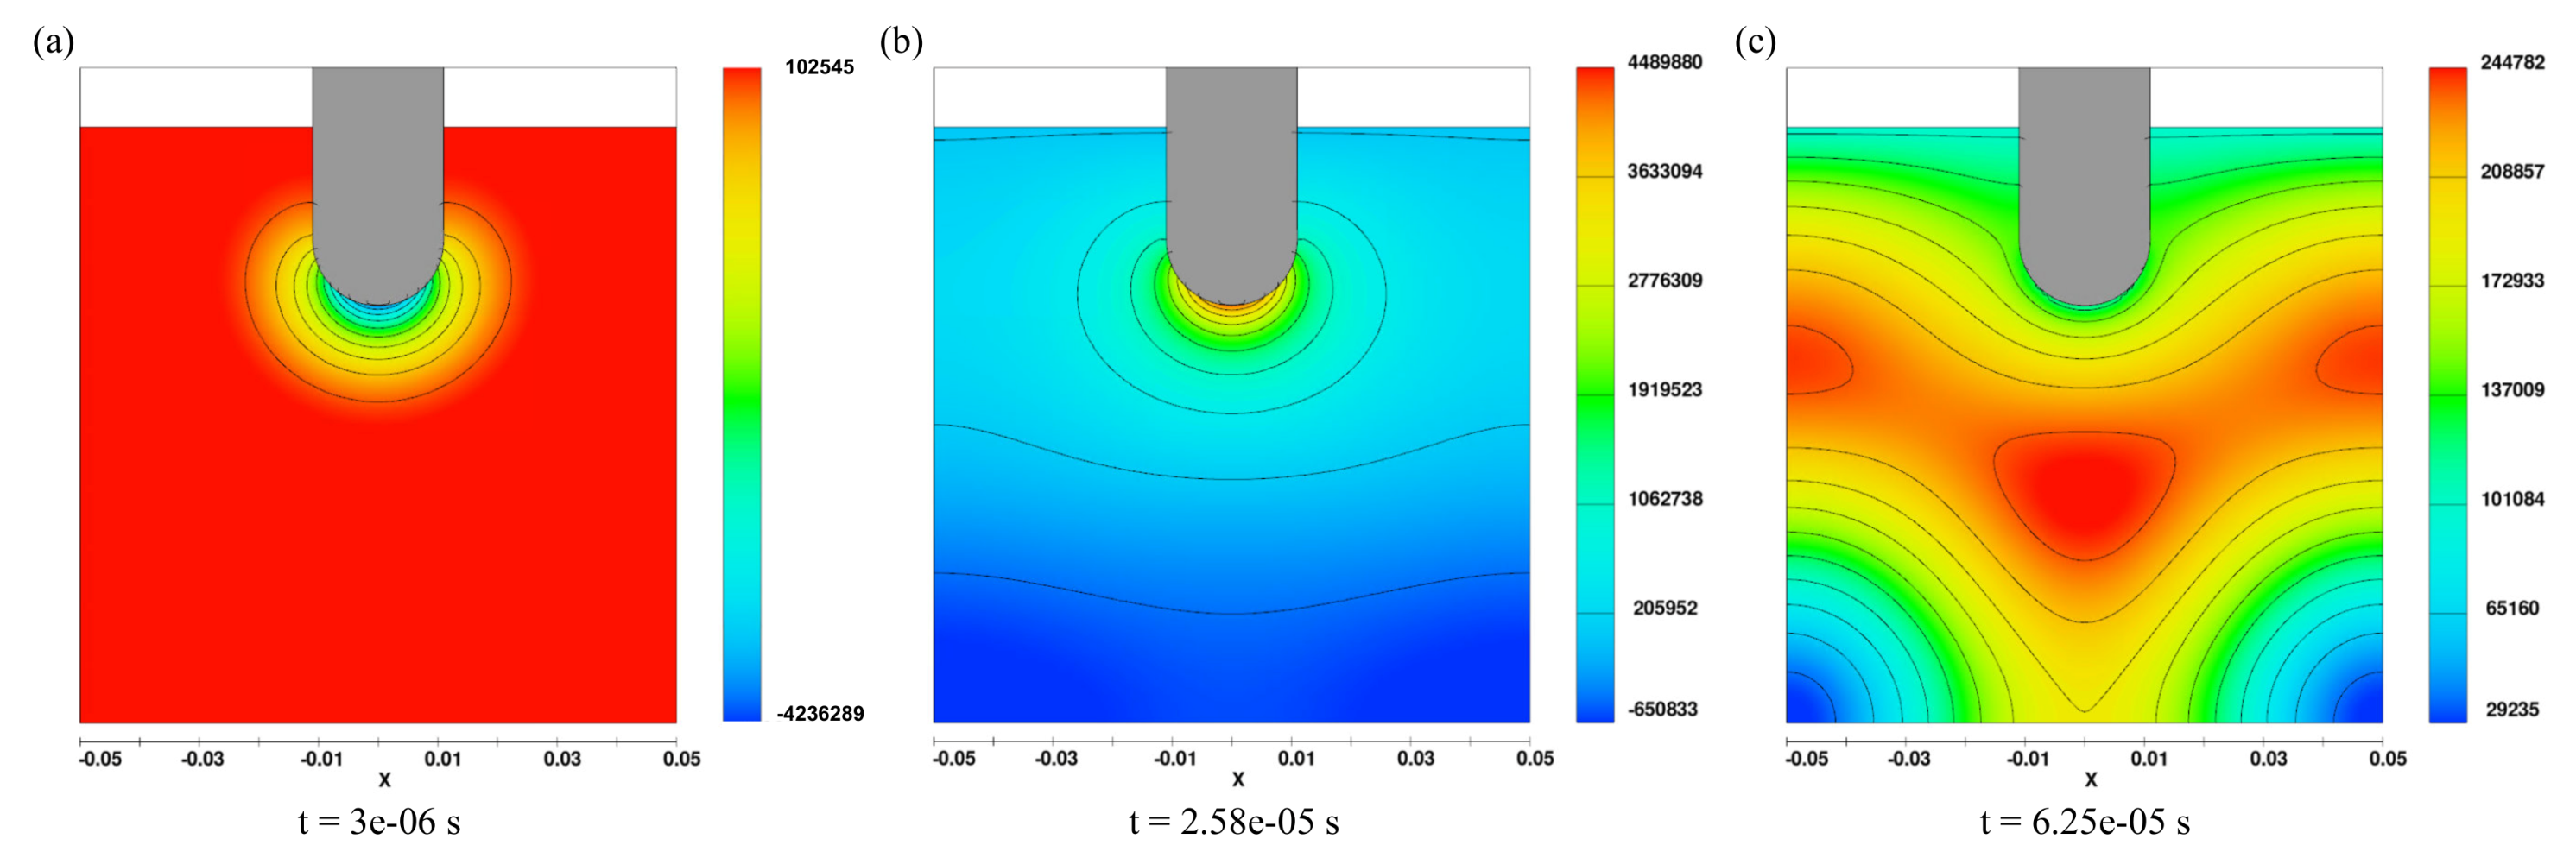
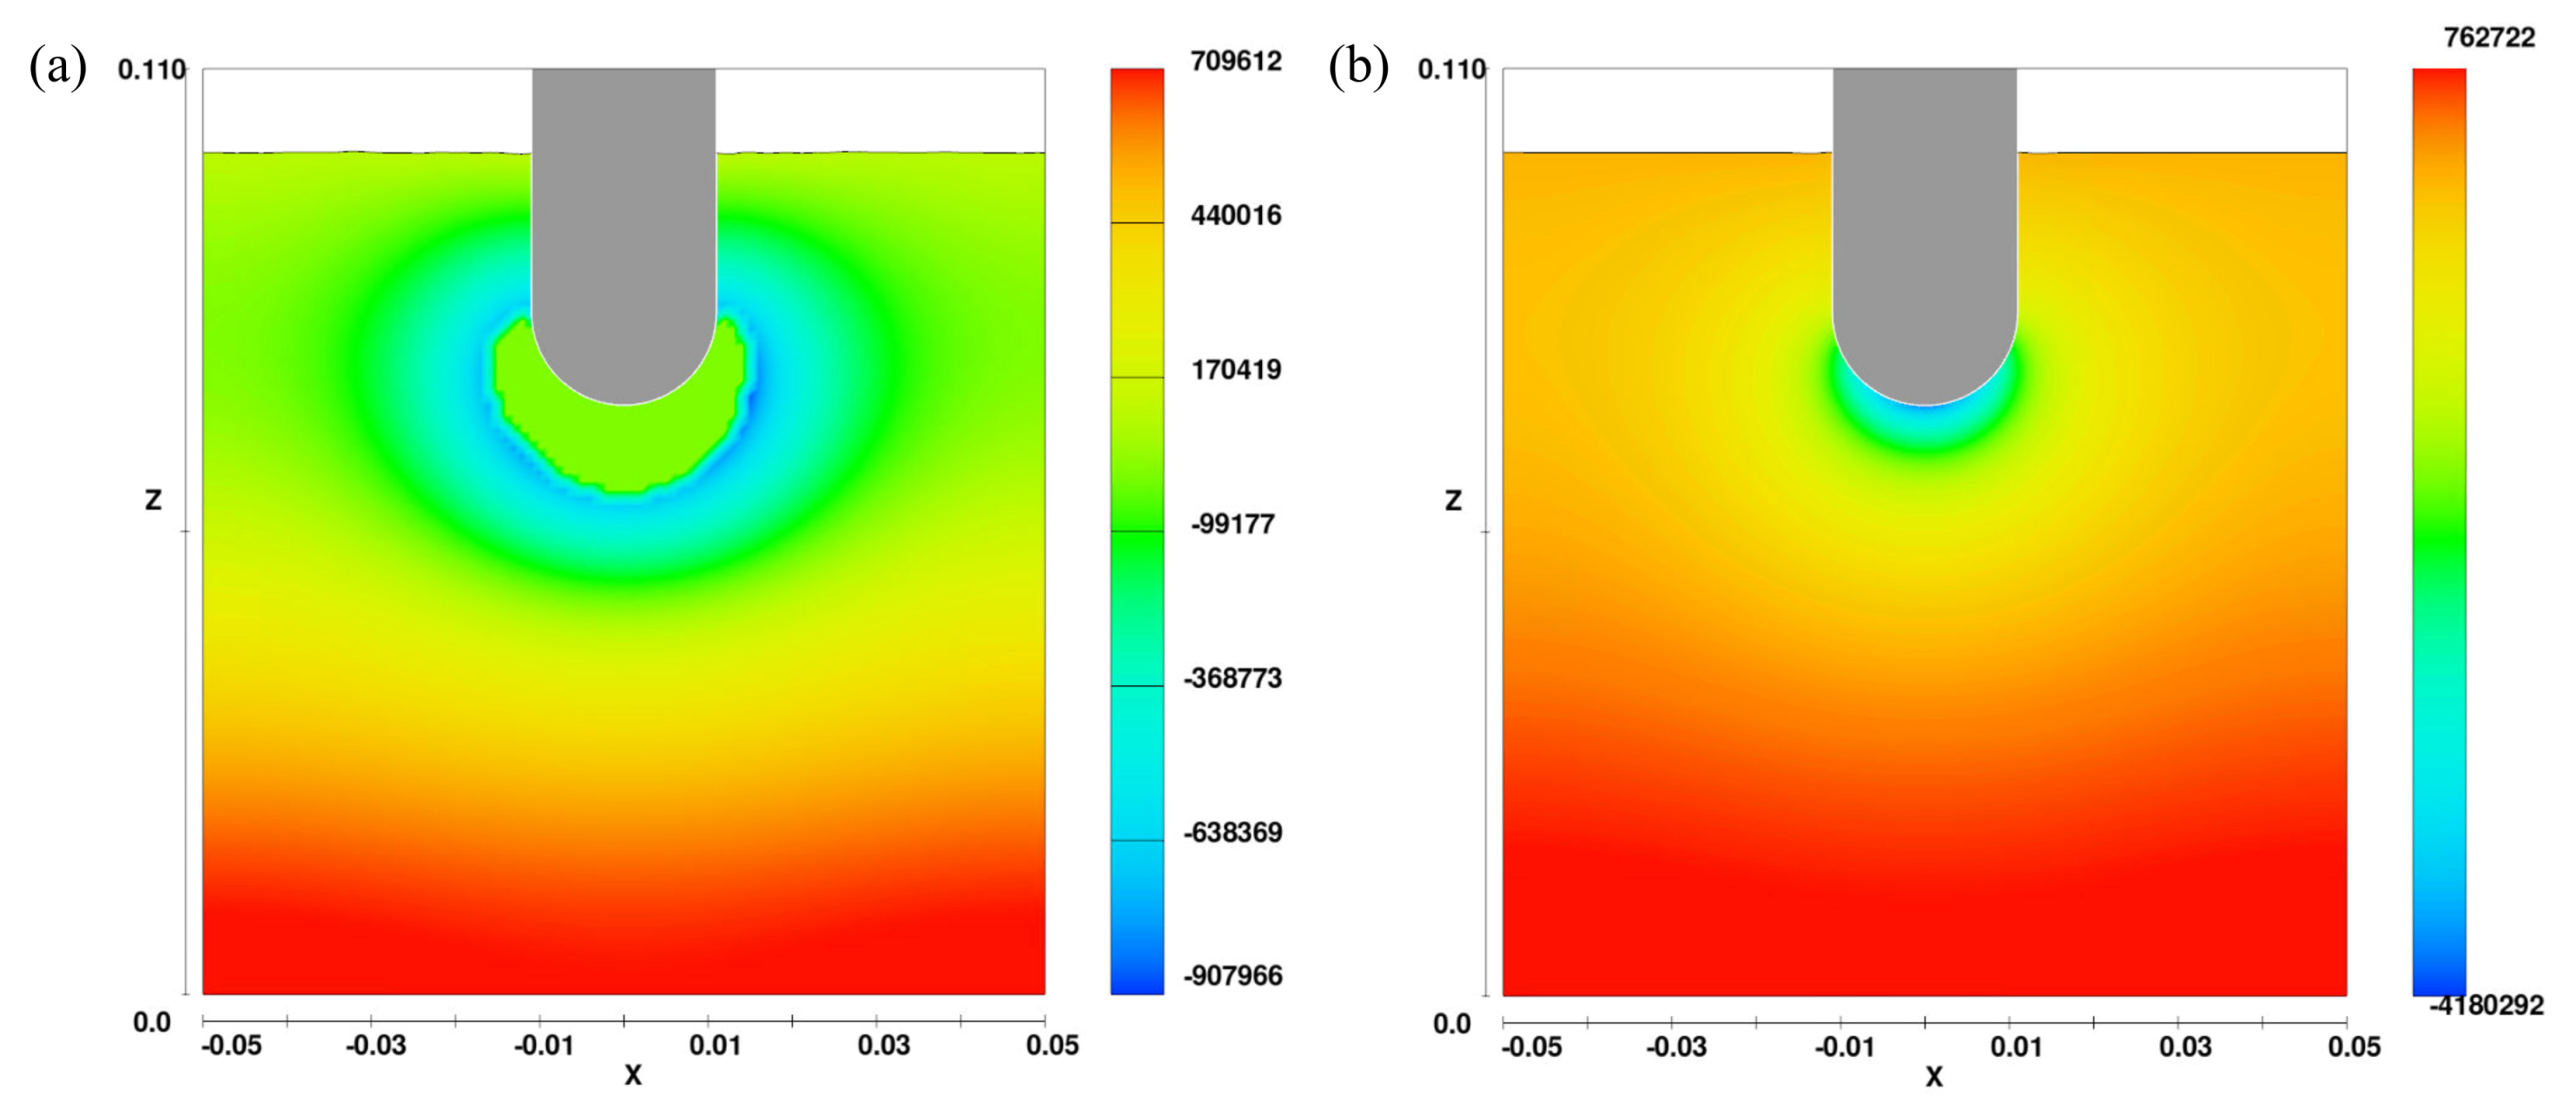
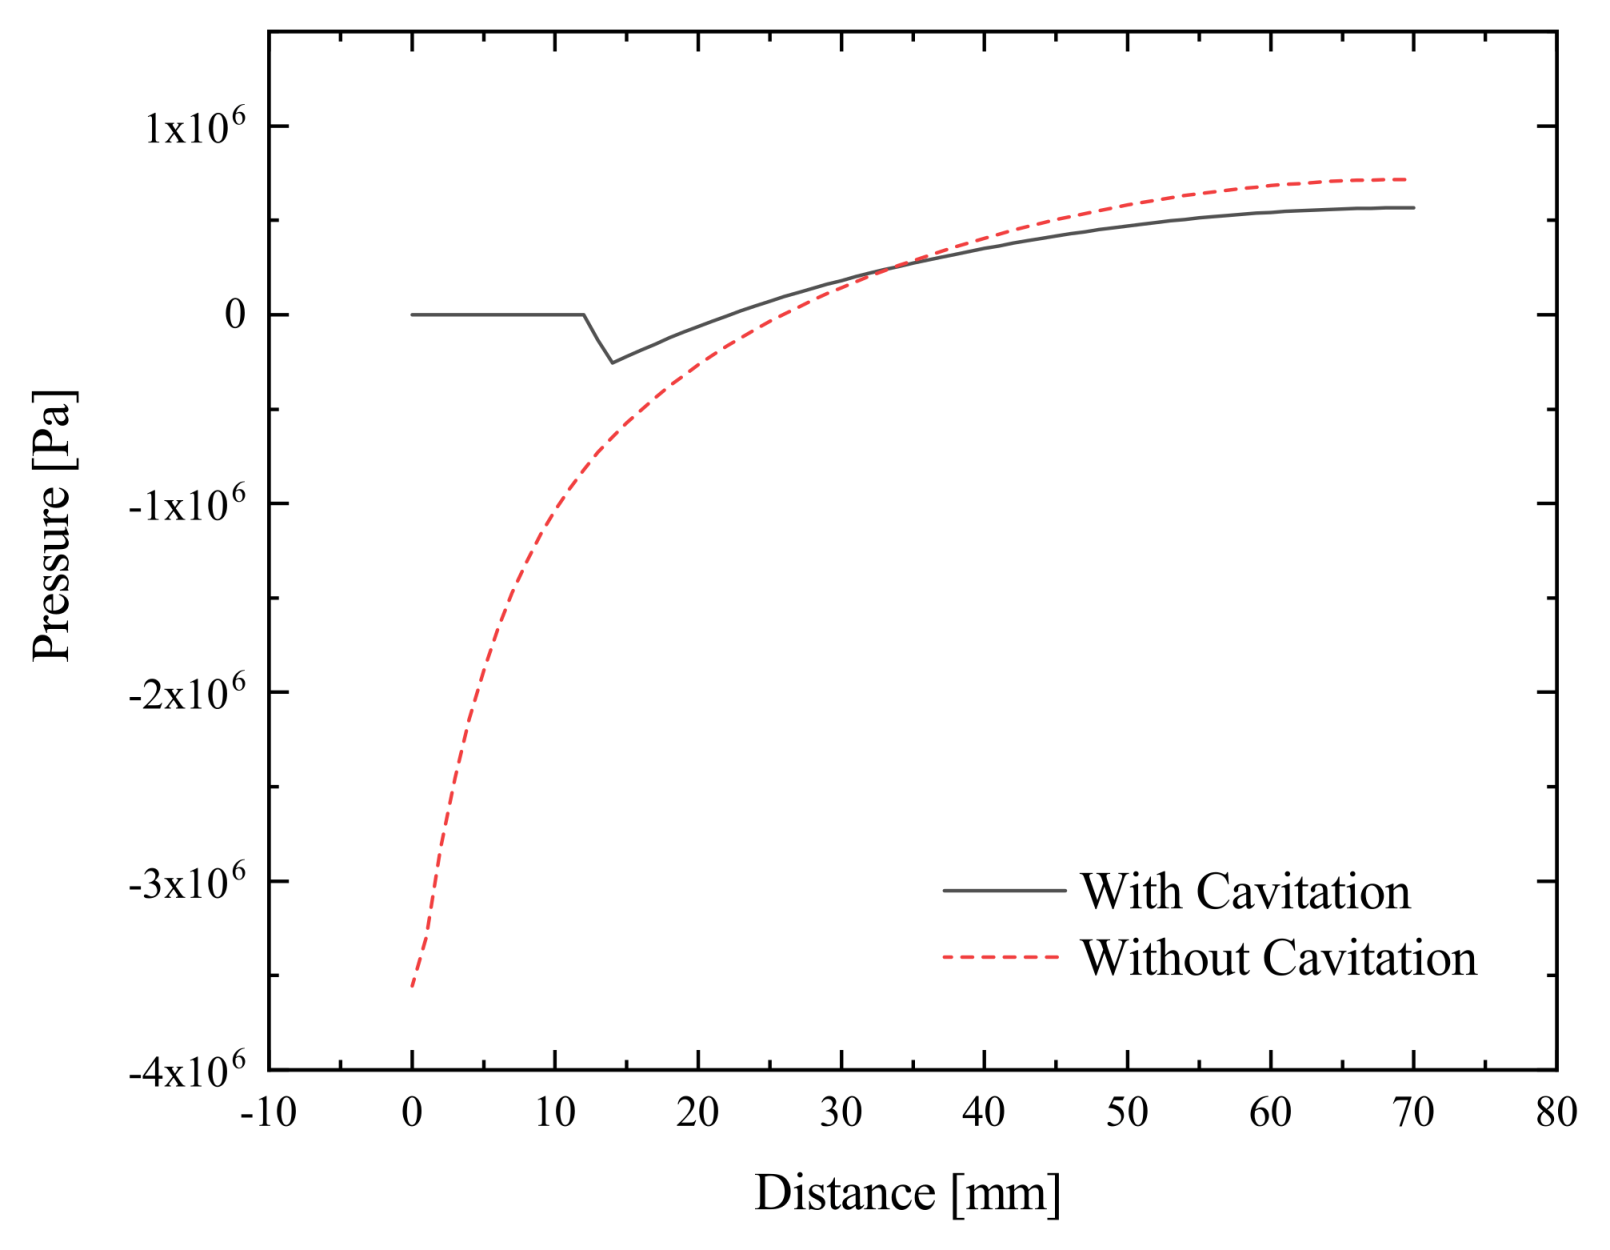
3.1. Acoustic Pressure Wave Propagation

Figure 3 shows pressure initiation and distribution through aluminum for three different stages as well as the related min/max pressures. At t = 3 μ s (Figure 3a), negative pressure increases by several MPa immediately below the radiator face, then propagates in the –z-direction. Subsequently, the positive pressure amplitude develops and starts propagating in –z-direction (Figure 3b). Due to the spherical radiator geometry, propagation in the xy-direction is also clearly discernible. The highest values arise in the center of the radiator faces with 4.5 MPa and −4.2 MPa for the spherical tip. From the tip, the pressure intensity decreases with increasing distance from the radiator and shows exponential intensity loss. The measured simulated half-wavelength is about 11.5 cm. The propagating waves are reflected by the sidewalls, leading to a slightly slower pressure decrease in these areas because of interfering waves (depending on the simulation boundary conditions) (Figure 3c).

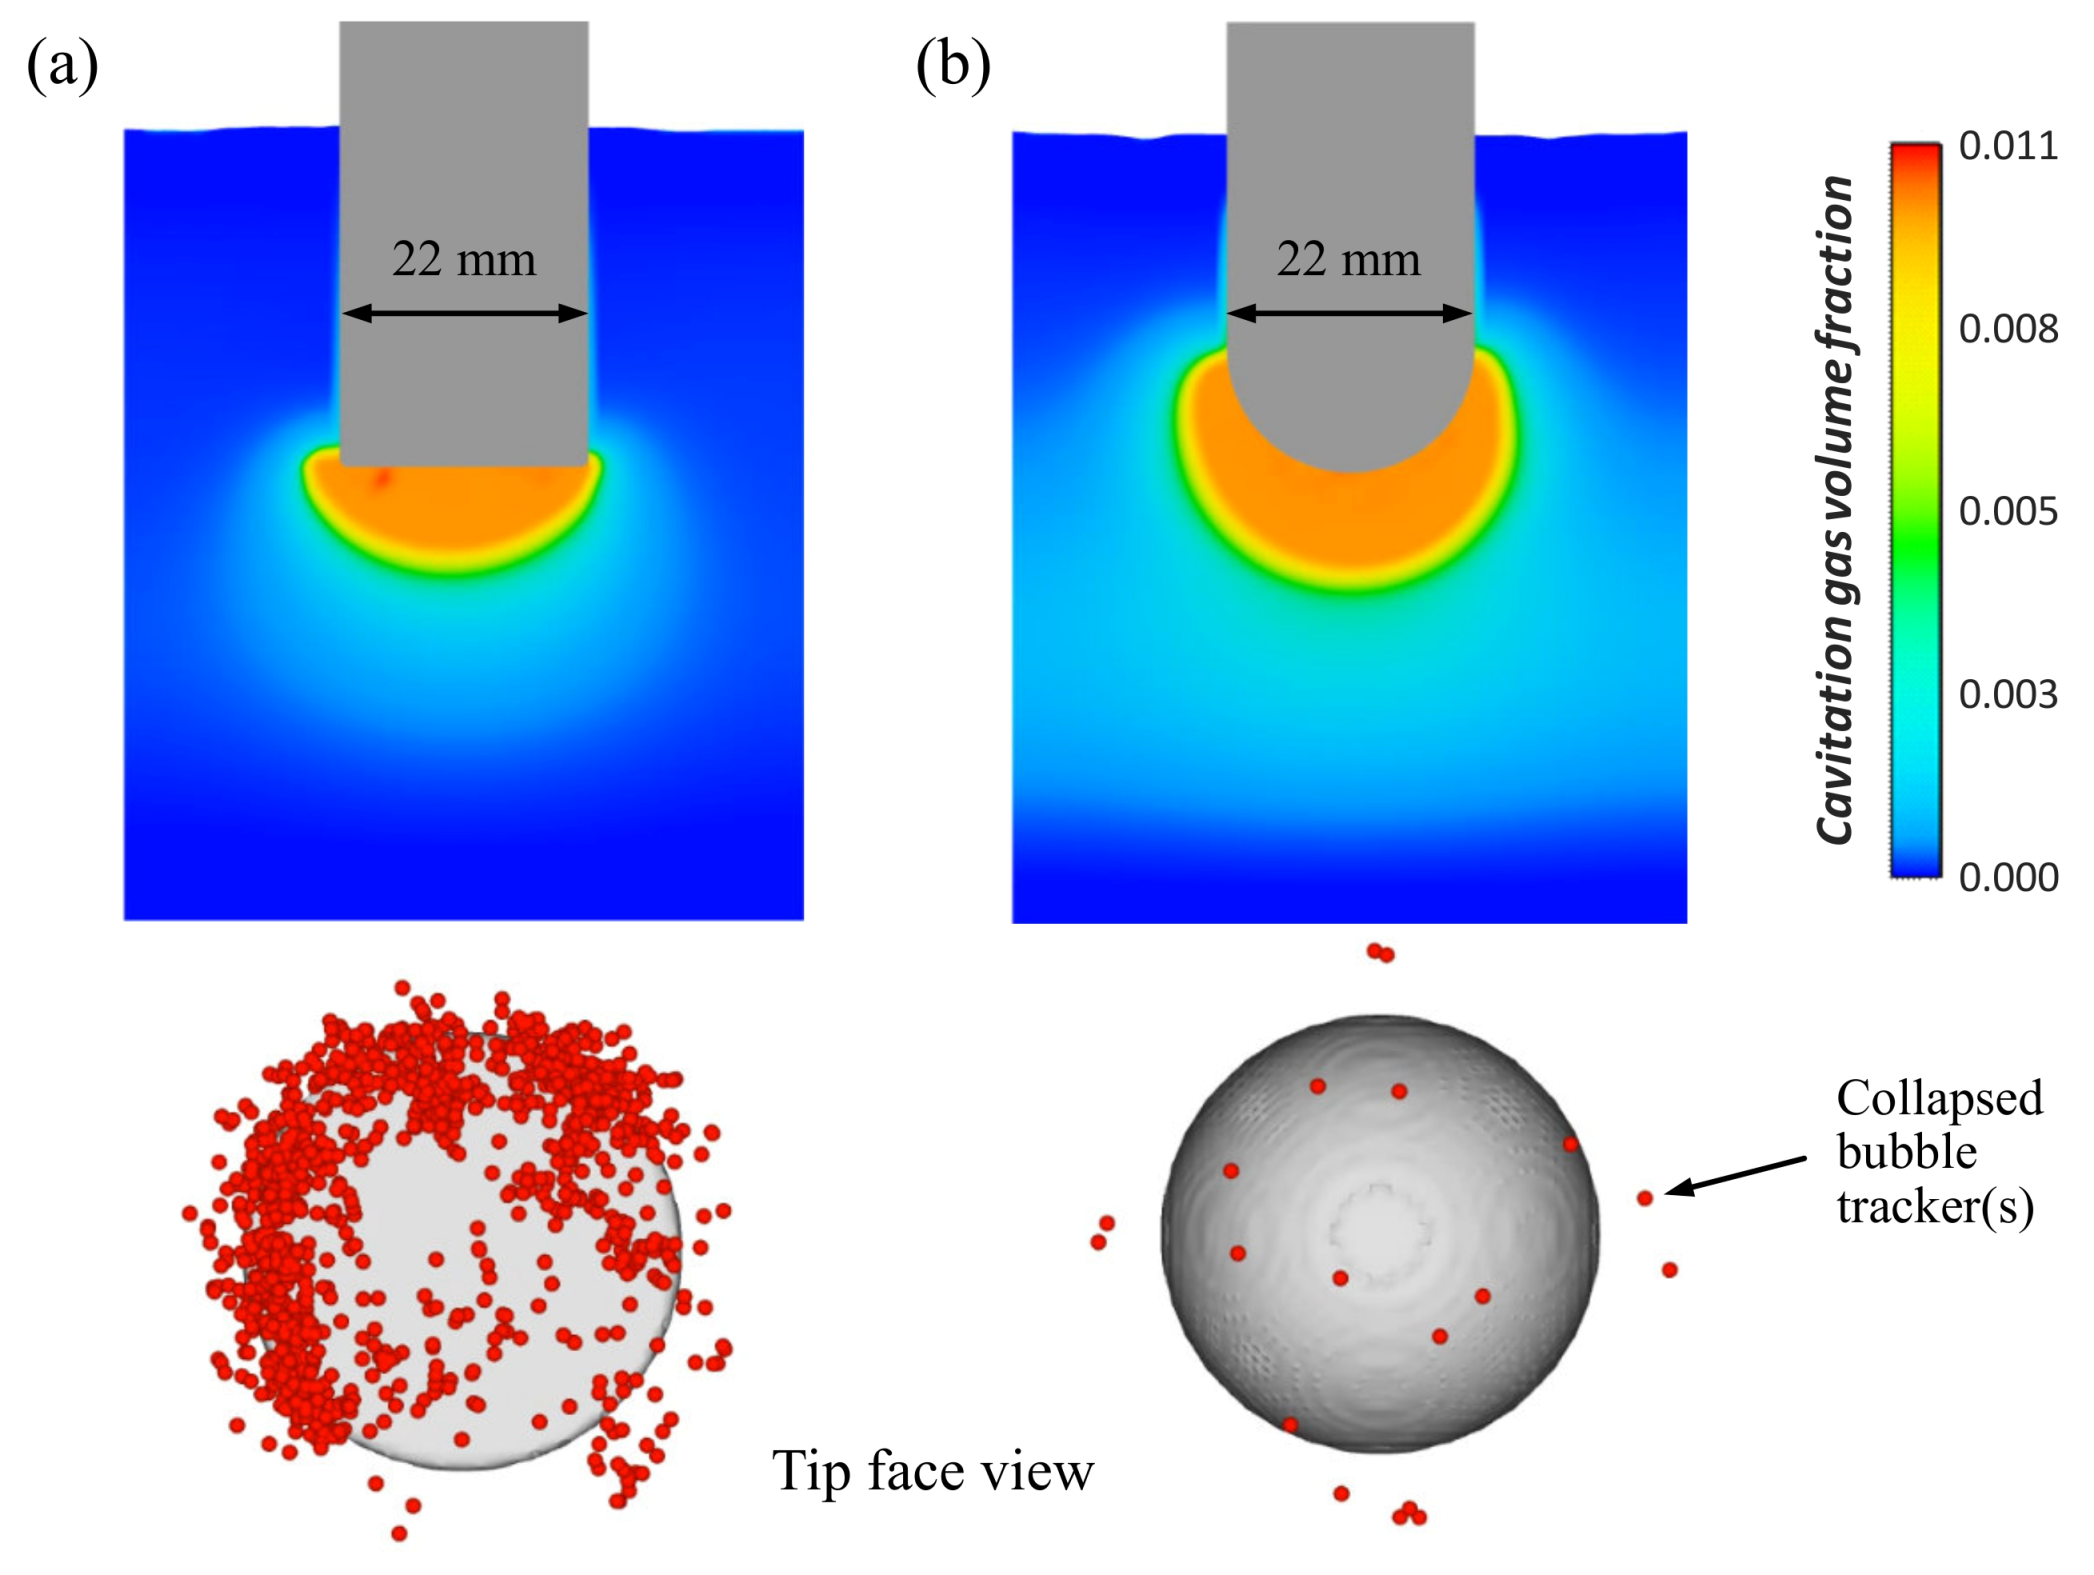
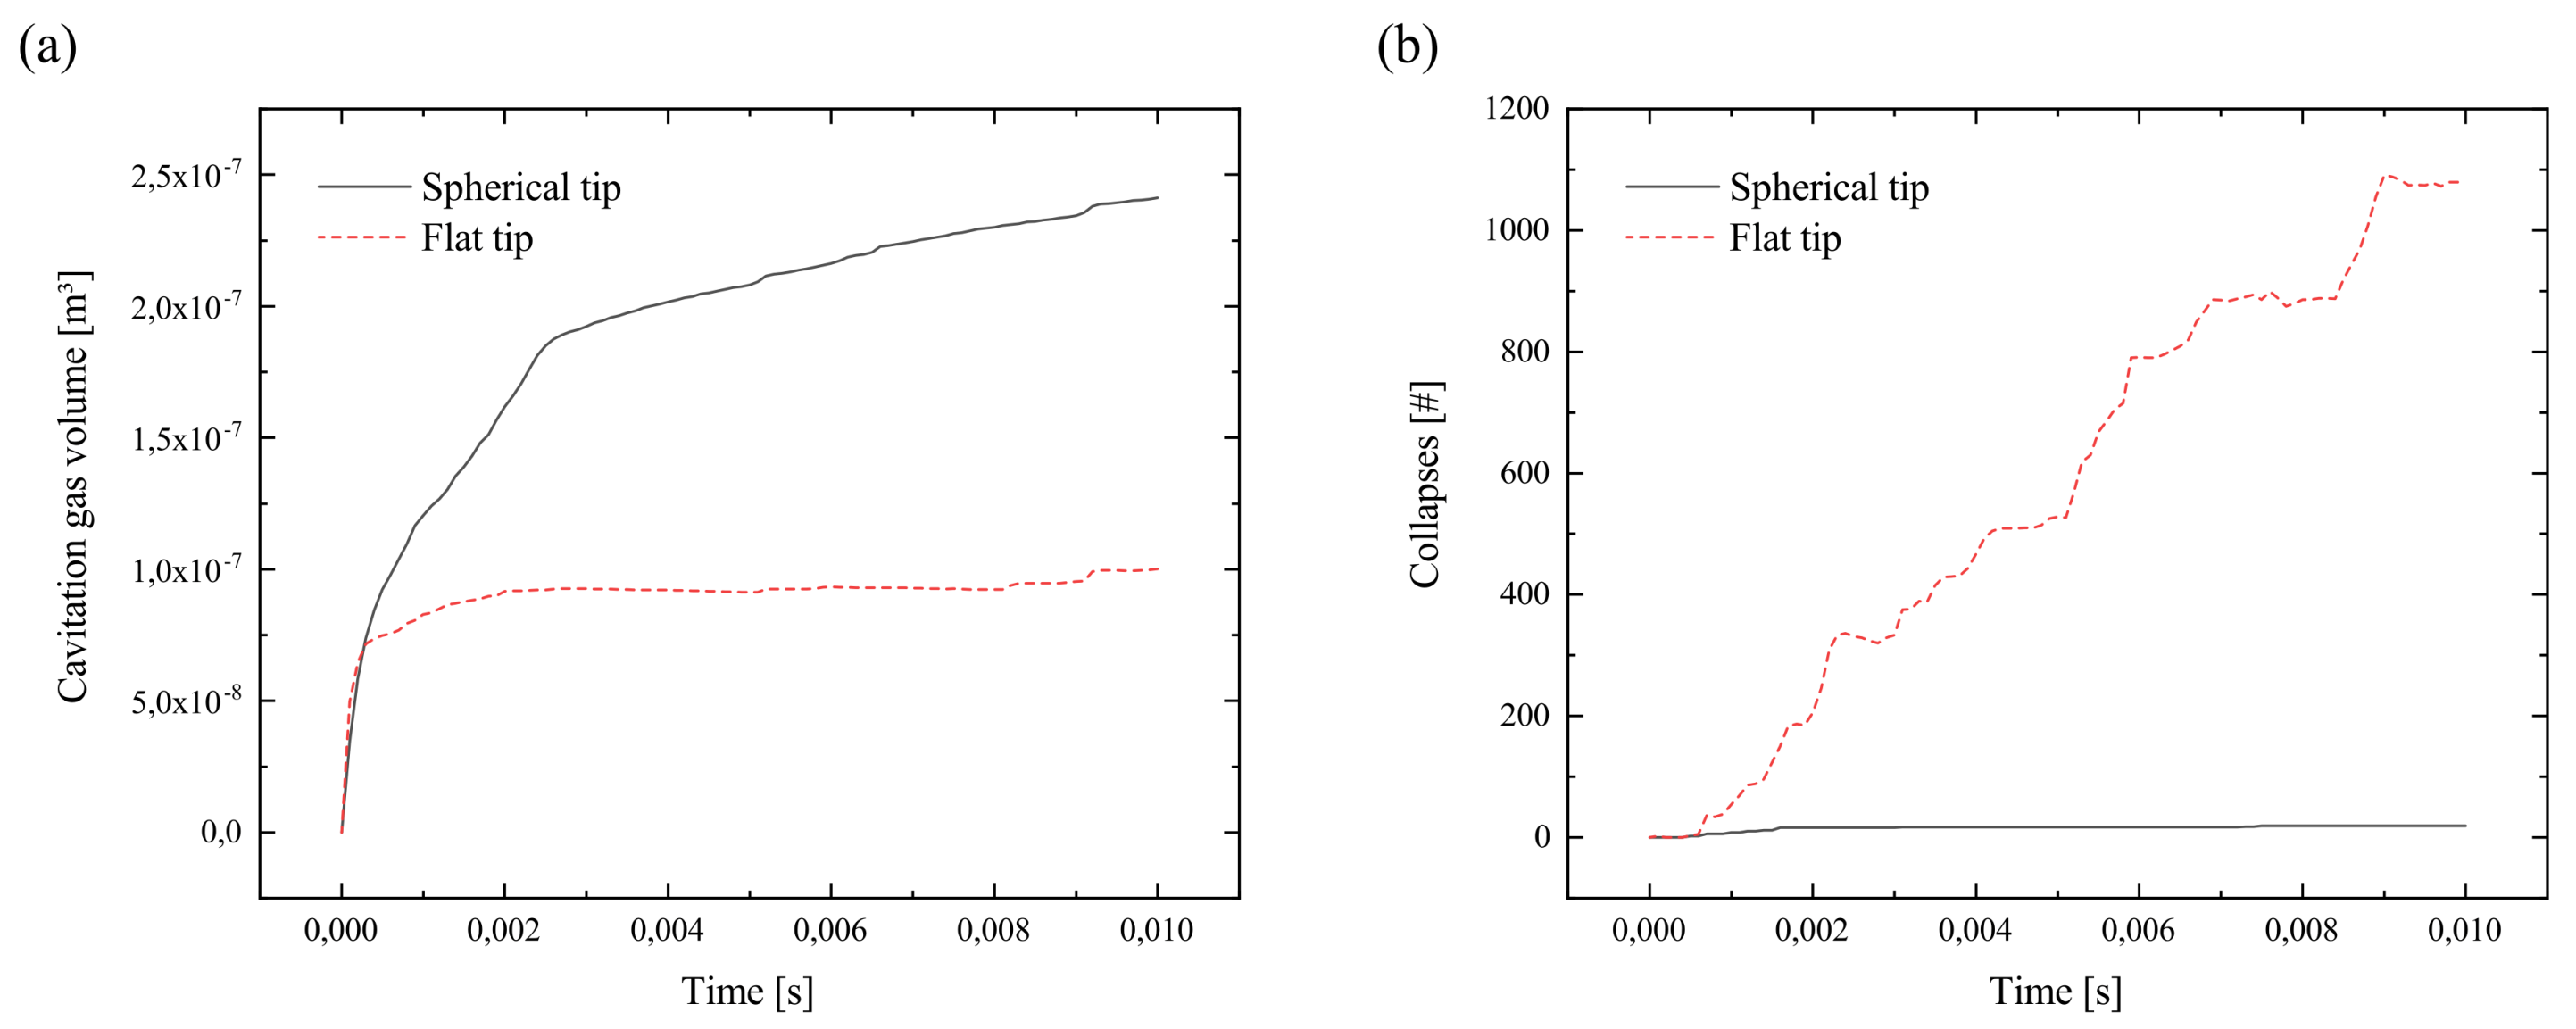
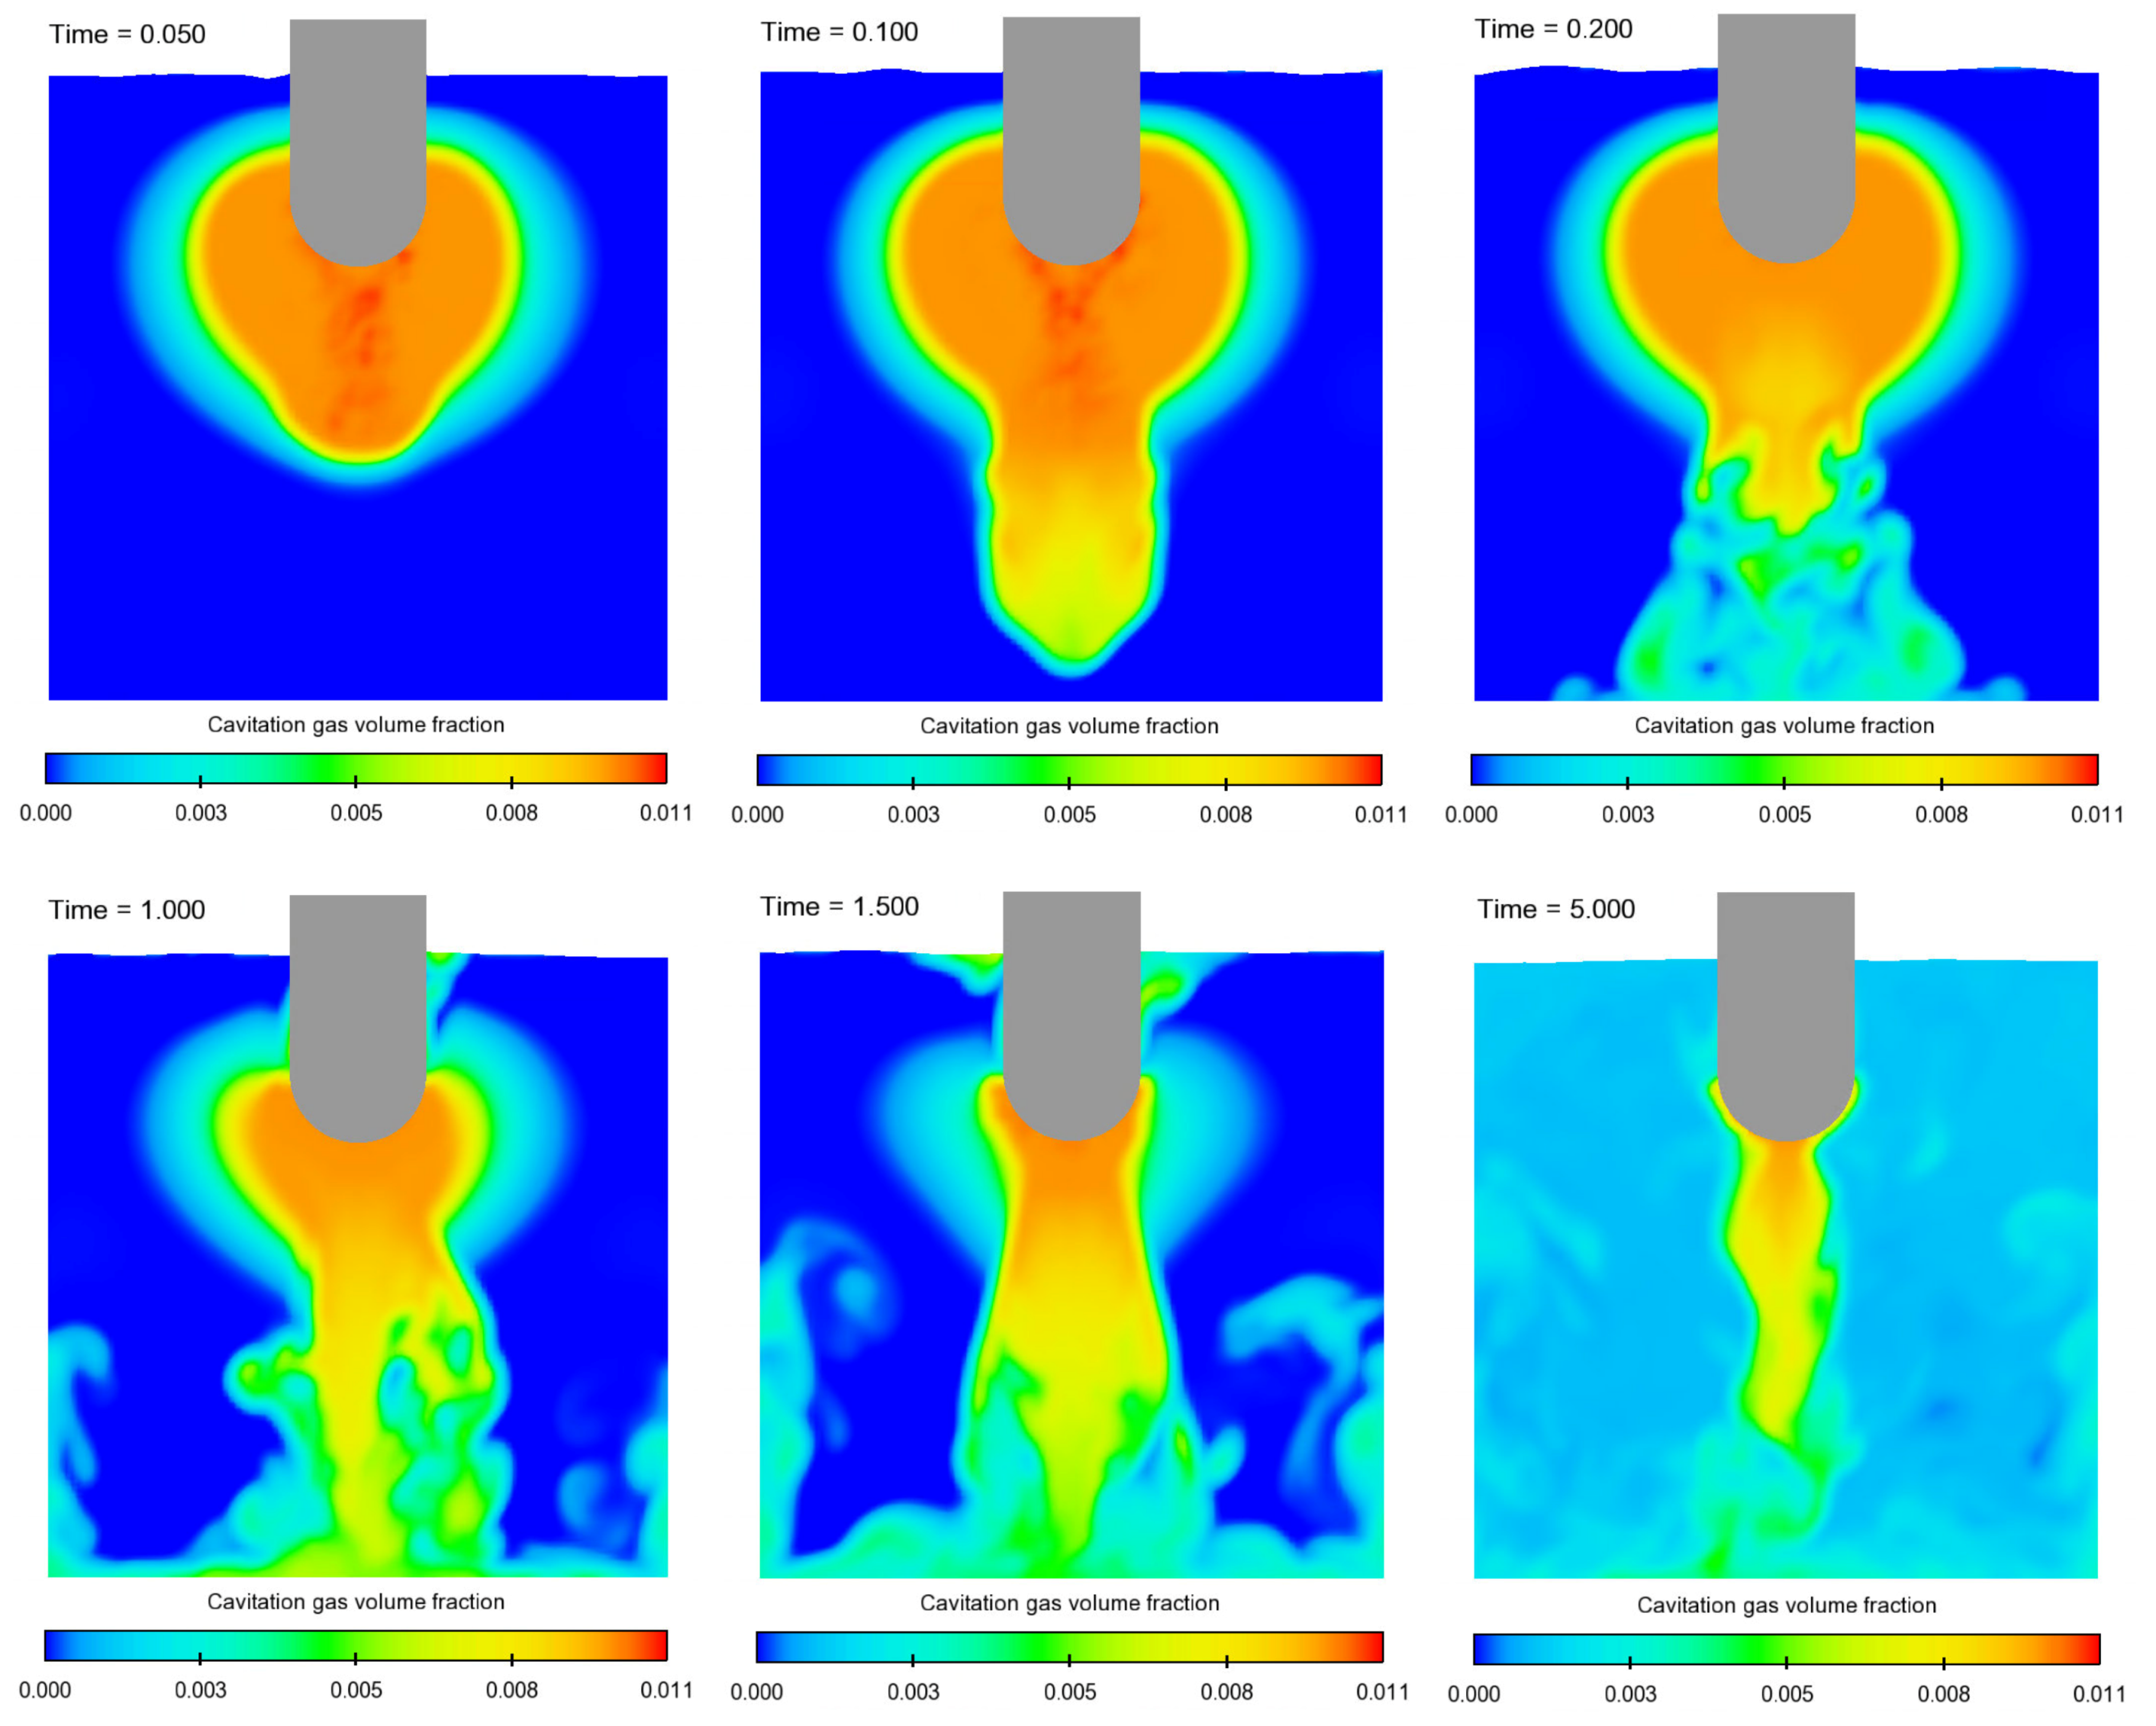
3.2. Cavitation Development

The results for cavitation development for the spherical tip and additionally, for reasons of comparison, for a flat radiator tip, are demonstrated in Figure 4. Furthermore, the radiator-depending collapse activity is demonstrated, since FLOW-3D allows tracking of collapsed bubbles by void particles. Cavitation mainly develops in the area immediately below the radiator, where the highest pressure peaks occur and, consequently, the best conditions for cavitation exist. Note that the cavitation gas volume is bigger in the case of the spherical radiator, but even if the cavitation zone is smaller in the case of the flat radiator, collapse activity is much higher compared to the spherical radiator. Figure 5a demonstrates that in the case of the spherical tip, the total cavitation gas volume fraction at the end of the calculated time period is more than twice as high compared to the flat radiator. However, Figure 5b reveals the much higher collapsing activity in the case of the flat radiator.
The comparison of simulation results with and without the activated cavitation model (apart from that identical) reveals an influence of the cavitation area on wave propagation, as demonstrated in Figure 6 for t = 0.005 s. Within the cavitation zone, a uniform pressure ambient seems to exist (Figure 6a). Without the activated cavitation model, such a zone is not recognizable (Figure 6b). This is supported by Figure 7, where the cavitation activity ties to the current pressure conditions, for the first 7-mm is constant. The pressure waves (and thus, the pressure peaks) are damped by the cavitation cloud, so for the current example, the negative pressure peak differs by a factor of almost four.

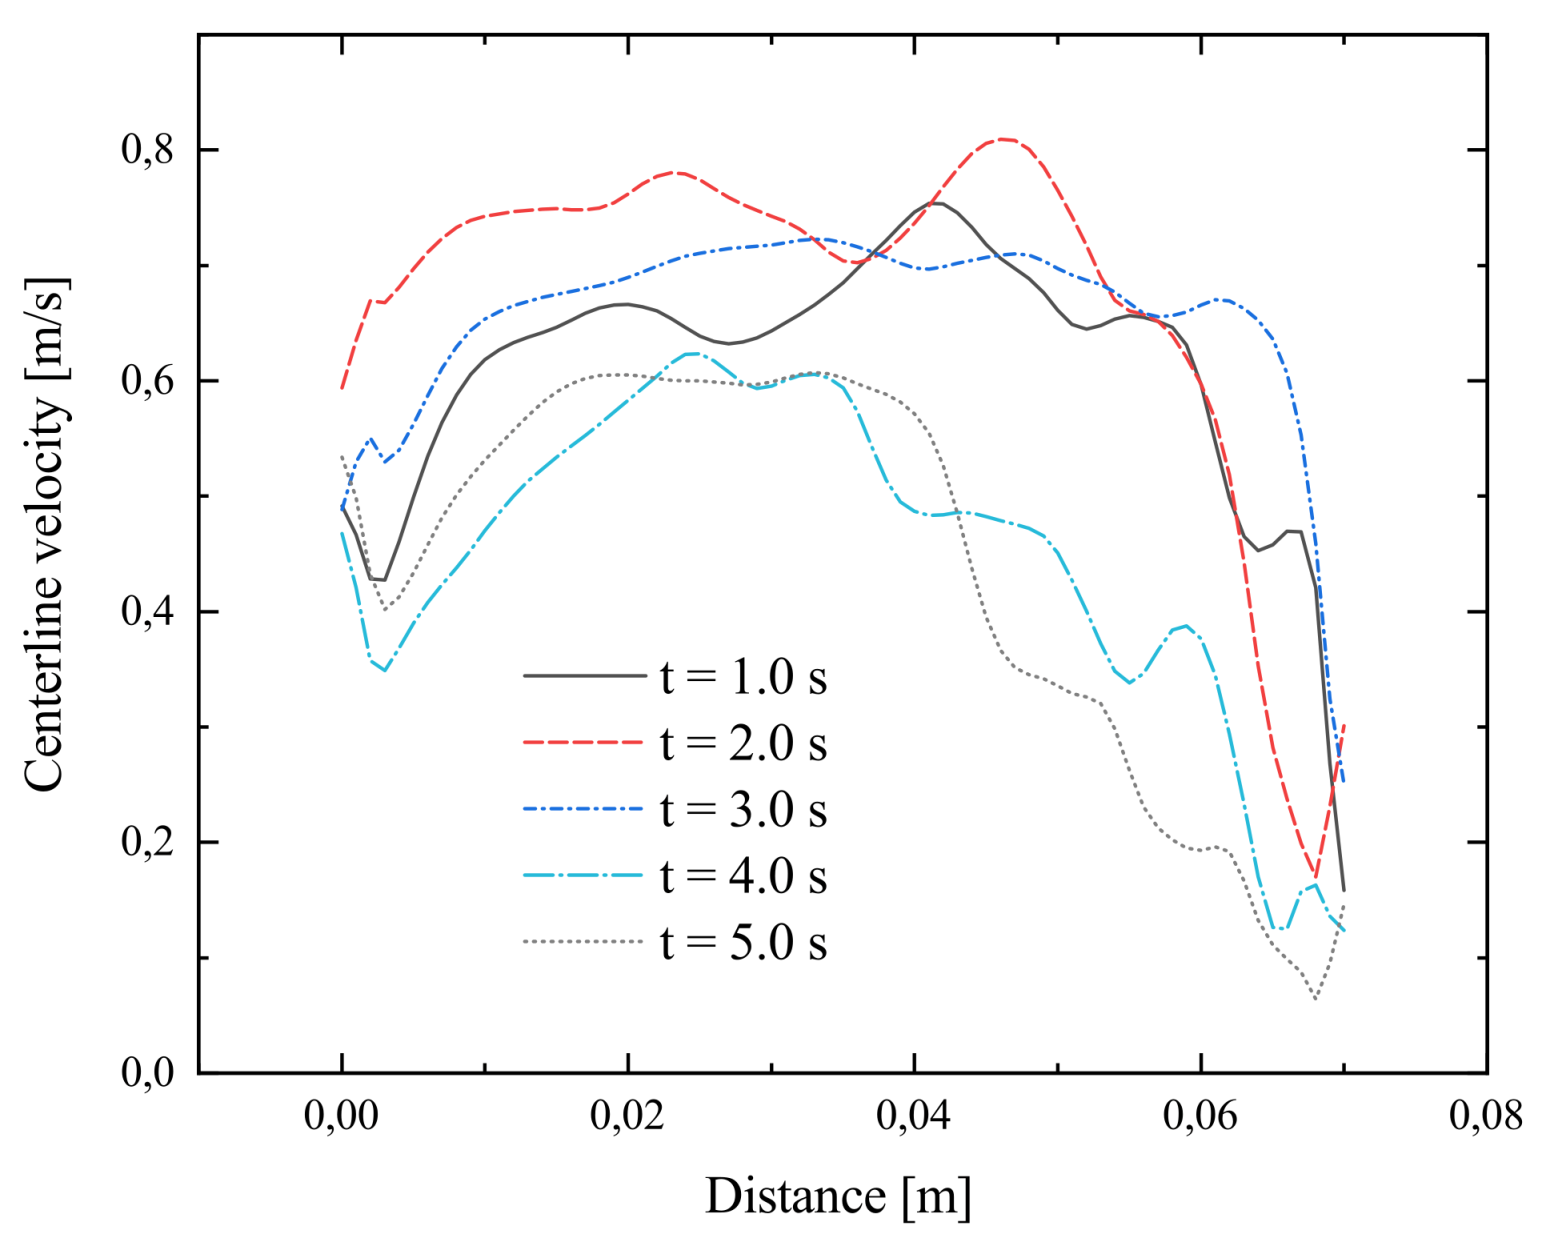
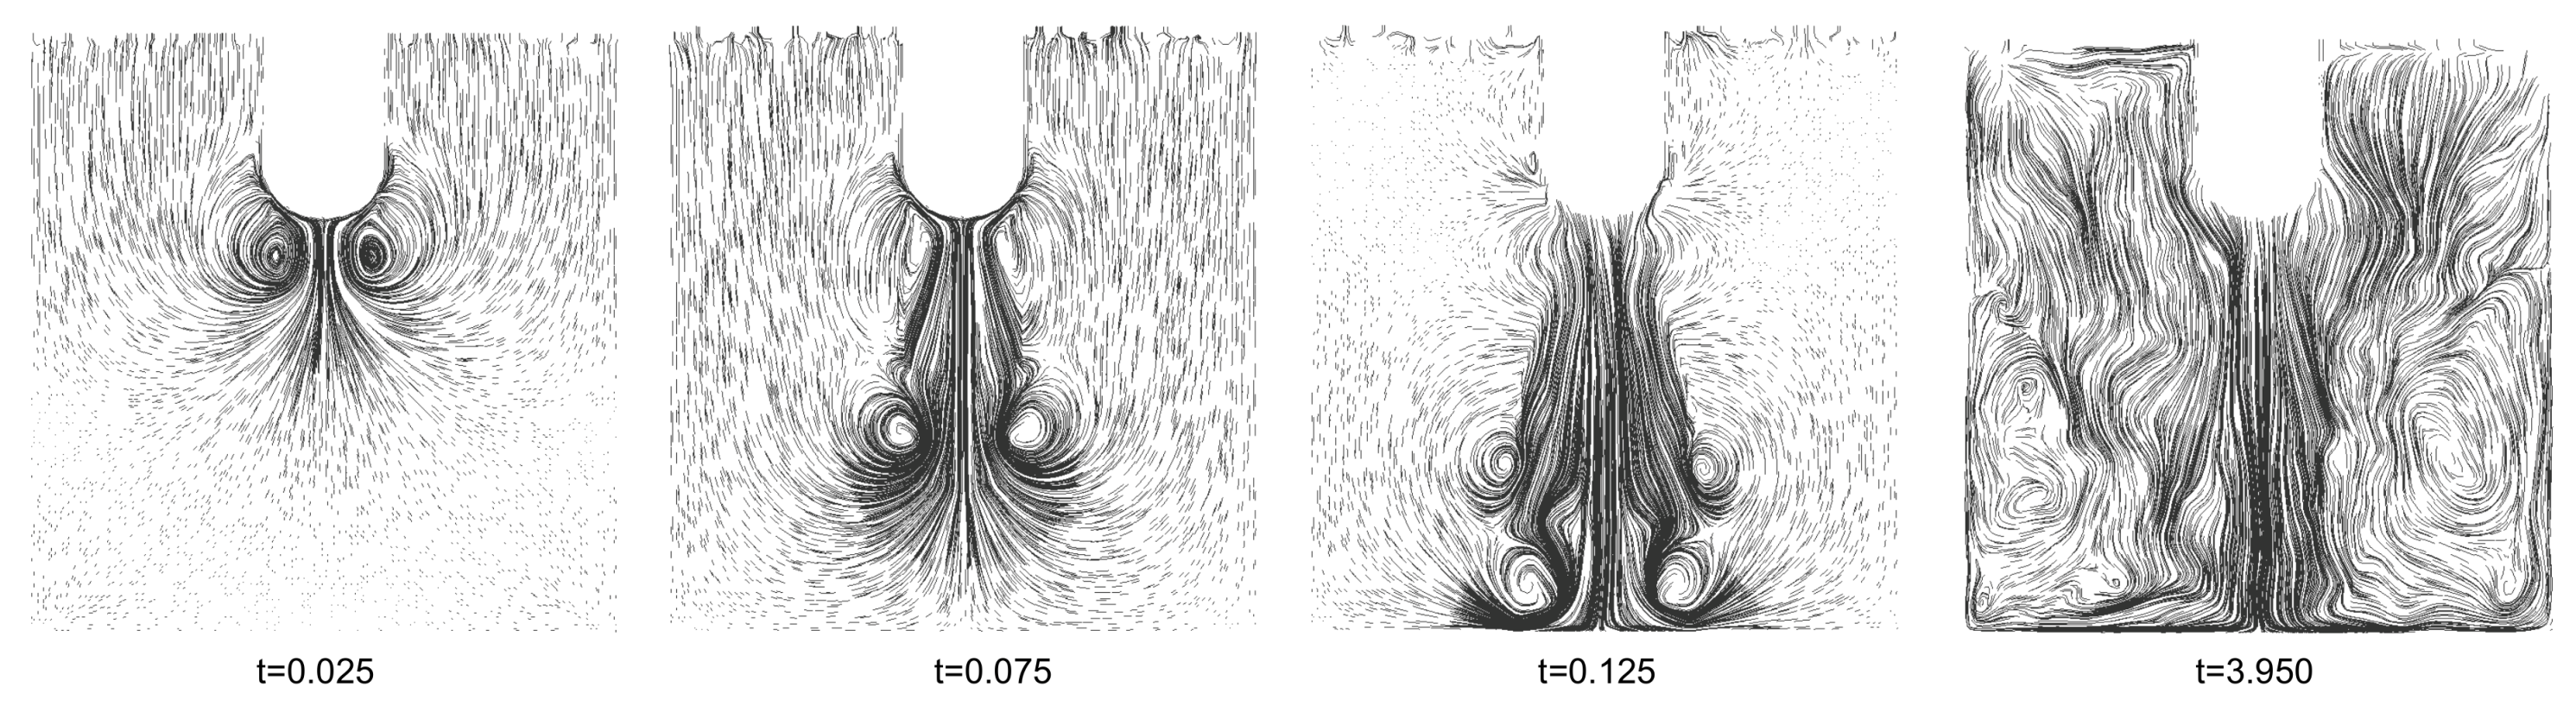
3.3. Acoustic Streaming

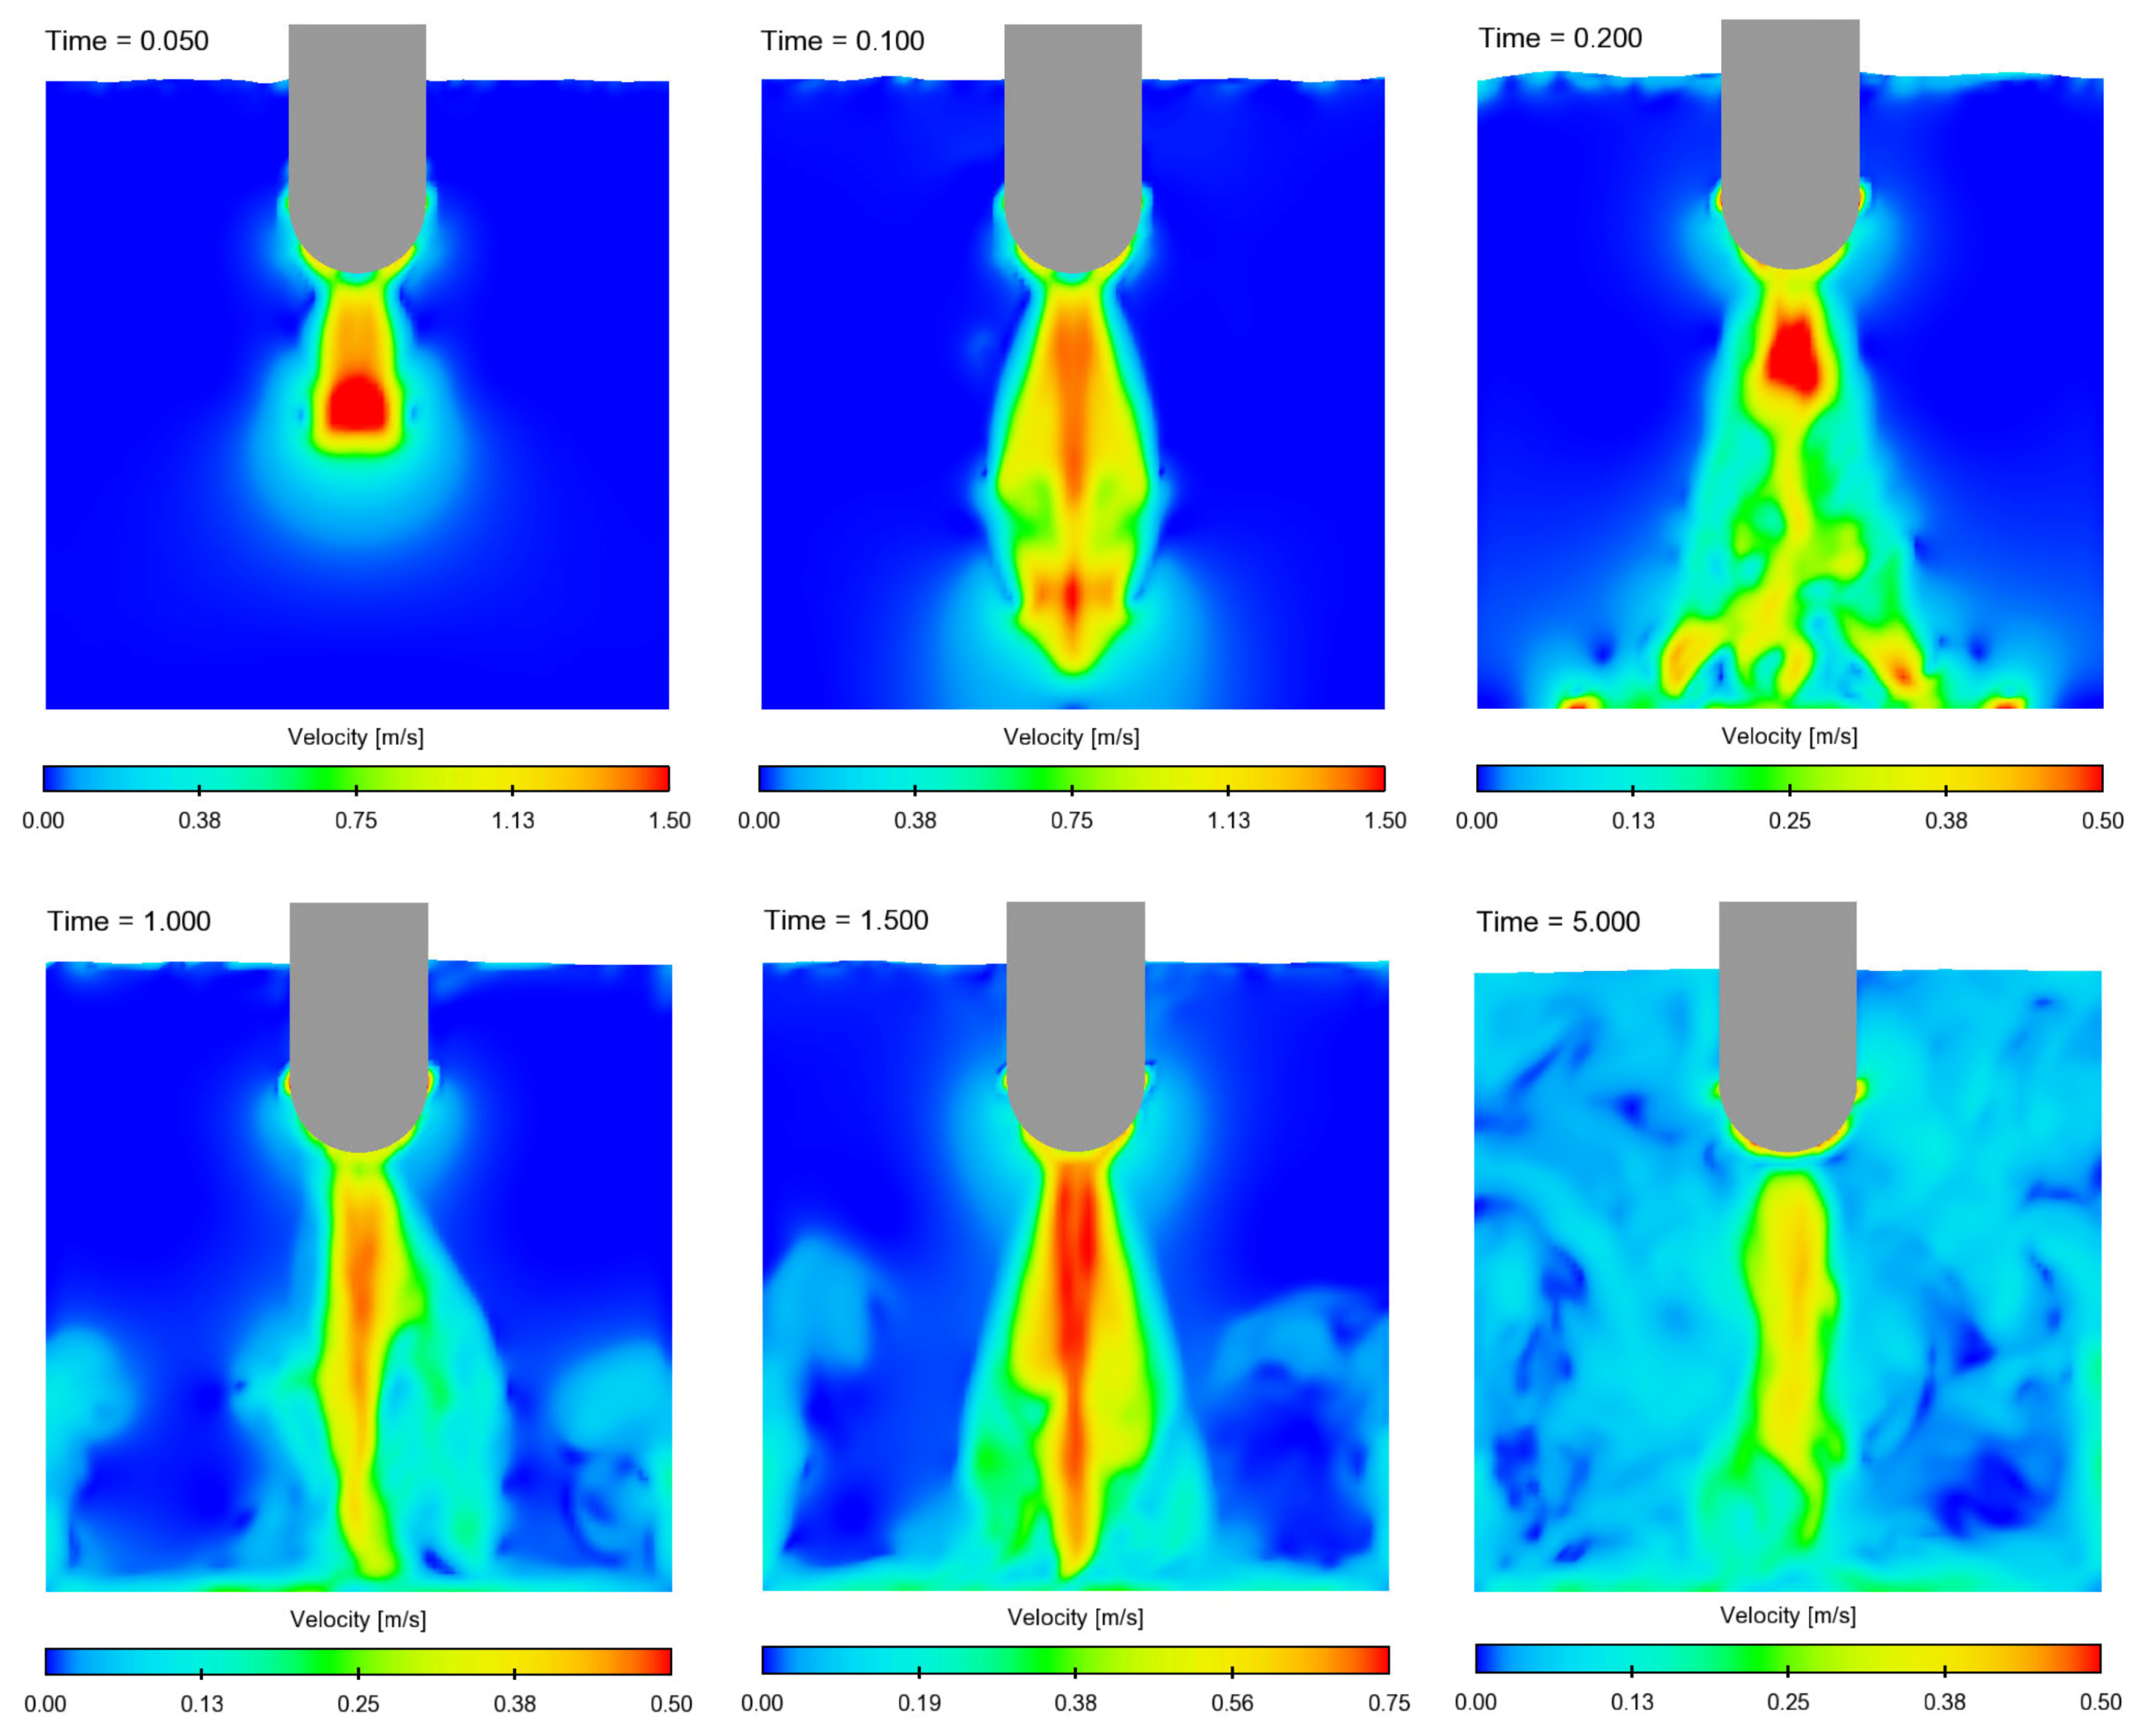
3.3.1. Development and Propagation

Figure 8 shows the development, pattern, and propagation of acoustic streaming. First, the streaming front propagates in the –z-direction, with a streaming center velocity of 1.5 to 1.7 m/s. The streaming reaches the bottom after approximately 0.1 s and decelerates because of redirection in the xy-plane and loses the majority of its velocity. Additionally, a feedback takes place which leads to a streaming deceleration from the radiator to the bottom. The streaming velocity in this area henceforth is 0.6 to 0.7 m/s. The continuing streaming forces the horizontal circular propagation of the fluid, and leads to perpendicular ascension on the sidewalls. After reaching the walls, the stream is redirected once more. It decelerates once again and climbs up the vessel walls. The velocities at the bottom and walls are approximately 0.2 to 0.4 m/s and 0.05 to 0.2 m/s, respectively. Reaching a specific height, the sidewall-stream falls perpendicular to the wall in the middle of the vessel near the mainstream and completes a circular flow, which enables a continuing mixing of the fluid. After 5 s, the whole fluid volume is in motion. Figure 9 illustrates the corresponding centerline-velocities in –z-direction for 1, 2, 3, 4, and 5 s.
Figure 10 shows the acoustic streaming velocity pattern for four different stages of acoustic streaming development and reveals the formation of eddies along the main stream (radiator to the bottom). At t = 3.950 s, the whole fluid is in motion and turbulences in the fluid are recognizable.

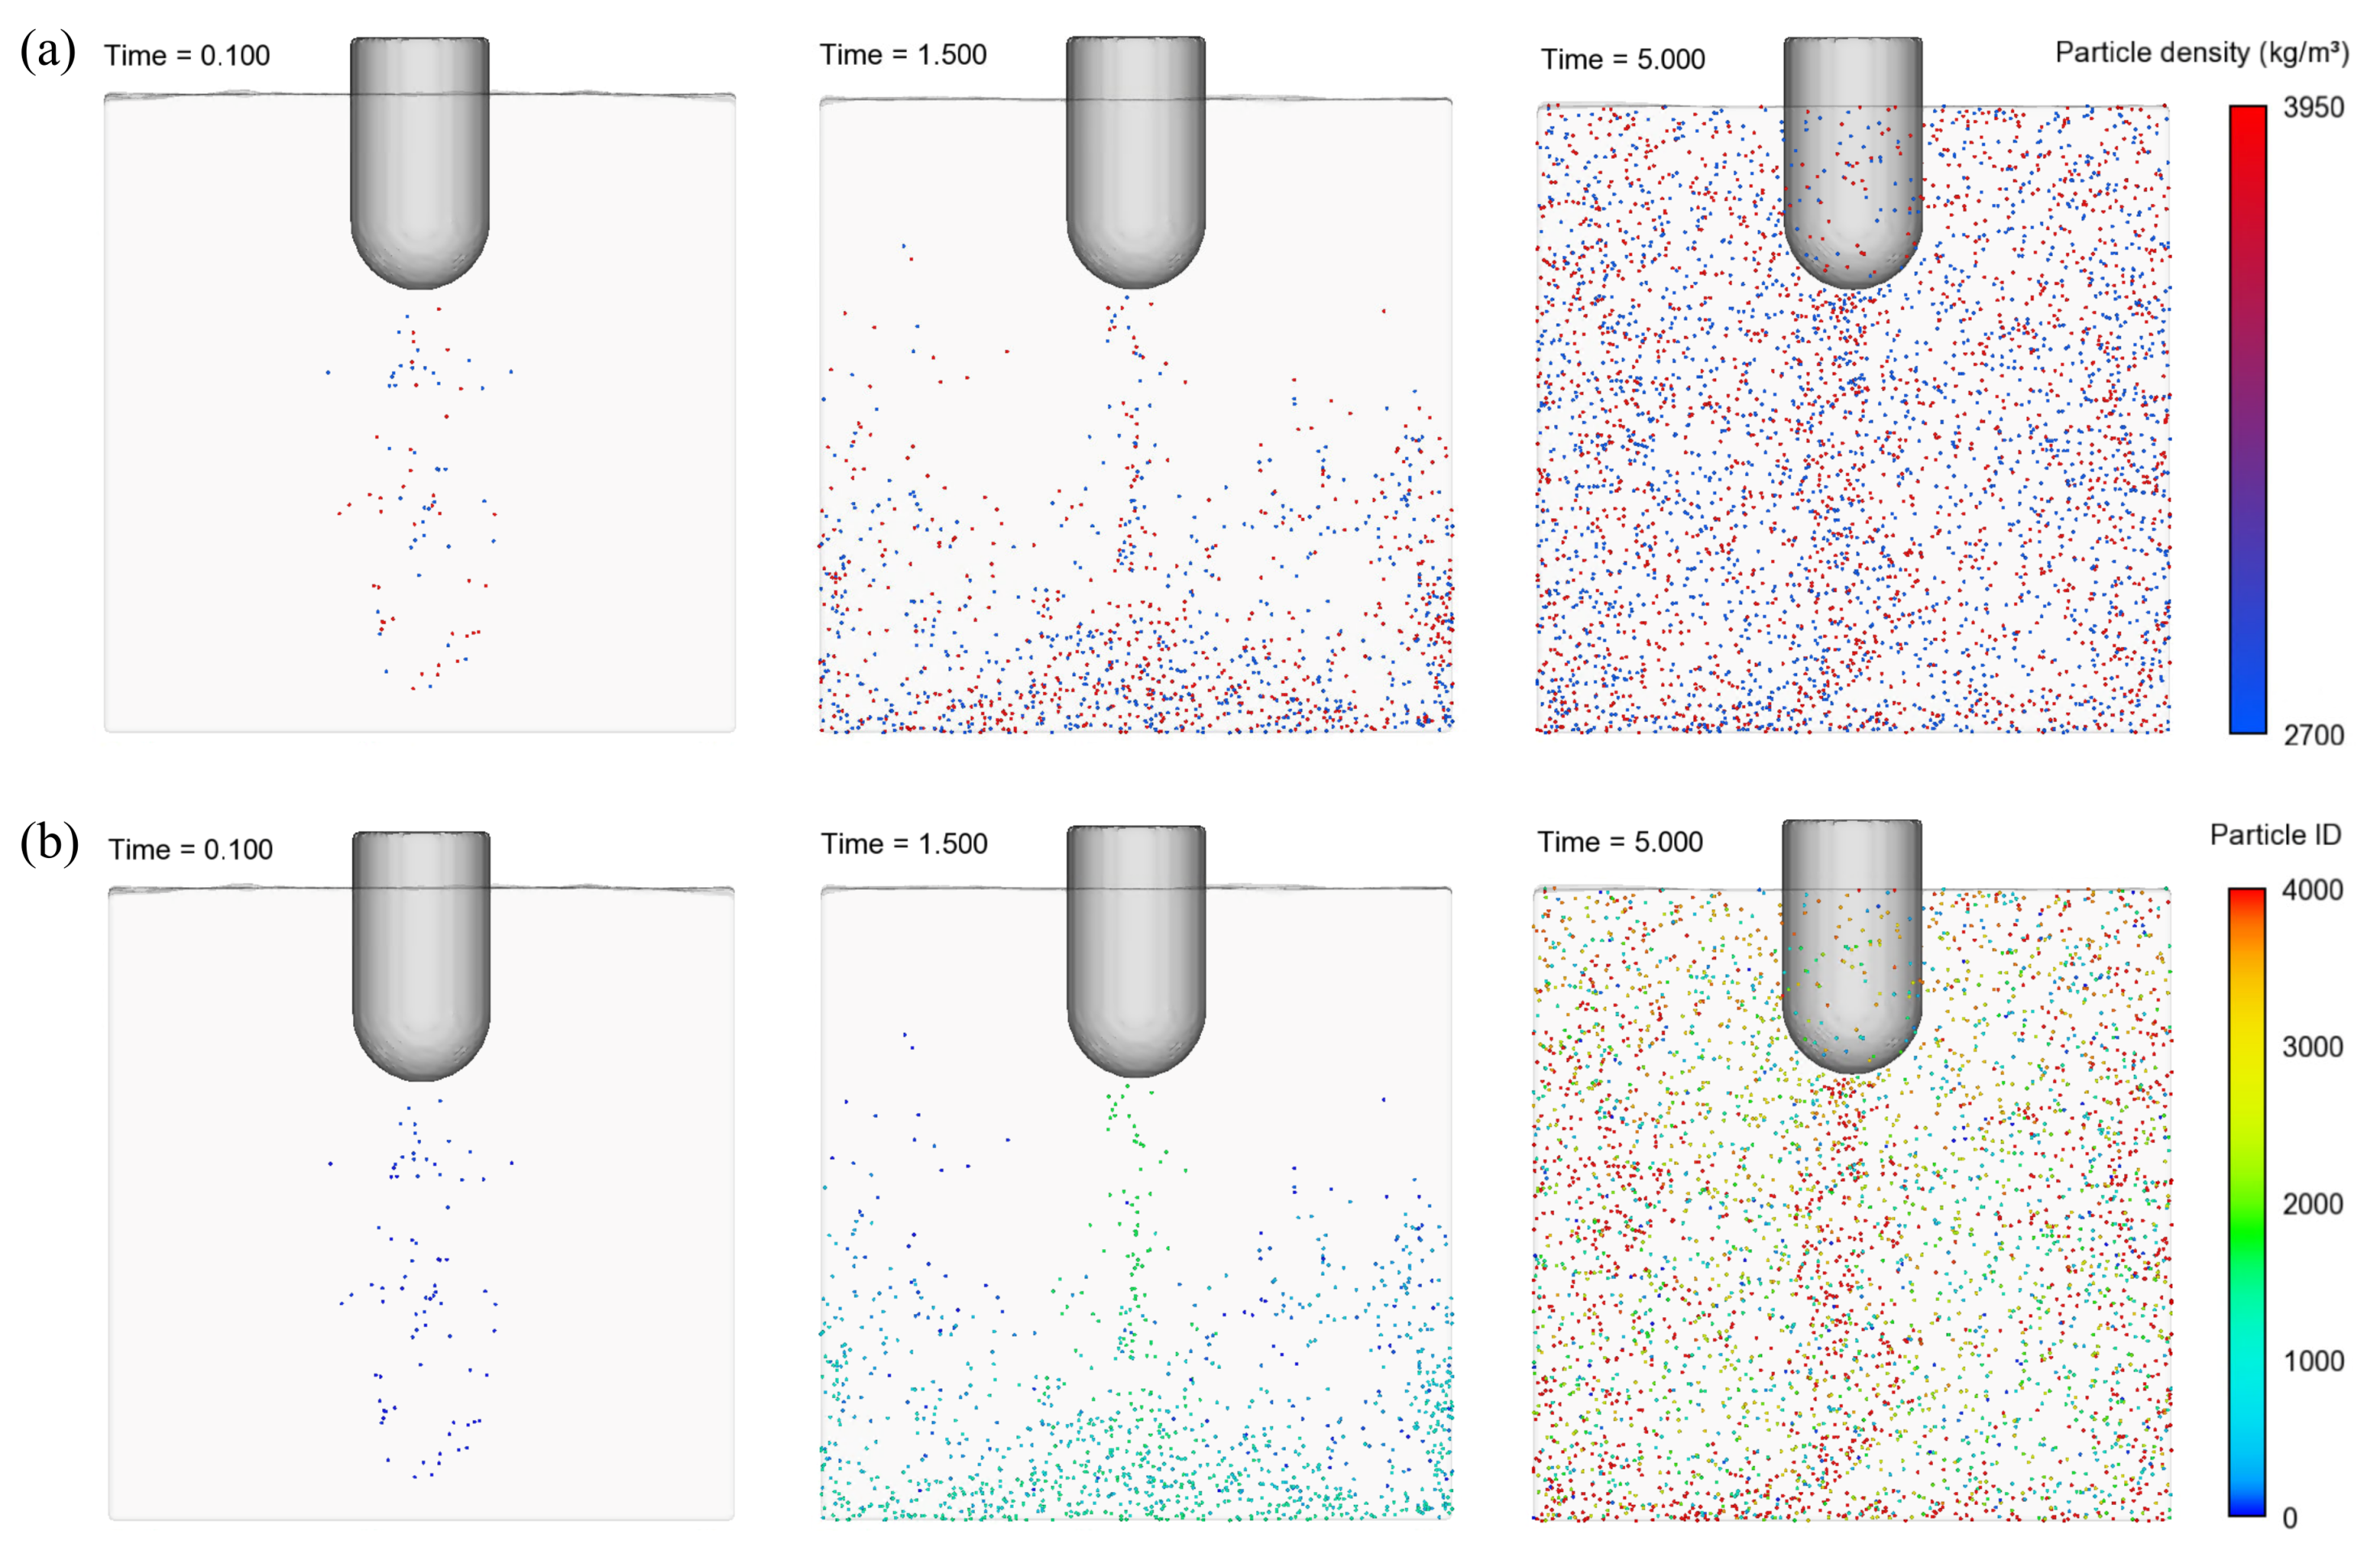
3.3.2. Cavitation and Mass Transport

The influence of acoustic streaming on cavitation is shown in Figure 11. After 0.05 s, the cavitation zone around the tip reaches a steady-state and gets penetrated from the downward-directed streaming front. Cavitation bubbles are entrained by acoustic streaming and transported in the bulk liquid. As a result, the size of the zone decreases considerably. It can be seen that the density of cavitation bubbles drastically decreases with growing distance from the radiation surface (e.g., t = 0.2 s). After approximately 40 mm, the majority of the created cavitation bubbles disappeared because of the decreasing pressure values in the growing distance to the radiator. A certain bubble proportion seems to be stable and gets transported and distributed through the bulk of the fluid volume. The remaining bubbles follow the flow of acoustic streaming on the bottom and side walls (t = 1.5 s) and are distributed throughout the whole fluid volume (t = 5 s).
Figure 12 shows the influence of acoustic streaming on the distribution of particles within the fluid. As described above, two kinds of particles were defined: Al 2 O 3 and pure Al. In Figure 13a, the Al 2 O 3 - and Al-particles are the dark and bright dots, respectively. In comparison with Figure 11, it is recognizable that all particles, independent of their size and density within the model, are transported by the stream and follow its direction. In a matter of 5 s, the particles are distributed in the bulk of the melt volume. In Figure 13b, the particles are colored as a function of appearance. The course of the particles, particularly the early ones, reveals the characteristic pattern of the circular flow, since some of the first particles (dark) are within the mainstream again.

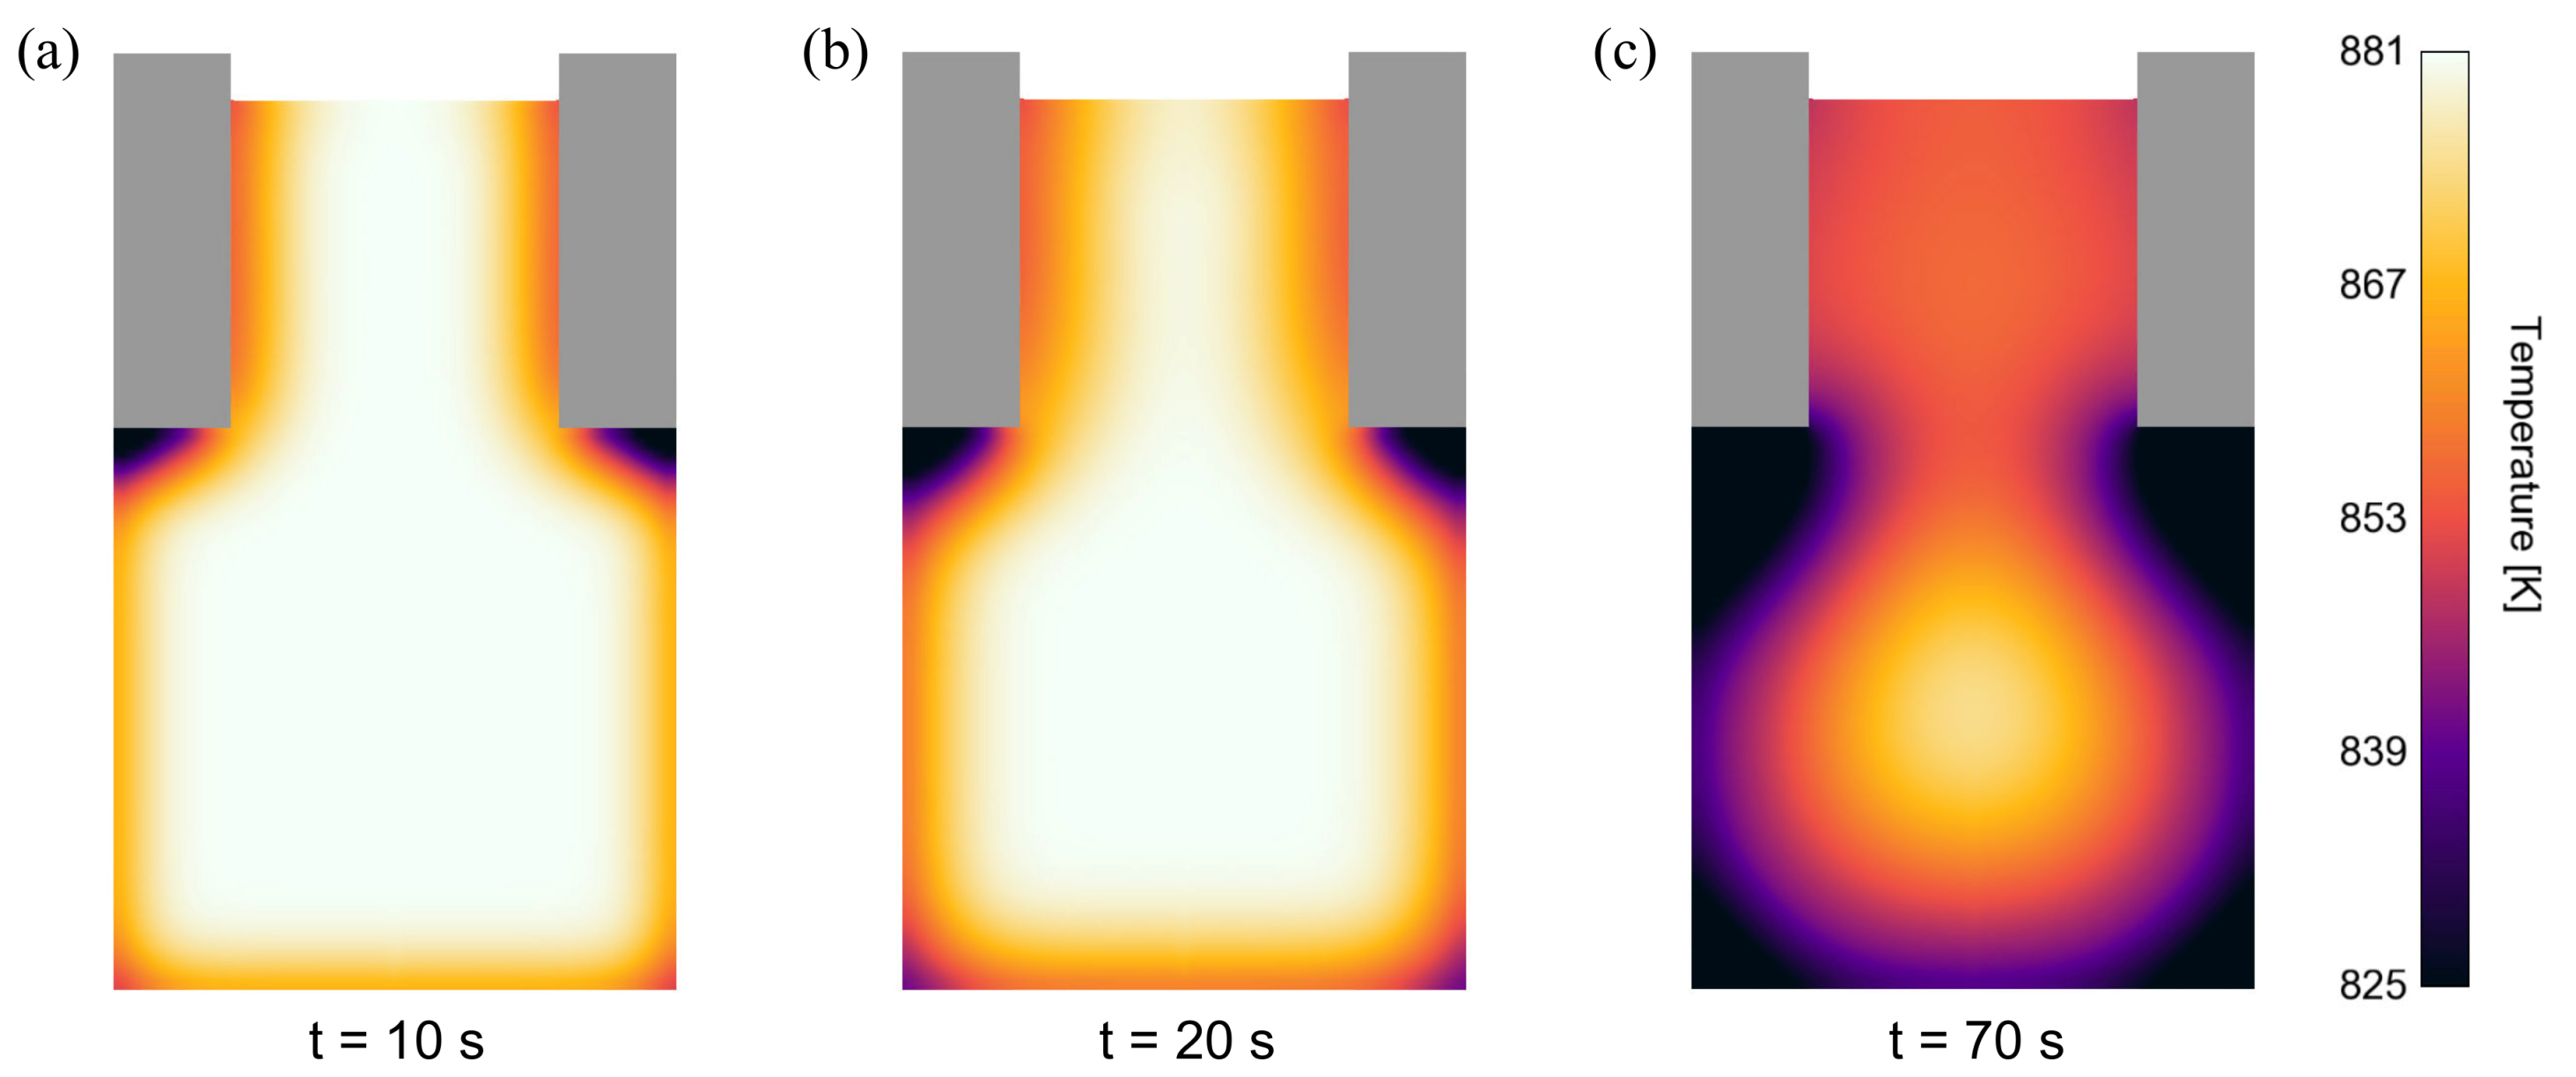
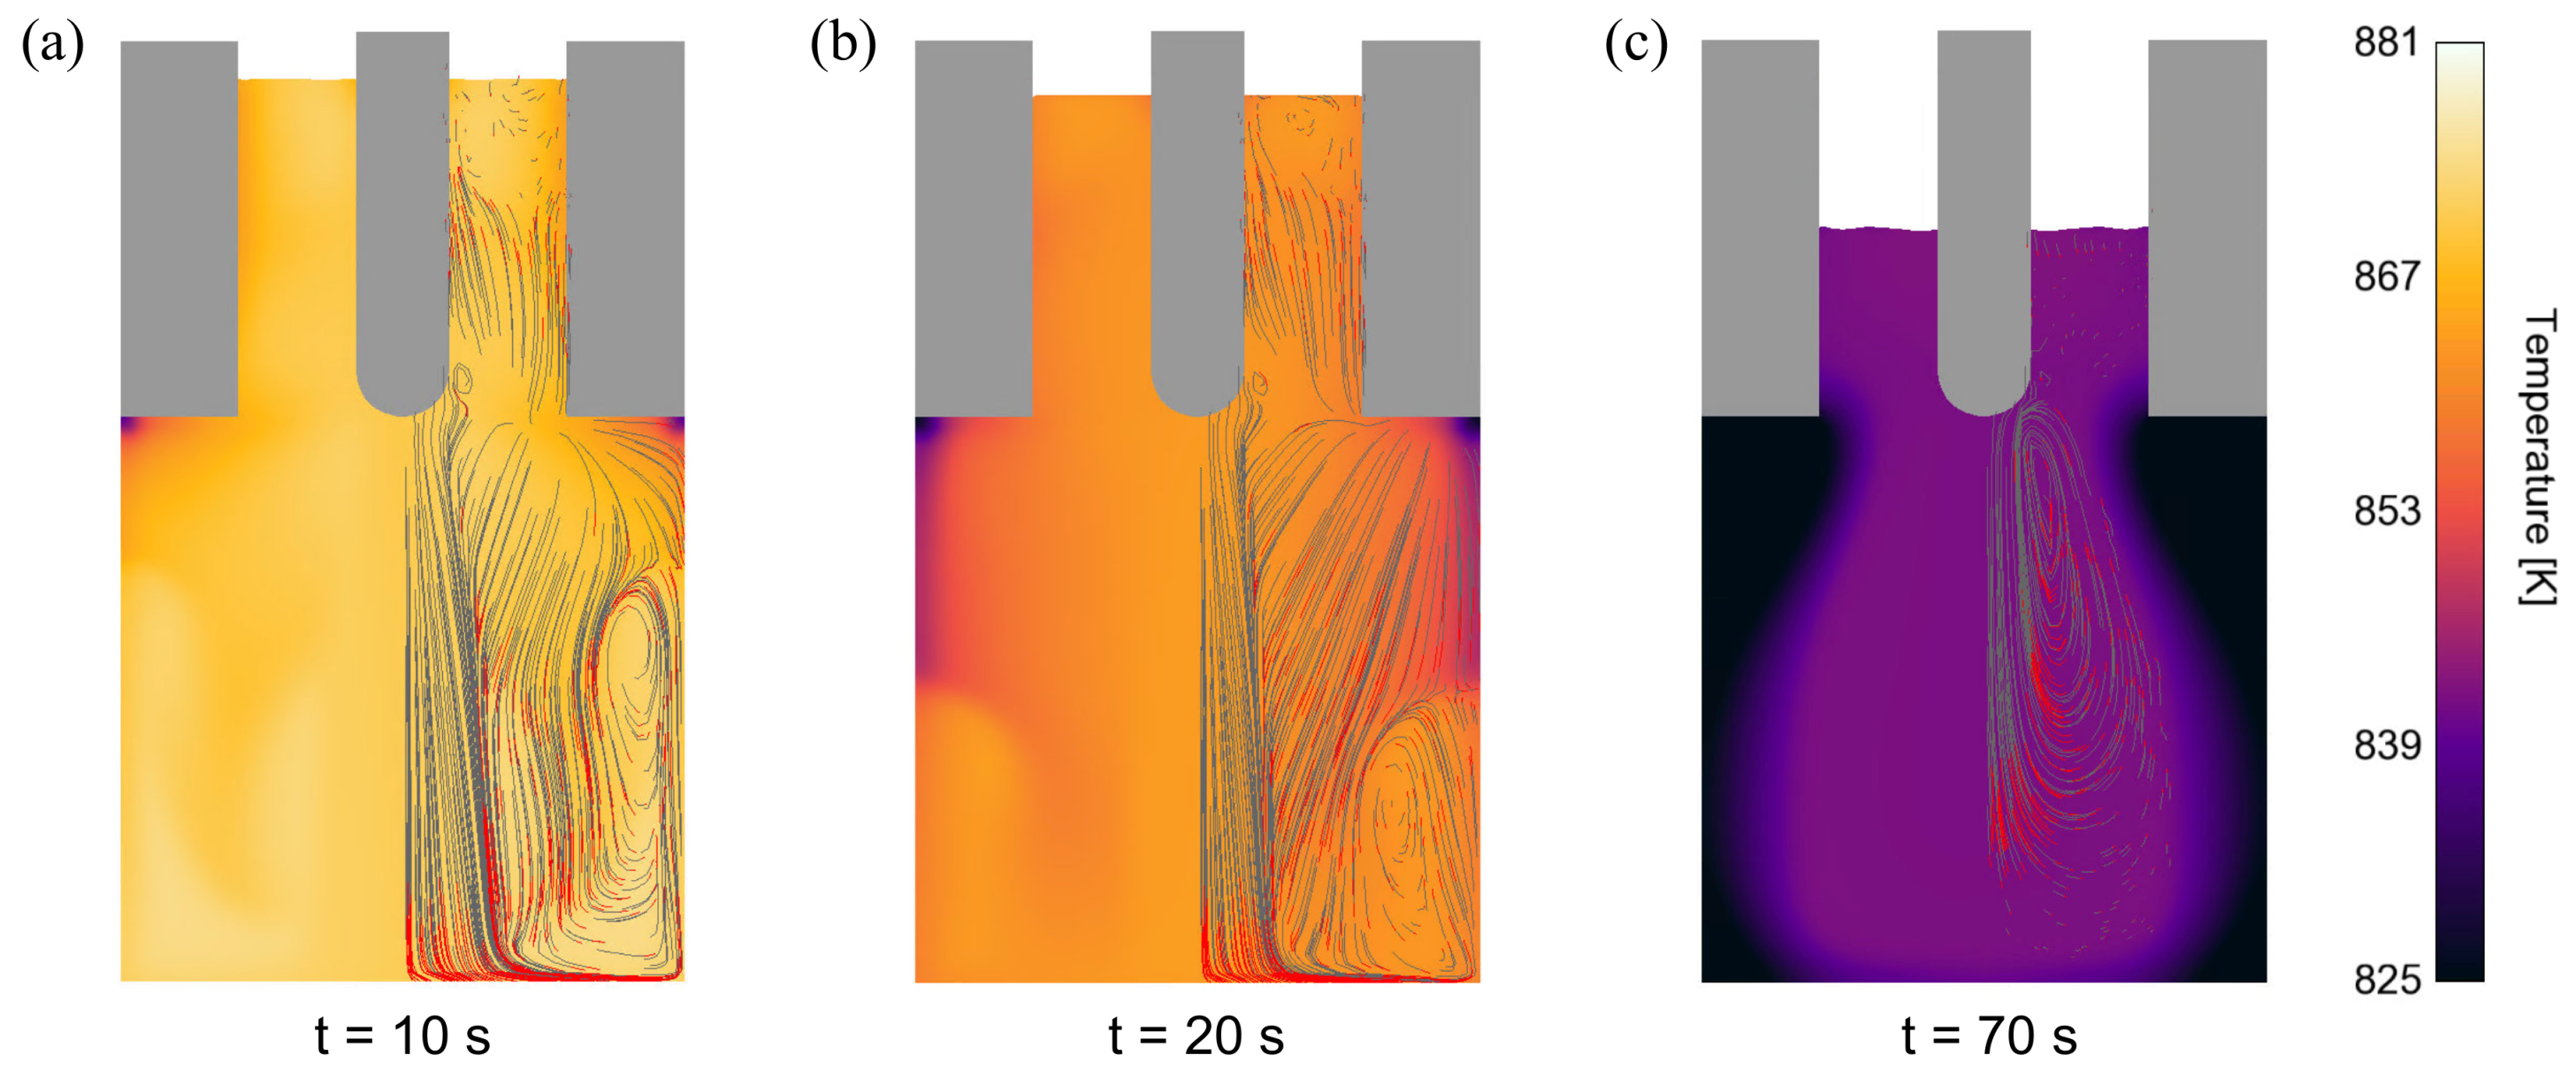
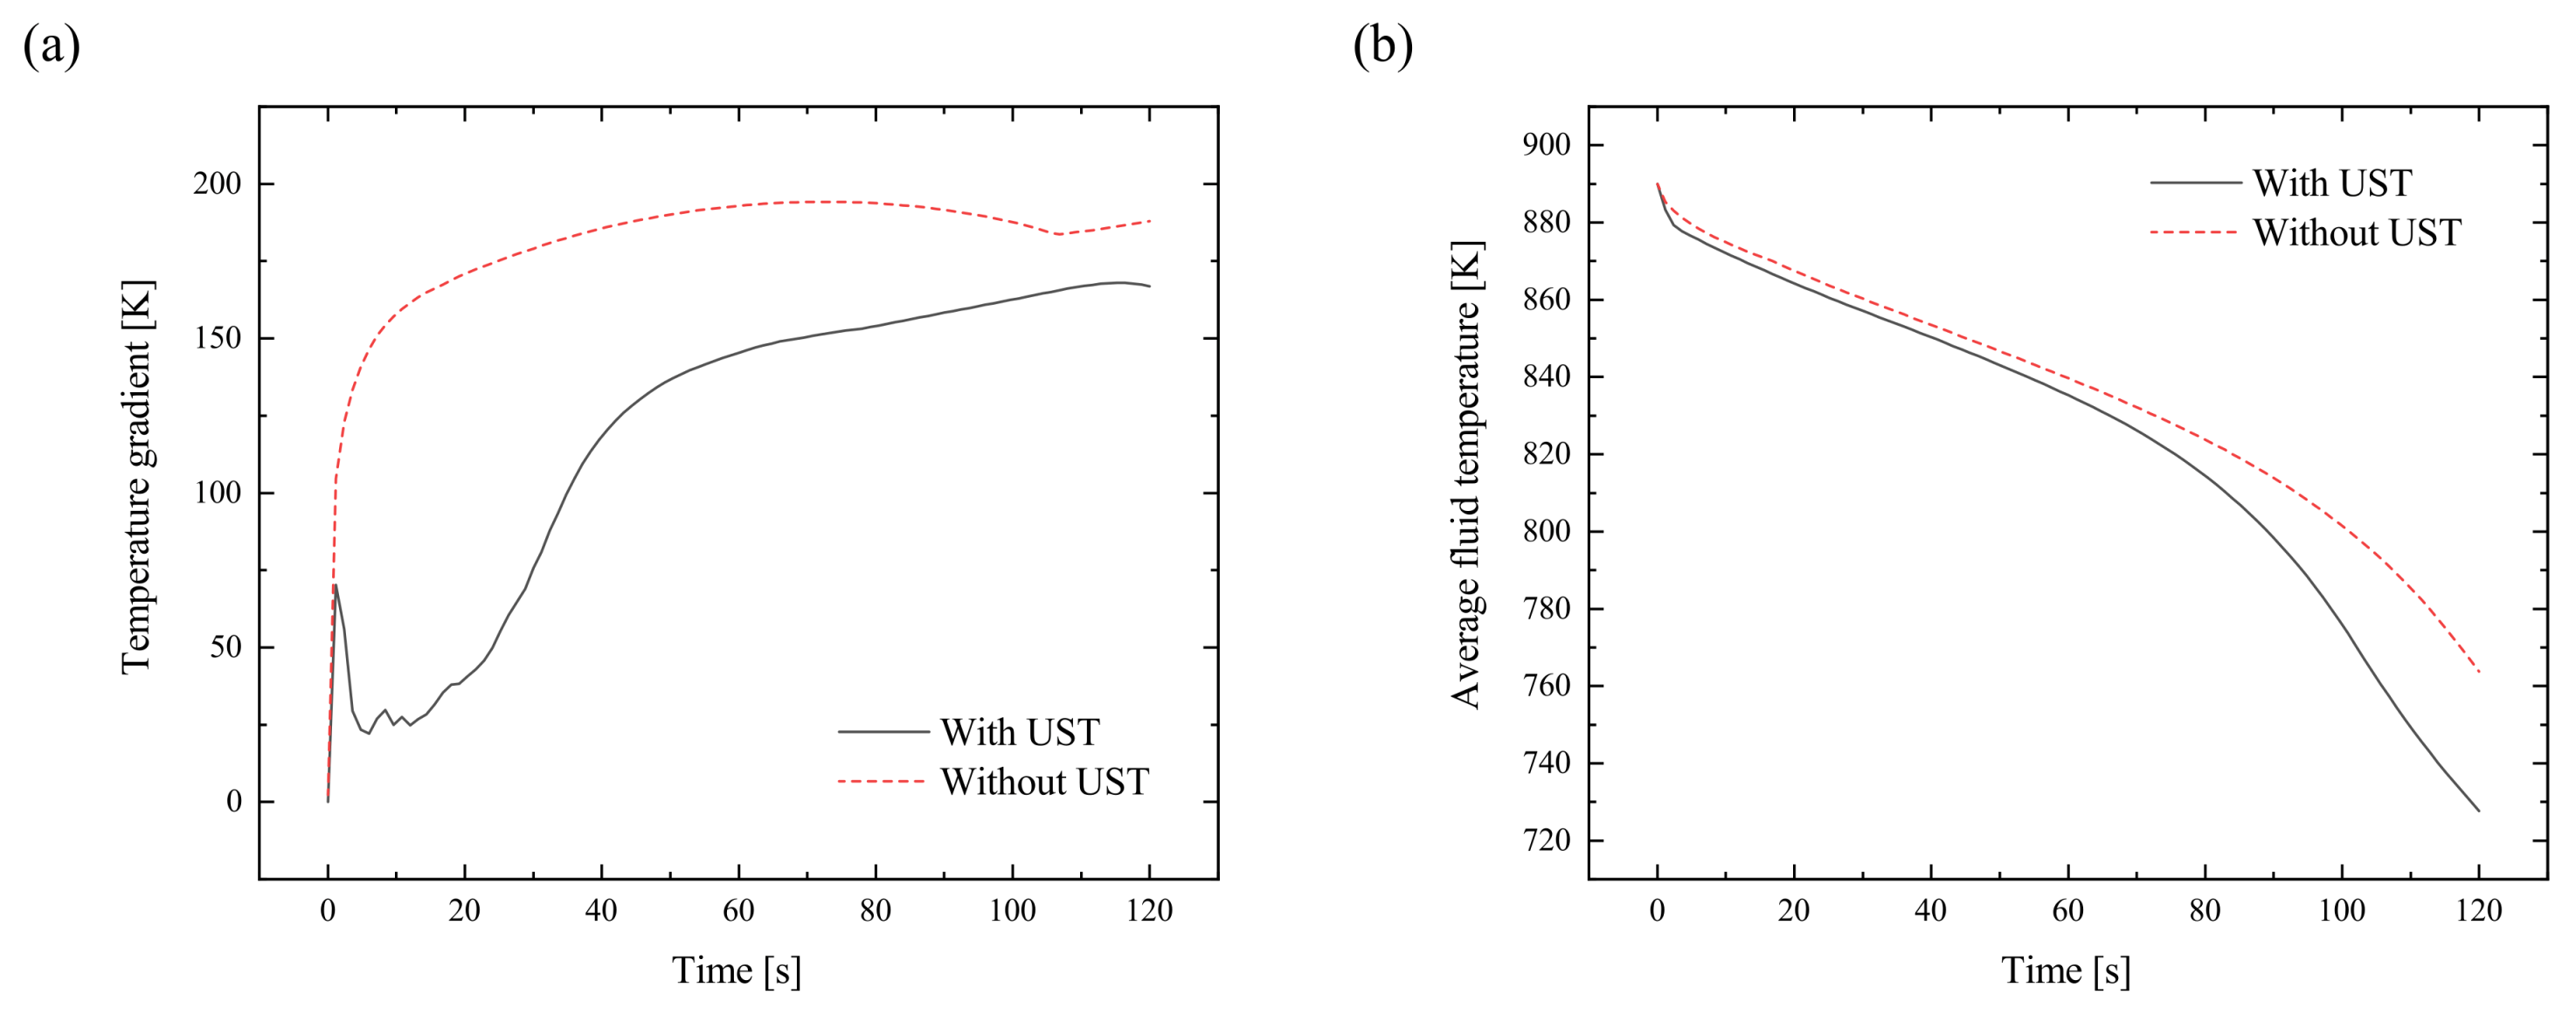
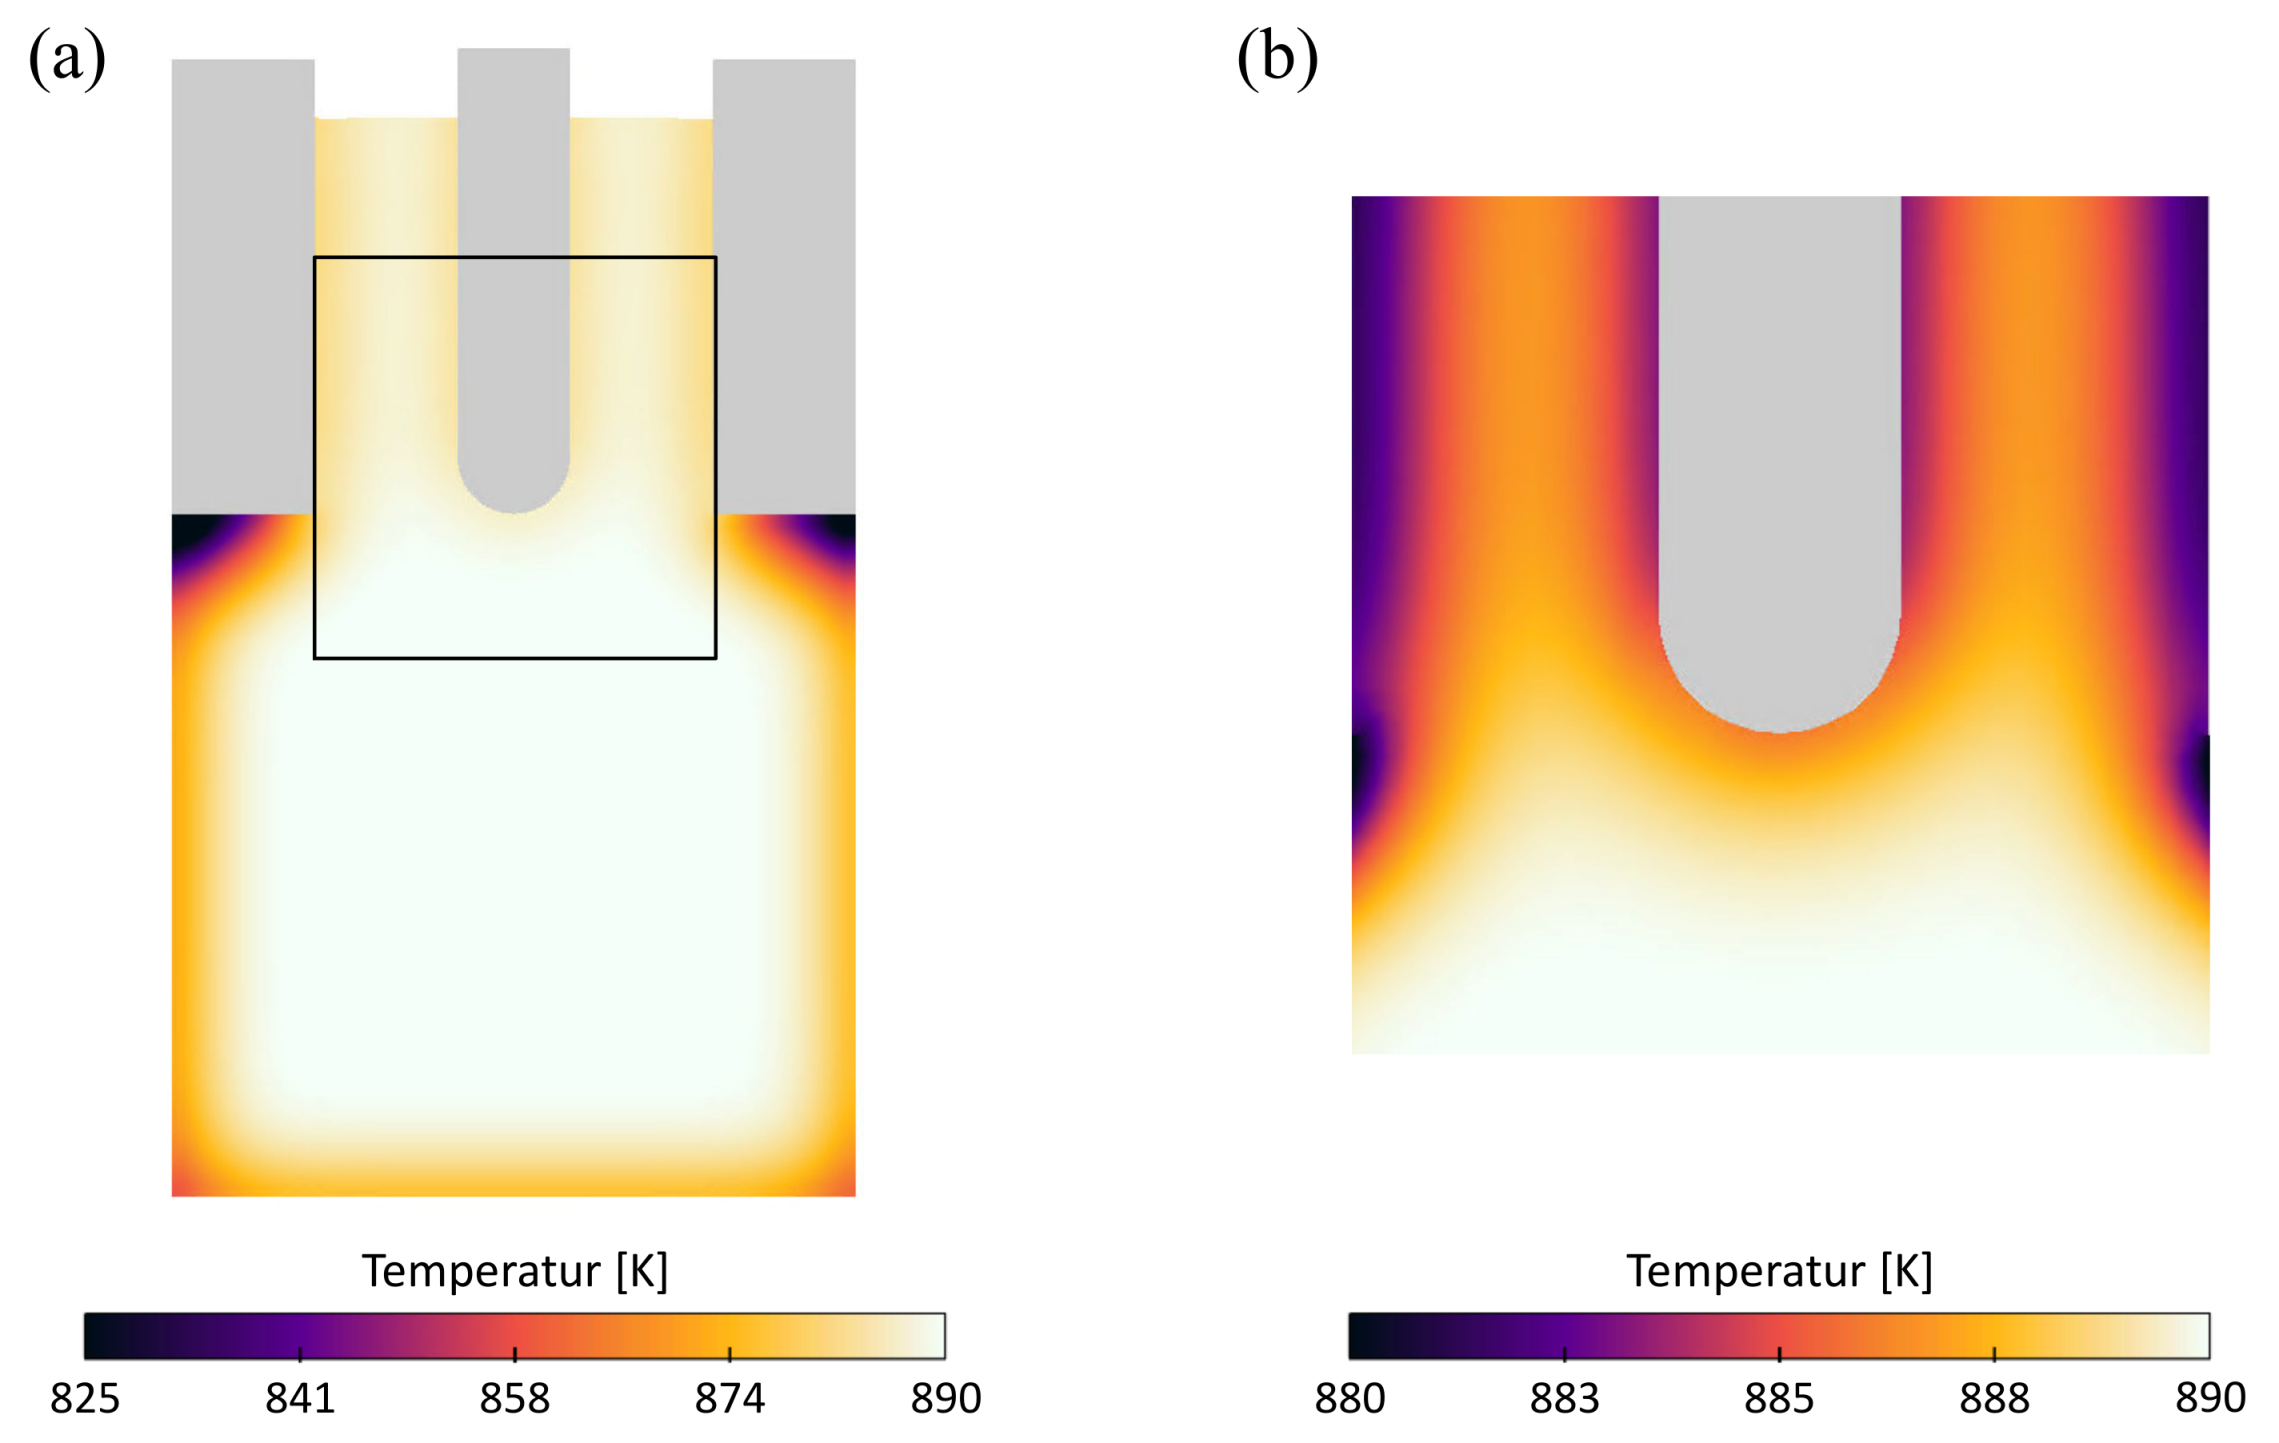
3.3.3. Solidification and Heat Transport

The superimposition of UST (primarily acoustic streaming) on a cooling/solidification process is demonstrated in Figure 13, where the radiator is brought into the melt via the feeder, which is a possible way for solidification accompanying treatment of real castings. At t = 10 s (Figure 13a) and t = 20 s (Figure 13b), it is recognizable that acoustic streaming continuously transports warmer melt from the center area immediately under the radiator to the more rapidly cooling boundary areas. This process seems to counteract classical exogenous, directional solidification, since a widely homogeneous temperature regime exists until the final phase of the solidification (Figure 13c) compared to a solidification without UST, illustrated in Figure 14a–c.
Although Figure 13 shows that even with UST an exogenous solidification takes place, the analysis of the temperature regime in Figure 15a shows that acoustic streaming leads to a significant reduction of temperature gradient compared to solidification without UST. In the present case, the average temperature gradient for the solidification process with and without UST is about 119.5 K and 180.3 K, respectively. As a result of the lower temperature gradient and thus the lower average temperature (Figure 15b), the cast is faster solidified compared to the cast without UST.
Furthermore, a chilling effect is recognizable resulting from the radiator stem, that is demonstrated in Figure 16. The lower temperature of the radiator compared to the melt leads to a temperature reduction of the melt of about 10 K in its immediate vicinity.

4. Discussion

4.1. Acoustic Pressure Wave Propagation

The simulation allows us to estimate the influence of radiator and vessel geometry on the creation and propagation of pressure waves, establishing a basis for the calculation and prediction of the cavitation zone. Regarding the pressure propagation, the round tip has only one point in the center of it that moves strictly perpendicular on the fluid. For this reason, fluid can stream past around the spherical tip which makes the tip move smoother and produce lower pressure peaks compared to the usage of a flat radiator. For the same reason, pressure propagates spherically and in more volume around the tip cavitation where gas volume is produced. The pressure decrease is calculated corresponding to
I = I 0 e - 2 α x ,
where α is the loss coefficient, I is the intensity, and x is the distance to radiator [1]—and thus shows correct calculation regarding the theoretical description of the pressure/sound wave propagation. The results show high qualitative agreement with the results of other authors, e.g., [8,17].

4.2. Cavitation Development

The comparison between the different radiator geometries confirms that the radial wave propagation of the round tip seems to cause the necessary pressure conditions for cavitation in a higher fluid volume around the tip. As a consequence, cavitation occurs in a higher volume of the fluid as well compared to the flat radiator. In both cases, the cavitation cloud exhibits a cavitation transition-layer-zone which allows a clear distinction of the cavitation cloud compared to the rest of the fluid. In both cases of radiator geometry, it seems to exist a sector of almost six to seven mm of thickness with steady cavitation activity. From there, the intensity drops exponentially. The whole cavitation cloud in –z-direction is about 40 mm for both tips. This seems logical, since the lowest point of both tip geometries are at the same level, so the wave propagation proceeding from this point is the same.
An interesting aspect is the consideration of the shielding effect caused by the cavitation zone. Propagating pressure waves first must pass this area and therefore lose a large portion of the pressure wave energy to the cavitation cloud. Generally, this result coincides with the experimental investigation in [73,74] in terms of the shielding of acoustic waves by acoustic cavitation. The subsequent pressure amplitude is less than that compared to the case without cavitation zone. Figure 7 shows that the cavitation zone prevents the development and propagation of the pressure wave along the z-axis, demonstrates that the simulation takes the shielding effect into account, and considers it in the further calculation of the sound wave propagation. However, due to the coarse mesh compared to the size of the cavitation bubbles (void regions are just opened where the cavitation volume fraction is predicted to exceed 1% of a cell’s volume [70]), a homogeneous distributions of cavitation gas, i.e., hydrogen, and corresponding pressure ambient within the cavitation zone was calculated, which in this form does not correspond to experimental observations. Since no speed of sound for hydrogen was/could be defined, a constant pressure and sound wave propagation occurred. Investigations on a smaller scale and with a finer mesh did confirm that higher resolution results in a more detailed calculation of the pressure distribution within the cavitation zone could be obtained.

4.3. Acoustic Streaming

The obtained results regarding the acoustic streaming velocity and streaming pattern show high-accordance with the results of [38,39,42] and especially with the PIV-analysis for a comparable ultrasonic system in [40], as demonstrated in Figure 17. In these studies, the prediction and measurements are of the same order of magnitude. Furthermore, the calculated flow pattern shows high-consensus with measurements in the PIV-study. Presumably, minor deviations derive from the different radiator geometries and the PIV measurements of a certain sectional plane requiring looking through the fluid volume, which can lead to distortions. In contrast, the evaluation of the simulation results allows a clear, uninfluenced view of the selected sectional plane. The differing centerline-velocities illustrated in Figure 9 emphasize the turbulent character of the acoustic streaming. The entire flow profile could presumably not be formed with the given modeling, but a suitable adjustment of the model is possible without problems. A great advantage is the possibility to simulate the interaction of acoustic streaming and the development of cavitation. With the distance-dependent decreasing pressure amplitude, cavitation gas volume fraction decreases as well during the transport of the cavitation bubbles from the active cavitation area through the acoustic streaming.
In view of the influence of acoustic streaming on the solidification, a more homogeneous temperature distribution was recognizable, which together with cavitation finally influences the material’s structure, as shown in [48]. Therefore, two streaming-related effects appear: (1) a more homogeneous solidification and structure as a result of continuous fluid mixing by acoustic streaming and (2) a faster solidification of the total cast, confirming the descriptions of [12,47]. The results emphasize the fact that acoustic streaming can influence the solidification process by enlarging the solidification front. The results concerning the cooler radiator reveal a cooling effect proceeding from the radiator. The effect increases with decreasing distance to the fluid surface. The combined chilling effect of atmosphere and radiator seems possible and, on a theoretical base, conforms to the considerations and results of [12,47].

4.4. FLOW-3D

The presented results demonstrate the ability of the investigated simulation tool to calculate and predict the most important phenomena connected with UST (i.e., cavitation, acoustic streaming, and their interaction as well as their influence on solidification). Most of the obtained results are in good agreement with the outcomes of other studies. The great advantage in the present case is the usage of a well-established CFD simulation tool and its ability to produce both two- and three-dimensional results. Additionally, it provides a foundation with which additional models and ideas can be integrated. In the current state, the tool could be used for fundamental investigations into UST or for process design, e.g., ultrasonic melt flow treatment, or isothermal and solidification-accompanying treatment. For mixing processes, the usage of the particle model allows an estimation of the time necessary for homogeneous distribution of contents, e.g., in case of AMC-production. Thus, experimental process times can be saved. Depending on cell size, the investigated time frame, and computing power, the calculation times for wave propagation and cavitation zone can take anywhere from a few minutes to several hours. Options for reducing lengthy calculation durations are two-dimensional simulations and the use of symmetric models. That way, in simple cases, only half to a fourth of a model must be calculated for qualitative results.
Although FLOW-3D provides interesting and promising results, some aspects of the method require adjustments and further developments for the specific calculation of UST. Equations (5)–(7) used for the calculation of cavitation are designed for high-velocity flows, not for the special application case of UST. A specification of the equations or the implementation of special ones for UST—which, for example, include the sound speed of gas within cavitation bubbles—might achieve a more precise result. In this vein, accurate sound wave propagation in the presence of formed cavitation zones with the corresponding impact on acoustic streaming could be calculated.
Within the scope of simulation evaluation described above, a validation of grid independency was not described in detail. The calculation time for the isothermal model with a grid resolution of 1 mm takes about five days (Intel Xeon Gold 6146 CPU 3.20 GHz, 2 × 12 cores). Investigations of two-dimensional discretizations showed that a mesh-refinement eventuates in a more detailed visual presentation of the results, while quantitative values remained mostly unchanged. For that reason, a refinement of grid resolution from 1 mm to 0.5 mm was not performed as it would result in an eight-fold increase in predicted calculation time. A coarser mesh reveals a simplified, more laminar flow calculation with largely similar velocities of acoustic streaming. The observation that the application of other turbulence models does not seem to influence the calculated flow behaviour could not be clarified so far. In this context, a correlation between calculated ultrasonic effects and mesh size is probable.

5. Summary

In this work, the potential for an established CFD fluid and casting simulation tool was analyzed, considering two- and three-dimensional pressure, cavitation, and acoustic streaming prediction. The most important results are as follows:
  • The simulation tool can predict the development and distribution of pressure waves in a fluid, induced through a modeled radiator.
  • Based on this, the development of the cavitation zone below and around the radiator tip can be calculated. Furthermore, information about cavitation intensity is provided. The results are consistent with the theoretical descriptions and demonstrated experimental behaviour of cavitation of previous investigations. With growing distance from the radiator surface, the pressure oscillations fall below the cavitation threshold, and most cavities are not able to survive in these regions. Furthermore, a shielding effect on acoustic field, proceeding from the cavitation zone, is measurable. However, for more accurate results, the used model may require adjustment for the application case of UST.
  • Rapidly changing pressure conditions lead to calculated acoustic streaming, consistent with the qualitative descriptions and circumstances leading to acoustic streaming. Furthermore, the results are in good agreement and have the same order of magnitude as the results of other studies and experimental PIV-measurements.
  • The influence of acoustic streaming on the cavitation can be calculated as well as particle transport and, for example, heat and mass transfer during solidification.
  • The simulation tool is able to create a three-dimensional prediction of cavitation and acoustic streaming. The possibility of producing two- and three-dimensional results is a great advantage for analyzing, developing, and adjusting upcoming ultrasonic systems (e.g., different radiator geometries and properties).
  • All parameters for the fluid and vessel geometries (as well as the ultrasonic system) are easily changeable and thus allow for preinvestigations into the influence of frequency, amplitude, etc., on the process and different fluids.

Author Contributions

Conceptualization, E.R.; methodology, E.R. and M.L.; software, E.R. and M.L.; validation, E.R.; formal analysis, E.R.; investigation, E.R.; resources, E.R. and M.L.; data curation, E.R.; writing–original draft preparation, E.R.; writing–review and editing, E.R., M.L., and S.S.; visualization, E.R.; supervision, E.R.; project administration, E.R. and S.S.; funding acquisition, S.S. All authors have read and agreed to the published version of the manuscript.

Funding

This research was funded by the German Federation of Industrial Research Associations (AIF/ZIM) grant number ZF4105807EB6 and the Investment Bank Saxony Anhalt/European Regional Development Fund project 1904/00017.

Conflicts of Interest

The authors declare no conflicts of interest.

Abbreviations

The following abbreviations are used in this manuscript:
AMCAluminum matrix composites
CCCCommercial CFD-Code
CFDComputational fluid dynamics
GMOGeneral moving object
PIVParticle image velocimetry
USTUltrasonic treatment

References

  1. Eskin, G.; Eskin, D. Ultrasonic Treatment of Light Alloy Melts, 2nd ed.; CRC Press: Boca Raton, FL, USA, 2014. [Google Scholar]
  2. Meek, T.; Han, Q. Ultrasonic Processing of Materials; Technical Report; U.S. Department of Energy—Energy Efficiency and Renewable Energy: Washington, DC, USA, 2006. [Google Scholar]
  3. Eskin, G. Influence of cavitation treatment of melts on the processes of nucleation and growth of crystals during solidification of ingots and castings from light alloys. Ultrason. Sonochem. 1994, 1, S59–S63. [Google Scholar] [CrossRef]
  4. Eskin, G. Broad prospects for commercial application of the ultrasonic (cavitation) melt treatment of light alloys. Ultrason. Sonochem. 2001, 8, 319–325. [Google Scholar] [CrossRef]
  5. Xu, W.; Tzanakis, I.; Srirangam, P.; Mirihanage, W.; Eskin, D.; Bodey, A.; Lee, P. Synchrotron quantification of ultrasound cavitation and bubble dynamics in Al–10Cu melts. Ultrason. Sonochem. 2016, 31, 355–361. [Google Scholar] [CrossRef] [PubMed] [Green Version]
  6. Feng, H.; Yu, S.; Li, Y.; Gong, L. Effect of ultrasonic treatment on microstructures of hypereutectic AlSi alloy. J. Mater. Process. Technol. 2008, 208, 330–335. [Google Scholar] [CrossRef]
  7. Zhang, S.; Zhao, Y.; Cheng, X.; Chen, G.; Dai, Q. High-energy ultrasonic field effects on the microstructure and mechanical behaviors of A356 alloy. J. Alloy. Compd. 2009, 470, 168–172. [Google Scholar] [CrossRef]
  8. Huang, H.; Xu, Y.; Da, S.; Han, Y.; Jun, W.; Sun, B. Effect of ultrasonic melt treatment on structure refinement of solidified high purity aluminum. Trans. Nonferrous Met. Soc. China 2014, 24, 2414–2419. [Google Scholar] [CrossRef]
  9. Wang, F.; Eskin, D.; Connolley, T.; Mi, J. Effect of ultrasonic melt treatment on the refinement of primary Al 3 Ti intermetallic in an Al–0.4 Ti alloy. J. Cryst. Growth 2016, 435, 24–30. [Google Scholar] [CrossRef] [Green Version]
  10. Eskin, D. Ultrasonic processing of molten and solidifying aluminium alloys: Overview and outlook. Mater. Sci. Technol. 2017, 33, 636–645. [Google Scholar] [CrossRef] [Green Version]
  11. Tuan, N.; Puga, H.; Barbosa, J.; Pinto, A. Grain refinement of Al-Mg-Sc alloy by ultrasonic treatment. Met. Mater. Int. 2015, 21, 72–78. [Google Scholar] [CrossRef] [Green Version]
  12. Wang, G.; Dargusch, M.; Qian, M.; Eskin, D.; StJohn, D. The role of ultrasonic treatment in refining the as-cast grain structure during the solidification of an Al–2Cu alloy. J. Cryst. Growth 2014, 408, 119–124. [Google Scholar] [CrossRef] [Green Version]
  13. Zhang, Y.; Kateryna, S.; Li, T. Effect of ultrasonic treatment on formation of iron-containing intermetallic compounds in Al-Si alloys. China Foundry 2016, 13, 316–321. [Google Scholar] [CrossRef]
  14. Youn, J.; Kim, Y. Nucleation enhancement of Al alloys by high intensity ultrasound. Jpn. J. Appl. Phys. 2009, 48, 07GM14. [Google Scholar] [CrossRef]
  15. Huang, H.; Shu, D.; Zeng, J.; Bian, F.; Fu, Y.; Wang, J.; Sun, B. In situ small angle X-ray scattering investigation of ultrasound induced nucleation in a metallic alloy melt. Scr. Mater. 2015, 106, 21–25. [Google Scholar] [CrossRef]
  16. Atamanenko, T.; Eskin, D.; Zhang, L.; Katgerman, L. Criteria of grain refinement induced by ultrasonic melt treatment of aluminum alloys containing Zr and Ti. Metall. Mater. Trans. A 2010, 41, 2056–2066. [Google Scholar] [CrossRef] [Green Version]
  17. Shu, D.; Sun, B.; Mi, J.; Grant, P. A high-speed imaging and modeling study of dendrite fragmentation caused by ultrasonic cavitation. Metall. Mater. Trans. A 2012, 43, 3755–3766. [Google Scholar] [CrossRef]
  18. Supponen, O.; Kobel, P.; Obreschkow, D.; Farhat, M. The inner world of a collapsing bubble. Phys. Fluids 2015, 27, 091113. [Google Scholar] [CrossRef]
  19. Chow, R.; Blindt, R.; Chivers, R.; Povey, M. The sonocrystallisation of ice in sucrose solutions: Primary and secondary nucleation. Ultrasonics 2003, 41, 595–604. [Google Scholar] [CrossRef]
  20. Wang, S.; Kang, J.; Zhang, X.; Guo, Z. Dendrites fragmentation induced by oscillating cavitation bubbles in ultrasound field. Ultrasonics 2017, 83, 26–32. [Google Scholar] [CrossRef]
  21. Jia, S.; Zhang, D.; Xuan, Y.; Nastac, L. An experimental and modeling investigation of aluminum-based alloys and nanocomposites processed by ultrasonic cavitation processing. Appl. Acoust. 2016, 103, 226–231. [Google Scholar] [CrossRef]
  22. Eskin, G. Cavitation mechanism of ultrasonic melt degassing. Ultrason. Sonochem. 1995, 2, S137–S141. [Google Scholar] [CrossRef] [Green Version]
  23. Xu, H.; Jian, X.; Meek, T.; Han, Q. Degassing of molten aluminum A356 alloy using ultrasonic vibration. Mater. Lett. 2004, 58, 3669–3673. [Google Scholar] [CrossRef]
  24. Xu, H.; Meek, T.; Han, Q. Effects of ultrasonic field and vacuum on degassing of molten aluminum alloy. Mater. Lett. 2007, 61, 1246–1250. [Google Scholar] [CrossRef]
  25. Puga, H.; Teixeira, J.; Barbosa, J.; Seabra, E.; Ribeiro, S.; Prokic, M. The combined effect of melt stirring and ultrasonic agitation on the degassing efficiency of AlSi9Cu3 alloy. Mater. Lett. 2009, 63, 2089–2092. [Google Scholar] [CrossRef]
  26. Eskin, D.; Alba-Baena, N.; Pabel, T.; da Silva, M. Ultrasonic degassing of aluminium alloys: Basic studies and practical implementation. Mater. Sci. Technol. 2014, 31, 79–84. [Google Scholar] [CrossRef]
  27. Haghayeghi, R.; Kapranos, P. The effect of processing parameters on ultrasonic degassing efficiency. Mater. Lett. 2014, 116, 399–401. [Google Scholar] [CrossRef]
  28. Xu, H.; Han, Q.; Meek, T. Effects of ultrasonic vibration on degassing of aluminum alloys. Mater. Sci. Eng. A 2008, 473, 96–104. [Google Scholar] [CrossRef]
  29. Abramov, O. Action of high intensity ultrasound on solidifying metal. Ultrasonics 1987, 25, 73–82. [Google Scholar] [CrossRef]
  30. Nowak, T.; Thiemann, A.; Holsteyns, F.; Lippert, A.; Mettin, R. Messung der akustisch induzierten Strömungen mit und ohne Kavitation. In Proceedings of the DAGA 2011, Düsseldorf, Germany, 21–24 March 2011; pp. 923–924. [Google Scholar]
  31. Eskin, G. Principles of ultrasonic treatment: Application for light alloy melts. Adv. Perform. Mater. 1997, 4, 223–232. [Google Scholar] [CrossRef]
  32. Puga, H.; Costa, S.; Barbosa, J.; Ribeiro, S.; Prokic, M. Influence of ultrasonic melt treatment on microstructure and mechanical properties of AlSi9Cu3 alloy. J. Mater. Process. Technol. 2011, 211, 1729–1735. [Google Scholar] [CrossRef] [Green Version]
  33. Jung, J.; Lee, S.; Lee, J.; Cho, Y.; Kim, S.; Yoon, W. Improved mechanical properties of near-eutectic Al-Si piston alloy through ultrasonic melt treatment. Mater. Sci. Eng. A 2016, 669, 187–195. [Google Scholar] [CrossRef]
  34. Eskin, D. Ultrasonic melt processing: Achievements and challenges. Mater. Sci. Forum 2015, 828–829, 112–118. [Google Scholar] [CrossRef] [Green Version]
  35. Trujillo, F.; Knoerzer, K. CFD modelling of the acoustic streaming induced by an ultrasonic horn reactor. In Proceedings of the Seventh International Conference on CFD in the Minerals and Process Industries, Melbourne, Australia, 9–11 December 2009. [Google Scholar]
  36. Louisnard, O. A viable method to predict acoustic streaming in presence of cavitation. Ultrason. Sonochem. 2017, 35, 518–524. [Google Scholar] [CrossRef] [PubMed] [Green Version]
  37. Zhang, X.; Kang, J.; Wang, S.; Ma, J.; Huang, T. The effect of ultrasonic processing on solidification microstructure and heat transfer in stainless steel melt. Ultrason. Sonochem. 2015, 27, 307–315. [Google Scholar] [CrossRef] [PubMed]
  38. Schenker, M.; Eskin, M.P.D.; Boersma, B. PIV quantification of the flow induced by an ultrasonic horn and numerical modeling of the flow and related processing times. Ultrason. Sonochem. 2012, 20, 502–509. [Google Scholar] [CrossRef] [PubMed]
  39. Ishiwata, Y.; Komarov, S.; Takeda, Y. Investigation of acoustic streaming in aluminum melts axposed to high-intensity ultrasonic irradiation. In ICAA13 Pittsburgh; Springer International Publishing: Cham, Switzerland, 2012; pp. 183–188. [Google Scholar]
  40. Tzanakis, I.; Lebon, G.; Eskin, D.; Hyde, M.; Grant, P. Investigation of acoustic streaming and cavitation intensity in water as an analogue for liquid metal. In Proceedings of the 10th International Synmposium on Cavitation, Baltimore, MD, USA, 14–16 May 2018. [Google Scholar]
  41. Lebon, B.; Tzanakis, I.; Pericleous, K.; Eskin, D. Numerical modelling of the ultrasonic treatment of aluminium melts: An overview of recent advances. Materials 2019, 12, 3262. [Google Scholar] [CrossRef] [PubMed] [Green Version]
  42. Rubinette, D.; Weiss, D.; Müller, J.; Wahlen, A. Numerical modeling and validation concept for acoustic streaming induced by ultrasonic treatment. In Proceedings of the Comsol Conference 2016, Munich, Germany, 12–14 October 2016. [Google Scholar]
  43. Sajjadi, B.; Raman, A.; Ibrahim, S. Influence of ultrasound power on acoustic streaming and micro-bubbles formations in a low frequency sono-reactor: Mathematical and 3D computational simulation. Ultrason. Sonochem. 2015, 24, 193–203. [Google Scholar] [CrossRef]
  44. Lebon, G.; Tzanakis, I.; Djambazov, G.; Pericleous, K.; Eskin, D. Numerical modelling of ultrasonic waves in a bubbly Newtonian liquid using a high-order acoustic cavitation model. Ultrason. Sonochem. 2017, 37, 660–668. [Google Scholar] [CrossRef]
  45. Žnidarčič, A.; Mettin, R.; Dular, M. Modeling cavitation in a rapidly changing pressure field—Application to a small ultrasonic horn. Ultrason. Sonochem. 2015, 22, 482–492. [Google Scholar] [CrossRef]
  46. Mottyll, S.; Skoda, R. Numerical 3D flow simulation of ultrasonic horns with attached cavitation structures and assessment of flow aggressiveness and cavitation erosion sensitive wall zones. Ultrason. Sonochem. 2016, 31, 570–589. [Google Scholar] [CrossRef]
  47. Wang, G.; Croaker, P.; Dargusch, M.; McGuckin, D.; StJohn, D. Simulation of convective flow and thermal conditions during ultrasonic treatment of an Al-2Cu alloy. Comput. Mater. Sci. 2017, 134, 116–125. [Google Scholar] [CrossRef]
  48. Riedel, E.; Horn, I.; Stein, N.; Stein, H.; Bähr, R.; Scharf, S. Ultrasonic treatment: A clean technology that supports sustainability in casting processes. Procedia CIRP 2019, 80, 101–107. [Google Scholar] [CrossRef]
  49. Dahlem, O.; Reisse, J.; Halloin, V. The radially vibrating horn: A scaling-up possibility for sonochemical reactions. Chem. Eng. Sci. 1999, 54, 2829–2838. [Google Scholar] [CrossRef]
  50. Kumar, A.; Kumaresan, T.; Pandit, A.; Joshi, J. Characterization of flow phenomena induced by ultrasonic horn. Chem. Eng. Sci. 2006, 61, 7410–7420. [Google Scholar] [CrossRef]
  51. Klima, J.; Friasferrer, A.; Gonzalezgarcia, J.; Ludvik, J.; Saez, V.; Iniesta, J. Optimisation of 20 kHz sonoreactor geometry on the basis of numerical simulation of local ultrasonic intensity and qualitative comparison with experimental results. Ultrason. Sonochem. 2007, 14, 19–28. [Google Scholar] [CrossRef] [Green Version]
  52. Nastac, L. Mathematical modeling of the solidification structure evolution in the presence of ultrasonic stirring. Metall. Mater. Trans. B 2011, 42, 1297–1305. [Google Scholar] [CrossRef]
  53. Jamshidi, R.; Pohl, B.; Peuker, U.; Brenner, G. Numerical investigation of sonochemical reactors considering the effect of inhomogeneous bubble clouds on ultrasonic wave propagation. Chem. Eng. J. 2012, 189–190, 364–375. [Google Scholar] [CrossRef]
  54. Xu, Z.; Yasuda, K.; Koda, S. Numerical simulation of liquid velocity distribution in a sonochemical reactor. Ultrason. Sonochem. 2013, 20, 452–459. [Google Scholar] [CrossRef]
  55. Jamshidi, R. Modeling and Numerical Investigation of Acoustic Cavitation with Applications in Sonochemistry. Ph.D. Thesis, Clausthal University of Technology, Clausthal-Zellerfeld, Germany, 2013. [Google Scholar]
  56. Jamshidi, R.; Brenner, G. An Euler-Lagrange method considering bubble radial dynamics for modeling sonochemical reactors. Ultrason. Sonochem. 2014, 21, 154–161. [Google Scholar] [CrossRef] [Green Version]
  57. Zhang, D.; Nastac, L. Numerical modeling of the dispersion of ceramic nanoparticles during ultrasonic processing of aluminum-based nanocomposites. J. Mater. Res. Technol. 2014, 3, 296–302. [Google Scholar] [CrossRef] [Green Version]
  58. Kang, J.; Zhang, X.; Wang, S.; Ma, J.; Huang, T. The comparison of ultrasonic effects in different metal melts. Ultrasonics 2015, 57, 11–17. [Google Scholar] [CrossRef]
  59. Lebon, G.; Pericleous, K.; Tzanakis, I.; Eskin, D. Application of the “Full Cavitation Model” to the fundamental study of cavitation in liquid metal processing. IOP Conf. Ser. Mater. Sci. Eng. 2015, 72, 052050. [Google Scholar] [CrossRef]
  60. Jamshidi, R.; Rossi, D.; Saffari, N.; Gavriilidis, A.; Mazzei, L. Investigation of the effect of ultrasound parameters on continuous sonocrystallization in a millifluidic device. Cryst. Growth Des. 2016, 16, 4607–4619. [Google Scholar] [CrossRef]
  61. Lebon, G.; Pericleous, K.; Tzanakis, I.; Eskin, D. A model of cavitation for the treatment of a moving liquid metal volume. In Advances in the Science and Engineering of Casting Solidification; Springer Nature: Cham, Switzerland, 2016. [Google Scholar]
  62. Wang, S.; Kang, J.; Guo, Z.; Lee, T.; Zhang, X.; Wang, Q.; Deng, C.; Mi, J. In situ high speed imaging study and modelling of the fatigue fragmentation of dendritic structures in ultrasonic fields. Acta Mater. 2019, 165, 388–397. [Google Scholar] [CrossRef]
  63. Rahimi, M.; Movahedirad, S.; Shahhosseini, S. CFD study of the flow pattern in an ultrasonic horn reactor: Introducing a realistic vibrating boundary condition. Ultrason. Sonochem. 2017, 35, 359–374. [Google Scholar] [CrossRef]
  64. Sajjadi, B.; Asgharzadehahmadi, S.; Asaithambi, P.; Raman, A.; Parthasarathy, R. Investigation of mass transfer intensification under power ultrasound irradiation using 3D computational simulation: A comparative analysis. Ultrason. Sonochem. 2017, 34, 504–518. [Google Scholar] [CrossRef]
  65. Lebon, G.; Tzanakis, I.; Pericleous, K.; Eskin, D. Experimental and numerical investigation of acoustic pressures in different liquids. Ultrason. Sonochem. 2018, 42, 411–421. [Google Scholar] [CrossRef]
  66. Fang, Y.; Yamamoto, T.; Komarov, S. Cavitation and acoustic streaming generated by different sonotrode tips. Ultrason. Sonochem. 2018, 48, 79–87. [Google Scholar] [CrossRef]
  67. Lebon, G.; Tzanakis, I.; Pericleous, K.; Eskin, D.; Grant, P. Ultrasonic liquid metal processing: The essential role of cavitation bubbles in controlling acoustic streaming. Ultrason. Sonochem. 2019, 55, 243–255. [Google Scholar] [CrossRef]
  68. Lebon, G.; Salloum-Abou-Jaoude, G.; Eskin, D.; Tzanakis, I.; Pericleous, K.; Jarry, P. Numerical modelling of acoustic streaming during the ultrasonic melt treatment of direct-chill (DC) casting. Ultrason. Sonochem. 2019, 54, 171–182. [Google Scholar] [CrossRef]
  69. Komarov, S.; Yamamoto, T. Role of acoustic streaming in formation of unsteady flow in billet sump during ultrasonic DC casting of aluminum alloys. Materials 2019, 12, 3532. [Google Scholar] [CrossRef] [Green Version]
  70. FLOW-3D v11.2 Users Manual; Flow Science, Inc.: Santa Fe, NM, USA, 2017.
  71. Brethour, J. Improved Generalized Minimal Residual (GMRES) Solver in FLOW-3D—How It Works and When to Use It; Flow Science, Inc.: Santa Fe, NM, USA, 2009. [Google Scholar]
  72. Von Böckh, P.; Stripf, M. Technische Thermodynamik; Springer: Berlin/Heidelberg, Germany, 2015. [Google Scholar]
  73. Tzanakis, I.; Lebon, G.; Eskin, D.; Pericleous, K. Investigation of the factors influencing cavitation intensity during the ultrasonic treatment of molten aluminium. Mater. Des. 2016, 90, 979–983. [Google Scholar] [CrossRef]
  74. Tzanakis, I.; Lebon, G.; Eskin, D.; Pericleous, K. Characterisation of the ultrasonic acoustic spectrum and pressure field in aluminium melt with an advanced cavitometer. J. Mater. Process. Technol. 2016, 229, 582–586. [Google Scholar] [CrossRef] [Green Version]
Figure 1. Geometric alignment of simulation model setup for isothermal ultrasonic treatment (UST).
Metals 10 00476 g001
Figure 2. Geometric alignment of simulation model setup for solidification-accompanying UST.
Metals 10 00476 g002
Figure 3. Sound-wave development and propagation in aluminum A356 at different stages: (a) 3 μ s, (b) 25.8 μ s, and (c) 62.5 μ s.
Metals 10 00476 g003
Figure 4. Developed cavitation zone and corresponding bubble collapse activity after a period of 0.01 s of ultrasonic treatment in A356: (a) flat radiator tip and (b) spherical radiator tip.
Metals 10 00476 g004
Figure 5. Comparison of flat and spherical radiator geometries for a period of 0.01 s of ultrasonic treatment in A356: (a) development of cavitation gas volume and (b) corresponding bubble collapse activity.
Metals 10 00476 g005
Figure 6. Analysis of shielding effect caused by cavitation cloud for t = 0.005 s: (a) simulation with activated cavitation model and (b) simulation without cavitation model, rest unchanged.
Metals 10 00476 g006
Figure 7. Analysis of shielding effect caused by cavitation cloud—pressure wave propagation in –z-direction.
Metals 10 00476 g007
Figure 8. Development of acoustic streaming for a period of 5 s of ultrasonic treatment.
Metals 10 00476 g008
Figure 9. Centerline velocity of acoustic streaming between radiator tip and vessel bottom (in –z-direction) for different stages of treatment.
Metals 10 00476 g009
Figure 10. Typical velocity pattern of acoustic streaming for different stages of propagation.
Metals 10 00476 g010
Figure 11. Influence of acoustic streaming on the development and distribution of cavitation during a period of 5 s.
Metals 10 00476 g011
Figure 12. Influence of acoustic streaming on the distribution of particles of different size and density for a period of 5 s: (a) Al 2 O 3 -particles and Al-fragments and (b) particles colored as a function of appearance.
Metals 10 00476 g012
Figure 13. Solidification process with UST of A536: (a) solidification beginning, (b) advanced stage, and (c) shortly before complete solidification.
Metals 10 00476 g013
Figure 14. Solidification process without UST of A536: (a) solidification beginning, (b) advanced stage, and (c) shortly before complete solidification.
Metals 10 00476 g014
Figure 15. Analysis of the influence of UST on temperature conditions: (a) temperature gradient with and without UST and (b) average temperature with and without UST.
Metals 10 00476 g015
Figure 16. Analysis of radiator caused chilling effect: (a) highlighting of the enlarged region and (b) temperature regime in the area around the tip.
Metals 10 00476 g016
Figure 17. Simulation result of acoustic streaming; rendered for the purpose of direct comparison with PIV-Analysis in [40].
Metals 10 00476 g017
Table 1. List of publications on the simulation of ultrasonic treatment, listed according to year of publication and calculated ultrasonic effects (AP/WP—Acoustic pressure/wave propagation, C—Cavitation, AS—Acoustic Streaming, S—Solidification). Note that most of the studies listed below are using the respective software for incorporation of individual ultrasonic-related codes.
Author(s)YearFluid/AlloySoftwareAP/WPCASSReference
Dahlem et al.1999WaterSysnoise /Fluent CFDX X [49]
Kumar et al.2006WaterOther CFD-Code X [50]
Klima et al.2007WaterFEM LAB 3.1X [51]
Trujillo & Knoerzer2009UnclearCOMSOL Multiphysics X [35]
Nastac2011Aluminum (A356)Other CFD-Code XXX[52]
Shu et al.2012SuccinonitrilCOMSOL MultiphysicsX [17]
Jamshidi et al.2012WaterCOMSOL MultiphysicsXX [53]
Ishiwata et al.2012AluminumOther CFD-Code X [39]
Schenker et al.2012WaterFluent X [38]
Xu et al.2013WaterCOMSOL MultiphysicsX X [54]
Jamshidi2013WaterCOMSOL Multiphysics X [55]
Huang et al.2014Pure aluminumCOMSOL MultiphysicsX [8]
Jamshidi et al.2014WaterFVM-CodeXX [56]
Zhang & Nastac2014Aluminum (6061)ANSYS Fluent X [57]
Kang et al.2015Water/aluminum/steelANSYS FluentX X [58]
Sajjadi et al.2015WaterANSYS FluentX X [43]
Zhang et al.2015Stainless steelANSYS FluentX X[37]
Sajjadi et al.2015WaterOther CFD-CodeXXX [43]
Lebon et al.2015Water/aluminumOther CFD-CodeX X [59]
Žnidarčič2015WaterANSYS Fluent X [45]
Jamshidi et al.2016Adipic acidOther codeXX X[60]
Lebon et al.2016Water/aluminumOther CFD-CodeX X [61]
Wang et al.2016SuccinonitrilOther codeX [62]
Mottyll & Skoda2016WaterANSYS ICEM CFD X [46]
Jia et al.2016Aluminum (A356)ANSYS Fluent X [21]
Rubinette et al.2016Aluminum/waterCOMSOL Multiphysics X [42]
Rahimi et al.2017WaterOther CFD-CodeXXX [63]
Lebon et al.2017AluminumOther code X [44]
Wang et al.2017Aluminum (AlCu2)ProCAST (FEM) XX[47]
Louisnard2017WaterCOMSOL X [36]
Sajjadi et al.2017Water/glycerolANSYS FluentX x [64]
Lebon et al.2018Water/aluminum a.o.Other code X [65]
Fang et al.2018WaterOpenFOAM XX [66]
Tzanakis et al.2018WaterOpenFOAM X [40]
Lebon et al.2019Water/aluminumOpenFOAMX X [67]
Lebon et al.2019AluminumOpenFOAMX XX[68]
Lebon et al.2019AluminumOpenFOAMX XX[41]
Riedel et al.2019Aluminum (A356)FLOW-3D XX[48]
Komarov & Yamamoto2019Water/aluminum (AlSi17)Other code XX[69]
Table 2. Physical fluid parameters of water and A356.
ParameterA356Unit
Density2437kg/ m 3
Viscosity0.0019kg/m/s
Specific heat1074J/kg/K
Thermal conductivity86.9W/m/K
Liquidus temperature881.15K
Solidus temperature825.55K
Speed of sound4600m/s
Compressibility1.941/Pa
Surface tension0.871kg/ s 2
Table 3. Summary of chosen models with the corresponding parameters.
ModelParameterA356Unit
Bubble and phase changeGamma1.4Without unit
with adiabatic bubble andPressure101,325Pa
dynamic nucleation
Cavitation with empiricalCavitation pressure0Pa
model for cavitation control(Cavitation threshold)
active model for voids andSurface tension coeff.0.871kg/ s 2
activated cavitationDensity of cav. bubbles0.025kg/ m 3
potential modelCav. production coeff.0.02Without unit
Cav. dissipation coeff.0.01Without unit
Surface tension model withSurface tension coeff.0.871kg/ s 2
explicit numericalTemperature dependence0kg/ s 2 /K
approximation for surfaceContact angle90Degrees(s)
tension pressure
Table 4. Parameters and values used for calculation of hydrogen density at 973 K [72].
ParameterValueUnit
Gas pressure p101,325Pa
Universal gas constant R m 8314.41J/(kmol K)
Temperature T973.15K
Molar mass M ( H 2 )2.016kg/kmol
Table 5. Chosen time steps for simulating the different effects of ultrasonic treatment.
SimulationMaximum Time Step [s]
Pressure 3 . 91 × 10 - 7
Cavitation 1 . 56 × 10 - 6
Acoustic Streaming 1 . 25 × 10 - 5
UST + solidification 1 . 25 × 10 - 5

