Article

Thermodynamic Analysis of the Formation of FCC and BCC Solid Solutions of Ti-Based Ternary Alloys by Mechanical Alloying

1
Departamento de Ingeniería Metalúrgica y Materiales, Universidad Técnica Federico Santa María, Av. España 1680, Valparaíso 2390302, Chile
2
Instituto de Investigaciones en Materiales, Unidad Morelia, Universidad Nacional Autónoma de México, Campus Morelia UNAM. Antigua carretera a Pátzcuaro No. 8701, Col. Ex-Hacienda de San José de la Huerta, CP. 58190 Morelia, Michoacán, Mexico
*
Author to whom correspondence should be addressed.
Metals 2020, 10(4), 510; https://doi.org/10.3390/met10040510
Submission received: 29 February 2020 / Revised: 6 April 2020 / Accepted: 7 April 2020 / Published: 15 April 2020

Abstract

:
A thermodynamic analysis of the synthesis of face-centred cubic (fcc) and body-centred cubic (bcc) solid solutions of Ti-based alloys produced by mechanical alloying was performed. Four Ti-based alloys were analysed: (i) Ti-13Ta-3Sn (at.%), (ii) Ti-30Nb-13Ta (at.%), (iii) Ti-20Nb-30Ta (wt. %) and (iv) Ti-33Nb-4Mn (at.%). The milled powders were characterized by X-ray diffraction, and the crystallite size and microstrain were determined using the Rietveld and Williamson–Hall methods. The Gibbs free energy of mixing for the formation of a solid solution of the three ternary systems (Ti-Ta-Sn, Ti-Nb-Ta and Ti-Nb-Mn) was calculated using an extended Miedema’s model, applying the Materials Analysis Applying Thermodynamics (MAAT) software. The values of the activity of each component were determined by MAAT. It was found that increasing the density of crystalline defects, such as dislocations and crystallite boundaries, changed the solubility limit in these ternary systems. Therefore, at longer milling times, the Gibbs free energy increases, so there is a driving force to form solid solutions from elemental powders. Finally, there is agreement between experimental and thermodynamic data confirming the formation of solid solutions.

Graphical Abstract

1. Introduction

The main metallurgical characteristics of titanium and titanium alloys are the following: a combination of high strength, stiffness, toughness, low density, good corrosion resistance and biocompatibility [1]. Titanium alloys are used widely in engineering applications such as aeronautical/aerospace, chemical and medical among other high-performance applications [2]. Ti-6Al-4V alloy is the most commonly used and accounts for almost 50% of all the alloys used in engineering applications [3,4,5]. Ti2AlNb alloys have received considerable attention as new potential structural materials in advanced gas turbine jet engines [6]. Other alloys used or evaluated extensively in aerospace, missile and space as well as other high-performance applications include Ti-6V-2Sn-2Zr2Cr-2Mo-Si, Ti-6Al-6V-2Sn, Ti-10V-2Fe-3A1 and Ti-13V-11Cr-3A1 [7]. The chemical industry has been interested principally in the commercially pure CP-Ti with palladium additions (Ti-0.7%Pd) due to its high corrosion resistance, and with Ti-6Al-4V for its high mechanical resistance [8].
Due to its biocompatibility with the human body (it is not toxic and is not rejected by the human body), titanium is used in different medical applications including surgical implements and implants, such as joint replacements [9]. CP-Ti is a material widely used in medical applications; however, when the application requires high strength, Ti-6AI-4V alloy is utilized [10]. Unfortunately, Al and V are cytotoxic elements possibly associated with Alzheimer’s disease, neuropathy and osteomalacia [11,12,13]. Therefore, in recent decades, research in this area has been focused on the development of new Ti-based alloys with non-toxic elements to the human body. In this sense, there is a second generation of Ti-based alloys that incorporates elements such as Ta, Nb, Mo and/or Zr [14,15,16,17]. The alloys produced using the alloying elements mentioned previously have additional advantages over Ti-6AI-4V, such as high wear strength and a lower modulus of elasticity.
Ti exists in two allotropic forms, namely the α phase, which has a hexagonal close-packed structure (<882 °C), and the β phase, which has a body-centred cubic (bcc) structure (>882 °C). The alloying elements used in Ti alloys are classified into α-stabilizers (Al, O, N, C), β-isomorphs (V, Mo, Nb, Ta), β-eutectoids (Fe, Mn, Cr, Ni, Cu, Si, Hs) and neutral elements (Zr, Sn) based on their effect on the stability range of the α and β phases [1]. β-stabilizers are expensive and, consequently, this reduces their competitiveness compared to the commercially used metallic biomaterials [18], although there are alternative low-cost β-stabilizers such as Mn, Fe, Cr and Sn [19] that can be used to reduce the production cost. The α-titanium alloys are used when high elastic modulus, good creep resistance, weldability and excellent corrosion resistance are required and the β-titanium ones are used when malleability, good machinability and low elastic modulus are required [20]. In addition, the alloys are classified as α, β and α + β depending on the phases present. The mechanical properties of α + β alloys depend greatly on the content of the β-stabilizer element and on the type of heat treatment. Moreover, a metastable phase with a face-centred cubic (fcc) structure (called γ phase) has been reported in pure Ti and Ti-based alloys [21,22,23,24,25,26,27].
Mechanical alloying (MA) is a powder processing technique that allows production of chemically and structurally homogeneous materials starting from mixtures of elemental powders. It is a solid-state high-energy milling process that can transform pure elements into alloys by repeated fracture and cold welding, under continuous impact of the milling medium. Powder particles are trapped between colliding balls during milling and plastically deformed, welded or fractured, depending on the mechanical behaviour of the powder mixture’s components. The main advantage of this process is that it can be used to synthesize a variety of nonequilibrium phases such as supersaturated solid solutions, metastable intermediate phases as well as quasicrystal and nanostructured materials [28,29]. In this sense, PM is a powerful tool for the manufacture of Ti-based alloys for biomedical applications. Dercz [30] reported the formation of α phase and β phase in a Ti-50Ta alloy milled for 72 h. The sintered Ti-50Ta alloy showed better corrosion resistance than pure Ti [1]. García-Garrido et al. [31,32] reported that the (β + γ)-TiNbTa alloy was manufactured by mechanical alloying (MA) synthesis, carried out at low energy, followed by a field-assisted consolidation technique, that is, pulsed electric current sintering (PECS). This Ti-based alloy exhibited high hardness and mechanical strength as well as low elastic modulus. Aguilar [33] fabricated Ti-30Nb-13Ta-xMn (x: 2, 4 and 6 wt. %) alloys and reported the formation of a β-Ti solid solution after 15 h of milling and an amorphous phase formed after 30 h of milling. Salvo [34] reported that the amount of β-Ti phase increased with milling time and found that Mn additions promote the formation of an amorphous phase on Ti-30Nb-13Ta-xMn (x: 2, 4 and 6 wt. %) alloys. Chicardi [35] reported the formation of an original and stable face-centred cubic (fcc) phase (γ phase) in nanocrystalline Ti-Nb-Mn alloys at short milling time (20 h).
To obtain experimental thermodynamic data for multicomponent systems in solid state is very complex due to the difficulty of carrying out experiments. In addition, analytical methods are difficult to implement for multicomponent systems because the mathematics formulism is very complex. This problem can be addressed using theoretical calculations. A general approach to obtaining thermodynamic data of ternary or quaternary systems is by extrapolating constitutive binary data via geometrical models [36]. The Calculation of Phase Diagrams (CALPHAD) [9] method has been widely used to estimate phase stability based on the optimization and extrapolation of experimental phase equilibrium data. When experimental data is not available, the Miedema and Bakker [37,38,39] models can be used to determine thermodynamic properties. These models can estimate the enthalpy of formation of intermetallic compounds and amorphous phases, and the enthalpy of mixing of solid solutions [11]. Another field where the calculations of thermodynamic properties can be very useful is the design of multicomponent or high entropy alloys. These alloys have attracted extensive attention from the scientific community because they exhibit promising properties such as high strength and ductility, high fracture toughness, fatigue resistance, creep resistance and corrosion resistance [40,41]. Using our Materials Analysis Applying Thermodynamics (MAAT) software (version 1.0), the enthalpy of mixing of several systems can be easily obtained.
The main goal of this work was to study the thermodynamic effect of the reduction of crystallite size and the increase of strain due to the presence of crystalline defects on the formation of β- or γ-type solid solutions of Ti-based alloys obtained by high energy mill. Experimental data of three ternary systems (Ti-Ta-Sn, Ti-Nb-Ta and Ti-Nb-Mn) were compared with theoretical information computed from thermodynamic models. Thermodynamic calculations were made with the free MAAT software located at www.rpm.usm.cl. The experimental data for the Ti-Ta-Sn and Ti-Nb-Mn systems were obtained by our group, whereas those for the Ti-Nb-Mn system were obtained from the literature.

2. Thermodynamic Model

2.1. Gibbs Free Energy of Mixing, Δ G m

The Gibbs free energy of mixing of random solid solutions A and B can be obtained by Equation (1), where ΔHm and ΔSm are the enthalpy and entropy of mixing, respectively, and T is the absolute temperature of solid solution formation. If only configurational entropy is considered, the entropy of mixing can be computed using Equation (2), where R is the universal gas constant and xi is the molar fraction of i-species. On the other hand, the enthalpy of mixing can be obtained using Miedema’s model [10].
Δ G m = Δ H m T Δ S m
Δ S m = R i = 1 n x i lnx i

2.2. Miedema’s Model Theory

Miedema´s model is a powerful tool to estimate the enthalpy of mixing. This model initially was made for binary alloys but some work has been carried out to extend the model to ternary systems [36,42,43]. The enthalpy of a concentrate random solid solution (where one component is randomly dissolved in the crystal structure of the other component) can be calculated considering three terms (Equation (3)), where Δ H c h e m m is the chemical contribution of creation and breaking of atomic bonds, Δ H e l a s t m is the elastic contribution (elastic mismatch energy) in solid solutions and Δ H s t r u c t m is the contribution of lattice stability energy due to the differences in valence electrons and the crystal structure of solute and solvent atoms.
Δ H m = Δ H c h e m m + Δ H e l a s t m + Δ H s t r u c t m
The Δ H c h e m m term for each binary system can be determined using Equation (4), where xA and xB are the molar fraction of elements A and B, respectively; VA and VB are the molar volumes of elements A and B, respectively; ϕ* is the work function of the constituent elements; nws is the electron density; P, Q and R’ are constants related to the constituent elements; and f(CS) = CASCBS, where CAS and CBS are determined by Equation (5). Differences between the enthalpy of mixing obtained from Miedema’s model and experimental data have been reported. In order to overcome this, Wang et al. [44] proposed a correction factor, S(x), which takes into account the atomic size of solvent and solute atoms (Equation (6)), where C is an empirical parameter that describes the effect of atomic size differences in a semi-quantitative manner. C is considered equal to 0.5 and 2.0 for the liquid alloy and ordered compound, respectively. For a disordered solid solution, C is considered equal to 1.
Δ H chemical = 2 P   f ( C S ) S ( x ) ( x A V A 2 / 3 + x B V B 2 / 3 ) ( n ws A ) 1 / 3 + ( n ws B ) 1 / 3 x [ ( Δ ϕ * ) 2 + Q P ( Δ n ws 1 / 3 ) 2 R P ]
C A S = x A V A 2 / 3 x A V A 2 / 3 + x B V B 2 / 3 C B S = x B V B 2 / 3 x A V A 2 / 3 + x B V B 2 / 3
S ( x ) = 1 C x A x B | V A V B | x A 2 V A + x B 2 V B
The ΔHelastic can be calculated by the expression proposed by Bakker et al. [45], Equation (7), where ΔEA in B is the elastic energy mismatch caused by element A dissolved in element B and, ΔEB in A is the elastic energy mismatch caused by element B dissolved in element A. ΔEi in j values can be calculated using Equation (8), where K and G are the bulk and shear modulus, respectively.
Δ H elastic = x A x B ( x A Δ E A   in   B + x B Δ E B   in   A )
Δ E A   in   B = 2 K A G B ( V B V A ) 2 3 K A V B + 4 G B V A    Δ E B   in   A = 2 K B G A ( V A V B ) 2 3 K B V A + 4 G A V B
The structural enthalpy ( Δ H s t r u c t m ) is a very small value that can be neglected in the estimation of enthalpy of mixing.
The enthalpy of amorphization ( Δ H a m m ) can be calculated by Equation (9), where Δ H c h e m ,   a m m is the chemical contribution and Δ H a m t o p o is the topological enthalpy. In the amorphous alloys, the chemical and structural contributions to the enthalpy of mixing are not present because there is no crystal structure. The topological enthalpy considers the difference between the crystalline and amorphous states. Therefore, Δ H a m t o p o = 3.5 (xATAm + xBTBm) [37], where Tm is the melting temperature of elements A and B.
Δ H a m m = Δ H c h e m ,   a m m + Δ H a m t o p o

2.3. Extended Miedema’s Model for Ternary Alloys

A general approach to obtain thermodynamic information of ternary systems is the extrapolation of constitutive binary systems. The extrapolation of ternary systems has given reasonable results [33,46,47]. The extension of Miedema’s model to ternary systems can be determined based on two kind of models—symmetrical and asymmetrical [48]. The asymmetrical models consider the effect of a third element and avoid the large deviation of calculated values from experiment when constituent elements have different physical properties. In this work, Toop’s model [49] was used because it is an asymmetrical model and for its mathematical simplicity. Equation (10) shows the Toop’s model where Γ represents a thermodynamic property and ΔΓmA-B, ΔΓmB-C, and ΔΓmC-A are the thermodynamic properties of mixing of three binary systems.
Δ Γ m = ( x B x A + x B ) Δ Γ A B m ( x A , 1 x A ) + ( x C x A + x C ) Δ Γ A C m ( x A , 1 x A ) + ( x B + x C ) 2 Δ Γ B C m ( x B x B + x C , x C x B + x C )

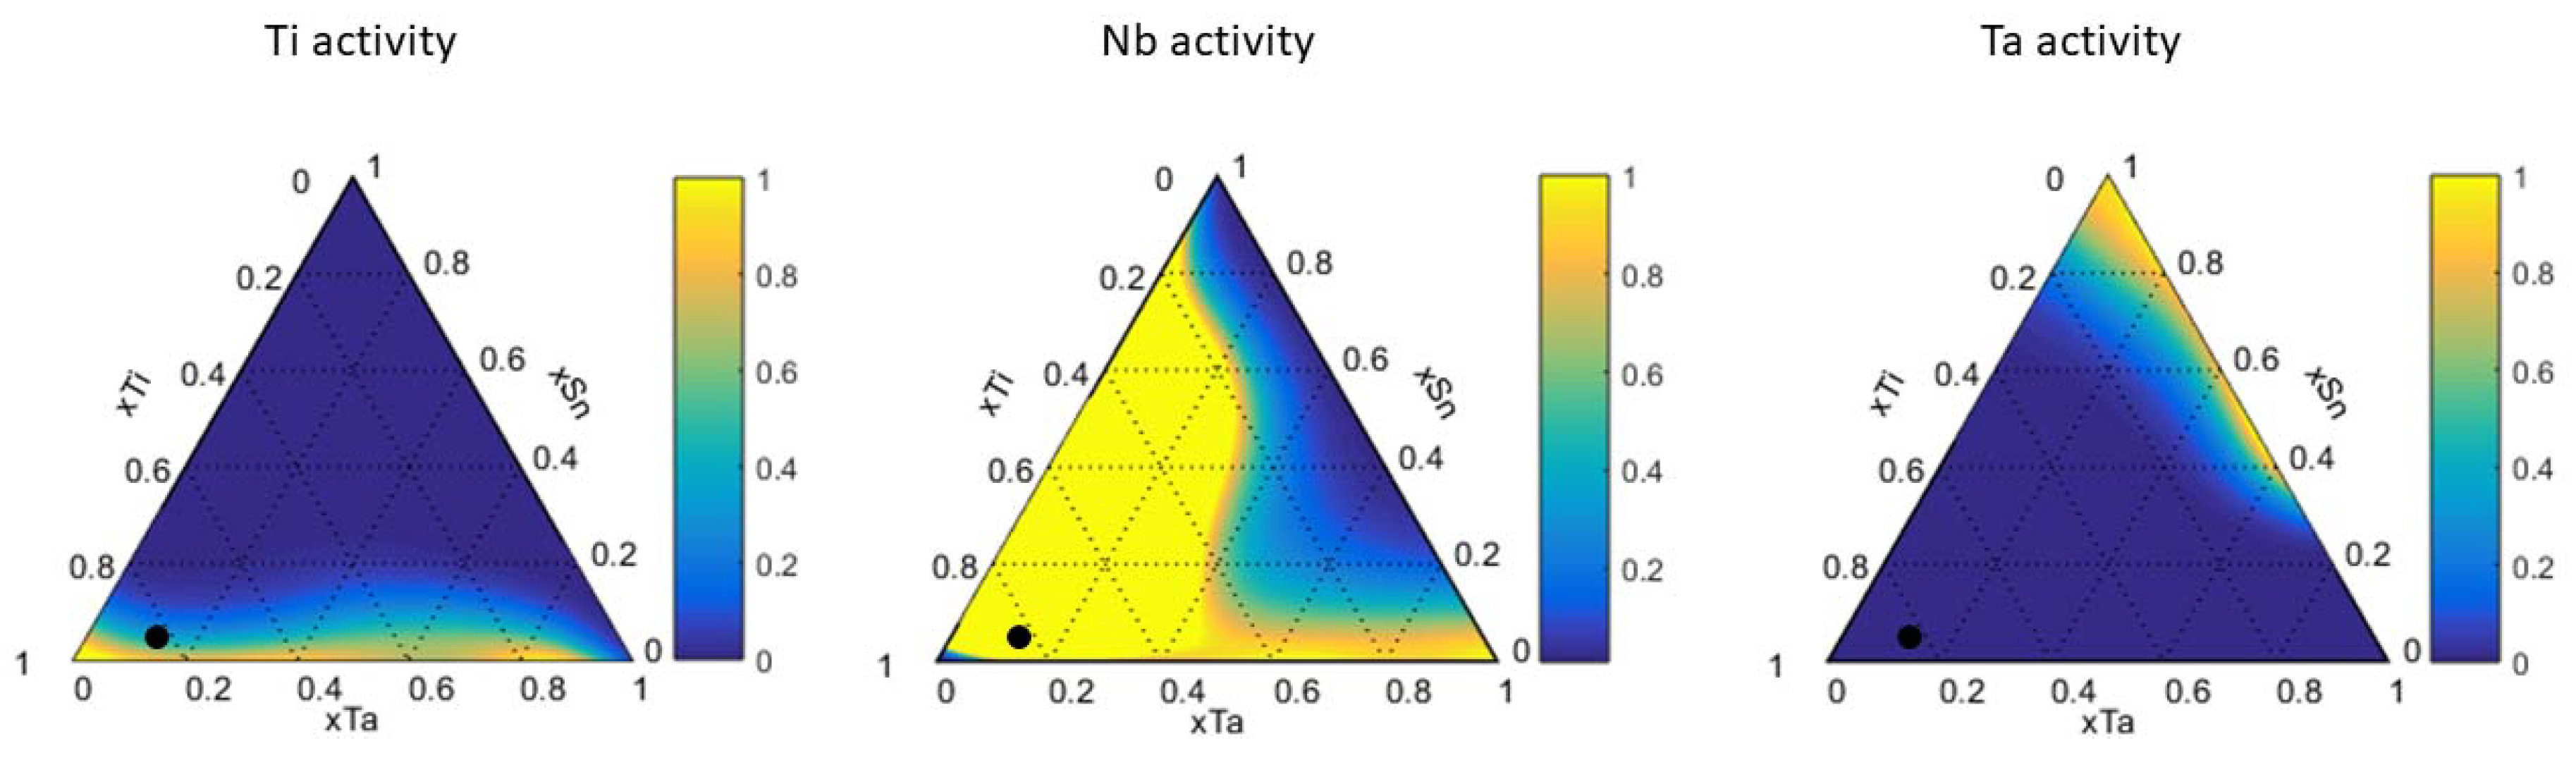
2.4. Calculation of Activity

The activity of i-species (ai) can be obtained using the method of tangential intercepts when the Gibbs free energy of mixing values are known. The method of tangential intercepts can be used to obtain the partial molar Gibbs free values of solutions according to Equation (11), and activity values are obtained from Δ G ¯ i m using Equation (12), where Δ G ¯ i m is the partial Gibbs free energy of mixing.
Δ G ¯ i m = Δ G m + x 1 i d Δ G m d x i
a i = exp ( Δ G ¯ i m R T )

2.5. Estimation of Storage Energy Produced by Crystalline Defects

Crystalline defects such as dislocation, vacancies, grain boundaries, stacking faults and twins are produced during milling. The Gibbs free energy increases when crystalline defects increase. The biggest contributions to Gibbs free energy come from grain boundaries and dislocations. The contribution of grain boundaries is an order of magnitude greater than dislocations and its contribution can be estimated by applying Equation (13) [50], where γ is the grain boundary energy, A/V is the surface/volume ratio and Vi is the molar volume. A spherical crystallite (or grain) morphology was assumed. On the other hand, the contribution of dislocations can be estimated using Equation (14), where ξ is the dislocation elastic energy per unit length of dislocation lines and ρ is the dislocation density. ξ can be calculated applying Equation (15), where G is the shear modulus, b is the Burger vector, Re is the outer cut-off radius of dislocations and r0 is the inner cut-off radius. A value of 100% of edge dislocations was assumed.
Δ G g b = γ ( A V ) V i
Δ G d = ξ   ρ   V i
ξ = ( Gb 2 4 π ) ln ( Re r 0 )
An approximation of the total Gibbs free energy stored (ΔGT) during milling can be estimated adding Equations (13) and (14), resulting in Equation (16). The condition necessary for the solid solution to be formed is when ΔGT > ΔGm.
Δ G T = Δ G d + Δ G gb

3. Materials and Methods

3.1. Ti-Ta-Sn System

A Ti-13Ta-3Sn alloy (at.%) was obtained by mechanical alloying using Ti powders of grade IV (<149 µm), Ta powders (99.9% purity, −325 mesh) and Sn powders (99.8% purity, <100 mesh). The alloy was milled using a planetary mill (Retch PM400, Haan, Germany) at 250 rpm and using the following conditions: (i) jar/balls of Yttrium stabilized ZrO2 (YSZ, volume of the jar was 250 mL), (ii) agate balls of two diameters, 10 and 5 mm, with a constant ball-to-powder ratio of 10:1, (iii) the jars were filled with ultra-pure argon gas, (iv) 2 wt. % of stearic acid was used as a process control agent (PCA) to prevent cold welding and (v) the powders were milled for different periods ranging from 5 to 100 h and for each specific milling time, powder mixtures were collected in a dry box under Ar atmosphere and dispersed in hexane to prevent oxidation during handling. X-ray powder diffraction (XRD) patterns of the samples were obtained using an STOE STADI MP multipurpose powder diffractometer (Baden, Germany) equipped with a DECTRIS MYTHEN 1 K (DECTRIS, Switzerland) detector using Cu Kαl radiation. The samples were measured in transmission mode using a step of 0.012° and a stepwise dwelling time of 10 s in an angular range of 2θ from 20 to 120°. The microstructural information was obtained by doing Rietveld refinement using the Materials Analysis Using Diffraction (MAUD) software, version 2.94 (http://maud.radiographema.eu/).

3.2. Ti-Nb-Ta System

Experimental data and calculated values of crystallite size and microstrain were collected from the literature for (i) Ti-30Nb-13Ta (at.%) alloy [32] and (ii) Ti-20Nb-30Ta (wt. %) alloy [51], respectively.

3.3. Ti-Nb-Mn System

A Ti-33Nb-4Mn alloy (at.%) was obtained by mechanical alloying using Ti powder (99.6% purity, < 325 mesh, Noah Technologies, San Antonio, TX, USA), Nb powder (99.9% purity, < 325 mesh, Noah Technologies) and Mn powder (99.9% purity, < 325 mesh, Noah Technologies). The alloys were milled using a Retsch PM400 planetary mill at 300 rpm with the following conditions: (i) jar/balls of tempered steel (volume of the jar was 300 mL), (ii) steel balls of a diameter of 8 mm with a constant ball-to-powder ratio of 10:1, (iii) the jar was filled with ultra-pure argon gas, (iv) 3 wt. % of hexane (99% purity, Noah Technologies) was added to the powder mixture as a process control agent and (v) the powders were milled for different periods ranging from 1 to 120 h and for each specific milling time, powder mixtures were collected and dispersed in hexane to prevent oxidation during handling in argon atmosphere. The XRD patterns were collected using a PANalytical X’Pert Pro (Malvern, UK) with a Cu Kα1 radiation source, a secondary Kβ filter and an X’Celerator detector (Malvern, UK). The XRD patterns were measured in θ/θ mode scanning from 2θ between 20° and 150° in the step-scan mode with 0.02° steps and a counting time of 275 s/step. The microstructural characterization was obtained by doing Rietveld refinement using the FullProf program, version v2.5.13 (https://www.ill.eu/sites/fullprof/). This alloy was developed by our group and more information can be found in [35].

4. Results and Discussion

In this section, the thermodynamic analysis for the formation of two types of solid solutions, namely γ-type and β-type, in Ti-based alloys is presented. During mechanical alloying, the crystalline defect density (dislocation, vacancy, stacking fault and twins) in metallic powders increases due to the severe plastic deformation. In some systems, these defects increase the internal energy, making the formation of one of the solid solutions energetically favourable, as indicated by the MAAT software.

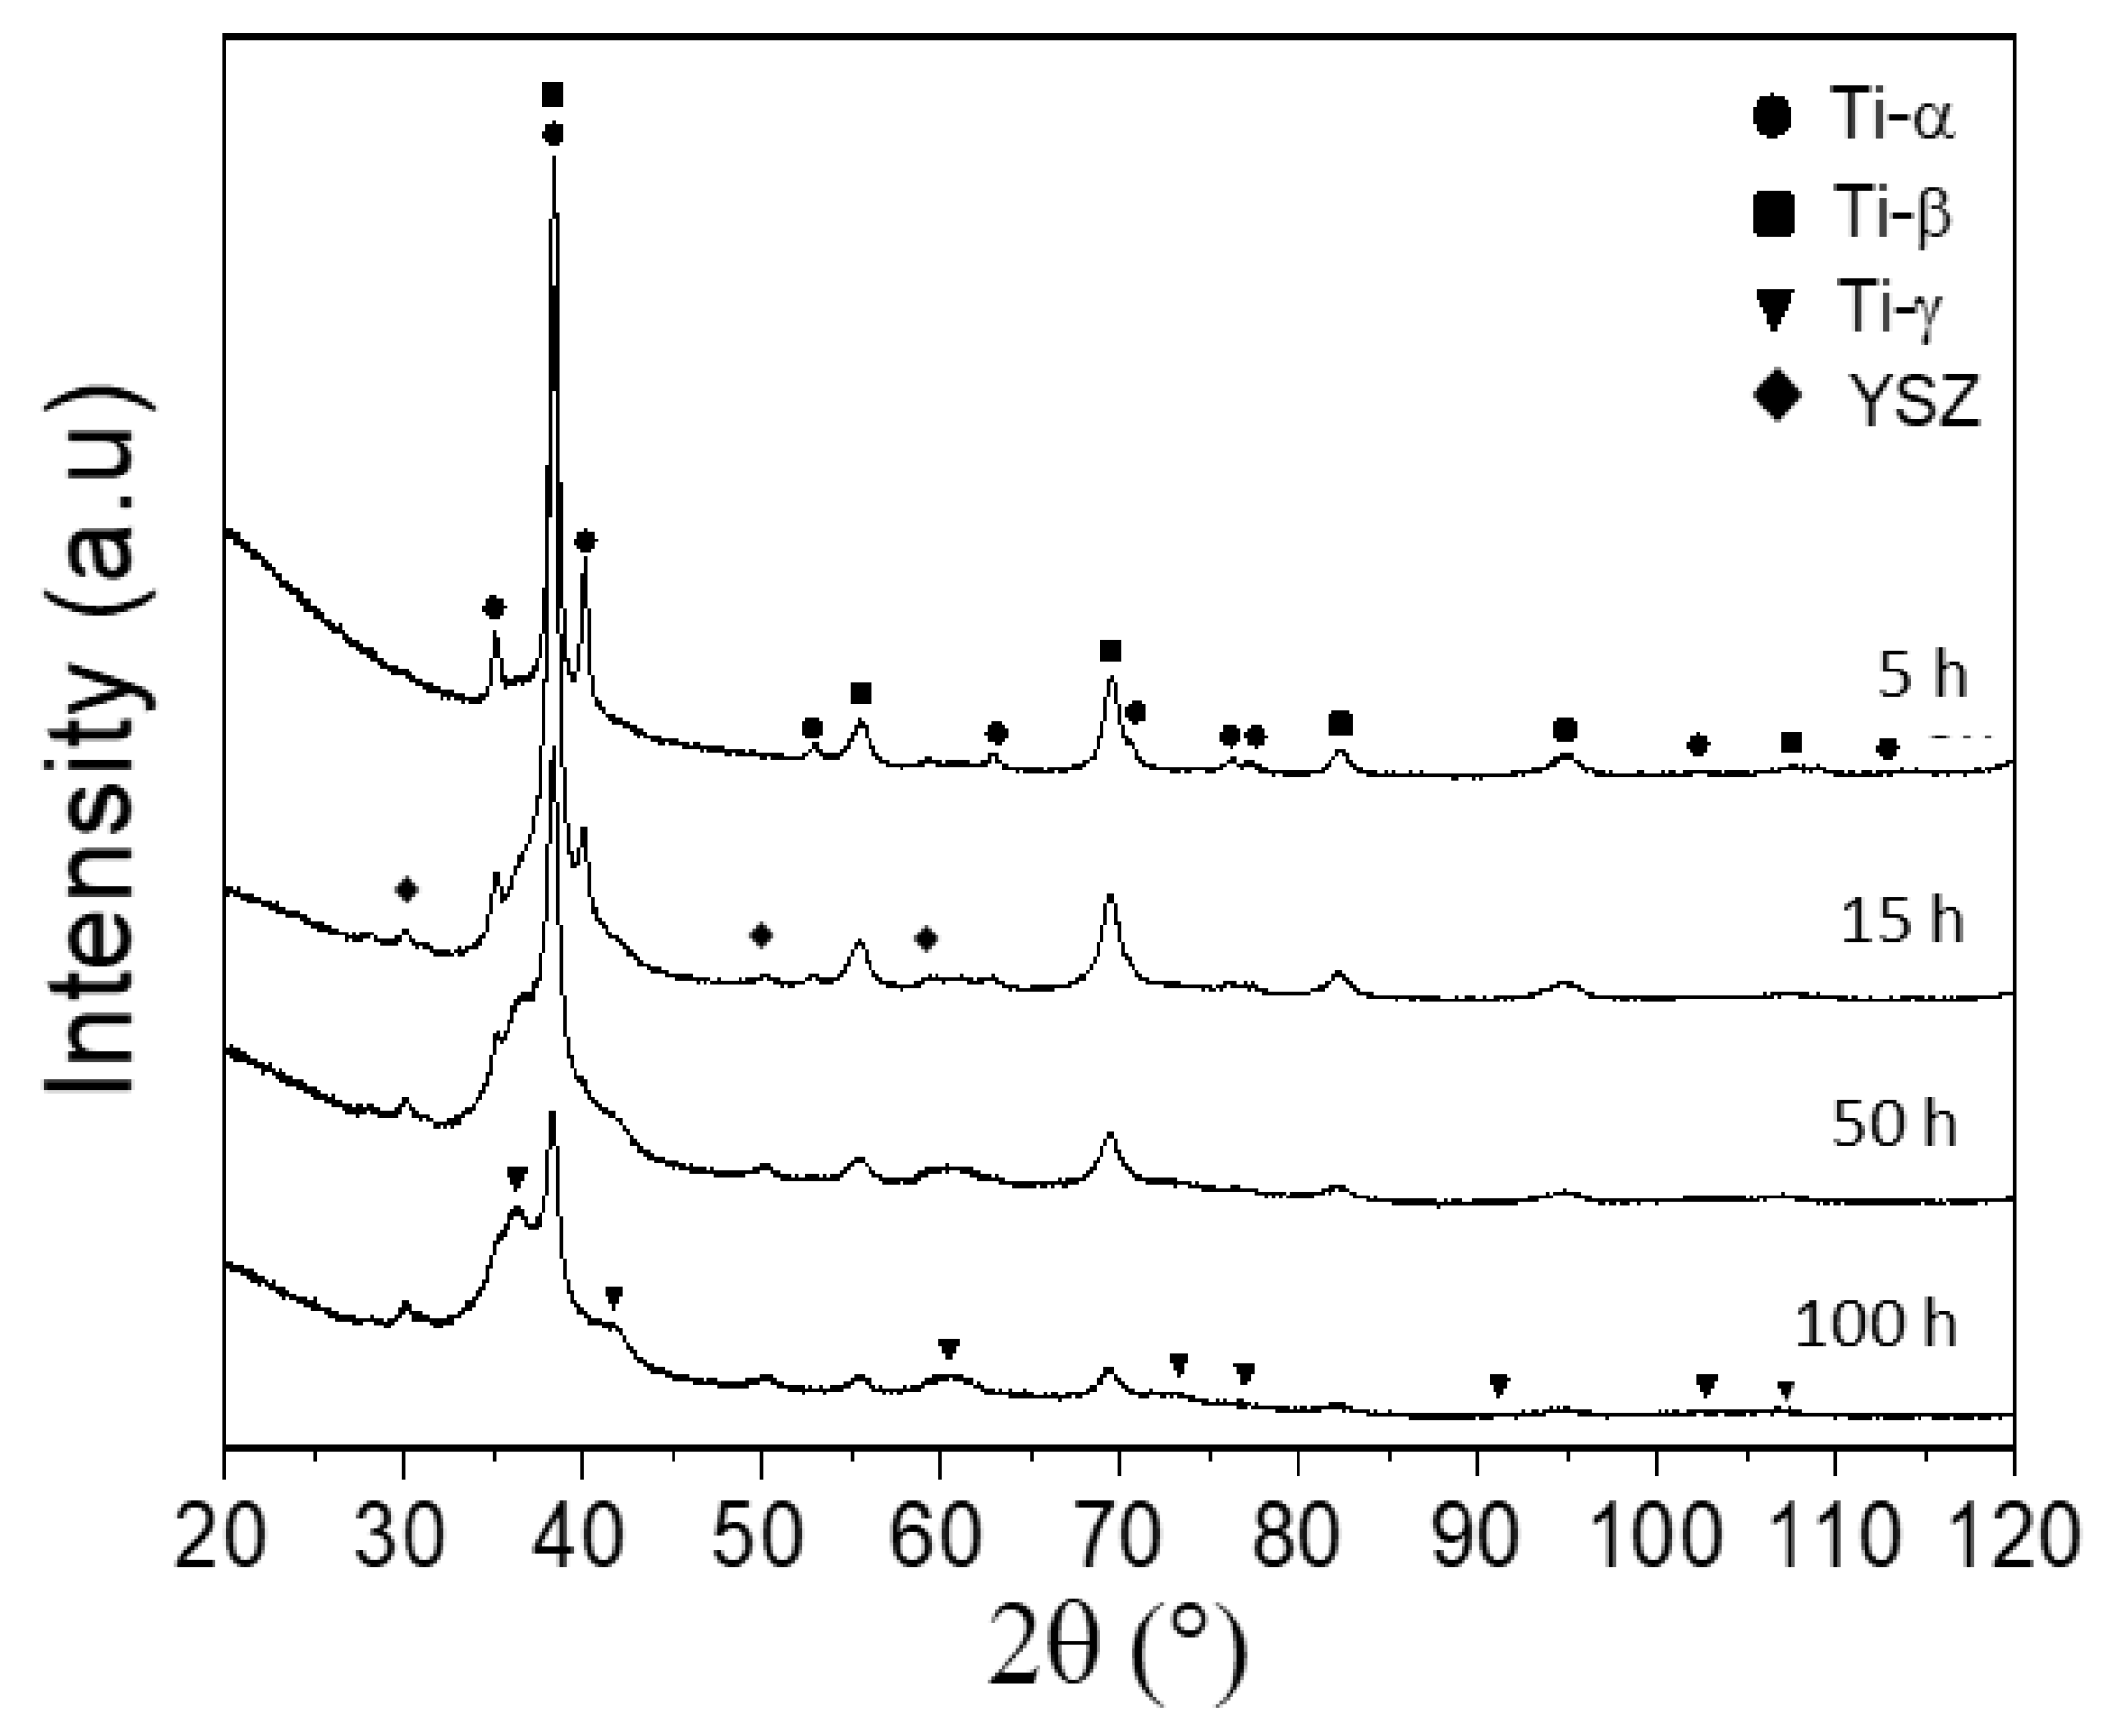
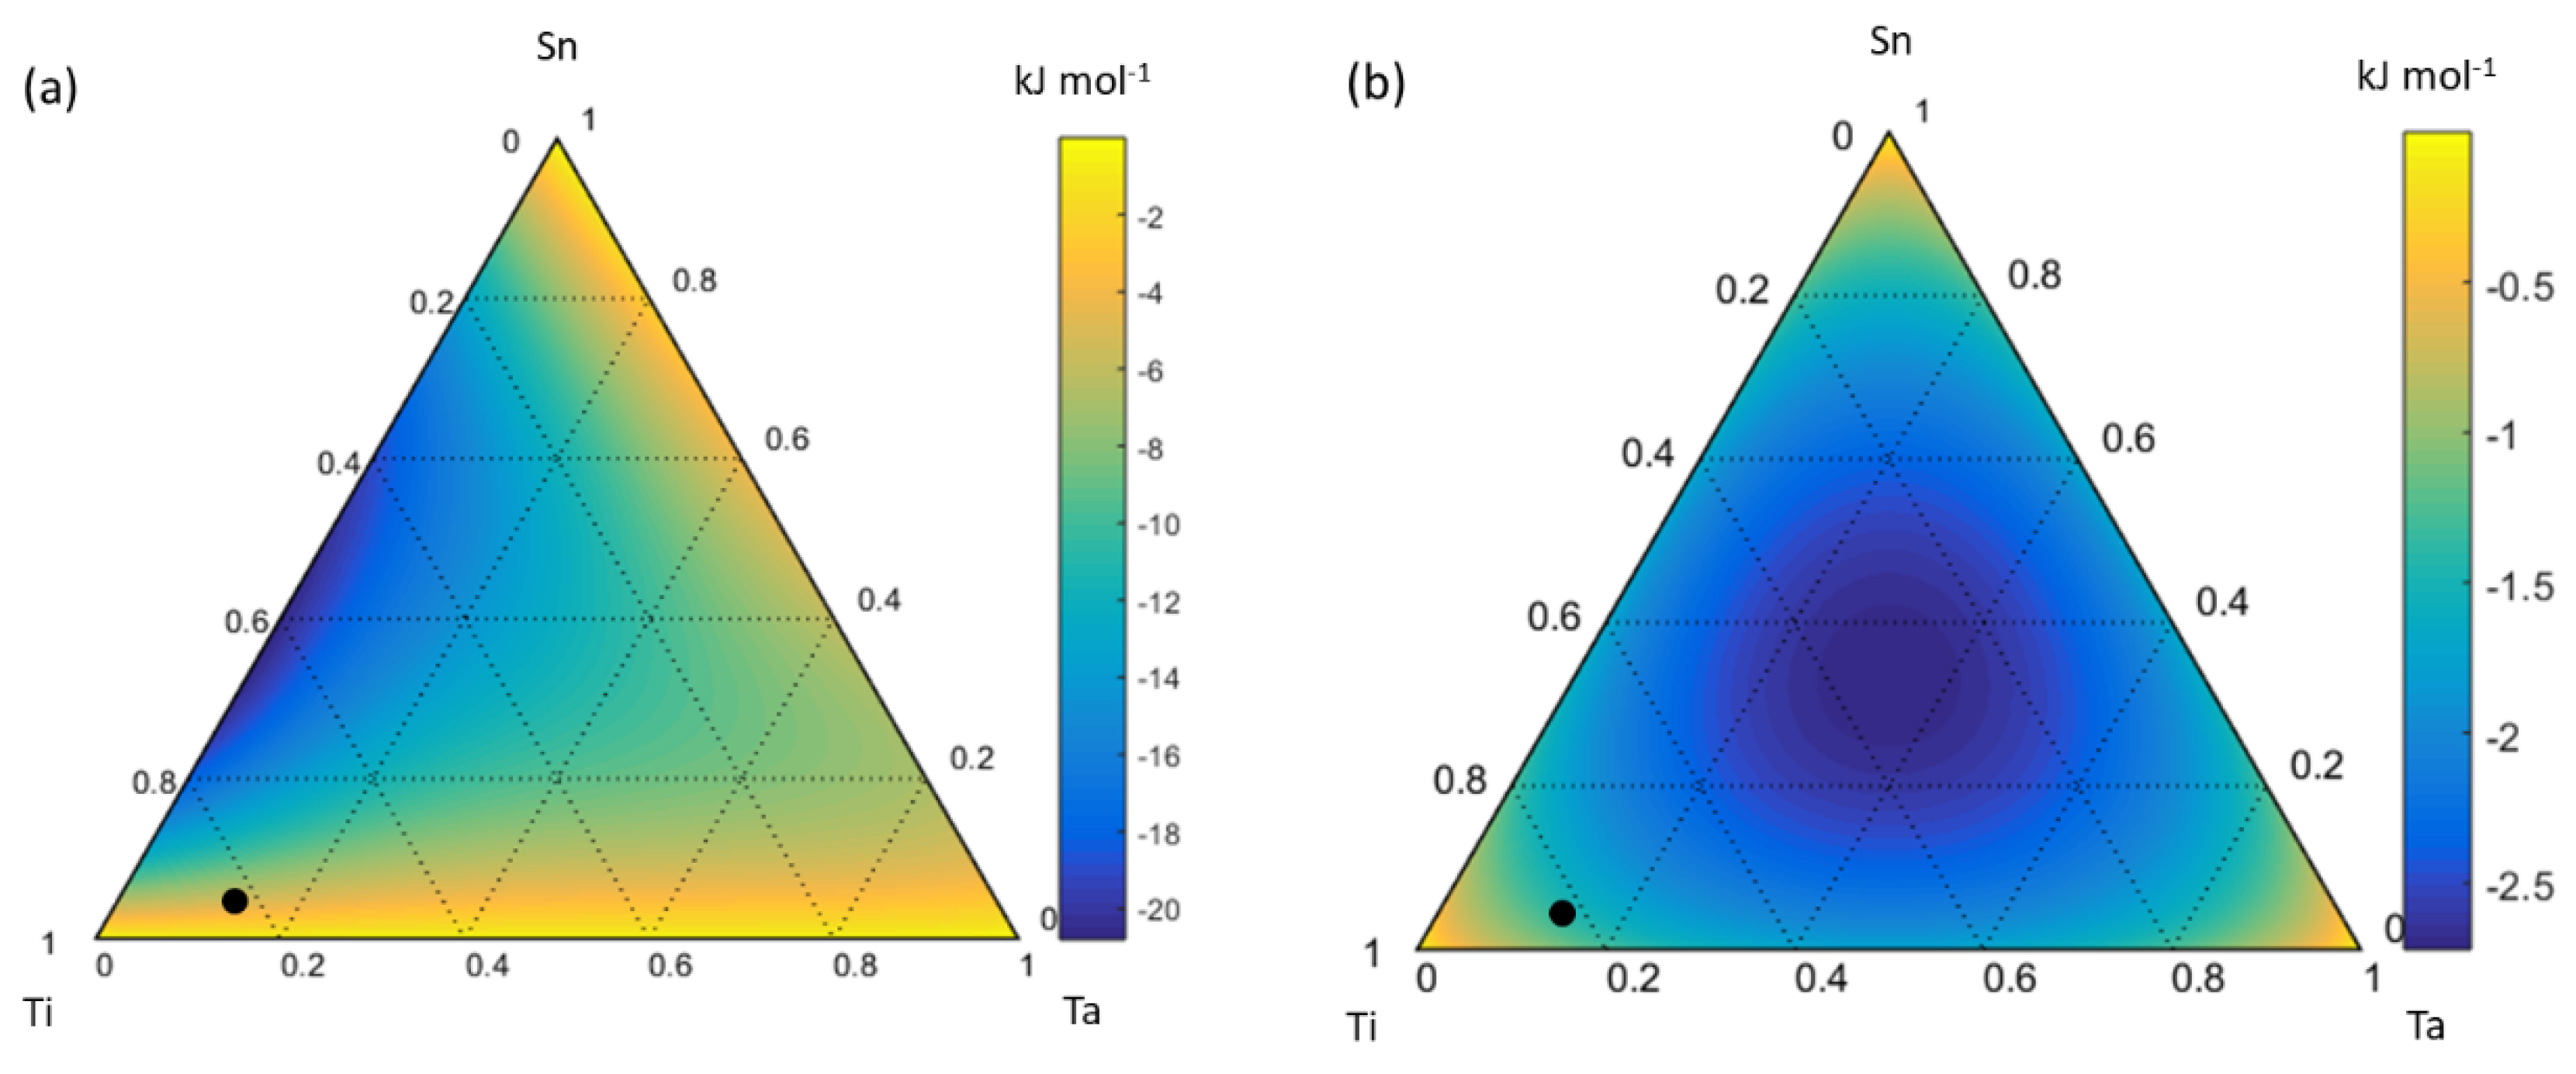
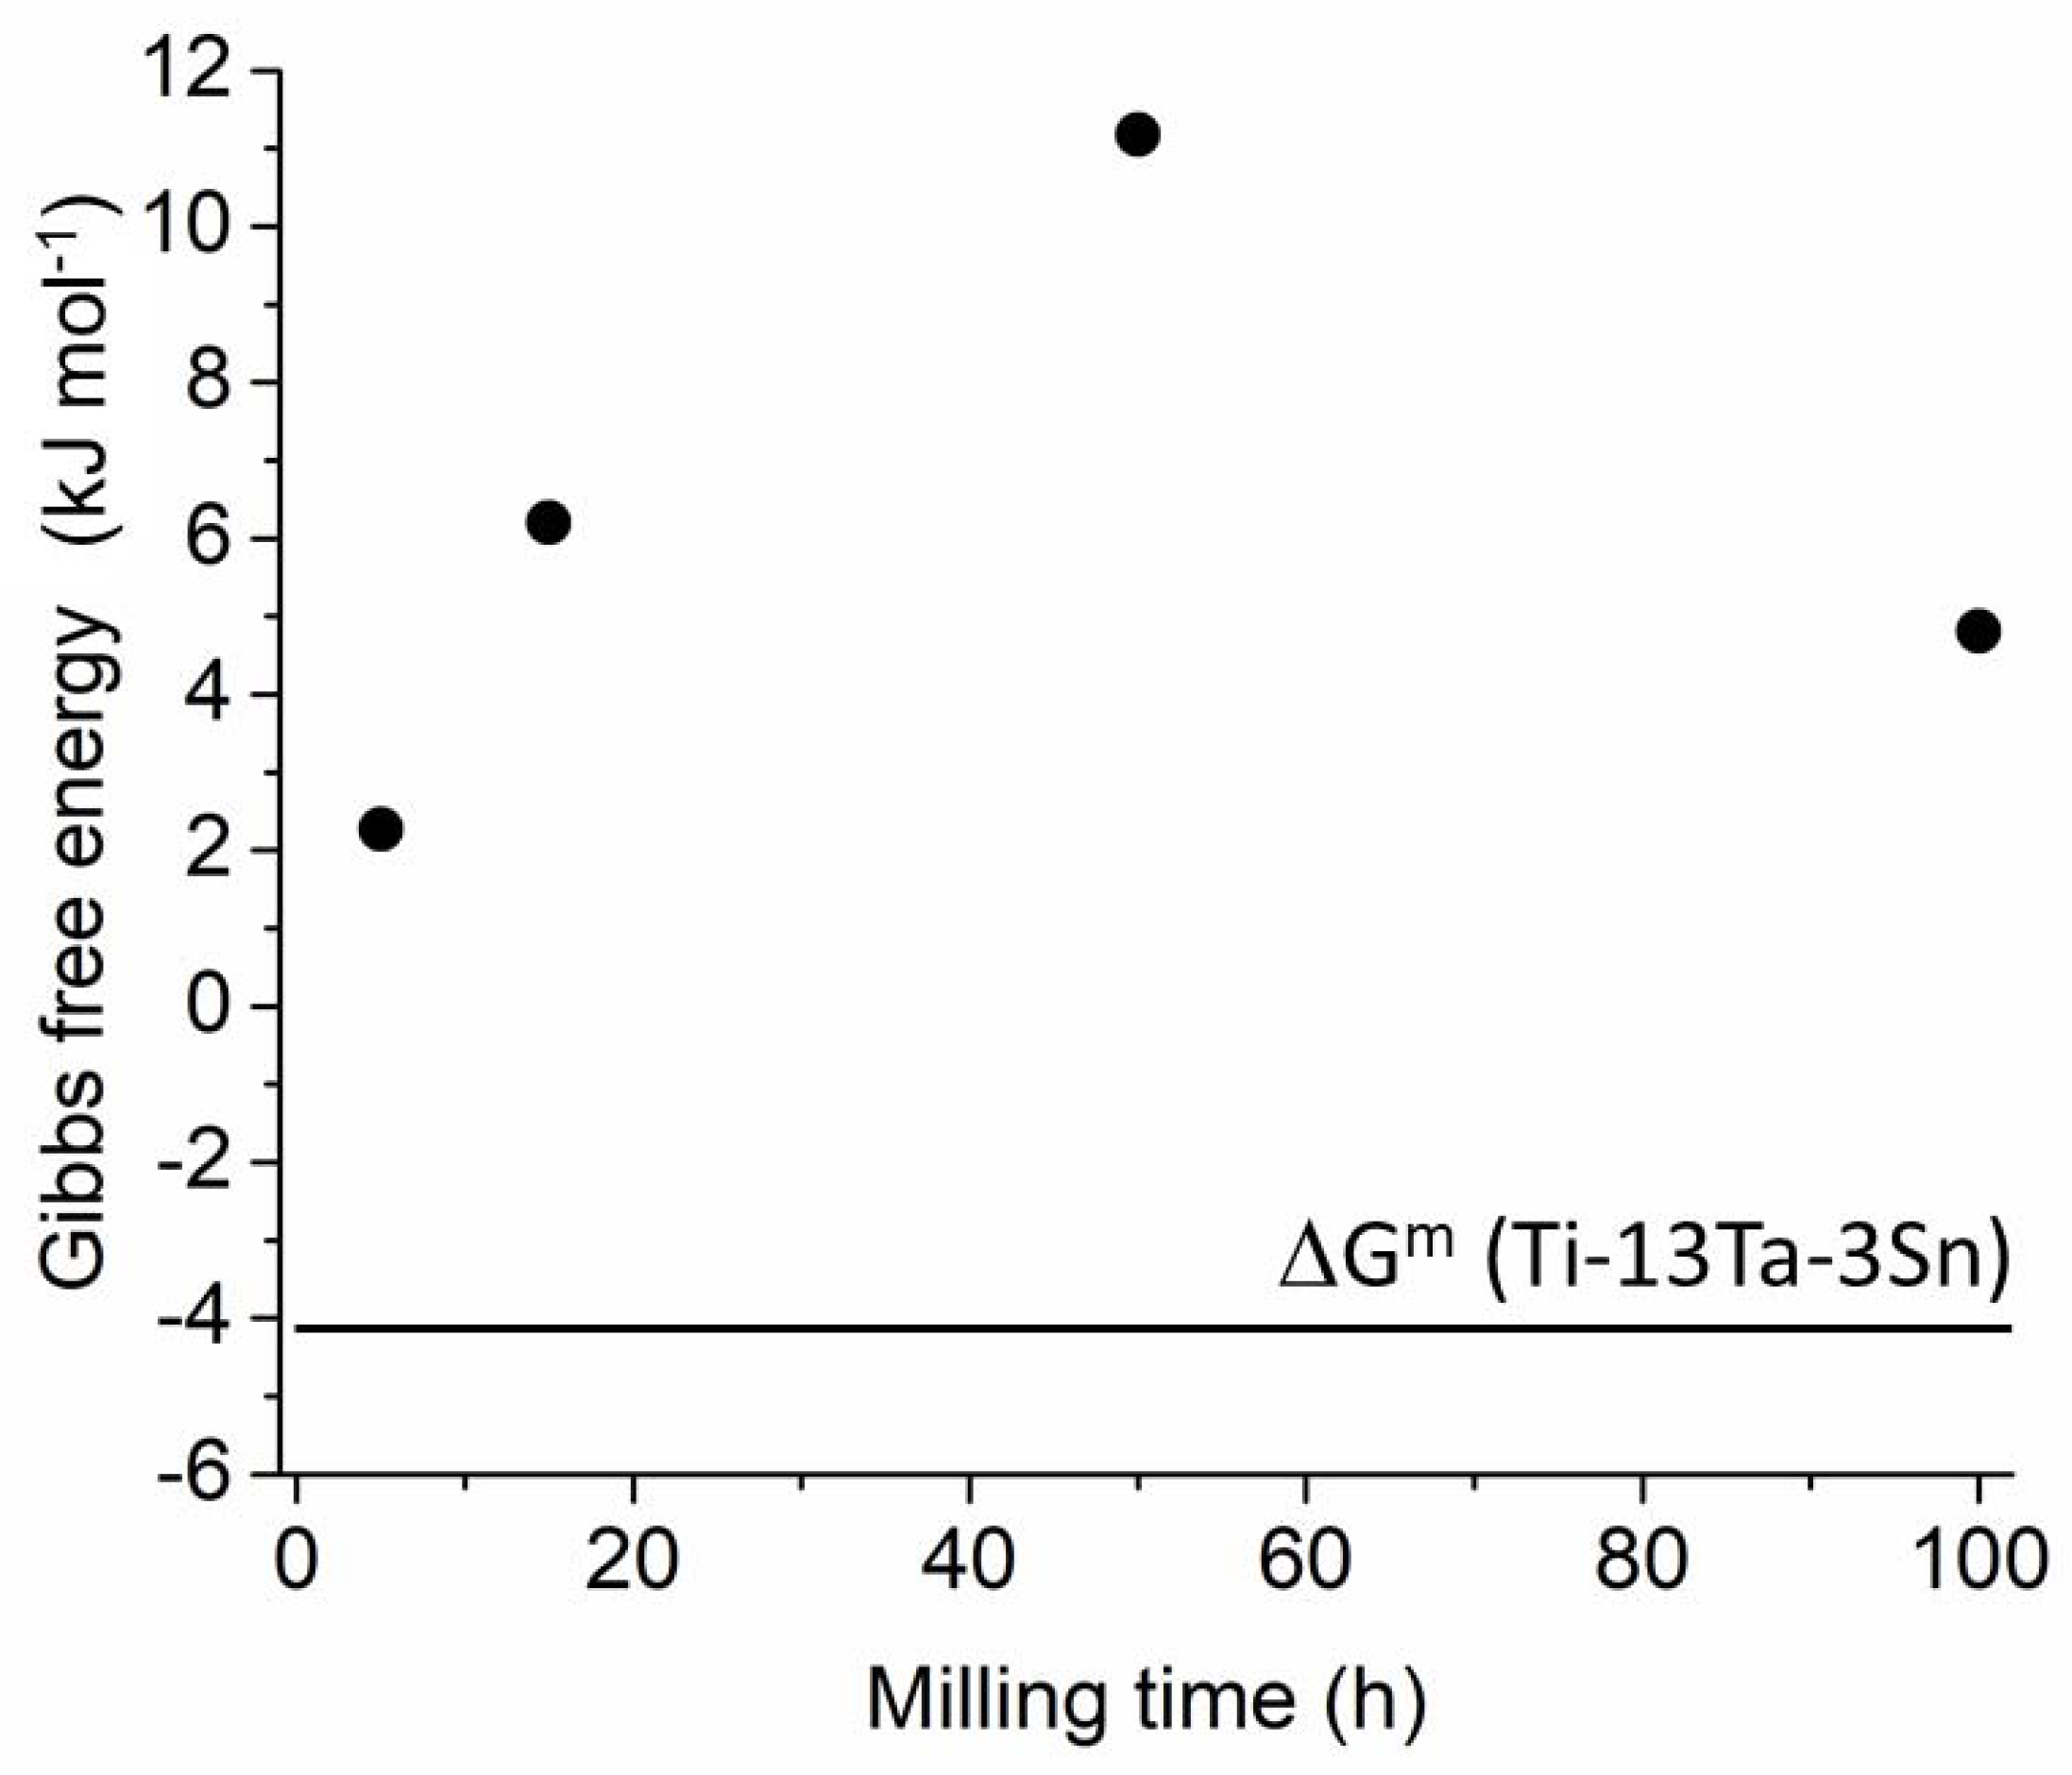
4.1. Ti-Ta-Sn System

Figure 1 shows the evolution of XRD patterns as a function of milling time. At 5 h, the XRD patterns exhibited the following characteristics: peak broadening, peak shift and disappearance of peaks of solute due to the severe plastic deformation induced during mechanical alloying [33]. For the discussion, it should be considered that α-Ti, β-Ti and γ-Ti are Ti-based solid solutions with different crystal structures. The crystal structure and space groups of α-Ti, β-Ti and γ-Ti, Ta and Sn are hcp (P63/mmc), bcc ( Im 3 ¯ m ), fcc ( Fm 3 ¯ m ), bcc ( Im 3 ¯ m ) and tetragonal (I41/amd), respectively. At 5 h, α-Ti and β-Ti phases were observed; however, Ta and Sn were not observed because they entered into a solid-solution phase [52]. At 15 h, there are four phases: α-Ti, β-Ti and γ-Ti as well as Y2O3ZrO2 (YZrO). The strongest X-ray reflections of α-Ti, β-Ti and γ-Ti in the angular range 35–45 (2θ°) overlapped each other but were observed in High Resolution Transmission Electron Microscopy (HRTEM) images. The presence of the YZrO compound indicates that contamination occurred during the milling stage, coming from the jar and balls used during milling. At 50 and 100 h, the alloy exhibits mostly the presence of the β-Ti (~76 wt. %) and, in a smaller quantity, α-Ti (<2 wt.%) and γ-Ti (~22 wt.%) phases (the presence of YZrO is not considered). For this reason and for the sake of the thermodynamic analysis, only the formation of the β phase (solid solution) is analysed here. Table 1 gives the crystallite size and microstrain values as a function of milling time of the β-Ti phase. The characterization of microstructural parameters for α-Ti, β-Ti and γ-Ti phases was done by Rietveld refinement of the XRD patterns. The profile fitting was performed by considering the following: pseudo-Voight function, isotropic size-strain model, Delf line broadening model, without planar defects and arbitrary texture. The Rietveld refinement was carried out using the MAUD software [53,54]. The quality of refinements is given by Rwp and goodness of fit (GofF) indicators. The values obtained were as follows: 6.38–2.33%, 6.78–2.33%, 3.79–1.49% and 4.68–1.88% for 5, 15, 50 and 100 h, respectively. These values are considered good because they are within acceptable ranges, namely 1 < GofF < 2 and Rwp < 10% [55]. The calculated crystallite sizes are within nanometric range with values smaller than 30 nm. Crystallize size decreases as milling time increases because the alloy became harder and stronger due to the effect of three strength mechanisms—(i) severe plastic deformation, (ii) diminution of crystallite size and (iii) formation of solid solution. Therefore, the solid solution increases its fragmentation tendency [56]. The microstrain increases until typical values of alloys undergo severe plastic deformation, and if milling continues the nanocrystalline grain reaches a saturation value of microstrain. When this saturation value is reached, it is very difficult to produce more dislocations and, as a consequence, some of these dislocations rearrange themselves and others are eliminated. For this reason, the microstrain decreases [57].
Figure 2a shows the Gibbs free energy of mixing (∆Gm) and Figure 2b shows the ideal Gibbs free of mixing (∆GM,id) to form solid solutions in the Ti-Ta-Sn ternary system at any given composition. The ∆Gm values are negative and smaller than ∆GM,id values in the whole composition range, suggesting that there is a driving force to form a solid solution from elemental Ti, Ta and Sn powders. The largest values are in the Ta-rich zone (Ta corner) with ∆Gm values close to −0.5 kJ mol−1. The smallest ∆Gm values are close to the Ti-Sn system, with values around −22 kJ mol−1. Figure 3 shows the activities of Ti, Ta and Sn in the β-Ti solid solution in the whole composition range. The Ti activity (aTi) is smaller than 0.1 in almost the entire composition range; however, it slightly increases close to the Ti-Ta binary system. This shows that Ti has chemical affinity with Ta and Sn in almost the entire composition range. The Ta activity (aTa) is close to 1 in the Ti-rich corner and decreases towards the Ta-Sn binary system. The Sn activity (aSn) is smaller than 0.05 in almost the entire composition range and increases close to the Sn-rich corner. In the composition (Ti-13Ta-3Sn), the aTi, aTa and aSn exhibit values of ~0.5, 1.0 and ~0.01, respectively. The ∆Gm values are smaller than ∆Gm,id values, as seen in Figure 2b in the whole composition range. Therefore, the obtained ∆Gm, aTi, aTa and aSn values suggest that there is a small driving force to form a solid solution from elemental Ti, Nb and Mn powders. Thus, the external energy transferred towards powders by the milling acts as an activation energy to promote the formation of a solid solution.
The evolution of the total storage energy (GT) values as a function of milling time is given in Figure 4. All GT values increase from ~2 to 11 kJ mol−1 at 50 h and decrease to ~5 kJ mol−1 at 100 h. The ∆Gm value to form a solid solution for the composition of Ti-13Ta-3Sn (at.%) is ~−6 kJ mol−1, as seen in Figure 2. At all milling times, the required condition to form a solid solution is met, i.e., GT > ∆Gm.

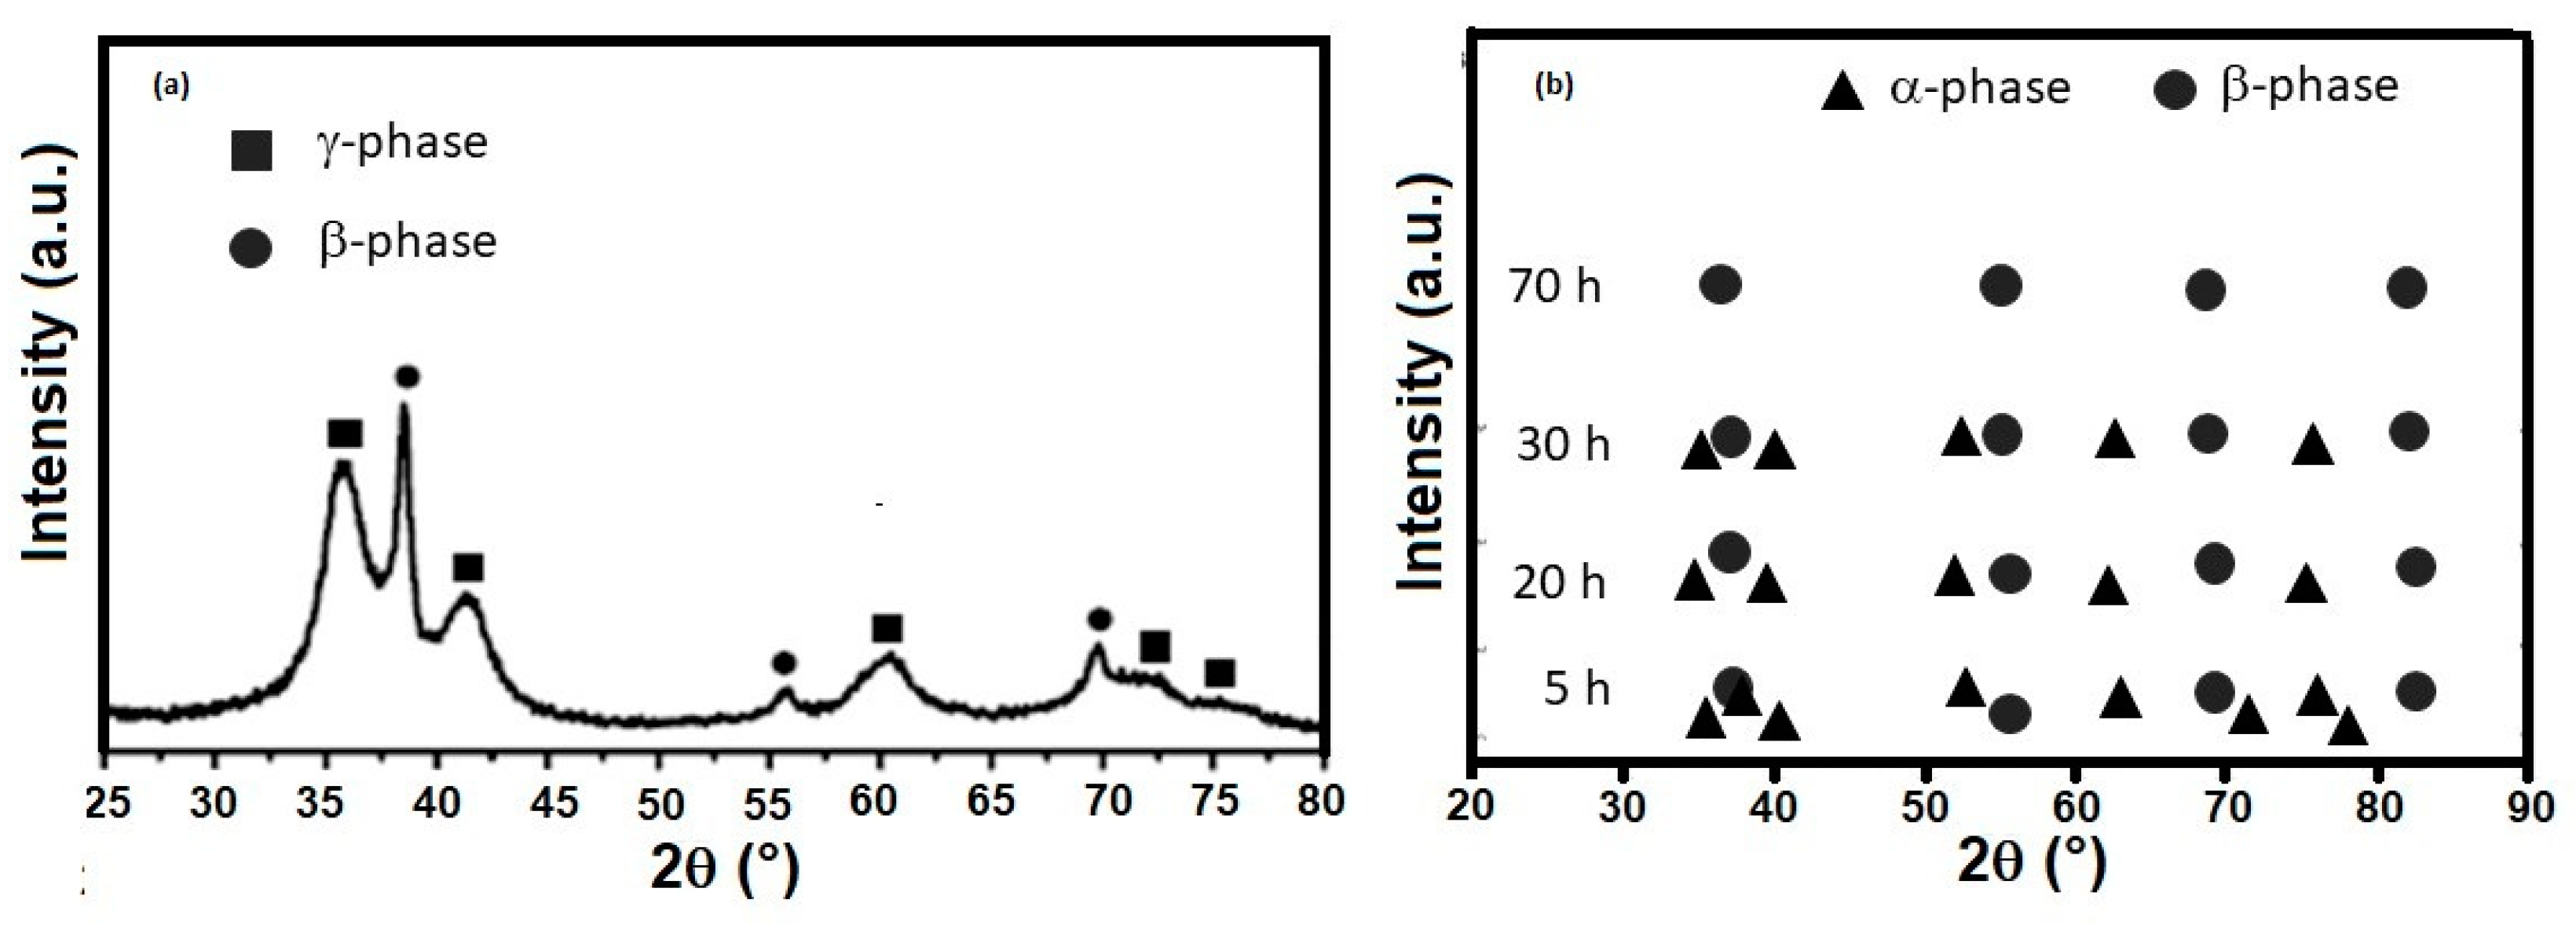
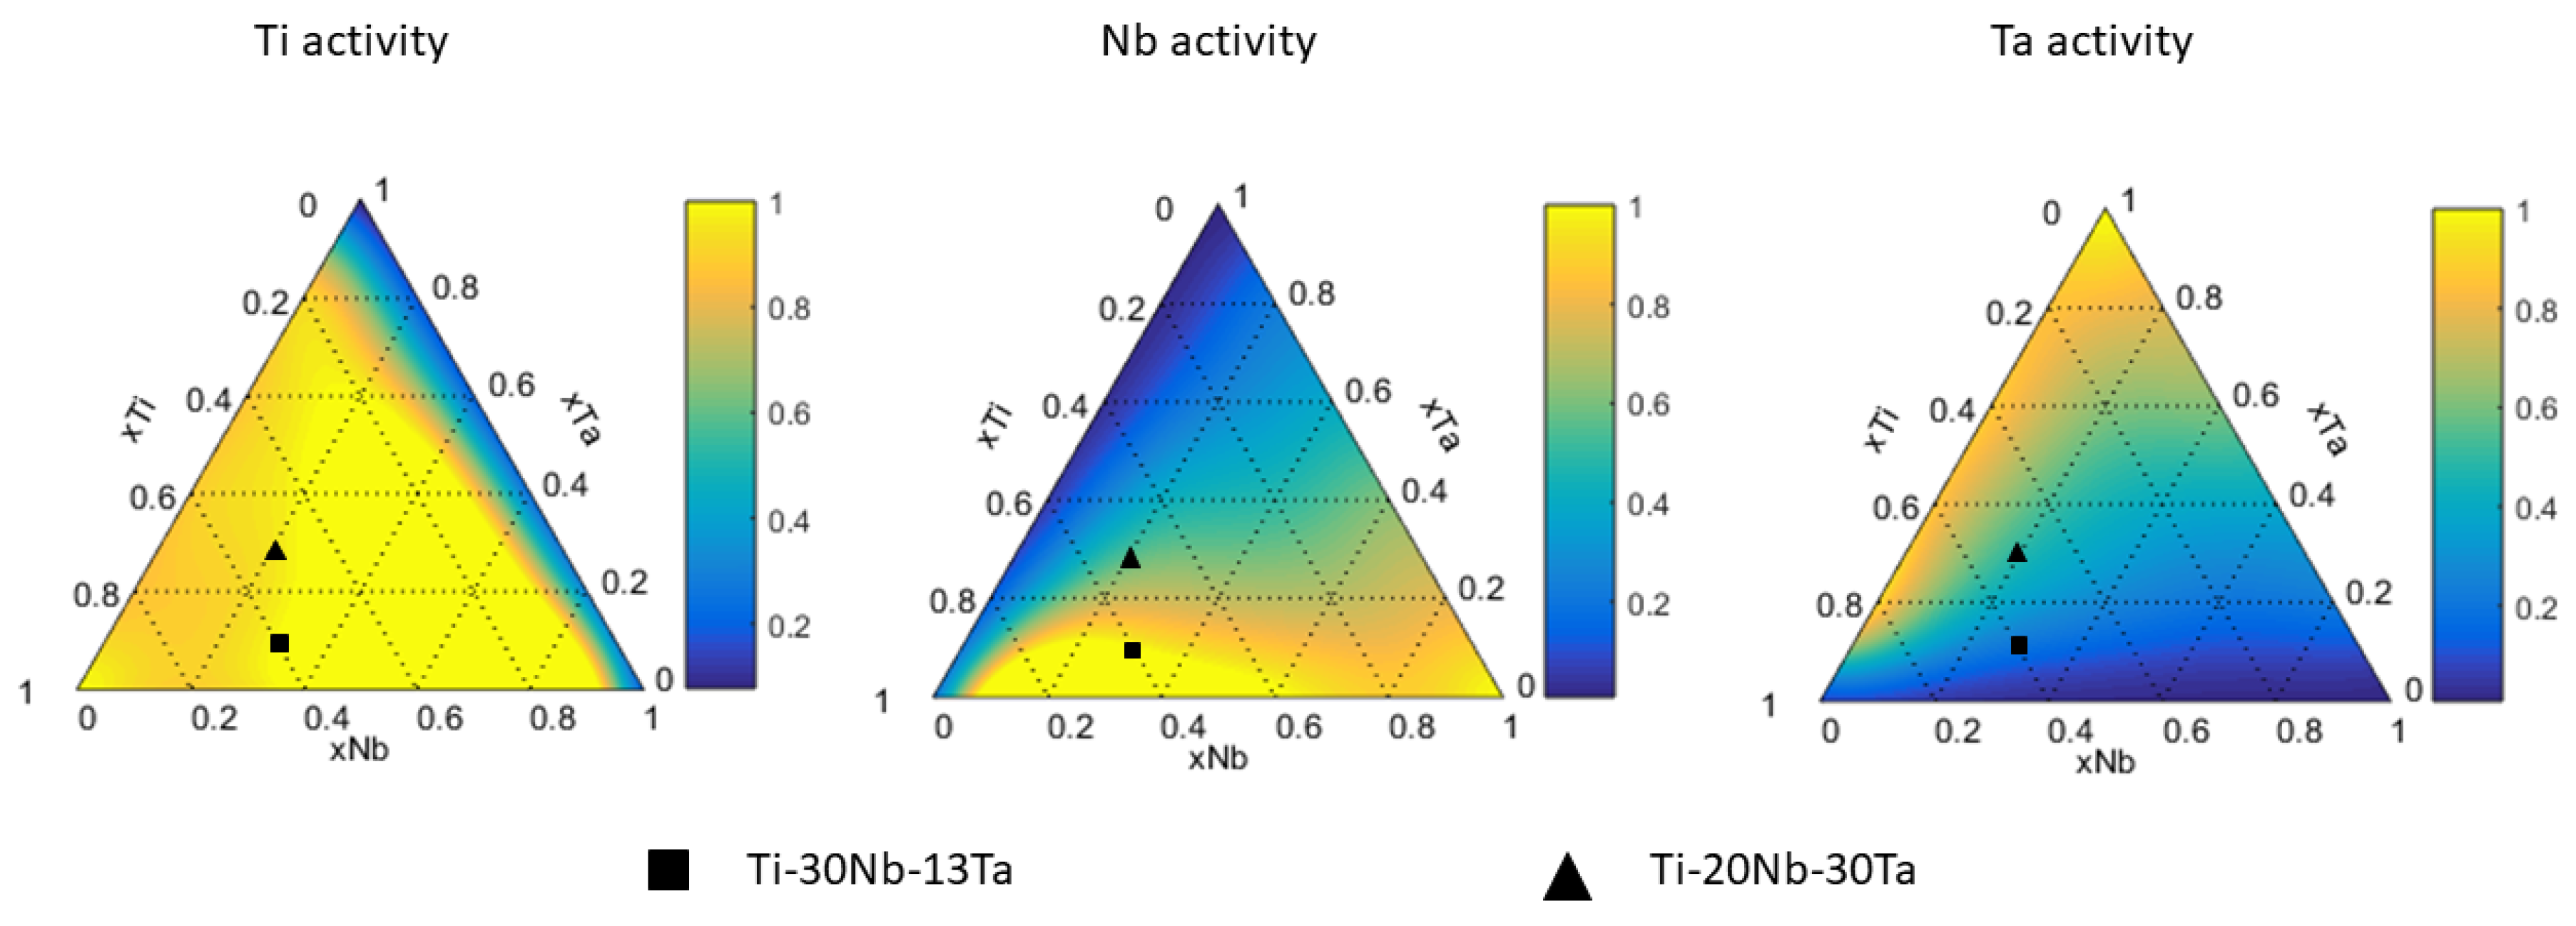
4.2. Ti-Nb-Ta System

Figure 5a shows the XRD pattern of the Ti-30Nb-13Ta alloy milled for 60 h. Two phases are observed, namely β-Ti and γ-Ti. Ti, Ta and Nb reflections were not observed in the XRD pattern; therefore, these elements entered into two solid solutions, namely β-Ti and γ-Ti. The reflections exhibit large broadening that is due to the presence of crystalline defects such as dislocations and crystallite boundaries [52,56]. Rietveld analysis was carried out using FullProf software [58]. The authors did not report much information about the models used, such as profile function, model for crystallite size and microstrain (isotropic or anisotropic), texture, stacking fault, etc. The reflection broadening suggests that the Ti-30Nb-13Ta alloy has a very small crystallite sizes in both phases, in the nanocrystalline range as indicated in Table 2 (the authors reported no microstrain values).
Figure 5b shows the presence of phases of the Ti-20Nb-30Ta alloy milled at 5, 20, 30 and 70 h [51]. At 5 h, two phases were observed, namely α-Ti and β-Ti. When milling time increases, the presence of α-Ti decreases and is not observed at times higher than 30 h, and the β-Ti increases until 100% at 70 h. At higher milling times, the reflections exhibit shifting and broadening due to severe plastic deformation produced during milling. There are no Ti, Nb and Ta reflections, suggesting that they entered into a solid solution [29]. The authors used the Williamson–Hall method to obtain crystallite size and microstrain results [59], and the obtained values are summarized in Table 3. The microstrain values were reported as %; therefore, to compare the values obtained in other works, they were converted to <ε2>1/2 using the expression described in Equation (17) [60], where e is the micro deformation obtained from the Williamson–Hall method. Finally, only the formation of the β-Ti phase in both alloys was analysed.
< ε 2 > 1 / 2 = ( 2 π ) 1 / 2 ( e 100 % )
Figure 6 shows the calculated Gibbs free energy of mixing required to form a solid solution for the Ti-Nb-Ta system at 298 K. The ∆Gm values are slightly negative in almost the entire composition range and they are higher than ∆GM,id, as is presented in Figure 2b. There are slightly positive values close to the Ti-Nb binary system in the equimolar composition (~1 kJ mol−1), and the most negative values are close to the Nb-Ta binary system in the equimolar composition (~-2 kJ mol−1). These results show that the chemical affinity between Nb and Ta is greater than Ti-Nb and Ti-Ta. Comparing the ∆Gm and ∆Gm,id values for both analysed compositions, it is suggested that there is no driving force to form a solid solution from elemental Ti, Nb and Ta powders. Figure 7 presents the changes in activities of Ti, Nb and Ta in the whole composition range. Activity values equal to 1 mean that the elements are in their standard reference state (the element is in a pure state). The Ti activity (aTi) is close to 1 in almost the entire composition range, which shows that there is no tendency of Ti to form a solid solution with Nb and Ta, it is only smaller than 1 close to the Ta-Nb binary system when xTi < 0.2. The Nb activity (aNb) shows values close to 1 around the composition of Ti-20Nb-10Ta and smaller values close to the Ti-Ta binary system. Finally, the Ta activity (aTa) exhibits smaller values close to the Ti-Nb binary system, indicating its chemical affinity to form a solid solution in this zone. For both analysed compositions, the Ti, Nb and Ta activities are higher than their respective molar fraction (xi), indicating no tendency to form a solid solution between them. To form a solid solution, external energy is required.
The evolution of the total storage Gibbs free energy (GT) as a function of milling time for both alloys is given in Figure 8. All GT values increase from ~0.5 to ~5.7 kJ mol−1 at 70 h for Ti-20Nb-30Ta. At 60 h, the Ti-30Nb-13Ta alloy exhibits a GT value of ~5.0 kJ mol-1. In this case, a microstrain value of <ε2>1/2 = 1 × 10⁻² was assumed when doing the calculations because this particular value was not reported by [32]. The ∆Gm values to form a solid solution for both alloys, Ti-30Nb-13Ta and Ti-20Nb-30Ta, are ~−0.5 and ~−1.0 kJ mol−1, respectively, as can be seen in Figure 6. In both cases, the GT values are greater than ∆Gm values for all milling times, which shows that the milling process transferred sufficient external energy to form a solid solution. The required condition to form a solid solution is achieved (GT > ∆Gm) in both alloys.

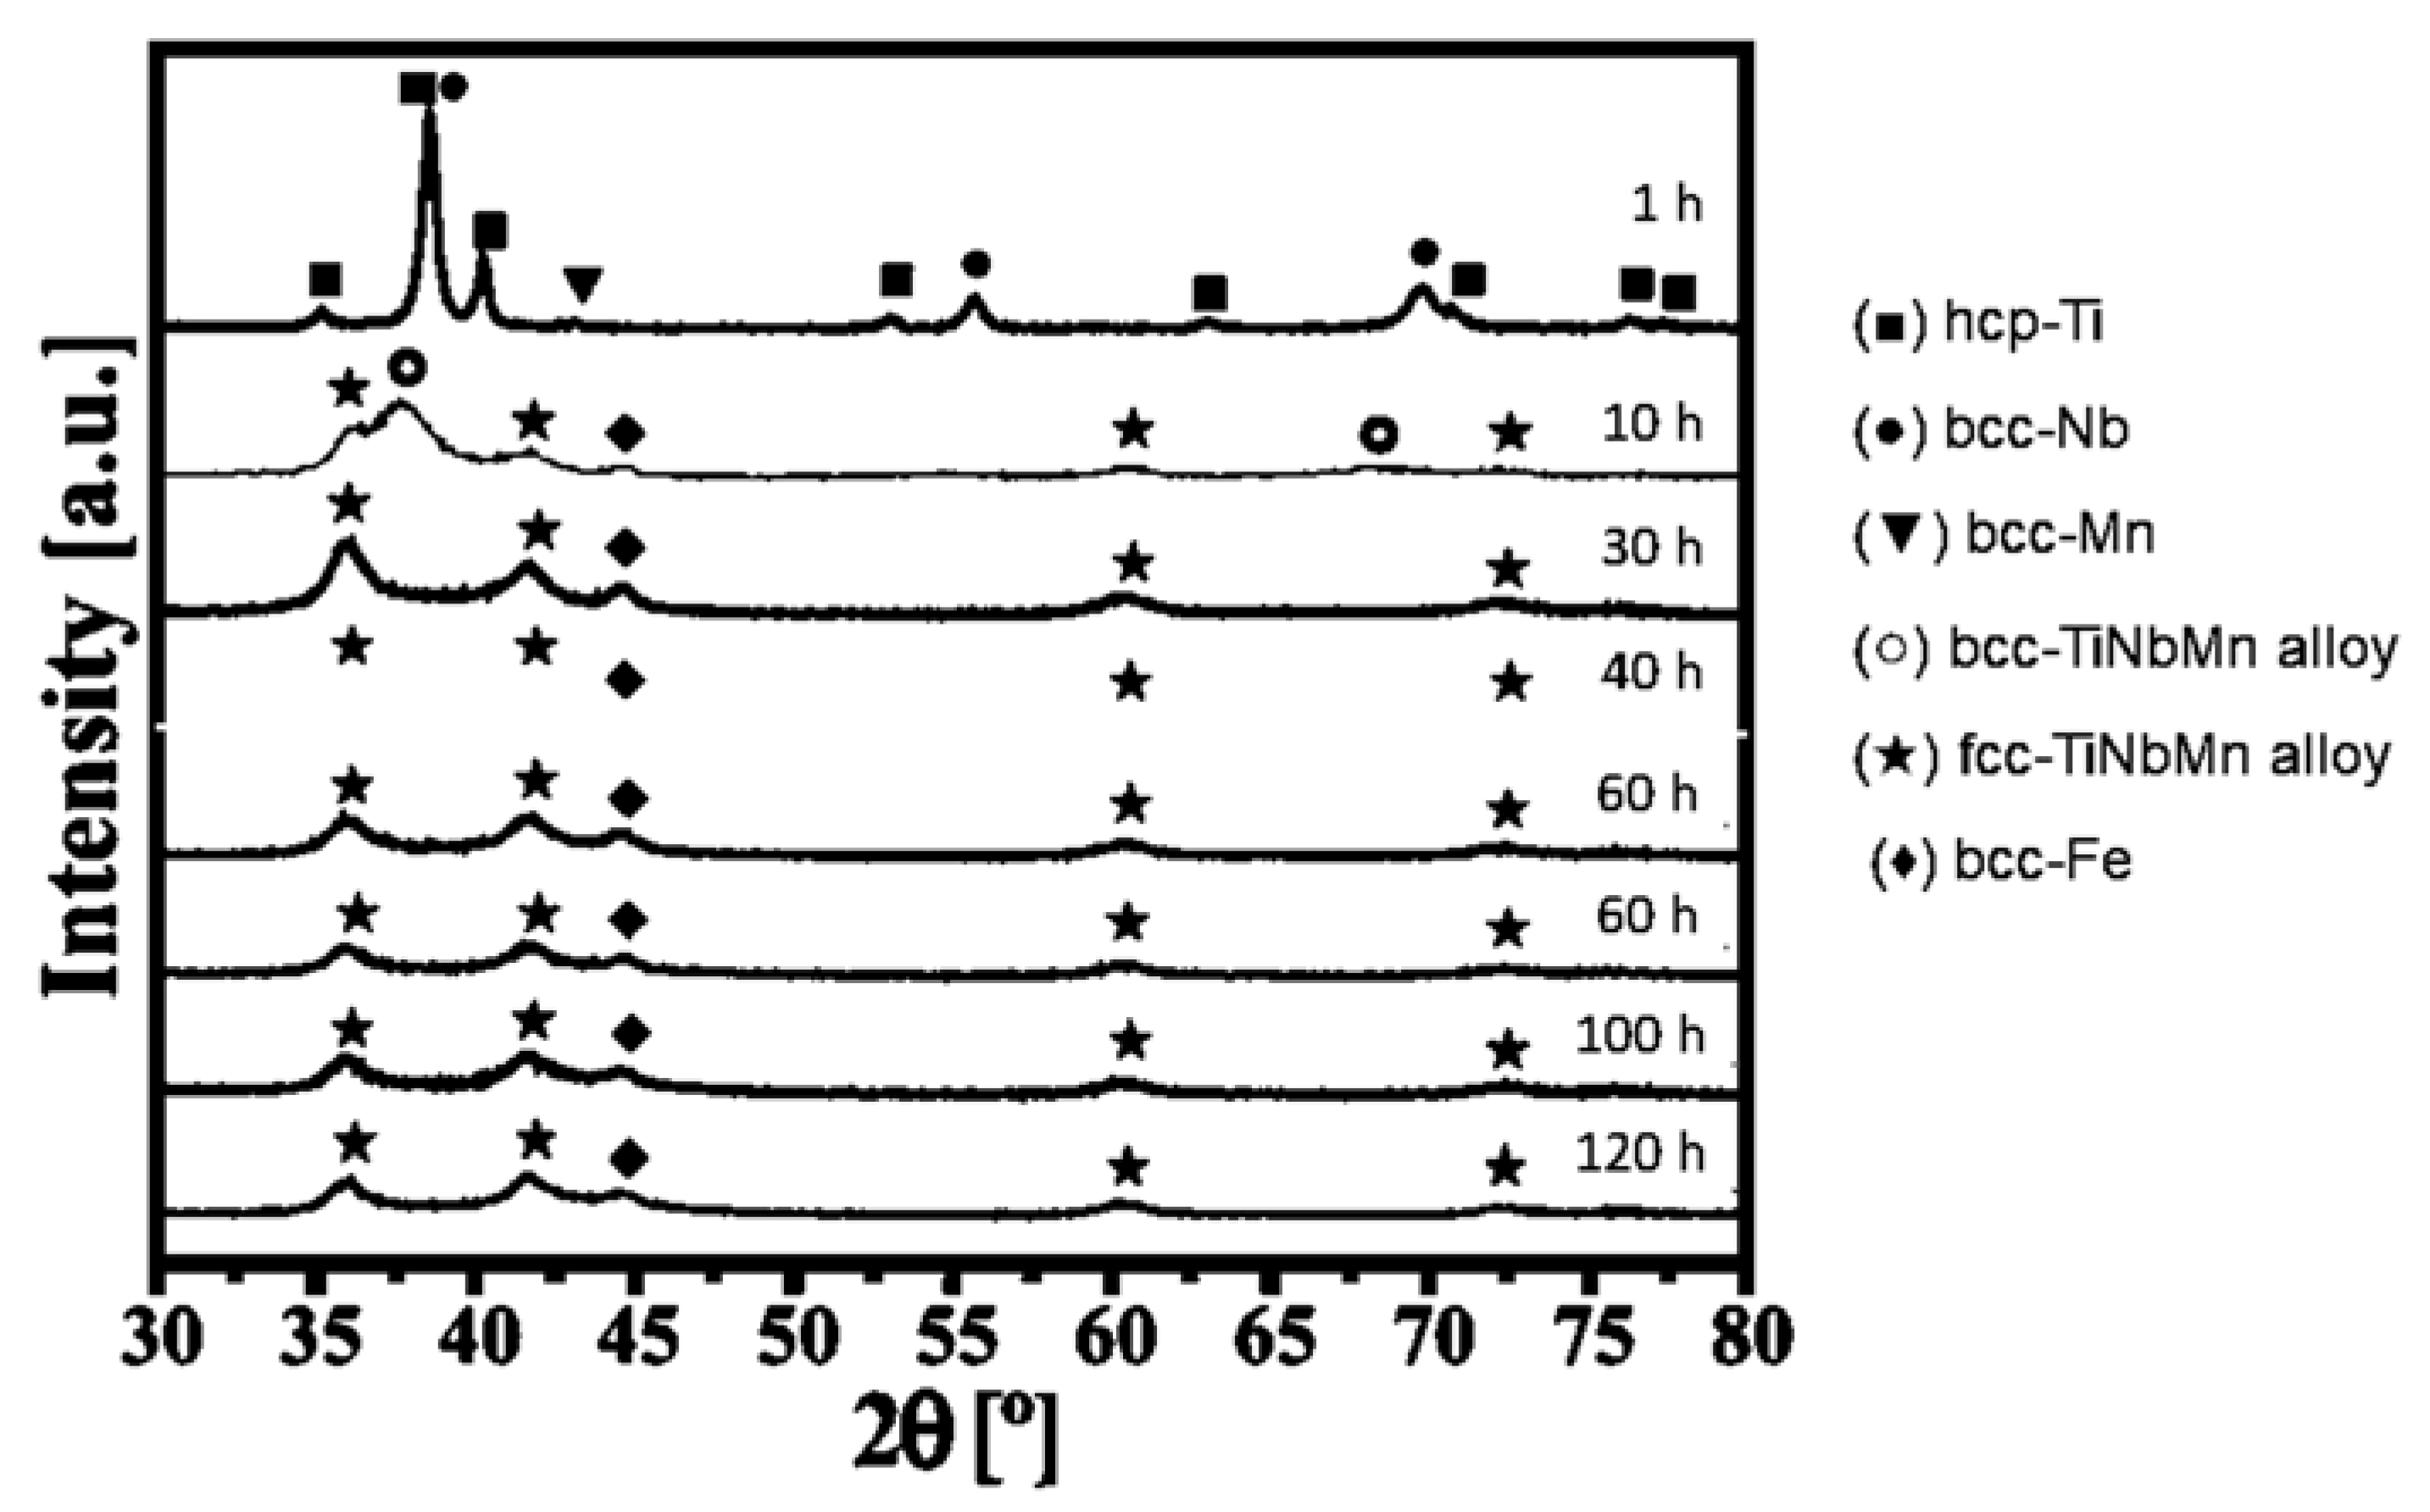
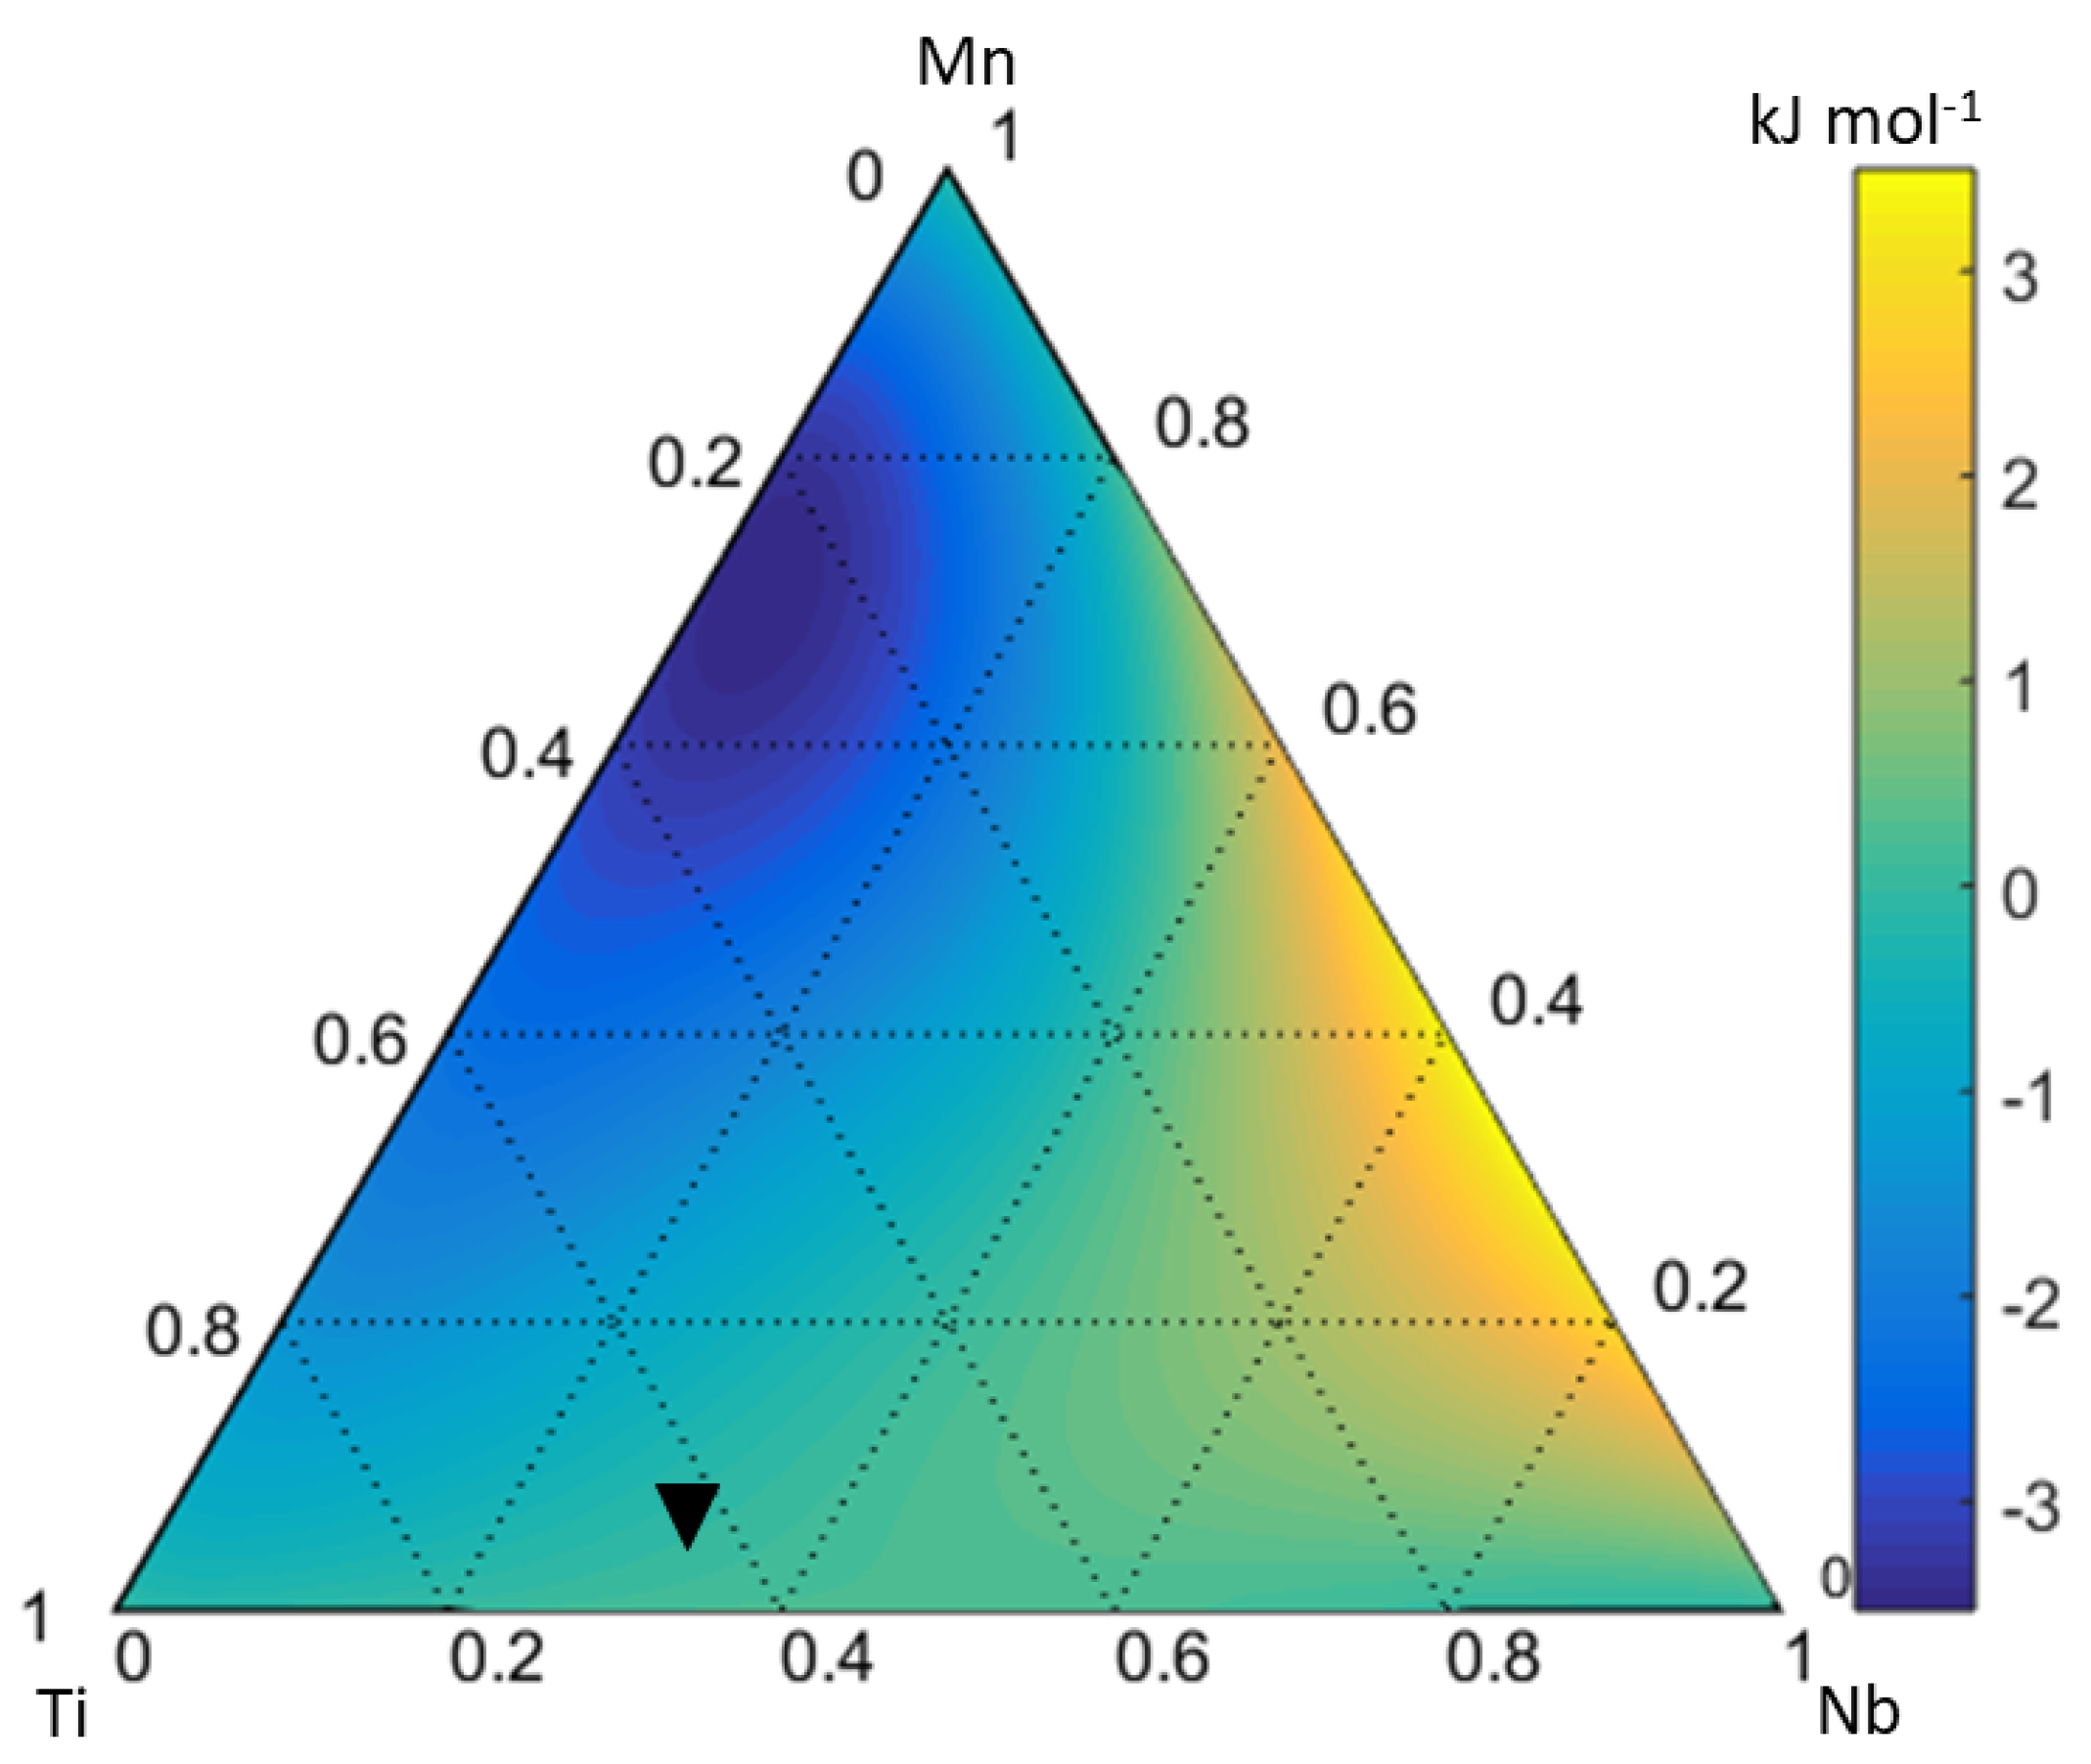
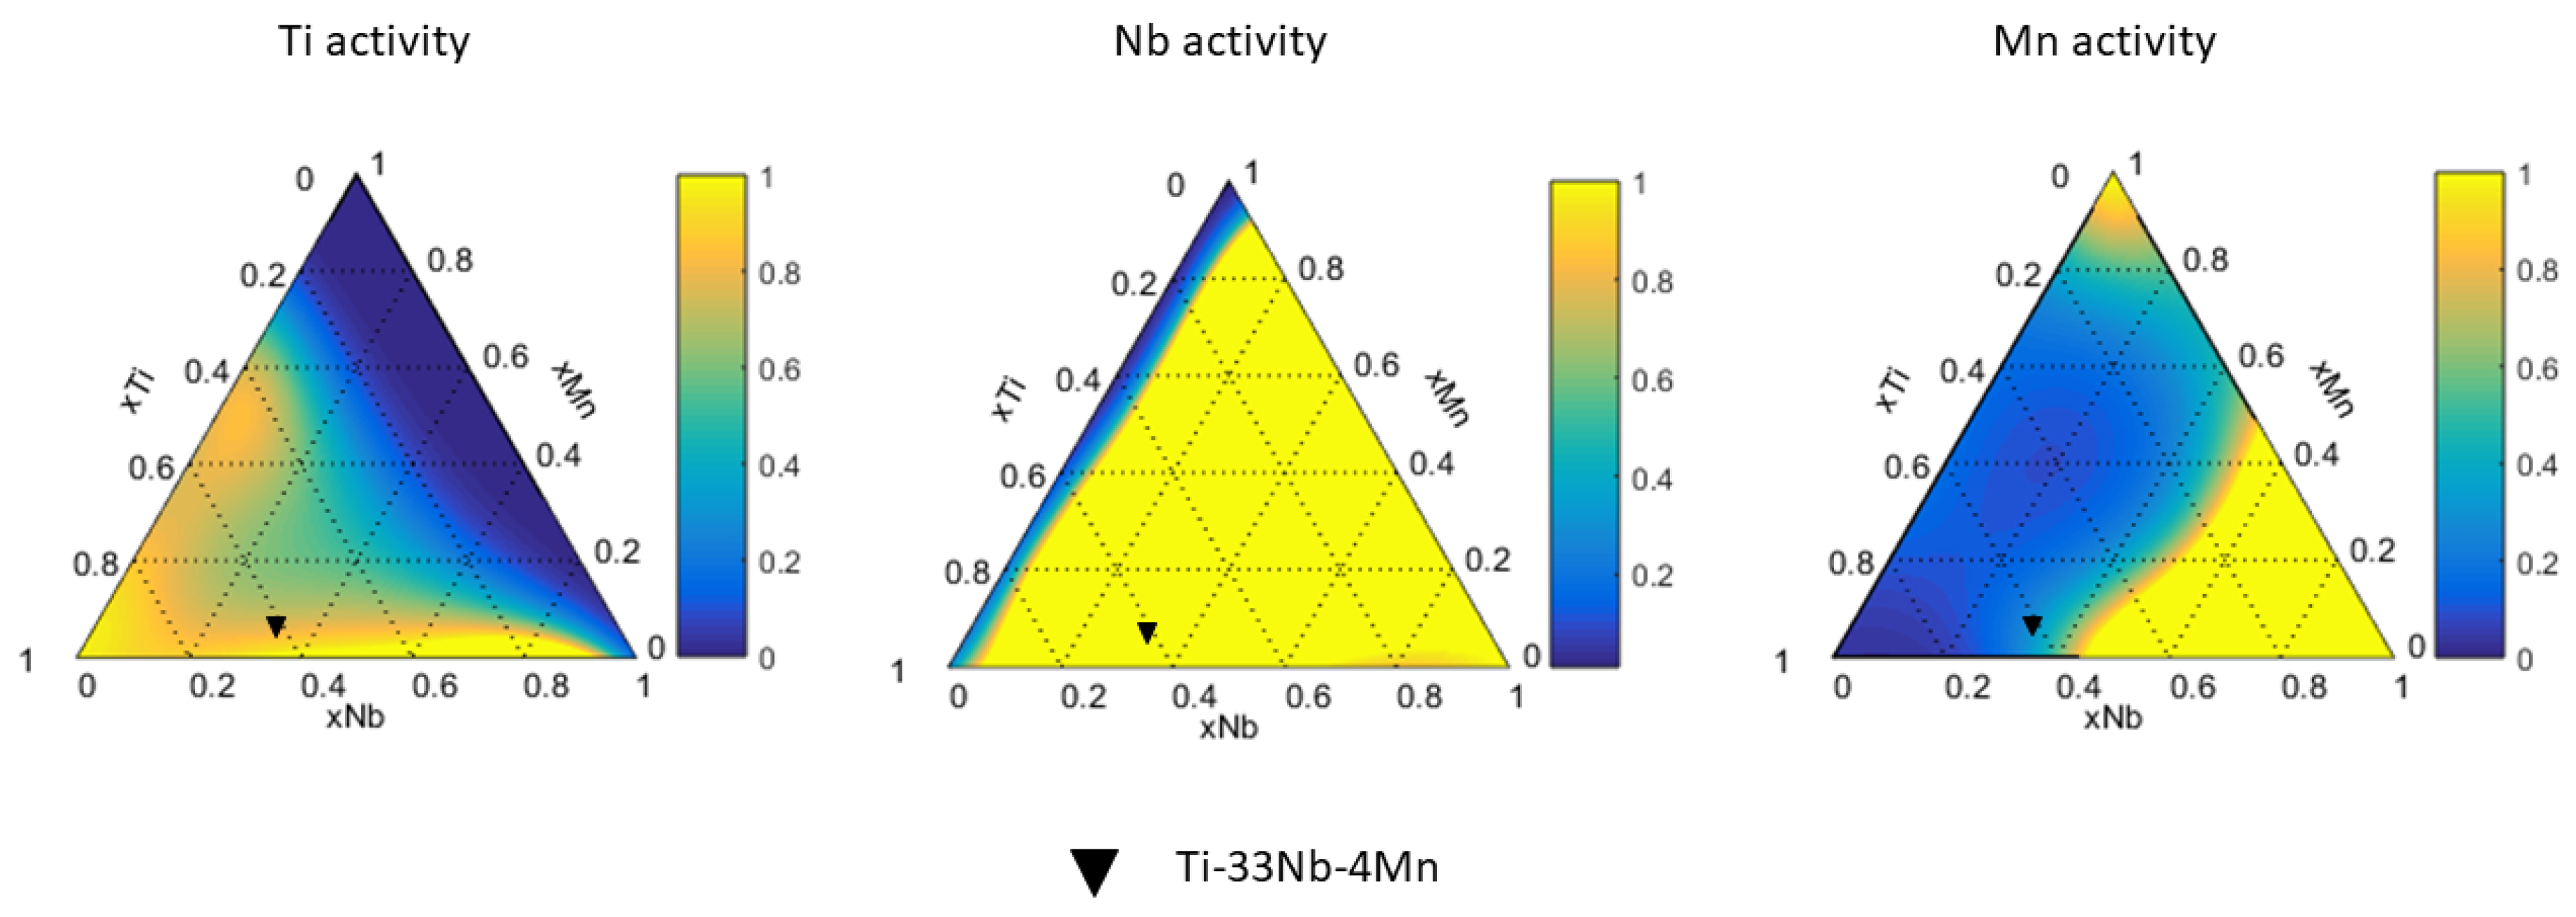
4.3. Ti-Nb-Mn System

Figure 9 shows the XRD pattern for the Ti-33Nb-4Mn alloy for milling times between 1 and 120 h. At 1 h, reflections of the elemental powders Ti, Nb and Mn can be observed. At 20 h, three phases are observed, namely γ-Ti, β-Ti and Fe with body-centred cubic structure (space group I m 3 ¯ m ). Fe is a contamination that came from the jar and milling media during the milling process. From 20 to 120 h, the phases present are γ-Ti and elemental Fe. This suggests that the γ-Ti is stable. When milling time increases, the reflections widen, shift and decrease their intensity due to severe plastic deformation produced during milling. Table 3 presents the crystallite size and microstrain determined by Rietveld refinement using the FullProf Suite software [58]. The models and parameters used were as follows: silicon powder (Standard Reference Material 640e, NIST) was used as standard; the background, lattice parameters, scale, shape of peaks (using a Thompson–Cox–Hastings pseudo-Voigt axial divergence asymmetry equation), atom positions, strain/size and zero displacements were the main refined parameters. The Rwp and GofF values of all refinements were less than 10% for the first and ~2 for the second, which confirms the quality of fitting. At 1 h, the γ-Ti phase did not form, but it began appearing from 10 h onward. The crystallite size decreased from 16.5 nm (at 10 h) to 4.8 nm (at 120 h) and the microstrain decreased from 11.1 × 10⁻³ (at 10 h) to 0.23 × 10⁻³ (at 80 h) and, then, increased to 2.13 × 10⁻³ (at 120 h). The crystallite sizes are within of nanocrystalline range and the microstrain values are characteristic of metals subjected to severe plastic deformation. Finally, the formation of the γ-Ti was analysed because it appeared in major quantity. Common characteristics to synthesize the γ phase are high deformation and nanocrystalline grain size [61].
Figure 10 shows the Gibbs free energy of mixing values diagram to form a solid solution for the Ti-Nb-Ta system at 298 K. The ∆Gm values are negative in the zone close to the Ti-Mn binary system and positive close to the Nb-rich corner. The more negative values are close to Mn-25%Ti, around −3.3 kJ mol−1 and the more positive values are ~3.3 kJ mol−1 in the composition of around Nb-30%Mn. The chemical affinity between Ti and Mn is greater than Ti-Nb and Nb-Mn. The ∆Gm values are higher than ∆Gm,id values in almost the entire composition range. There is a driving force to form a solid solution only in the zone close to the composition of Mn-25Ti-10Nb (at.%), because Gm < ∆Gm,id. In the composition of Ti-33Nb-4Mn (at.%), there is no driving force to form a solid solution. Figure 11 shows the activities of Ti, Nb and Mn in the solid solution in the whole composition range. The Ti activity (aTi) decreases towards the Nb-Mn binary system with values smaller than 0.1 for the composition when xTi < 0.2. For the composition of Ti-33Nb-4Mn, the aTi is ~0.7. The Nb activity (aNb) is equal to 1 in almost all the composition range but close to the Ti-Mn binary system it decreases to values smaller than 0.2 when xNb < 0.05. In the composition of the alloy, its value is aNb = 1. The Mn activity (aMn) is 1 in the Nb-rich and Mn-rich corners and decreases close to the Ti-rich corner to values smaller than 0.1. Additionally, aNb is ~0.5 in the composition of the studied alloy. Finally, the aTi, aNb and aMn values are higher than their respective molar fractions, showing that there is a driving force to form a solid solution from elemental powders, so external energy is required to promote the formation of a solid solution.
The evolution of total storage Gibbs free energy (GT) as a function of milling time for the Ti-33Nb-4Mn alloys is given in Figure 12. The ∆Gm value required to form a solid solution for a composition of Ti-33Nb-4Mn is ~1.0 kJ mol−1. The GT values increase from ~0.8 to ~8.4 kJ mol−1 for 1 and 120 h of milling, respectively. At 1 h, the GT < ∆Gm and the solid solution is not formed, which is in agreement with the analysed XRD pattern seen in Figure 9. For milling times higher than 10 h, the solid solution γ-Ti phase is formed, which is in agreement with the condition GT > ∆Gm.
Considering the results of the three analysed cases, thermodynamic properties such as Gibbs free energy of mixing, enthalpy and entropy of mixing and activities can be easily obtained using the MAAT software. Therefore, this software is a good tool for designing binary and ternary alloys. For multi-component or high entropy alloys, the data obtained from the MAAT software can be used to extrapolate thermodynamic properties and explore their metallurgical design. In particular for high entropy alloys, one parameter is required for their design, namely the enthalpy of mixing, which is calculated with Equation (17), where Ωij = 4ΔHij, ΔHij is the enthalpy of mixing for the equiatomic alloy of ith and jth elements based on Miedema’s model.
Δ H m i x = i = 1 , i j n Ω i j c i c j

5. Conclusions

There is agreement between XRD patterns and thermodynamic data related to the formation of solid solutions in the three ternary systems, Ti-Ta-Sn, Ti-Ta-Nb and Ti-Nb-Mn, studied here. The maximum stored Gibbs free energies for the three systems were ~11 kJ mol−1 at 60 h, ~6 kJ mol−1 at 70 h and ~8 kJ mol−1 at 120 h, respectively.
Mechanical alloying is a technique that can be used to increase the stored Gibbs free energy above the Gibbs free energy of mixing to form a solid solution. The energy increases due to the increase of crystalline defects, mainly dislocations and crystallite boundaries. The Gibbs free energy curves moved upwards, hence the solubility limit changed.
The contribution of the surface energy due to a decrease in the crystallite size is larger than the elastic strain energy due to the presence of dislocations on the Gibbs free energy and solid solubility change.
The MAAT software based on the Miedema and Bakker models gives thermodynamic results comparable with experimental data for the formation of a solid solution in Ti-based alloys. Considering that experimental thermodynamic measurements for ternary or quaternary systems exhibit high complexity due to the multi-component characteristic of those systems, the theoretical calculations are excellent tools for estimating thermodynamic properties.

Author Contributions

Conceptualization, C.A. and C.M.; methodology, C.A. and F.S.M.; software, C.A.; validation, I.A.; formal Analysis, C.A., C.M. and S.P.; investigation, C.A., F.S.M. and K.T.; writing—original draft preparation, C.A., S.P. and A.D.; writing—review and editing, S.P., A.D., K.T. and I.A.; visualisation, C.A. and I.A.; project administration, C.A.; funding acquisition, C.A. and K.T. All authors have read and agreed to the published version of the manuscript.

Funding

The authors would like to acknowledge the financial support received from the FONDECYT project n 1190797 and FONDEQUIP/EQM project n 140095.

Conflicts of Interest

The authors declare no conflict of interest.

References

  1. Peters, M.; Leyens, C. (Eds.) Titanium and Titanium Alloys; John Wiley & Sons: Hoboken, NJ, USA, 2003; ISBN 3527305343. [Google Scholar]
  2. Bhaskar, P.; Dasgupta, A.; Sarma, V.S.; Mudali, U.K.; Saroja, S. Mechanical properties and corrosion behaviour of nanocrystalline Ti-5Ta-1.8Nb alloy produced by cryo-rolling. Mater. Sci. Eng. A 2014, 616, 71–77. [Google Scholar] [CrossRef]
  3. Veiga, C.; Loureiro, A.J.R.; Davim, J.P. Proprties and applications of titanium alloys. Rev. Adv. Mater. Sci. 2012, 32, 133–148. [Google Scholar]
  4. Ning, Y.Q.; Xie, B.C.; Fu, M.W.; Liang, H.Q.; Yao, Z.K.; Guo, H.Z. Microstructure and superplastic deformation for aerospace Ti-alloys associated with α-phase curing behavior. Aerosp. Sci. Technol. 2015, 45, 416–421. [Google Scholar] [CrossRef]
  5. Sun, K.; Yi, X.; Sun, B.; Yin, X.; Meng, X.; Cai, W.; Zhao, L. Microstructure and mechanical properties of Ti–V–Al–Cu shape memory alloy by tailoring Cu content. Mater. Sci. Eng. A 2020, 771, 138641. [Google Scholar] [CrossRef]
  6. Zhang, Y.; Liu, Y.; Yu, L.; Liang, H.; Huang, Y.; Ma, Z. Microstructures and tensile properties of Ti2AlNb and Mo-modified Ti2AlNb alloys fabricated by hot isostatic pressing. Mater. Sci. Eng. A 2020, 776, 139043. [Google Scholar] [CrossRef]
  7. Antunes, R.A.; de Oliveiraa, M.C.L.; Salvador, C.A.F. Materials selection of optimized titanium alloys for aircraft applications. Mater. Res. 2018, 21, 2. [Google Scholar] [CrossRef] [Green Version]
  8. Donachie, M.J. Titanium: A Technical Guide, 2nd ed.; ASM International: Cleveland, OH, USA, 1988; ISBN 0871706865. [Google Scholar]
  9. Aguilar, C.; Guerra, C.; Lascano, S.; Guzman, D.; Rojas, P.A.; Thirumurugan, M.; Bejar, L.; Medina, A. Synthesis and characterization of Ti-Ta-Nb-Mn foams. Mater. Sci. Eng. C 2016, 58, 420–431. [Google Scholar] [CrossRef]
  10. Sidambe, A.T. Biocompatibility of advanced manufactured titanium implants-A review. Materials 2014, 7, 8168–8188. [Google Scholar] [CrossRef] [Green Version]
  11. Boyce, B.F.; Elder, H.Y.; Elliot, H.L.; Fogelman, I.; Fell, G.S.; Junor, B.J.; Beastall, G.; Boyle, I.T. Hypercalcaemic osteomalacia due to aluminium toxicity. Lancet 1982, 320, 1009–1013. [Google Scholar] [CrossRef]
  12. Khadija, G.; Saleem, A.; Akhtar, Z.; Naqvi, Z.; Gull, M.; Masood, M.; Mukhtar, S.; Batool, M.; Saleem, N.; Rasheed, T.; et al. Short term exposure to titanium, aluminum and vanadium (Ti-6Al-4V) alloy powder drastically affects behavior and antioxidant metabolites in vital organs of male albino mice. Toxicol. Rep. 2018, 5, 765–770. [Google Scholar] [CrossRef]
  13. Kawahara, M.; Kato-Negishi, M. Link between aluminum and the pathogenesis of Alzheimer’s disease: The integration of the aluminum and amyloid cascade hypotheses. Int. J. Alzheimers. Dis. 2011, 2011, 1–17. [Google Scholar] [CrossRef] [PubMed] [Green Version]
  14. Li, Y.; Xiong, J.; Wong, C.S.; Hodgson, P.D.; Wen, C. Ti6Ta4Sn alloy and subsequent scaffolding for bone tissue engineering. Tissue Eng. Part A 2009, 15, 3151–3159. [Google Scholar] [CrossRef] [PubMed] [Green Version]
  15. Okazaki, Y. A new Ti-15Zr-4Nb-4Ta alloy for medical applications. Curr. Opin. Solid State Mater. Sci. 2001, 5, 45–53. [Google Scholar] [CrossRef]
  16. Tan, M.H.C.; Baghi, A.D.; Ghomashchi, R.; Xiao, W.; Oskouei, R.H. Effect of niobium content on the microstructure and Young’s modulus of Ti-xNb-7Zr alloys for medical implants. J. Mech. Behav. Biomed. Mater. 2019, 99, 78–85. [Google Scholar] [CrossRef] [PubMed]
  17. Singh, R.; Lee, P.D.; Dashwood, R.J.; Lindley, T.C. Titanium foams for biomedical applications: A review. Mater. Technol. 2010, 25, 127–136. [Google Scholar] [CrossRef]
  18. Chandrasekaran, M.; Xia, Z.S. Effect of alloying time and composition on the mechanical properties of Ti alloy. Mater. Sci. Eng. A 2005, 394, 220–228. [Google Scholar] [CrossRef]
  19. Niinomi, M.; Nakai, M.; Hieda, J. Development of new metallic alloys for biomedical applications. Acta Biomater. 2012, 8, 3888–3903. [Google Scholar] [CrossRef]
  20. Biesiekierski, A.; Wang, J.; Gepreel, M.A.; Wen, C. A new look at biomedical Ti-based shape memory alloys. Acta Biomater. 2012, 8, 1661–1669. [Google Scholar] [CrossRef]
  21. Yu, Q.; Kacher, J.; Gammer, C.; Traylor, R.; Samanta, A.; Yang, Z.; Minor, A.M. In situ TEM observation of FCC Ti formation at elevated temperatures. Scr. Mater. 2017, 140, 9–12. [Google Scholar] [CrossRef] [Green Version]
  22. Heerden, D.V.A.N.; Josell, D.; Shecthman, D. The formation of f.c.c. titanium in titanium-aluminum multilayers. Acta Metall. 1996, 44, 297–306. [Google Scholar] [CrossRef]
  23. Prasanthi, T.N.; Sudha, C.; Ravikirana; Saroja, S. Formation and reversion of metastable fcc phase in a Ti-5Ta-2Nb explosive clad. Mater. Charact. 2016, 116, 24–32. [Google Scholar] [CrossRef]
  24. Zhang, D.L.; Ying, D.Y. Formation of fcc titanium during heating high-energy, ball-milled Al-Ti powders. Mater. Lett. 2001, 50, 149–153. [Google Scholar] [CrossRef]
  25. Ahuja, R.; Fraser, H.L. Structure and mechanical properties of nanolaminated Ti-Al thin films. JOM 1994, 46, 35–39. [Google Scholar] [CrossRef]
  26. Ren, J.; Sun, Q.; Xiao, L.; Ding, X.; Sun, J. Size-dependent of compression yield strength and deformation mechanism in titanium single-crystal nanopillars orientated [0001] and [1120]. Mater. Sci. Eng. A 2014, 615, 22–28. [Google Scholar] [CrossRef]
  27. Lindemann, I.; Schmidt, R.; Pilz, S.; Gebel, B.; Teresiak, A.; Gebert, A. Ultrafine-grained Ti-40Nb prepared by reactive milling of the elements in hydrogen. J. Alloys Compd. 2017, 729, 1244–1249. [Google Scholar] [CrossRef]
  28. Suryanarayana, C. Nanocrystalline materials. Int. Mater. Rev. 1995, 40, 41–64. [Google Scholar] [CrossRef]
  29. Suryanarayana, C. Mechanical alloying and milling. Prog. Mater. Sci. 2001, 46, 1–184. [Google Scholar] [CrossRef]
  30. Dercz, G.; Matuła, I.; Zubko, M.; Kazek-Kęsik, A.; Maszybrocka, J.; Simka, W.; Dercz, J.; Świec, P.; Jendrzejewska, I. Synthesis of porous Ti–50Ta alloy by powder metallurgy. Mater. Charact. 2018, 142, 124–136. [Google Scholar] [CrossRef]
  31. García-Garrido, C.; Gutiérrez-González, C.; Torrecillas, R.; Pérez-Pozo, L.; Salvo, C.; Chicardi, E. Manufacturing optimisation of an original nanostructured (beta + gamma)-TiNbTa material. J. Mater. Res. Technol. 2019, 8, 2573–2585. [Google Scholar] [CrossRef]
  32. Chicardi, E.; Gutiérrez-gonzález, C.F.; Sayagués, M.J.; García-garrido, C. Development of a novel TiNbTa material potentially suitable for bone replacement implants. Mater. Des. 2018, 145, 88–96. [Google Scholar] [CrossRef]
  33. Aguilar, C.; Guzman, P.; Lascano, S.; Parra, C.; Bejar, L.; Medina, A.; Guzman, D. Solid solution and amorphous phase in Ti–Nb–Ta–Mn systems synthesized by mechanical alloying. J. Alloys Compd. 2016, 670, 346–355. [Google Scholar] [CrossRef]
  34. Salvo, C.; Aguilar, C.; Cardoso-Gil, R.; Medina, A.; Bejar, L.; Mangalaraja, R.V. Study on the microstructural evolution of Ti-Nb based alloy obtained by high-energy ball milling. J. Alloys Compd. 2017, 720, 254–263. [Google Scholar] [CrossRef]
  35. Chicardi, E.; García-Garrido, C.; Sayagués, M.J.; Torres, Y.; Amigó, V.; Aguilar, C. Development of a novel fcc structure for an amorphous-nanocrystalline Ti-33Nb-4Mn (at.%) ternary alloy. Mater. Charact. 2018, 135, 46–56. [Google Scholar] [CrossRef]
  36. Zhang, R.F.; Zhang, S.H.; He, Z.J.; Jing, J.; Sheng, S.H. Miedema Calculator: A thermodynamic platform for predicting formation enthalpies of alloys within framework of Miedema’s Theory. Comput. Phys. Commun. 2016, 209, 58–69. [Google Scholar] [CrossRef]
  37. Bakker, H. Miedema’s semi-empirical model. In Enthalpies in Alloys; Trans Tech Publications Ltd.: Zurich, The Switzerland, 1998. [Google Scholar]
  38. Miedema, A.R.; Chatel, P.F.; Boer, F.R. Cohesion in alloys-Fundamentals of a semi-empirical model. Phys. B Condens. Matter 1980, 100, 1–28. [Google Scholar] [CrossRef]
  39. Bakker, H.; Modder, I.W.; Kuin, M.J. Extension of Miedema’s semiempirical model to estimates of the formation enthalpies of point defects in intermetallic compounds with the B2 structure. Intermetallics 1997, 5, 535–546. [Google Scholar] [CrossRef]
  40. Miracle, D.B.; Senkov, O.N. A critical review of high entropy alloys and related concepts. Acta Mater. 2017, 122, 448–511. [Google Scholar] [CrossRef] [Green Version]
  41. Joo, S.H.; Bae, J.W.; Park, W.Y.; Shimada, Y.; Wada, T.; Kim, H.S.; Takeuchi, A.; Konno, T.J.; Kato, H.; Okulov, I.V. Beating Thermal Coarsening in Nanoporous Materials via High-Entropy Design. Adv. Mater. 2020, 32, 1–9. [Google Scholar] [CrossRef]
  42. Ray, P.K.; Akinc, M.; Kramer, M.J. Estimation of formation enthalpies using an extended Miedema approach. In Proceedings of the 22nd Annual Conference on Fossil Energy Materials, Pittsburghm, PA, USA, 8–10 July 2008. [Google Scholar]
  43. Physica, E. Extended Miedema model: Predicting the formation enthalpies of intermetallic phases with more than two elements. Physica B 1996, 228, 289–294. [Google Scholar]
  44. Wang, W.C.; Li, J.H.; Yan, H.F.; Liu, B.X. A thermodynamic model proposed for calculating the standard formation enthalpies of ternary alloy systems. Scr. Mater. 2007, 56, 975–978. [Google Scholar] [CrossRef]
  45. Bakker, H.; Zhou, G.F.; Yang, H. Mechanically driven disorder and phase transformations in alloys. Prog. Mater. Sci. 1995, 39, 159–241. [Google Scholar] [CrossRef] [Green Version]
  46. Lei, Z.; Hongmei, C.; Yifang, O.; Yong, D.U. Amorphous forming ranges of Al-Fe-Nd-Zr system predicted by Miedema and geometrical models. J. Rare Earths 2014, 32, 343–351. [Google Scholar] [CrossRef]
  47. Rafiei, M.; Enayati, M.H.; Karimzadeh, F. Thermodynamic analysis of solid solution formation in the nanocrystalline Fe-Ti-Al ternary system during mechanical alloying. J. Chem. Thermodyn. 2013, 59, 243–249. [Google Scholar] [CrossRef]
  48. Hillert, M. Empirical methods of predicting and representing thermodynamic properties of ternary solution phases. Calphad 1980, 4, 1–12. [Google Scholar] [CrossRef]
  49. Toop, G. Predicting ternary activities using binary data. Mater. Sci. 1965, 233, 850–854. [Google Scholar]
  50. Aguilar, C.; de Martinez, V.P.; Palacios, J.M.; Ordoñez, S.; Pavez, O. A thermodynamic approach to energy storage on mechanical alloying of the Cu-Cr system. Scr. Mater. 2007, 57, 213–216. [Google Scholar] [CrossRef]
  51. Dercz, G.; Matuła, I.; Zubko, M. Structure and Mechanical Properties of the New Ti30Ta20Nb Biomedical Alloy. J. Nanosci. Nanotechnol. 2019, 19, 2556–2566. [Google Scholar] [CrossRef]
  52. Aguilar, C.; Guzmán, D.; Castro, F.; Martínez, V.; De Las Cuevas, F.; Lascano, S.; Muthiah, T. Fabrication of nanocrystalline alloys Cu-Cr-Mo super satured solid solution by mechanical alloying. Mater. Chem. Phys. 2014, 146, 493–502. [Google Scholar] [CrossRef]
  53. Lutterotti, L.; Matthies, S.; Wenk, H.R. MAUD: A friendly Java program for material analysis using diffraction. Newsl. CDP 1999, 21, 14–15. [Google Scholar]
  54. Lutterotti, L.; Gialanella, S. X-ray diffraction characterization of heavily deformed metallic specimens. Acta Mater. 1998, 46, 101–110. [Google Scholar] [CrossRef]
  55. Mccusker, L.B.; Von Dreele, R.B.; Cox, D.E.; Loue, D.; Scardi, P. Rietveld refinement guidelines. J. Appl. Phys. 1999, 32, 36–50. [Google Scholar] [CrossRef] [Green Version]
  56. Guzmán, D.; Ordoñez, S.; Serafini, D.; Rojas, P.A.; Aguilar, C.; Santander, M. Thermal stability of amorphous Mg50Ni50 alloy produced by mechanical alloying. J. Non-Cryst. Solids 2010, 356, 120–123. [Google Scholar]
  57. Aguilar, C.; Marín, J.; Ordóñez, S.; Celentano, D.; Castro, F.; Martínez, V. Estudio estructural de polvos Cu-Cr aleados mecánicamente. Rev. Metal 2006, 42, 334–344. [Google Scholar]
  58. Rodriguez-Carvajal, J. Recent developments of the program FULLPROF, commission on powder diffraction. IUCr Newsl. 2001, 26, 12–19. [Google Scholar]
  59. Williamson, G.; Hall, W. X-ray line broadening from filed aluminium and wolfram. Acta Metall. 1953, 1, 22–31. [Google Scholar] [CrossRef]
  60. Snyder, R.L.; Bunge, H.J.; Fiala, J. Defect and Microstucture Analysis by Diffraction, 1st ed.; Oxford Science Publications: Oxford, UK, 1999. [Google Scholar]
  61. Aguilar, C.; Pio, E.; Medina, A.; Bejar, L.; Guzmán, D. Structural study of novel nanocrystalline fcc Ti-Ta-Sn alloy. Metall. Mater. Trans. A 2019, 50, 2061–2065. [Google Scholar] [CrossRef]
Figure 1. Evolution of XRD pattern as a function of milling time for Ti-13Ta-3Sn (at.%).
Metals 10 00510 g001
Figure 2. (a) Ternary diagram of Gibbs free energy of mixing and (b) ideal Gibbs free energy of mixing, for the Ti-Ta-Sn system at 298 K.
Metals 10 00510 g002
Figure 3. Activity changes as a function of composition for the formation of a solid solution in the Ti-Nb-Sn ternary systems at 298 K.
Metals 10 00510 g003
Figure 4. Evolution of Gibbs free energy as a function of milling time for the Ti-13Ta-3Sn alloy.
Metals 10 00510 g004
Figure 5. XRD patterns of (a) the Ti-30Nb-13Ta [32] alloy milled at 60 h and (b) the Ti-20Nb-30Ta alloy milled at different milling times adapted from [51].
Metals 10 00510 g005
Figure 6. Ternary diagram of Gibbs free energy for the Ti-Nb-Ta system at 298 K.
Metals 10 00510 g006
Figure 7. Activity changes as a function of composition for the formation of a solid solution in the Ti-Nb-Ta ternary systems at 298 K.
Metals 10 00510 g007
Figure 8. Evolution of Gibbs free energy as a function of milling time for the Ti-30Nb-13Ta alloy and the Ti-20Nb-30Ta alloy.
Metals 10 00510 g008
Figure 9. Evolution of XRD pattern as a function of milling time for Ti-33Nb-4Mn (at.%) [35].
Metals 10 00510 g009
Figure 10. Ternary diagram of Gibbs free energy for the Ti-Nb-Mn system at 298 K.
Metals 10 00510 g010
Figure 11. Activity changes as a function of composition for the formation of a solid solution in the Ti-Nb-Mn ternary systems at 298 K.
Metals 10 00510 g011
Figure 12. Evolution of Gibb free energy storage as a function of milling time for the Ti-33Nb-4Mn alloy.
Metals 10 00510 g012
Table 1. Microstructural parameter as a function of milling time for Ti-13Ta-3Sn (at.%).
β-Ti Solid Solution
Milling Time, hD, nm2>1/2 × 10−3
520.142.96
157.350.46
504.080.83
1009.491.77
Table 2. Microstructural parameters as a function of milling time for the Ti-30Nb-13Ta alloy [32] and the Ti-20Nb-30Ta alloy adapted from [51].
Ti-30Nb-13Ta
β-phase
Milling time, hD, nm<ε2>1/2 × 10−3
607.0N.I.
Ti-20Nb-30Ta
β−phase
Milling time, hD, nm<ε2>1/2 × 10−3
5910.11
20480.23
30270.28
7080.64
Table 3. Microstructural parameters as a function of milling time for the Ti-33Nb-4Mn alloy [35].
Ti-33Nb-4Mn
γ Phase
Milling Time, hD, nm<ε2>1/2 × 10−3
1544.55
103011.15
206.66.64
406.32.38
605.90.41
805.70.23
1005.40.85
1204.82.13

