Article

An Investigation on Wear Behavior of ER8 and SSW-Q3R Wheel Steel under Pure Rolling Condition

1
Maanshan Iron & Steel Co., Ltd., Maanshan 243000, China
2
Dalian Jiaotong University, Dalian 116028, China
3
National-Local Joint Engineering Research Center of Key Parts of Rail Transit Manufacturing Technology, Maanshan 243000, China
4
Masteel Track Traffic Equipment Co., Ltd., Maanshan 243000, China
*
Author to whom correspondence should be addressed.
Metals 2020, 10(4), 513; https://doi.org/10.3390/met10040513
Submission received: 23 March 2020 / Revised: 9 April 2020 / Accepted: 14 April 2020 / Published: 15 April 2020

Abstract

:
In this paper, the wear property of ER8 and SSW-Q3R wheel steel under pure rolling condition was studied by GMP-30 wear tester. The results showed that the wear loss of the ER8 wheel steel was higher than that of the SSW-Q3R wheel steel at the same cycles. The high carbon content of the SSW-Q3R improved the surface hardness during rolling wear. The high hardness increased the wear resistance of the SSW-Q3R wheel steel. During rolling wear, the fatigue wear resistance of ER8 wheel was worse than that of the SSW-Q3R wheel steel due to more proeutectoid ferrite content in ER8 wheel steel. The surface residual stress of ER8 and SSW-Q3R wheel steel increased with the increase in cycles. The axial residual compressive stress on the surface of the sample was greater than the circumferential residual compressive stress. The residual stress at the trough was higher than that at the crest.

1. Introduction

In recent years, the wear failure of wheel and rail materials gradually becomes more severe with the increase in rolling speed and axle load. The corrugation of rail material and polygonation of wheel steel [1,2], partial wear of wheel steel, and wheel tread scraped [3] are the main reasons that cause wear failure. The wear failure of wheel and rail materials is a complex process, and many factors will influence the wear behavior of wheel and rail materials. The slip ratio can increase the shear stress at the contact surface of the wheel and rail materials, leading to the formation of severe plastic deformation and the change of wear mechanism. With the increase in the slip ratio, the thickness of the plastic deformation layer is gradually increased [4,5,6]. Under the dry wear condition, the wear mechanism of the wheel and rail materials transform adhesive wear into fatigue wear as the increase of slip ratio. During the fatigue wear process, the surface of wheel and rail materials forms shallow fatigue wear cracks. As the rolling speed increases, the surface hardness and the thickness of the plastic deformation is reduced. The wear loss of the wheel steel is increased, but the wear loss of the rail steel is gradually decreased [7]. The thickness of plastic deformation is increased with the increase of axle load [8]. Different original microstructure also can influence the wear property of wheel and rail materials such as pearlite, bainite, and martensite [9,10,11]. The results by Zeng et al. [12] indicate that the wear resistance of wheel and rail materials is improved as the carbon content increases. Furthermore, the wear resistance of lamellar pearlite steel is better than that of spherical pearlite steel [13]. The alloy element also has an influence on the wear property of the wheel steel [14].
In this paper, the GPM-30 wear tester was used to study the wear property of SSW-Q3R wheel steel and ER8 wheel steel at different cycles. The evolution of surface microstructure and the change of wear mechanism of two kinds of wheel steel were compared.

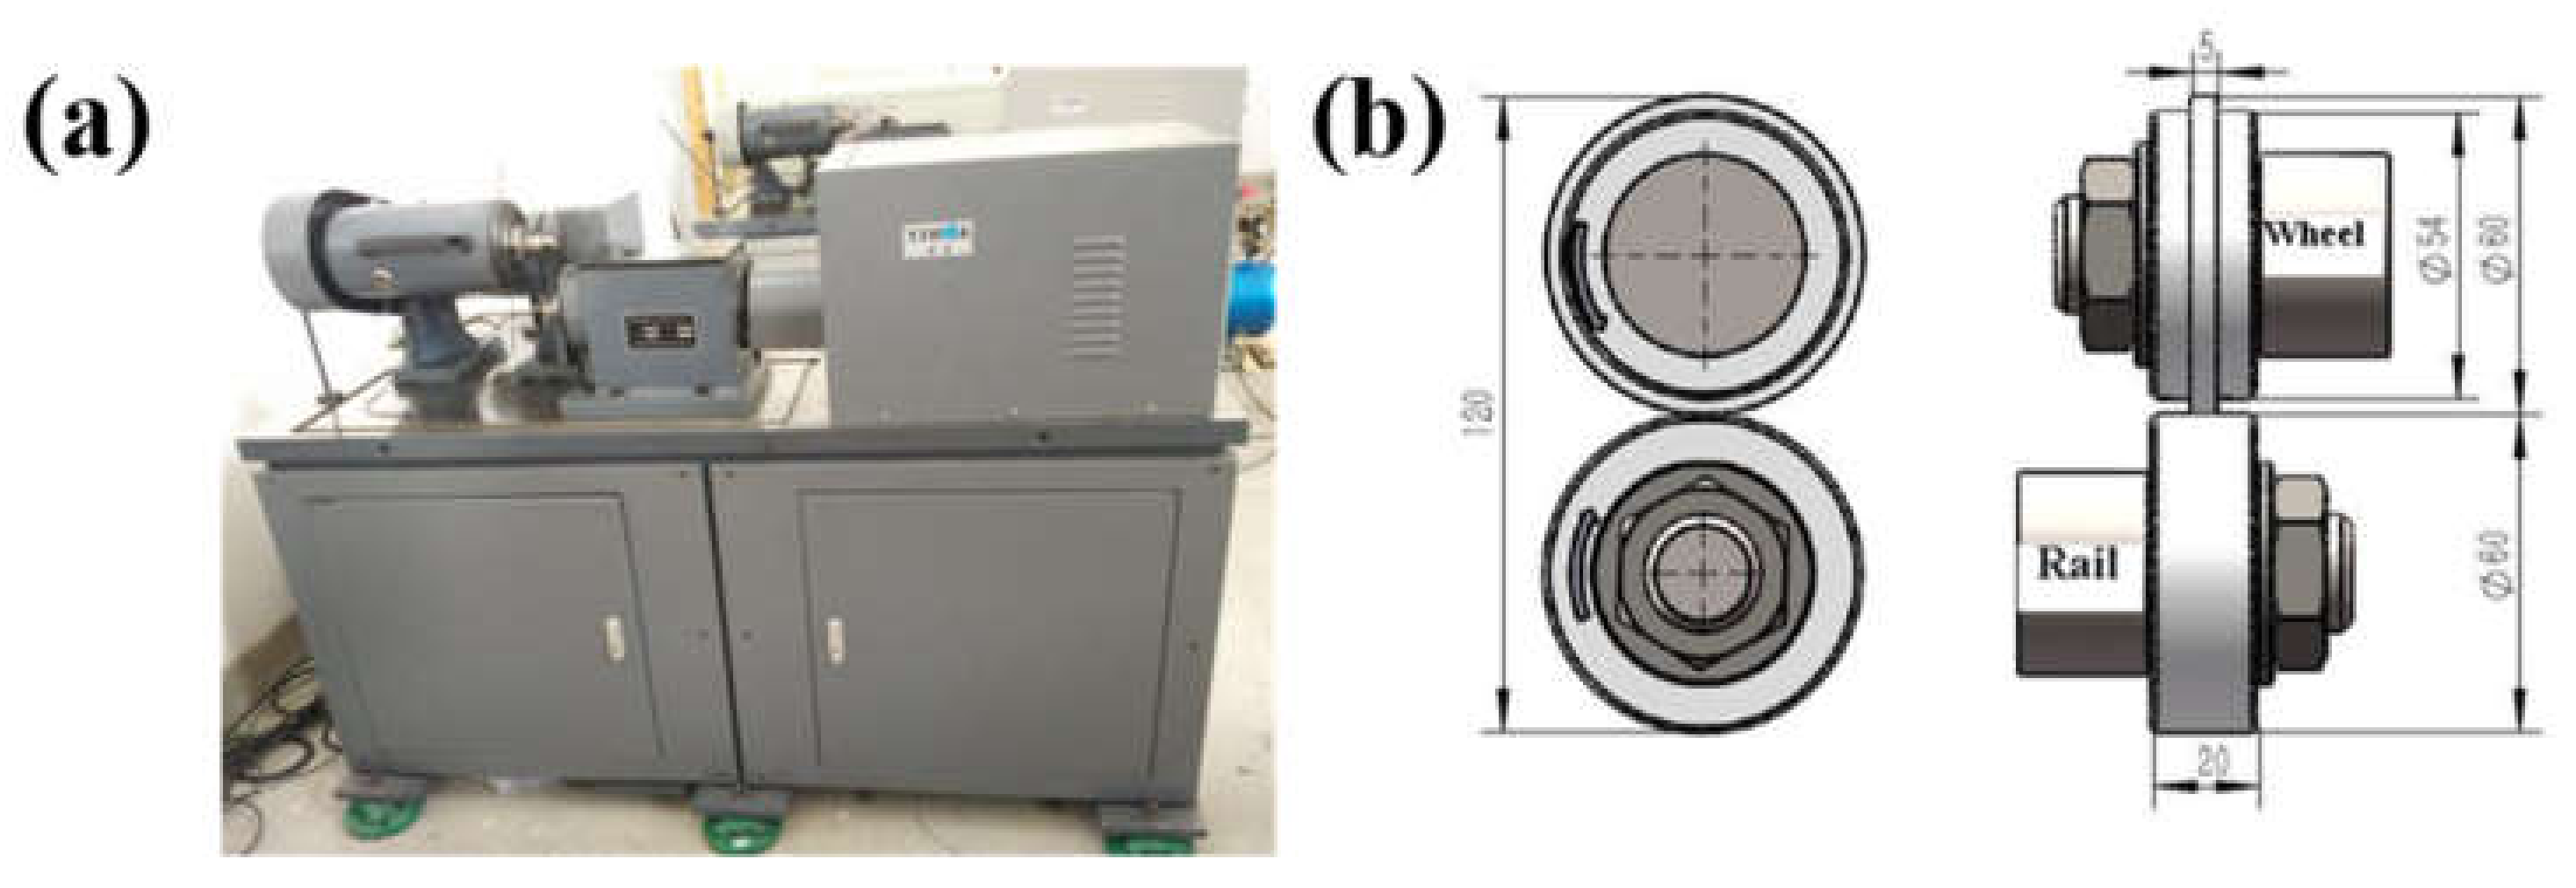
2. Material and Methods

In this work, the wheel samples were ER8 and SSW-Q3R wheel steel, respectively. The chemical component of the wheel samples are shown in Table 1. The rail samples were U71Mn rail steel. Figure 1 shows the original microstructure of the wheel samples. The original microstructure of the ER8 wheel steel samples was pearlite + proeutectoid ferrite (P + F), as shown in Figure 1a. The SSW-Q3R wheel steel consisted of pearlite and a small amount of proeutectoid ferrite, as displayed in Figure 1b. The original hardness of ER8 and SSW-Q3R wheel were 290 HV and 330 HV, respectively. The original hardness of the U71Mn rail sample was about 350 HV.
The wear tests were carried out by using a GPM-30 wear machine (Yihua, Jinan, China), as shown in Figure 2a. The sample dimensions and contact mode of the wheel/rail samples are shown in Figure 2b. After the final grinding, the surface roughness value (Ra) of the samples was less than 0.4 μm. The wear tests were to simulate the operation of trains under dry friction condition. In the wear test, the contact stress was 1140 MPa to simulate the 17 t axle load of trains, according to Hertz contact theory [15].
P 0 = 0.418 F E L 1 R w + 1 R r
where P0 is the contact stress; F is the applying load; E is the modulus of elasticity of steel; L is the contact length; Rw and Rr are the radii of the wheel and rail sample, respectively. The rolling speed was 1440 r/min to simulate the operation speed of 250 km/h. When the trains run in a straight line, the operation condition of the wheel and rail materials is pure rolling. The wear cycle was 1 × 10⁵, 4 × 10⁵ and 7 × 10⁵. Three repeated wear tests were carried out at each pre-wear cycle. After the test, the surface macroscopic morphology was analyzed using a Universal Serial Bus microscope (Mustcam, Shenzhen, China). The surface microstructure was analyzed using a Zeiss Supra 55 field-emission scanning electron microscope (SEM) (Carl Zeiss, Jena, Germany) with electron backscatter diffraction (EBSD) (Carl Zeiss, Jena, Germany) and a Leica DMi8 optical microscope(Leica Microsystems, Heidelberg, Germany). The surface hardness was measured using a FM-700 hardness tester (Future-Tech Corporation, Kawasaki, Japan) with a loading of 2.45 N and dwell time of 15 s. The axial and circumferential residual stress tests of the fatigue specimens under different rotation cycles were carried out with an iXRD x-ray residual stress tester. The type of tube ball was Cr-Ka, the test voltage was 20 kV, the operating current was 4 mA, and the diffraction angle was 156.4°. The angle meter was used for accurate measurement during the test process. The exposure time was 1.5 s, the spot size was 2 mm, the diffraction plane was (211), the scanning range of the Bragg angle (2θ) was 120°~170°, and the peak positioning method was Gaussian.

3. Results and Discussion

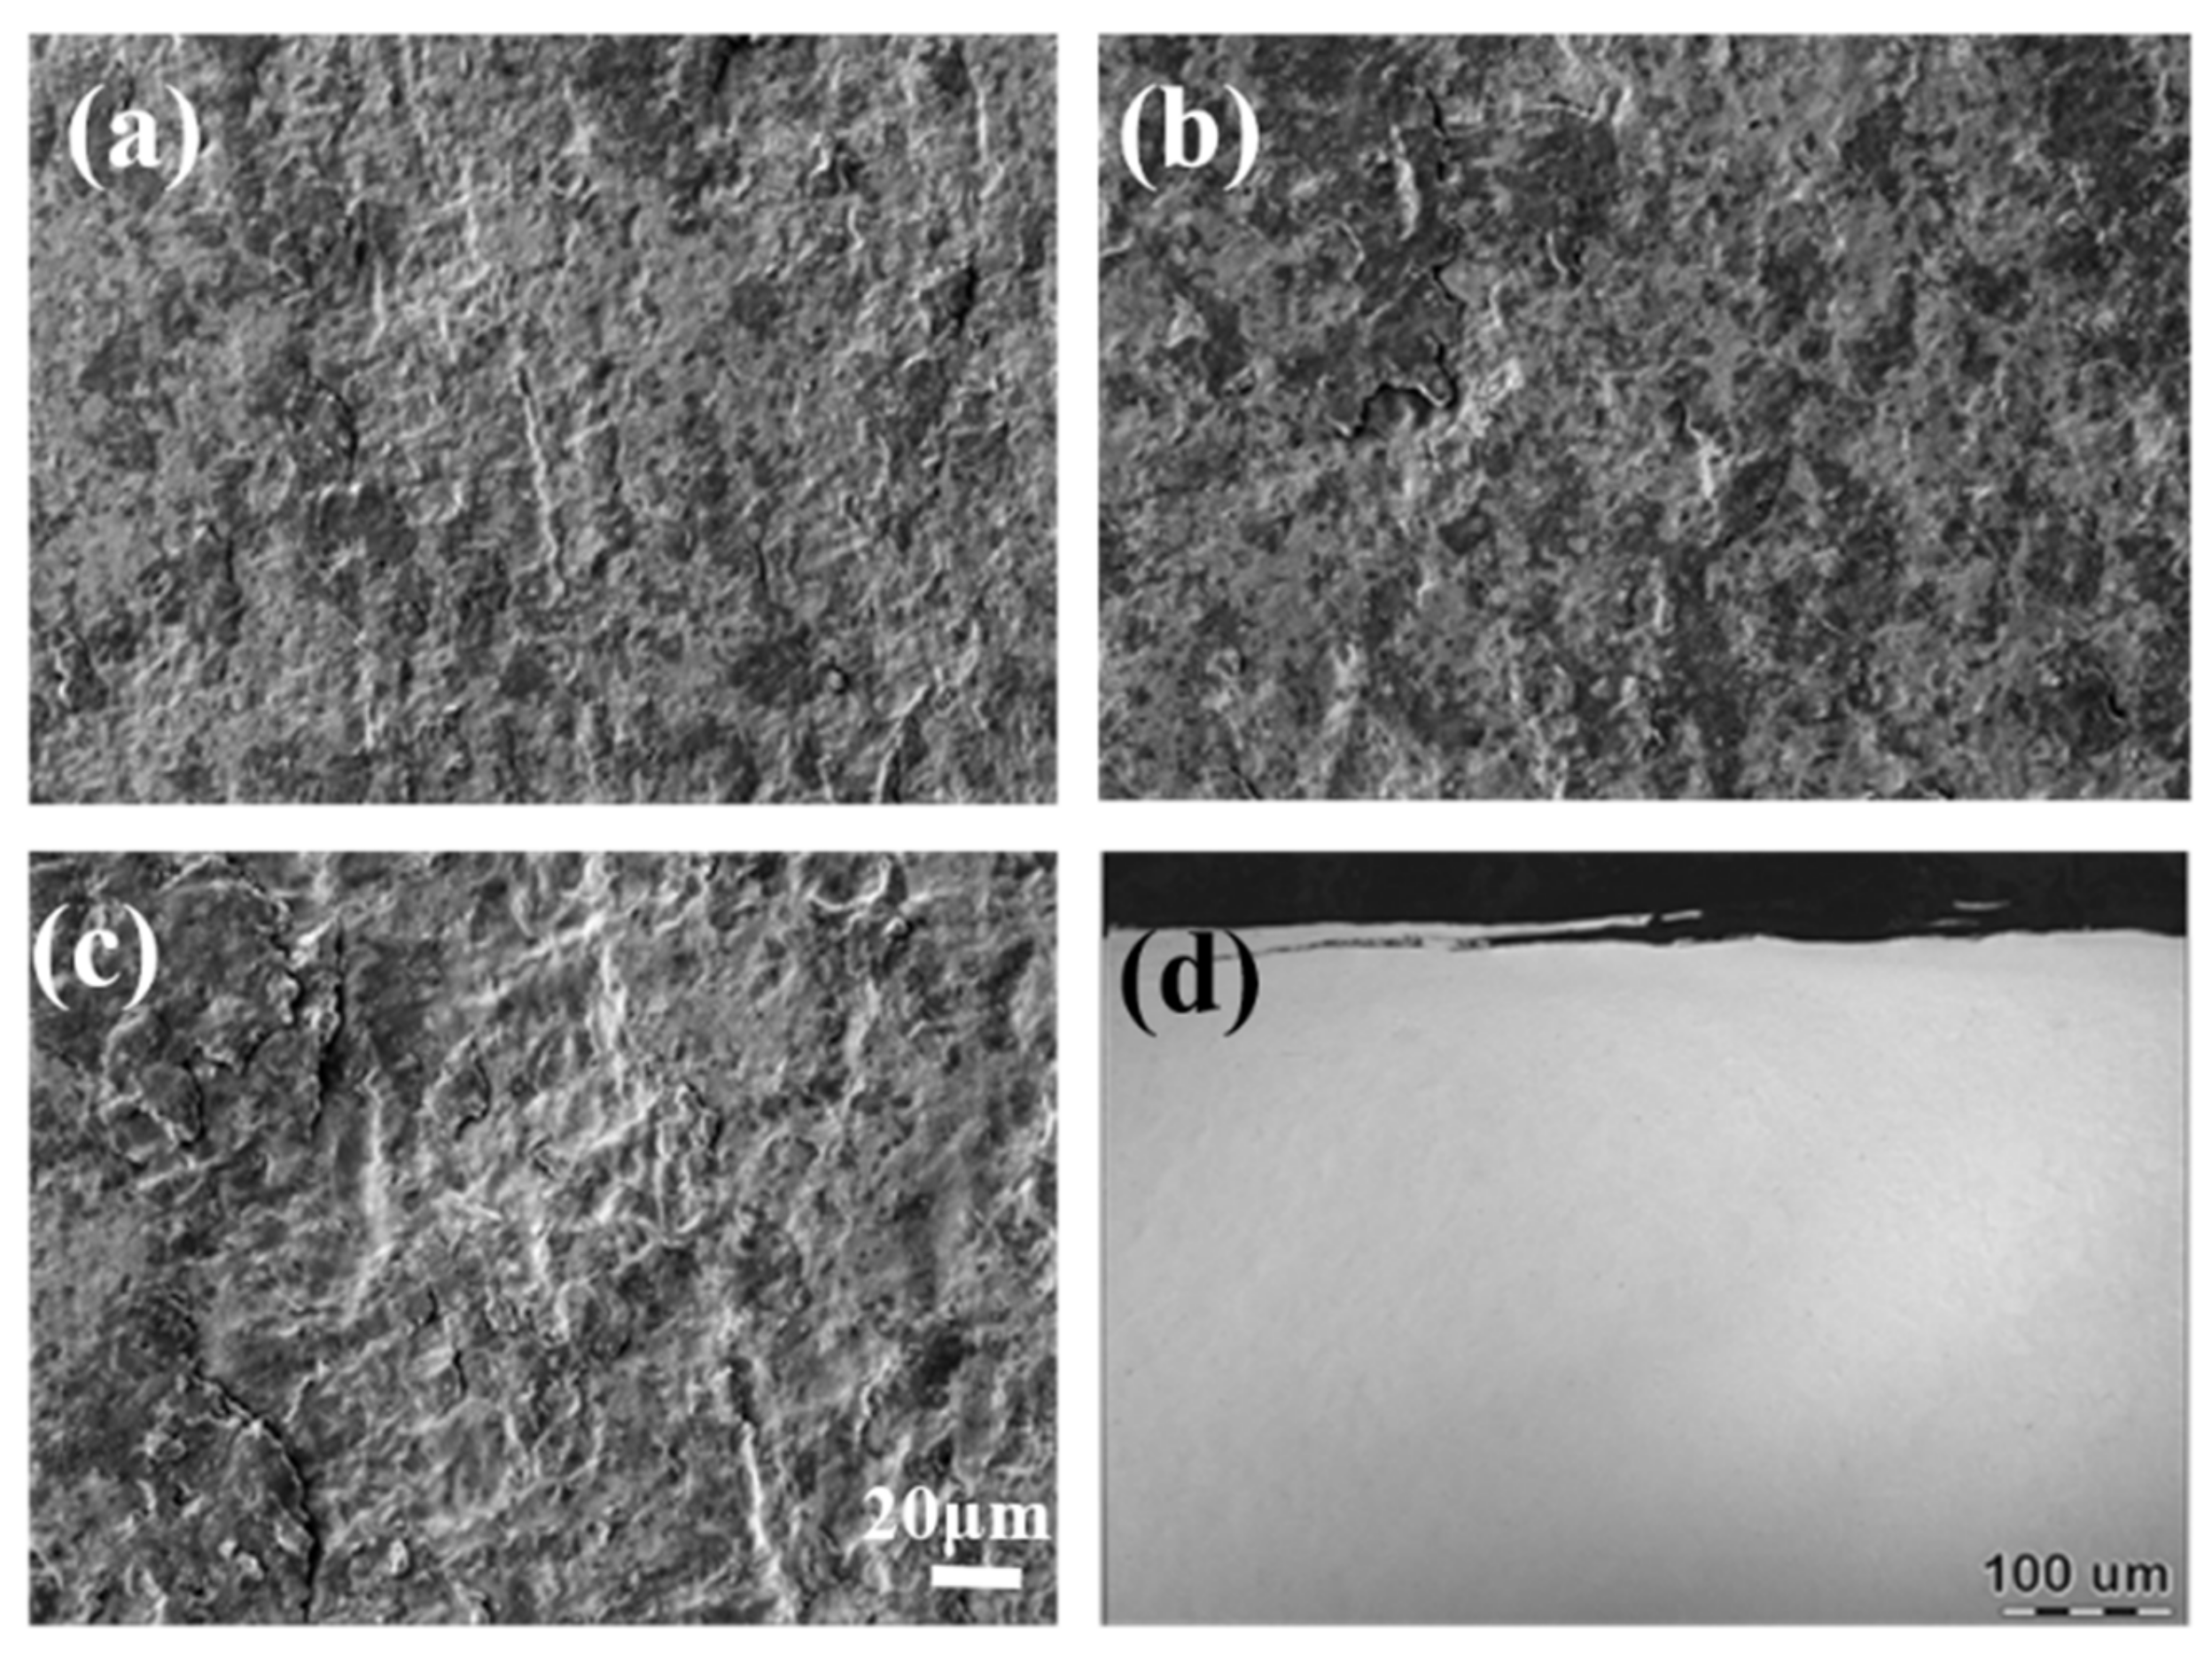
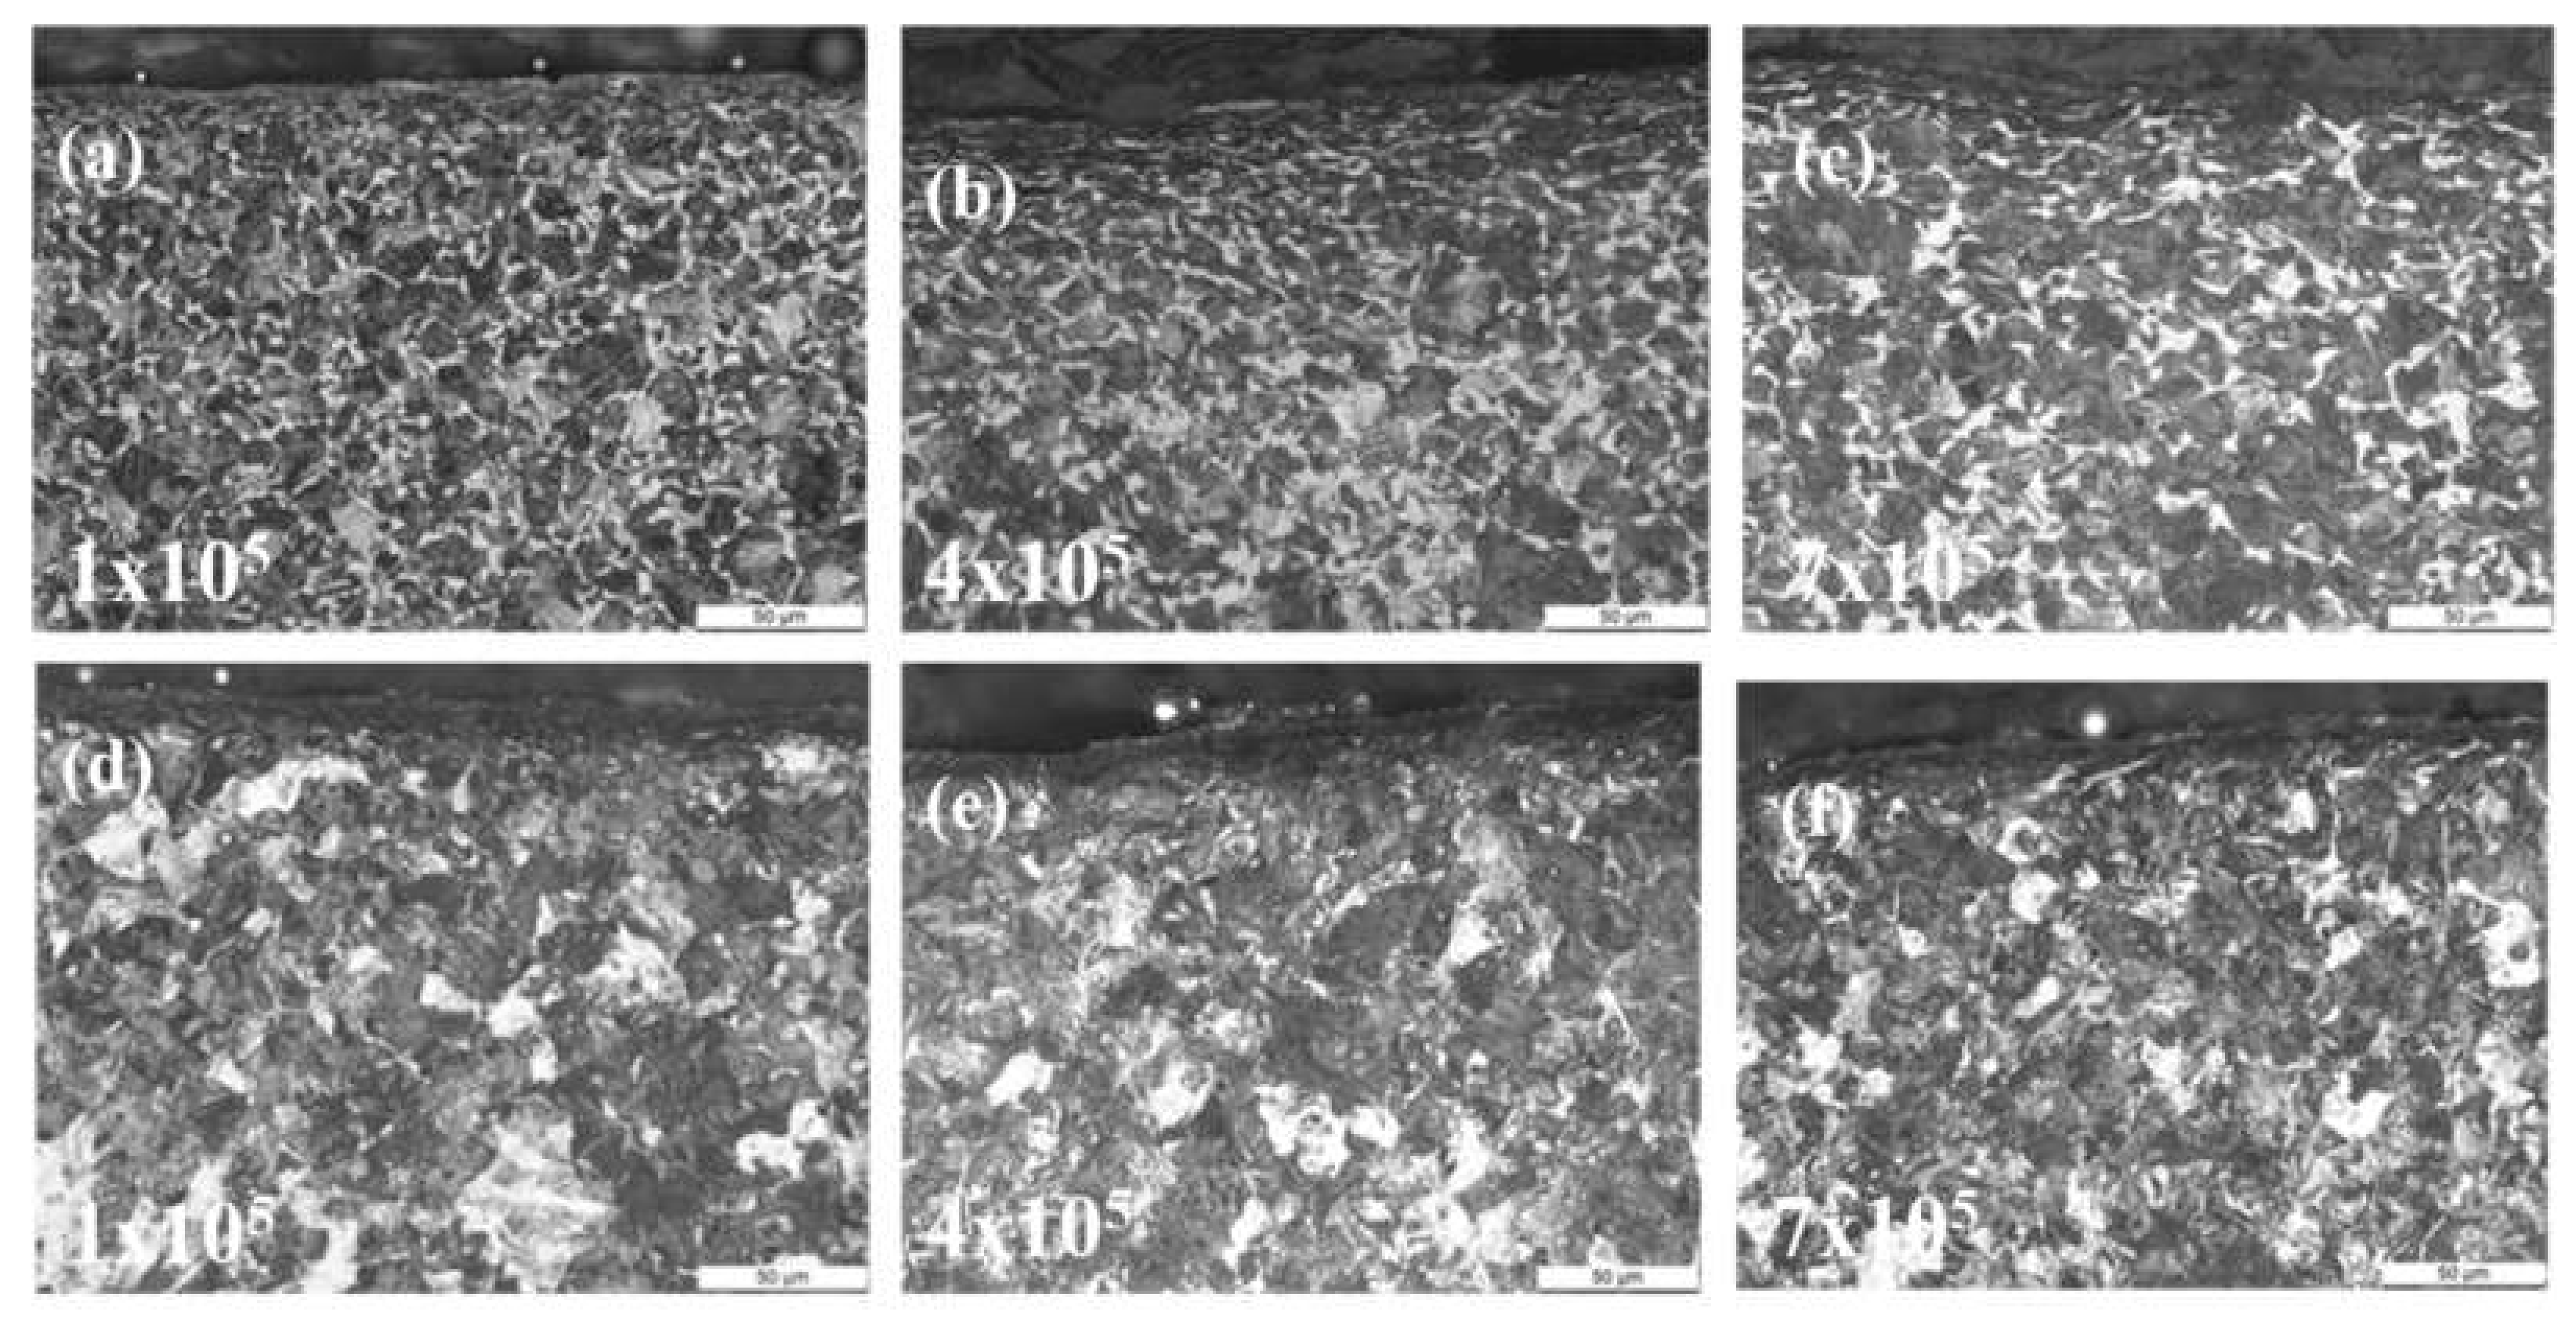
3.1. Surface Worn Morphology

Figure 3 shows the change of surface wear morphology of the ER8 and SSW-Q3R wheel samples at different cycles. It can be seen from Figure 3a,d that two kinds of wheel sample surface were smooth at 1 × 10⁵ cycles. There were no cracks on the surfaces of the samples. When the rolling cycle reached 4 × 10⁵ cycles, the polygonal wear began to form at two kinds of wheel sample surface, as shown in Figure 3b,e. The polygonal wear at the ER8 wheel sample surface was more severe than that at the SSW-Q3R wheel sample surface. The ER8 wheel sample surface also formed the crest and trough all the way around. However, there were no crests and troughs in the half circle of the SSW-Q3R wheel sample. At 7 × 10⁵ cycles, the degree of polygonal wear for the two kinds of wheel sample was similar (Figure 3c,f). All surfaces of the wheel sample formed a crest and trough all the way around.
Figure 4 presents the surface micro-worn morphology. At 1 × 10⁵ cycles, the wear mechanism of the two kinds of wheel samples was adhesive wear, as displayed in Figure 4a. The surface of the wheel samples formed an amount of wear debris. When the wheel sample surface formed a crest and trough at 4 × 10⁵ cycles, the wear mechanism of the crest was adhesive wear (Figure 4b), and that of the trough was fatigue wear (Figure 4c). This was similar to the result of Pan et al. [2]. The fatigue wear cracks initiated at the sample surface and the depth of the fatigue cracks was about 10 μm, as shown in Figure 4d, which was similar to the result of Roy et al. [16,17]. According to the result of Figure 3 and Figure 4, the ER8 wheel sample is more prone to form the fatigue wear cracks than that of SSW-Q3R wheel sample. That is because that the carbon content of ER8 wheel sample is lower than SSW-Q3R wheel sample (Table 1) and the original hardness of the ER8 wheel sample is low. Therefore, the ER8 wheel sample exhibits the poor resistance of plastic deformation. During rolling cyclic, the dislocation density of the ER8 wheel sample will increase rapidly at grain boundary to cause the formation of fatigue cracks. According to the results of Liu et al. [6], the fatigue cracks mainly initiated and propagated along the interface between the pearlite colonies and proeutectoid ferrite. The content of the proeutectoid ferrite of the ER8 wheel sample was more than that of the SSW-Q3R wheel sample. Based on the above two reasons, the SSW-Q3R wheel sample showed better resistance to polygonal wear and fatigue wear.

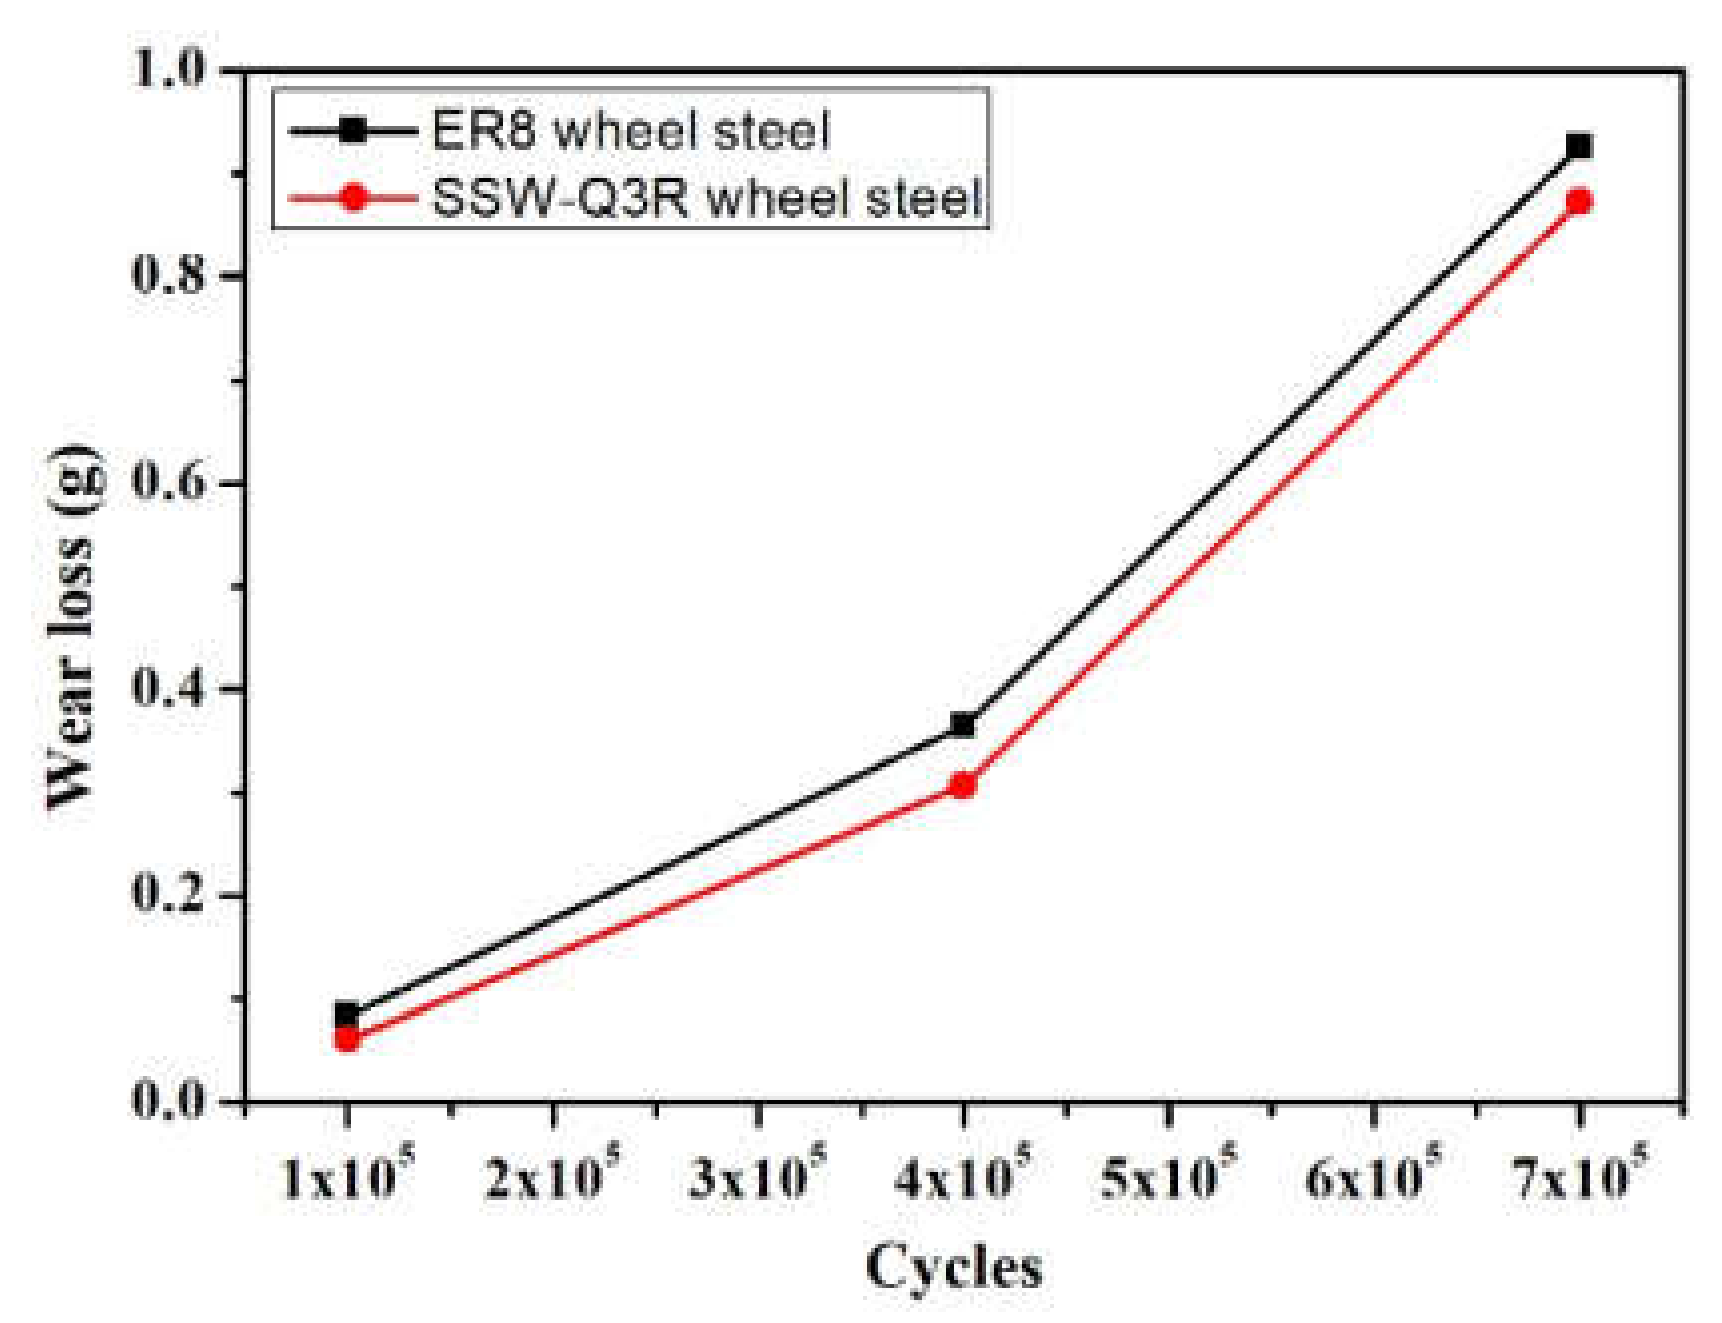
3.2. Wear Loss and Surface Hardness

The variation of wear loss of the ER8 and SSW-Q3R wheel samples with different cycles is shown in Figure 5. With the increase in cycles, the wear loss of the wheel samples was increased. At 1 × 10⁵ cycles, the difference of wear loss of the two kinds of wheel samples was not obvious. At 4 × 10⁵ cycles, the wear rate of wheel samples was high. Moreover, the obvious difference of wear loss was formed. The wear loss of the ER8 wheel sample was obviously higher than that of the SSW-Q3R wheel sample. The reason could be that the ER8 sample surface formed severe polygonal wear all the way around to increase the wear loss, as shown in Figure 3b. At 7 × 10⁵ cycles, the wear loss of the ER8 wheel sample was also higher than that of the SSW-Q3R wheel sample. The wear rate of the wheel samples was similar to that at 4 × 10⁵ cycles.
The change in surface wear morphology and wear loss is related to the evolution of surface hardness and surface microstructure. The surface hardness of the ER8 and SSW-Q3R wheel samples with different cycles was measured, as shown in Figure 6. The surface hardness of wheel samples increased as the number of cycles increased. At 1 × 10⁵ cycles, the surface hardness of the ER8 and SSW-Q3R wheel samples was 500 HV and 550 HV, respectively. As the cycle increased to 4 × 10⁵ cycles, the surface hardness of the ER8 and SSW-Q3R wheel samples reached 530 HV and 600 HV, respectively. When the cycle reached 7 × 10⁵ cycles, the surface hardness of the ER8 and SSW-Q3R wheel samples increased to 530 HV and 600 HV, respectively. At different cycles, the surface hardness of the ER8 wheel sample was always lower than that of the SSW-Q3R wheel sample. High hardness of the SSW-Q3R wheel sample improved the wear resistance. Therefore, the wear loss of the SSW-Q3R wheel sample was low (Figure 5). The carbon content of the SSW-Q3R wheel sample was higher than that of the ER8 wheel sample. During the rolling wear process, the surface lamellar cementite will be fragmented and dissolved due to the surface friction stress, so can increase the surface hardness of the wheel samples [18]. It can be seen from Figure 6b that the hardening layer thickness of the ER8 wheel sample was higher than that of the SSW-Q3R wheel sample as the content of proeutectoid ferrite of the ER8 wheel sample was higher than that of SWW-Q3R wheel steel, which led to the thicker plastic deformation layer.

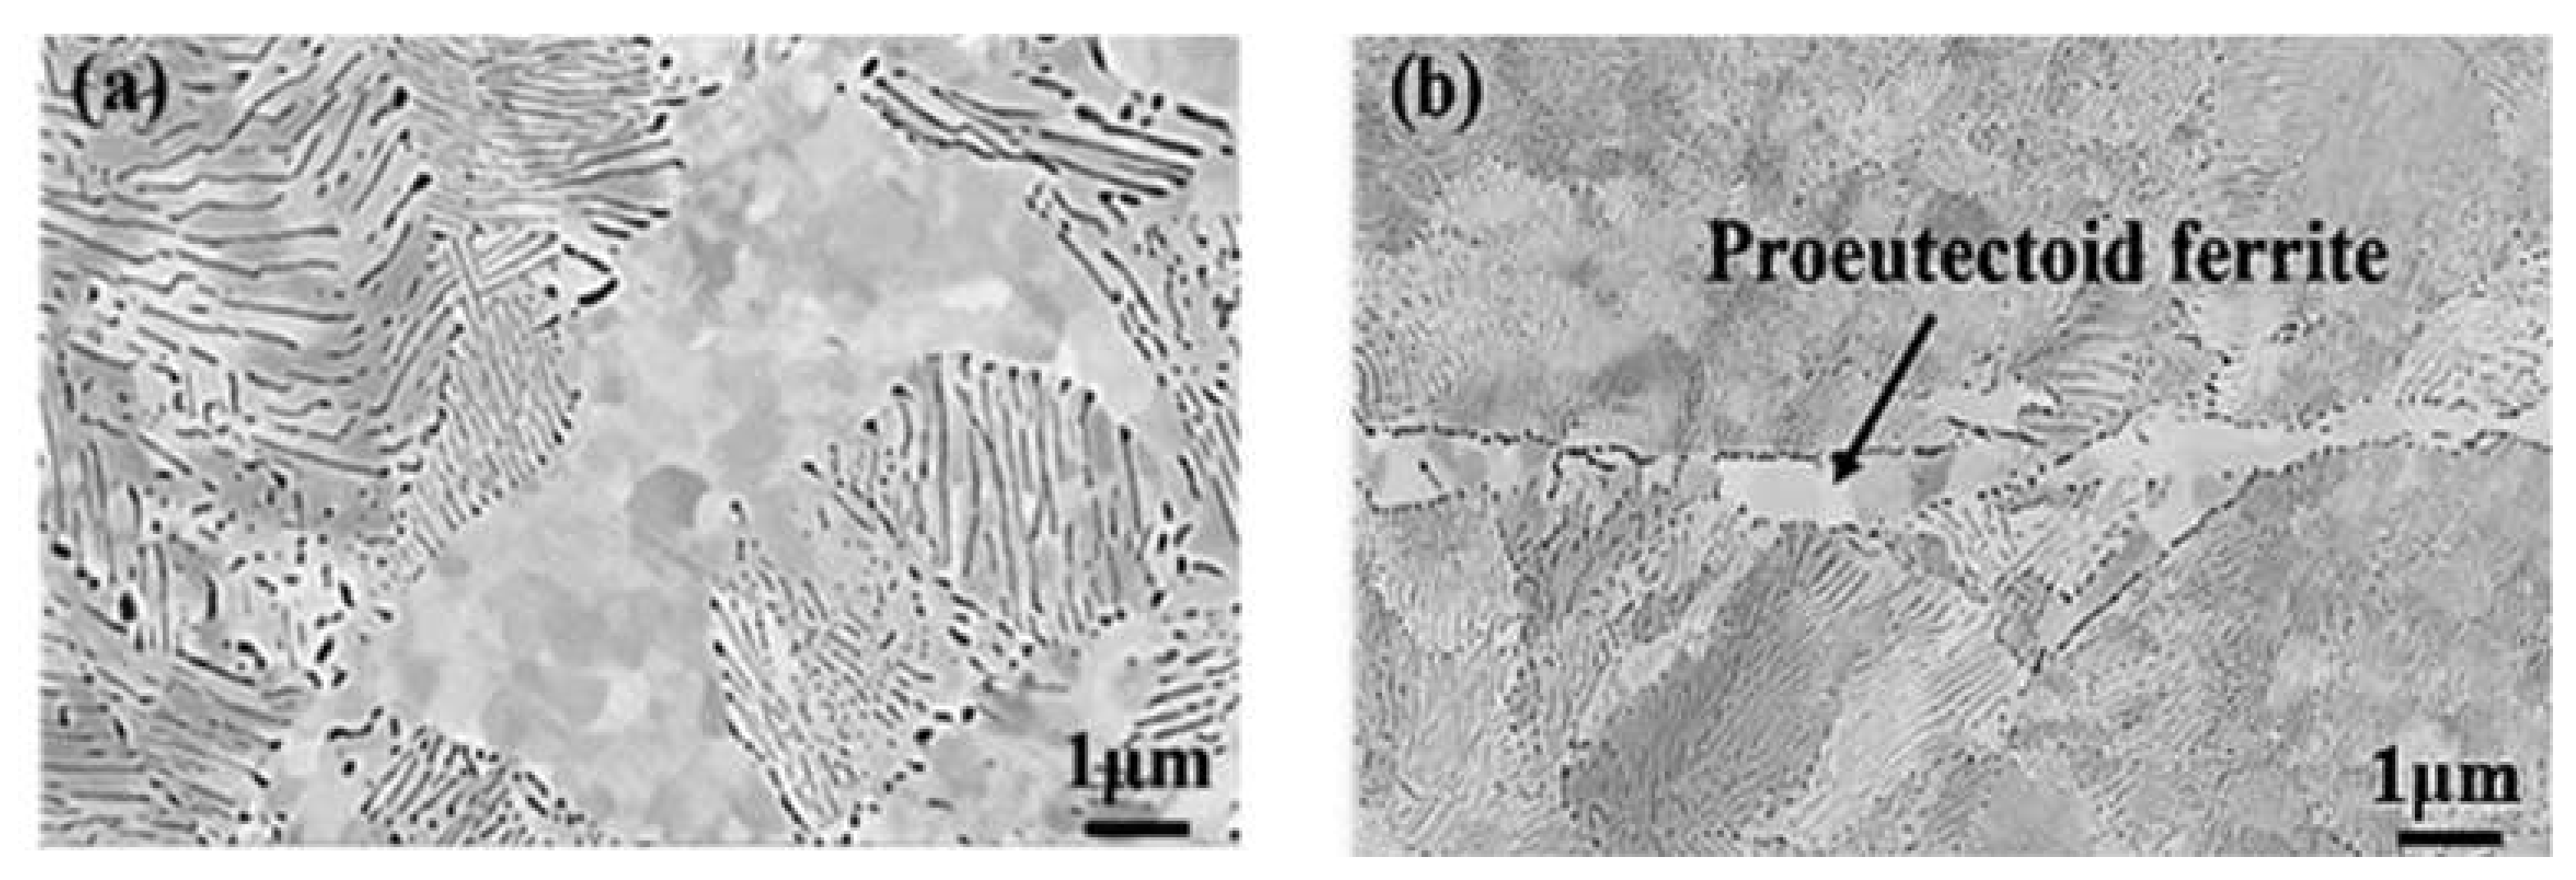
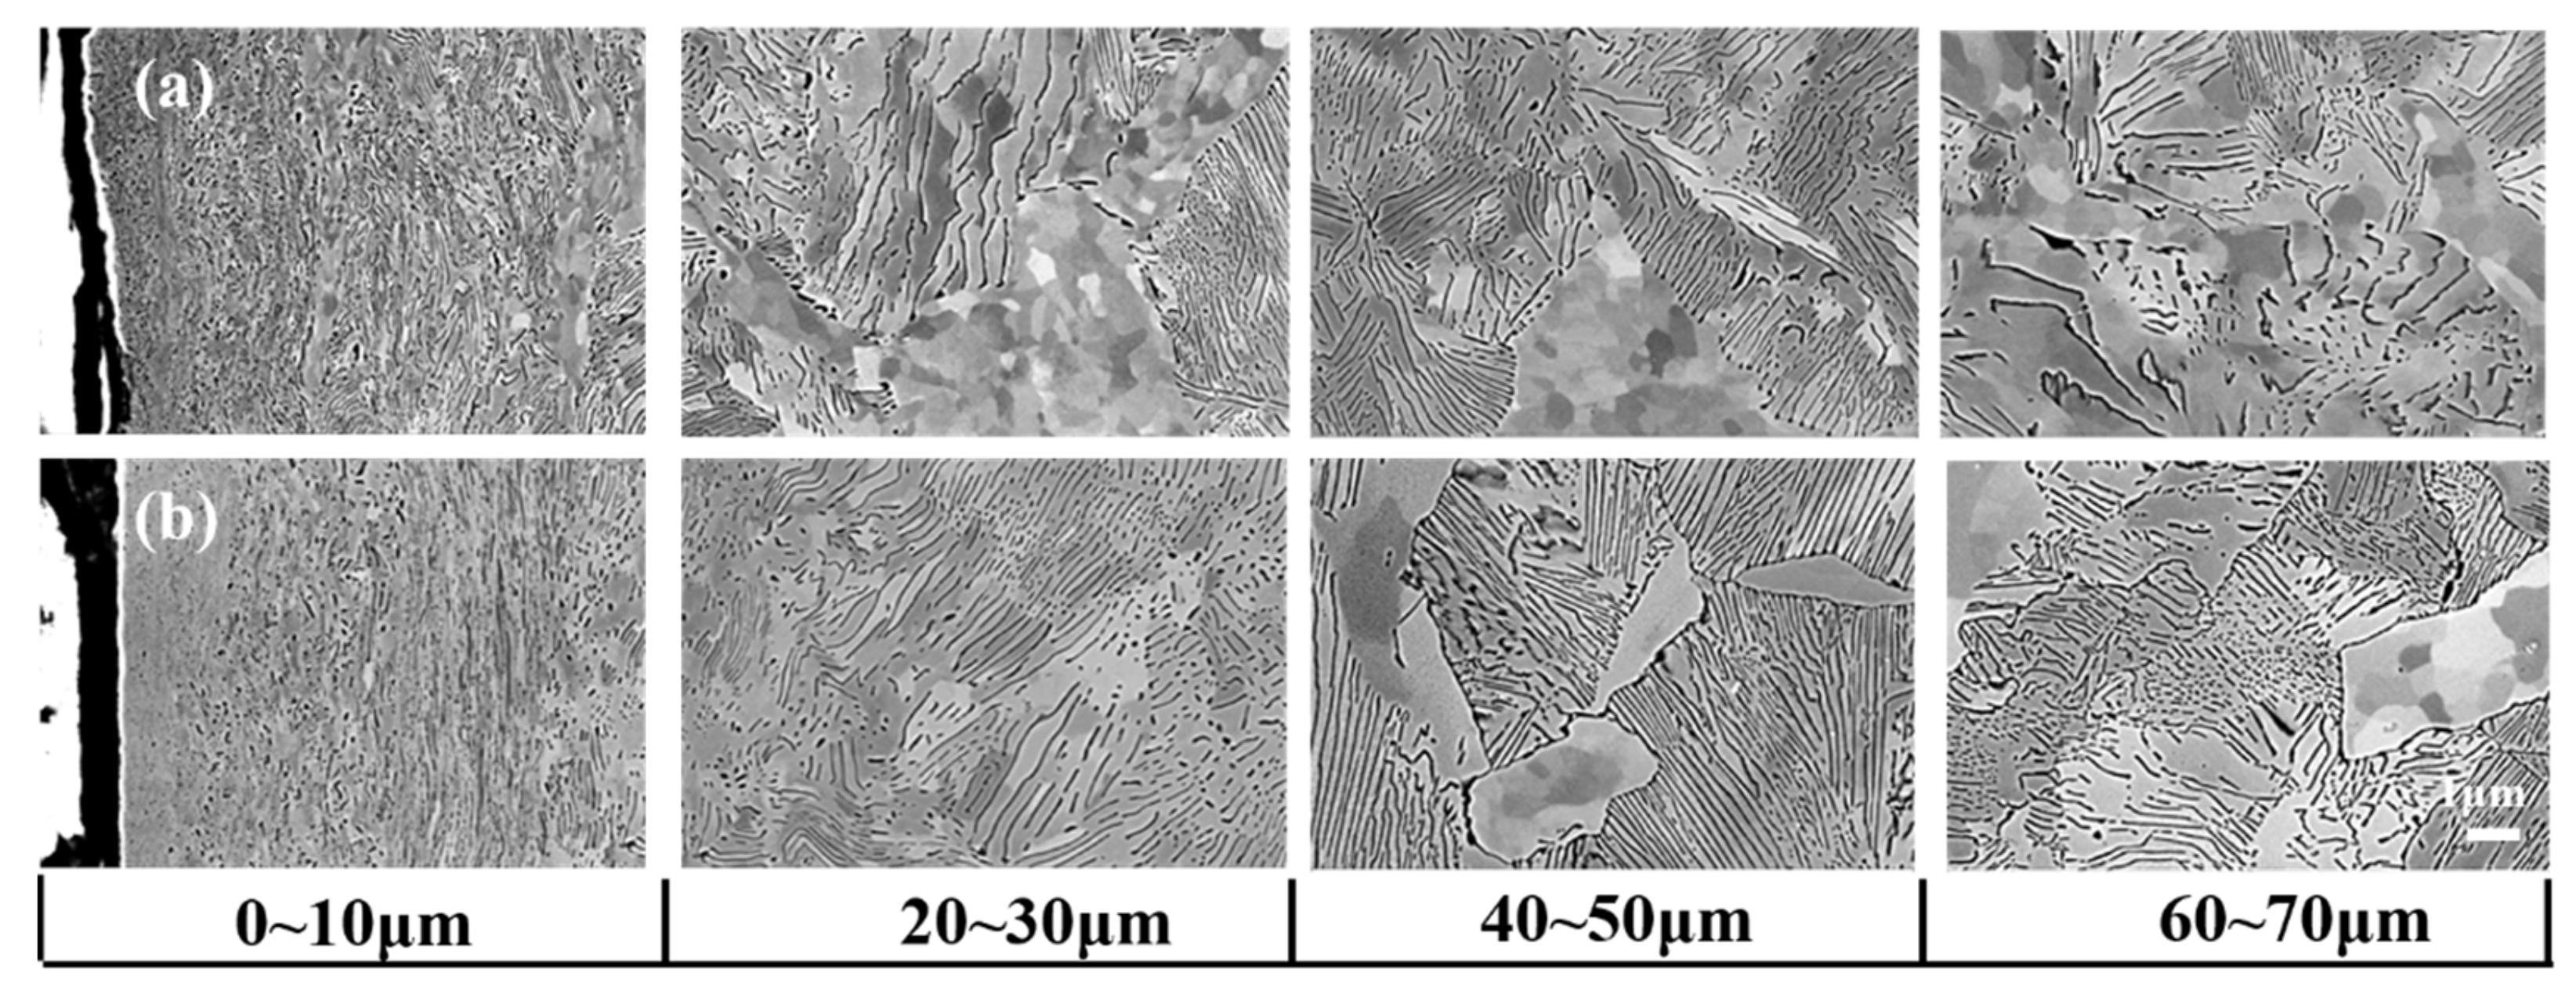
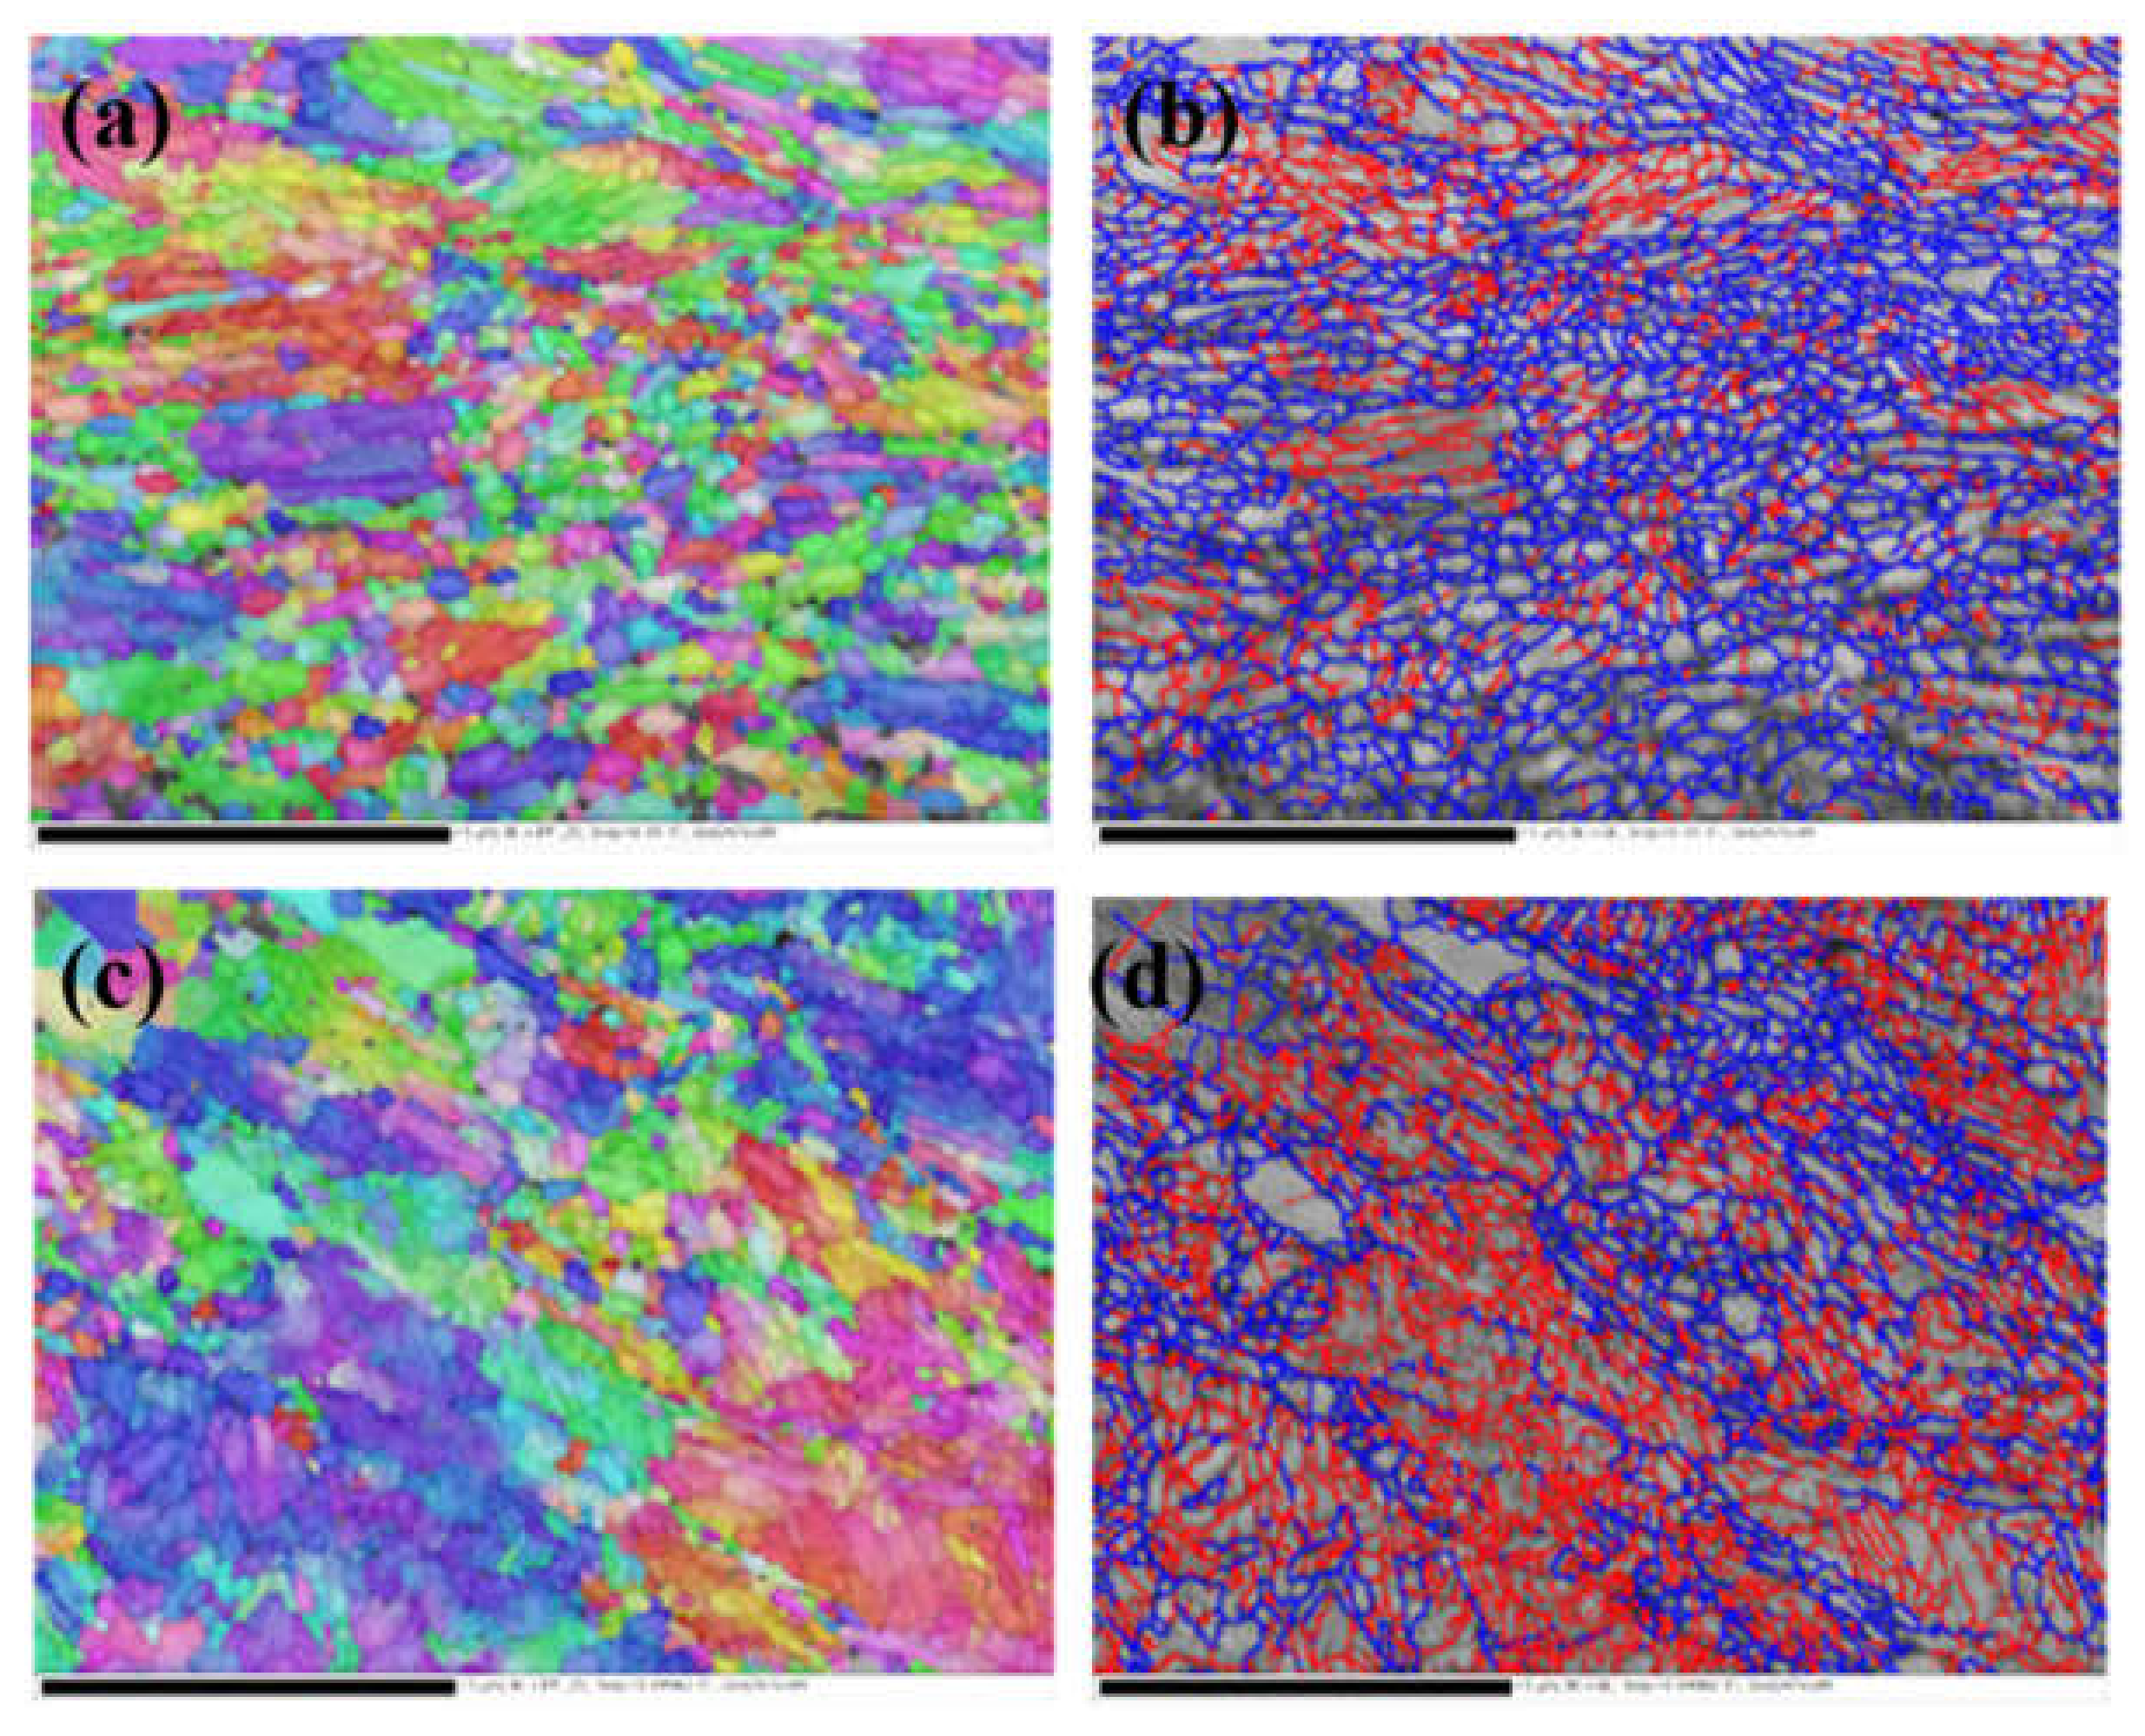
3.3. Surface Microstructure

Figure 7 shows the optical microscope (OM) micrographs of the ER8 and SSW-Q3R wheel samples with different cycles. After rolling wear, two kinds of sample surface formed a certain thickness of plastic deformation layer. After wear with 1 × 10⁵ cycles, the thickness of the plastic deformation layer of the ER8 wheel sample was about 20 μm. However, for the SSW-Q3R wheel sample, it was only about 10 μm. With the increase in cycles, the thickness of the plastic deformation layer gradually increased. At 4 × 10⁵ cycles, the thickness of the plastic deformation layer of the ER8 and SSW-Q3R wheel samples reached around 30 μm and 20 μm, respectively. When the rolling cycle was operated to 7 × 10⁵ cycles, the thickness of the plastic deformation layer of the ER8 wheel sample further increased to 40 μm, and the thickness of the plastic deformation layer of the SSW-Q3R wheel sample was about 30 μm.
After wear with 7 × 10⁵ cycles, the microstructural evolution of the ER8 and SSW-Q3R wheel steel samples at different depth from surface was characterized by SEM. Figure 8a shows the microstructural evolution of the ER8 wheel sample. At the depth of 40 μm~70 μm from the surface, no plastic deformation was produced in the pearlite, but fine grains were formed in the proeutectoid ferrite with a size of about 1 μm. This indicates that the proeutectoid ferrite is more prone to producing plastic deformation than the pearlite. At the depth of 20 μm~30 μm from surface, the grains in the proeutectoid ferrite were further refined. However, the cementite in pearlite was still lamellar. At the depth of 0 μm~10 μm from the surface, the lamellar cementite was fragmented into particles, and a part of the cementite was dissolved. The microstructural evolution of the SSW-Q3R wheel sample is displayed in Figure 8b. The degree of plastic deformation of the SSW-Q3R wheel sample was lighter than that of the ER8 wheel sample. At the depth of 40 μm~70 μm from the surface, plastic deformation also did not occur in the pearlite, and the size of the grains in proeutectoid ferrite was large. At the depth of 20 μm~30 μm from the surface, the cementite in pearlite was still lamellar. At the depth of 0 μm~10 μm from the surface, the lamellar cementite was fragmented into particles, and a part of cementite was dissolved.
In order to analyze the evolution of the ferrite phase of wheel samples, the ferrite phase of the wheel samples at the depth of 10 μm after wear with 7 × 10⁵ cycles were studied by the use of EBSD, as shown in Figure 9. It can be seen that the ferrite grains of the SSW-Q3R wheel sample were refined, and a small amount of high angle grain boundary (HAGB) was formed, as shown in Figure 9c,d. However, the fraction of HAGB of the ER8 wheel sample was higher than that of the SSW-Q3R wheel sample, which was about 60%. Moreover, the ferrite grains were refined significantly, which was about 200 nm. According to the research results of Izotov et al. [19] and Tao et al. [20], first, the dislocation walls were formed, which divided the ferrite lamellae into cells. Then, as the degree of plastic deformation increased, the dislocation density was increased. When the balance between the dislocation multiplication rate and annihilation rate was reached, the dislocation walls transformed into the subboundaries. Eventually, the subboundaries in ferrite grains evolved into the HAGB with the increase in plastic deformation.

3.4. Surface Residual Stress

The residual stress on the wheel sample surface will change during the rolling wear process. The residual stress of the original sample is residual tension stress, and the value of residual stress in the axial direction is about 150 MPa. After wear with different cycles, the change of residual stress of the ER8 and SSW-Q3R wheel samples is shown in Table 2 and Table 3. It can be seen from Table 2 that the ER8 and SWW-Q3R wheel samples surface formed the residual compressive stress after wear, and the residual compressive stress increased as the cycles increased. At different cycles, the surface residual stress at the axial direction was higher than that in the peripheral direction. The value of the residual compressive stress of the ER8 wheel sample was larger than that of the SSW-Q3R wheel sample. After wear with 7 × 10⁵ cycles, the wheel sample surface produced the crest and trough. Table 3 shows the value of the residual stress of the wheel samples at the crest and trough. It can be seen that the value of residual stress at the trough was higher than at the crest as the degree of plastic deformation at the trough was severe, leading to high residual stress.

4. Conclusions

In this work, a GPM-30 rolling wear tester was used to study the wear property of the ER8 and SSW-Q3R wheel steel. The surface worn morphology, surface microstructure, surface hardness, and surface residual stress after wear with different cycles was analyzed. The following conclusions were drawn:
(1) With the increase in cycles, the wear loss of the ER8 and SSW-Q3R wheel sample increased. At the same cycles, the SSW-Q3R wheel sample had a better wear resistance than the ER8 wheel sample. Therefore, the high carbon content can improve surface hardness to decrease the wear loss.
(2) During rolling wear, the ER8 wheel sample formed polygon wear faster than the SSW-Q3R wheel sample. At 1 × 10⁵ cycles, the wear mechanism of the two kinds of wheel sample was adhesive wear. As the number of cycles increased, the wear mechanism transformed into fatigue wear. The ER8 wheel sample surface formed the fatigue wear earlier.
(3) With the increase in cycles, the thickness of the plastic deformation layer of the ER8 and SSW-Q3R wheel sample increased. At the same cycles, the thickness of the plastic deformation layer of the SSW-Q3R wheel sample was thinner than that of the ER8 wheel sample.
(4) After wear with different cycles, the surface residual stress of the two kinds of wheel sample transformed residual tension stress into residual compressive stress, and the value of the residual stress increased with the increase in cycles. The residual compressive in the axial direction was higher than that in the peripheral direction, and residual stress at the trough was higher than at the crest.

Author Contributions

Methodology, H.Z., and P.L.; formal analysis, H.Z., P.L., Y.D., B.J., and X.L.; investigation, P.L., M.Z., and G.C.; resources, P.L., and G.C.; writing-original draft preparation, H.Z. and P.L.; writing-review and editing, H.Z. and P.L., and M.Z. All authors have read and agreed to the published version of the manuscript.

Funding

This research was supported by the National Key Basic Research Program of China (No. 2015CB654802).

Acknowledgments

The authors want to thank the institute of nanomaterials and surface engineering of Dalian Jiaotong University for providing test facility and technical support for the study.

Conflicts of Interest

The authors declare no conflicts of interest.

References

  1. Yoshihiko, S.; Matsumoto, A.; Knothe, K. Review on rail corrugation studies. Wear 2020, 253, 130–139. [Google Scholar]
  2. Pan, R.; Zhao, X.; Liu, P.; Ren, R. Micro-mechanism of polygonization wear on railroad wheels. Wear 2017, 392, 213–220. [Google Scholar] [CrossRef]
  3. Molyneux-Berry, P.; Davis, C.; Bevan, A. The influence of wheel/rail contact conditions on the microstructure and hardness of railway wheels. Sci. World J. 2014, 2014, 1–16. [Google Scholar] [CrossRef] [PubMed]
  4. Zhou, Y.; Peng, J.; Wang, W.; Jin, X.; Zhu, M. Slippage Effect on rolling contact wear and damage behavior of pearlitic steels. Wear 2016, 362–363, 78–86. [Google Scholar] [CrossRef]
  5. Ma, L.; He, C.X.J.; Zhao, X.; Guo, J.; Wang, W.; Liu, Q.; Jin, X. Study on wear and rolling contact fatigue behaviors of wheel/rail materials under different slip ratio conditions. Wear 2016, 366–367, 13–26. [Google Scholar] [CrossRef]
  6. Liu, C.; Zhao, X.; Liu, P.; Su, C.; Ren, R. Influence of slip ratio on worn-surface microstructure and fatigue wear behavior of D2 wheel steel. J. Iron. Steel. Res. Int. 2018, 25, 1278–1286. [Google Scholar] [CrossRef]
  7. He, C.; Guo, J.; Liu, Q.; Wang, W. Experimental investigation on the effect of operating speeds on wear and rolling contact fatigue damage of wheel materials. Wear 2016, 364–365, 257–269. [Google Scholar] [CrossRef]
  8. Zhong, W.; Hu, J.; Shen, P.; Wang, C.; Liu, Q. A study of rolling contact fatigue crack growth in U75V and U71Mn rails. Wear 2011, 271, 2485–2493. [Google Scholar] [CrossRef]
  9. Baumann, G.K.; Knothe, K.; Fecht, H.J. Surface modification, corrugation and nanostructure formation of high speed railway tracks. Nanostruct. Mater. 1997, 9, 751–754. [Google Scholar] [CrossRef]
  10. Newcomb, S.B.; Stobbs, W.M. A transmission electron microscopy study of the white-etching layer on a rail head. Mater. Sci. Eng. 1984, 66, 195–204. [Google Scholar] [CrossRef]
  11. Correa, N.; Oyarzabal, O.; Vadillo, E.; Santamaria, J.; Gomez, J. Rail corrugation development in high speed lines. Wear 2011, 271, 2438–2447. [Google Scholar] [CrossRef]
  12. Zeng, D.; Lu, L.; Zhang, N.; Gong, Y.; Zhang, J. Effect of different strengthening methods on rolling/sliding wear of ferrite–pearlite steel. Wear 2016, 358–359, 62–71. [Google Scholar] [CrossRef]
  13. Wang, Y.; Lei, T.; Liu, J. Tribo-metallographic behavior of high carbon steels in dry sliding: II. Microstructure and wear. Wear 1999, 231, 12–19. [Google Scholar] [CrossRef]
  14. Wang, P.; Li, Z.; Lin, G.; Zhou, S.; Yang, C.; Yong, Q. Influence of Vanadium on the Microstructure and Mechanical Properties of Medium-Carbon Steels for Wheels. Metals 2018, 8, 978. [Google Scholar] [CrossRef]
  15. Timoshenko, S.P.; Goodier, J.N.; Abramson, H.N. Theory of elasticity. J. Appl. Mech. 1970, 37, 888. [Google Scholar] [CrossRef]
  16. Roy, S.; Ooi, G.T.C.; Sundararajan, S. Effect of retained austenite on micropitting behavior of carburized AISI 8620 steel under boundary lubrication. Materialia 2018, 3, 192–201. [Google Scholar] [CrossRef]
  17. Roy, S.; Sundararajan. S. Effect of retained austenite on spalling behavior of carburized AISI 8620 steel under boundary lubrication. Int. J. Fatigue 2019, 119, 238–246. [Google Scholar] [CrossRef]
  18. Zhang, H.W.; Ohsaki, S.; Mitao, S.; Ohnuma, M.; Hono, K. Microstructural investigation of white etching layer on pearlite steel rail. Mater. Sci. Eng., A 2006, 421, 191–199. [Google Scholar] [CrossRef]
  19. Izotov, V.I.; Pozdnyakov, V.A.; Luk’yanenko, E.V.; Usanova, O.Y.; Filippov, G.A. Influence of the pearlite fineness on the mechanical properties, deformation behavior and fracture characteristics of carbon steel. Phys. Met. Metall. 2007, 103, 519–529. [Google Scholar] [CrossRef]
  20. Tao, N.; Wang, Z.; Tong, W.; Sui, M.; Lu, J.; Lu, K. An investigation of surface nanocrystallization mechanism in Fe induced by surface mechanical attrition treatment. Acta Mater. 2002, 50, 4603–4616. [Google Scholar] [CrossRef]
Figure 1. The scanning electron microscopy (SEM) micrographs of the original microstructure of the wheel samples. (a) ER8 wheel steel, (b) SSW-Q3R wheel steel.
Metals 10 00513 g001
Figure 2. The test apparatus. (a) GPM-30 wear tester. (b) Sample dimensions and contact mode of wheel and rail samples (unit: mm).
Metals 10 00513 g002
Figure 3. The surface worn macro-morphology of wheel samples with different cycles. (ac) ER8. Wheel steel, (df) SSW-Q3R wheel steel.
Metals 10 00513 g003
Figure 4. The surface worn morphology of samples with different cycles. (a) 1 × 10⁵ cycles; (b) Crest at 4 × 10⁵ cycles; (c) Trough at 4 × 10⁵ cycles; (d) Cross-section of trough at 4 × 10⁵ cycles.
Metals 10 00513 g004
Figure 5. The wear loss of the ER8 wheel steel and SSW-Q3R wheel steel at different cycles.
Metals 10 00513 g005
Figure 6. The variation of surface hardness of samples. (a) SSW-Q3R wheel steel. (b) ER8 wheel steel.
Metals 10 00513 g006
Figure 7. The optical microscope (OM) micrographs of samples with different cycles. (ac) ER8 wheel steel, (df) SSW-Q3R wheel steel.
Metals 10 00513 g007
Figure 8. The SEM micrographs of samples at different depths from the surface at 7 × 10⁵ cycles. (a) ER8 wheel steel, (b) SSW-Q3R wheel steel.
Metals 10 00513 g008
Figure 9. The EBSD maps of the wheel samples at the depth of 10 μm from the surface at 7 × 10⁵ cycles (red line is the low angle grain boundary, 2° < θ < 10°; blue line is the high angle grain boundary, θ > 10°). (a,b) ER8 wheel steel, (c,d) SSW-Q3R wheel steel.
Metals 10 00513 g009
Table 1. The chemical component of the wheel samples (%).
SamplesCSiMnCrAlVSP
ER80.540.30.730.070.010.050.000.01
SSW-Q3R0.650.30.860.010.020.000.010.01
Table 2. The surface residual stress of samples at different cycles (MPa).
SamplesAxial Direction/MPaPeripheral Direction/MPa
SSW-Q3R1 × 105 cycles4 × 105 cycles7 × 105 cycles1 × 105 cycles4 × 105 cycles7 × 105 cycles
−484 ± 15−502 ± 19−611 ± 20−377 ± 8−472 ± 23−407 ± 15
ER81 × 105 cycles4 × 105 cycles7 × 105 cycles1 × 105 cycles4 × 105 cycles7 × 105 cycles
−509 ± 10−511 ± 16−595 ± 17−375 ± 11−455 ± 17−450 ± 21
Table 3. The surface residual stress of samples at the crest and trough (MPa).
SamplesAxial Direction/MPaPeripheral Direction/MPa
SSW-Q3RCrestTroughCrestTrough
−467 ± 13−502 ± 14−346 ± 20−472 ± 22
ER8CrestTroughCrestTrough
−497 ± 10−511 ± 12−310 ± 15−455 ± 18

