Article

Simulation and Experimental Study on the Inhomogeneity of Mechanical Properties of Aluminum Alloy 7050 Plate

1
Light Alloy Research Institute, Central South University, Changsha 410083, China
2
State Key Laboratory of High Performance Complex Manufacturing, Central South University, Changsha 10083, China
3
College of Mechanical and Electrical Engineering, Central South University, Changsha 410083, China
4
Avic The First Aircraft Institute, Xi’an 710000, China
*
Author to whom correspondence should be addressed.
Metals 2020, 10(4), 515; https://doi.org/10.3390/met10040515
Submission received: 24 March 2020 / Revised: 10 April 2020 / Accepted: 13 April 2020 / Published: 16 April 2020

Abstract

:
In this work, the finite element method simulated the symmetrical hot rolling process of 7050 aluminum alloy plate. The simulation result show that different thickness layers of 7050 aluminum alloy plate experienced different temperature and strain history in the rolling process, which leads to the difference of recrystallization fraction along the thickness direction and affects the distribution of grain size. The grain size of 7050 aluminum alloy rolled plate was obtained by the metallographic test, which was in good agreement with the simulation result. The true stress-strain curve and yield strength of 7050 aluminum alloy were acquired by hot compression test. Subsequently, a prediction model of yield strength was constructed based on the Hall–Patch relationship. The result show that the predicted inhomogeneity reached 8.7%, and the difference was about 5.3% compared with that of the experimental value.

1. Introduction

Aluminum alloy 7050 is widely used in aerospace industries because of its high strength and fracture toughness, low density, and good corrosion resistance [1,2,3,4]. Generally, the manufacturing processes of aluminum alloy include smelting, casting, rolling, cutting, and so on. Rolling can reduce or eliminate the casting defects and improve the mechanical properties of the alloy. However, when the aluminum alloy 7050 material was rolled into plates of a certain thickness, the overall mechanical properties of the plates are often lower than those of the small pieces in the trial production, showing obvious inhomogeneous properties, which greatly affects its subsequent performance. Therefore, it is very important to study the inhomogeneity of the mechanical properties’ distribution of 7050 aluminum alloy thick plate and the causes of its occurrence, so as to improve its mechanical properties.
To date, there are many investigations trying to find the reasons for the inhomogeneity of microstructure; the focuses were mainly on fatigue resistance, corrosion resistance, and flow stress behavior during heat treatment process [5,6,7]. Some investigations are focused on the effect of initial grain size on recrystallization in cold rolling of aluminum alloy. It has been found that the inhomogeneous distribution of crystal nuclei in coarse-grained alloys not only caused the yield strength and ultimate tensile strength to decrease slowly with increasing annealing temperature, but it also made the recrystallized grains significantly inhomogeneous [8].
Moreover, some researchers focused the influence of rolling technology upon the microstructures and mechanical properties of 7050 Al alloy sheet. They found that the grain sizes, as well as their through-thickness homogeneity, were greatly improved while using smaller thickness reduction per pass (TRPP) during asymmetric rolling, which also contributed to the good through-thickness homogeneity of mechanical properties [9]. Additionally, there are several other methods, like differential speed rolling [10,11]. The effects of grain size on the hot deformation and processing map for 7075 aluminum alloy were carried out. The result shows that the flow stress increased with increasing grain size at high temperature, which might be attributed to the change of deformation mechanism from dislocation glide (DG) to grain boundary sliding (GBS) dominant when the temperature rose and grain size decreased [12]. On the other hand, some people concentrated on reducing the hardness unevenness of 7050 aluminum alloy during quenching to improve the mechanical properties of aluminum alloy when considering high quenching sensitivity of 7xxx aluminum alloys [13].
Briefly, most of these studies centered on the relationship between processing technology and microstructure. There is hardly any research on the inhomogeneity of mechanical properties affected by microstructure. In this work, a rolling model was established to acquire the distribution of grain size in the thickness direction of aluminum alloy 7050 plate. The influence of rolling temperature and deformation on the grain size was investigated in order to find out the reasons for the inhomogeneity of grain size distribution in thickness. Subsequently, the yield strength was acquired by hot compression test. Finally, the yield strength and the inhomogeneity could be determined based on the Hall–Patch relationship and the simulation result.

2. Hot rolling Simulation of Aluminum Alloy 7050 Thick Plate

Hot rolling is an important way of aluminum alloy processing. The grains can be refined and the strength of rolled plate can be improved due to the recrystallization during hot rolling. However, the rolling temperature affects the flow characteristics of the metal, resulting in the uneven deformation of the rolled sheet in thickness direction. In turn, metal deformation and friction heat will affect the temperature field. The change of rolling temperature and deformation has an important influence on the microstructure of rolling plate, and then on the mechanical properties. In this work, the evolution of temperature field, strain field, and microstructure field of aluminum alloy plate in symmetric rolling process was analyzed using the finite element method.
The flow stress of the material was based on the subsequent compression test. The hyperbolic sinusoidal flow stress constitutive relation that was proposed by Sellars and Tegart [14] was used in the finite element model. At the high temperature of rolling process, dynamic recrystallization will occur when the compression deformation reaches the critical value, with the flow stress decreasing gradually and then finally reaching a stable value. The percentage of dynamic recrystallization was calculated according to the flow stress curve that was based on the Yada model [15]. The hyperbolic sinusoidal flow stress constitutive relation was established in Deform software by secondary development. On this basis, the evolution of grain size was analyzed by using the grain module in the software.
The boundary conditions of hot rolling include radiation, convection, contact, heat transfer, and friction. The physical and thermal parameters of the rolls and plates in the rolling model are determined by entering key values in the Table with interpolation. Table 1 shows the main rolling parameters.
A finite element model of single pass symmetrical rolling was built using the Design Environment for Forming (Deform) Software developed by SFTC. Hot rolling of aluminum alloy is a complex process of large deformation, involving heat conduction, plastic deformation, and microstructure evolution. Thus, the following assumptions were made to simplify the simulation model: (1) in the rolling process, the deformation of the plate in the width direction is very small, and there is little difference between the grain size that was obtained by the three-dimensional model and the two-dimensional model [16], so a simplified two-dimensional model was adopted. (2) the roller was set as a rigid body that can conduct heat transfer ignoring the deformation of the roller.
Figure 1 shows the flowchart of the simulation process. Firstly, the two-dimensional rolling geometry model of aluminum plate was established. Subsequently, the heat transfer model, flow stress model, recrystallization model, material properties, and the movement of rollers were set up. At last, effective strain, peak strain, temperature, initial grain size, and dynamic recrystallization fraction can be obtained from the simulation.

3. Experimental Processes

In experimenting, hot compression specimens were cut from an aluminum alloy 7050 casting ingot after homogenizing heat treatment and single pass rolling from thickness of 180 mm to 150 mm. Table 2 provides the chemical composition (wt%) of the alloy. As shown in Figure 2, 30 aluminum alloy cylinders were cut at different positions (top surface layer (S), 1/4 layer (Q), and 1/2 layer (H)) in aluminum alloy 7050 casting ingot by wire cutting respectively at a distance of 37.5 mm. The axial direction of the cylindrical specimen is consistent with the rolling direction of the casting. Next, they were made into cylinders with a size of ϕ 10 mm × 15 mm by rough turning and finish turning. At the same time, it is required that the roughness of the cylindrical surface and the end surface of the thermally compressed specimen is less than Ra 1.6 and Ra 0.8. Figure 3 shows the process.
The steps of metallographic experiment are as follows: the cylindrical samples were cut along the central longitudinal section by wire cutting. Subsequently, they were sanded with sandpaper and mechanically polished. Finally, the metallographic samples were obtained by etching with Keller reagent containing 2 mL HF, 3 mL HCl, 5 mL HNO3, and 190 mL H2O. The metallographic structure was observed under a Leica-DM15000M optical microscope (Leica Microsystems, Mannheim, Germany), and the grain size of the metallographic structure was measured.
Aluminum alloy 7050 hot rough rolling temperature is generally distributed between 360 °C and 420 °C [17,18]. The rolled plate needs to be heated from normal temperature to 450 °C. When considering that the surface of the rolling plate is in direct contact with the air and the roller, a wide temperature range was chosen. With strain rate of 0.01 s−1, the hot compression tests were conducted on Gleeble-3180 thermal-simulation machine (Dynamic Systems Inc., Redmond, WA, USA) at 30 °C, 150 °C, 250 °C, 350 °C, and 450 °C. Each specimen was heated to the deformation temperature at a rate of 5 °C/s and held for 3 min. at isothermal condition, and then compressed with the same strain rate. The amount of compression deformation was set as 50%. Graphite lubricant was applied to both ends of the specimen and the indenter to reduce the friction between the specimen and the indenter during the compression process. True stress-strain curves were plotted with the collected data of stress, strain, pressure, displacement, temperature, and time during the compression process.

4. Results and Discussion

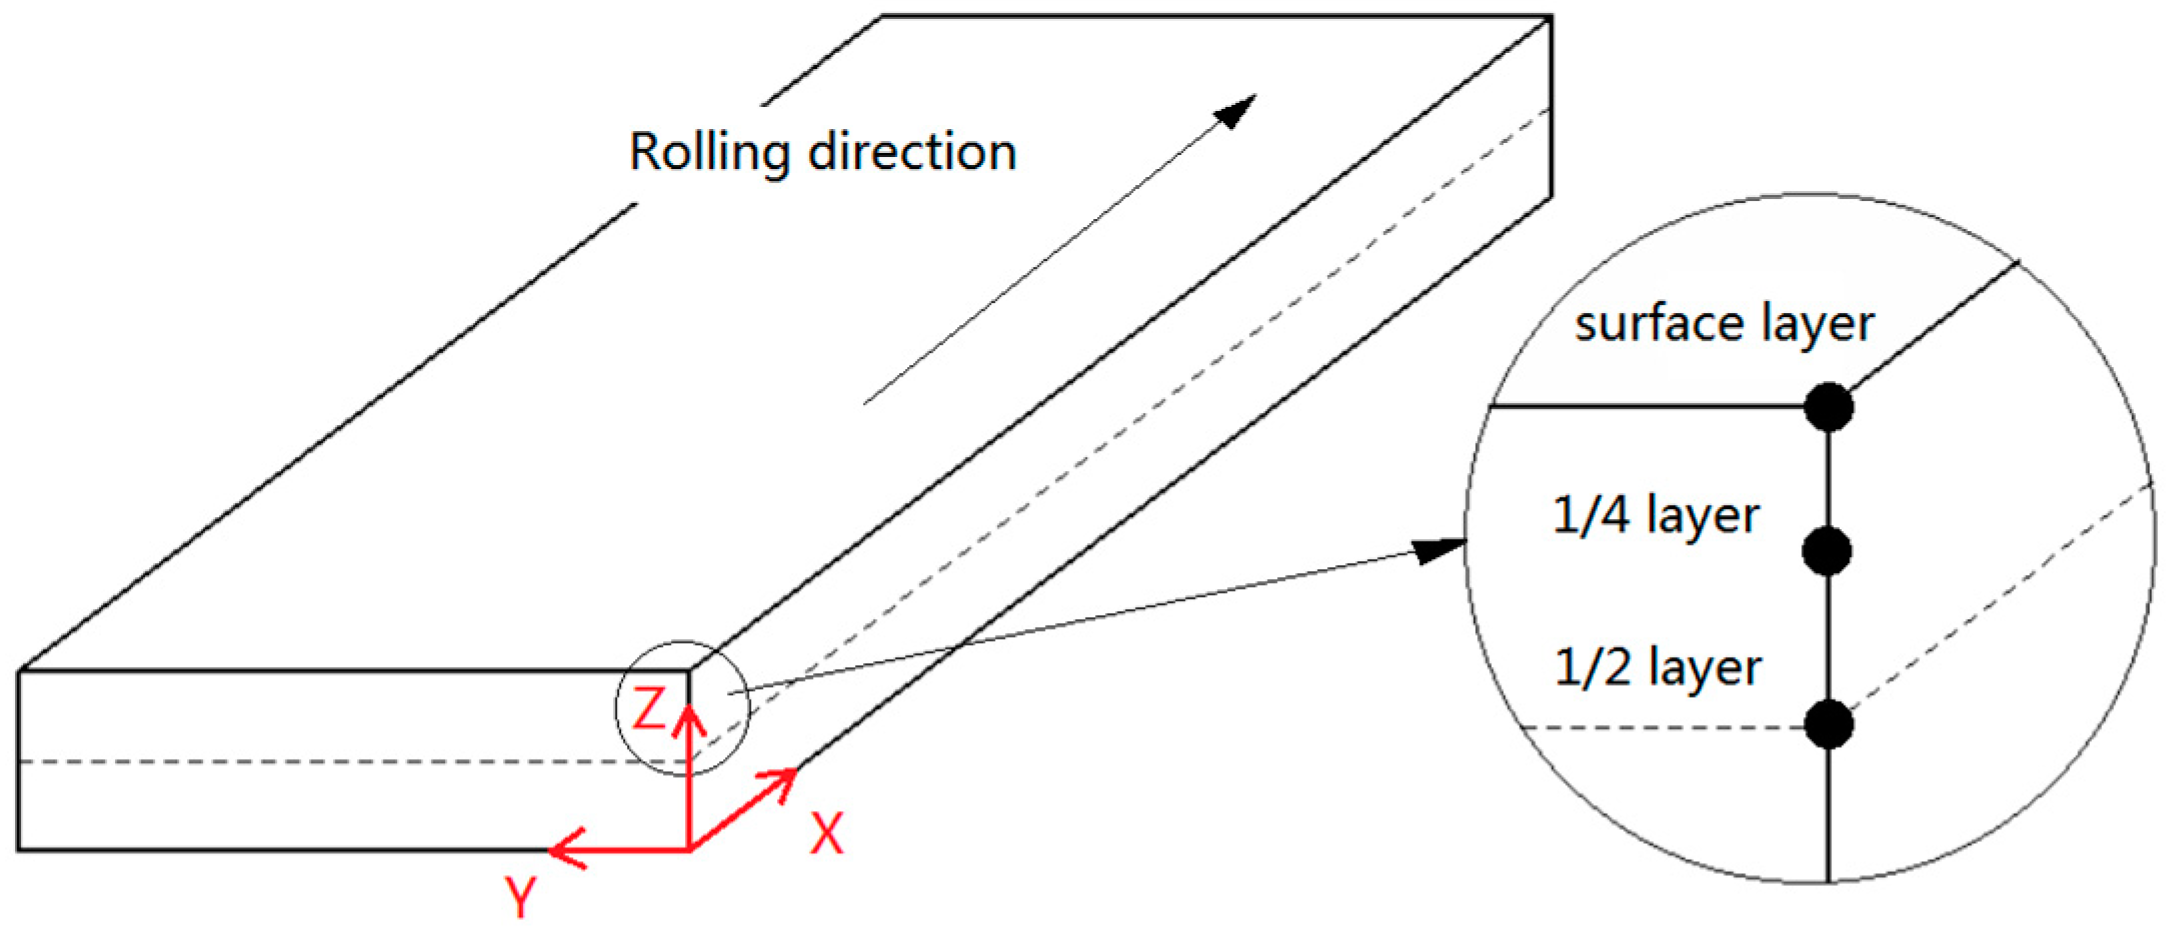
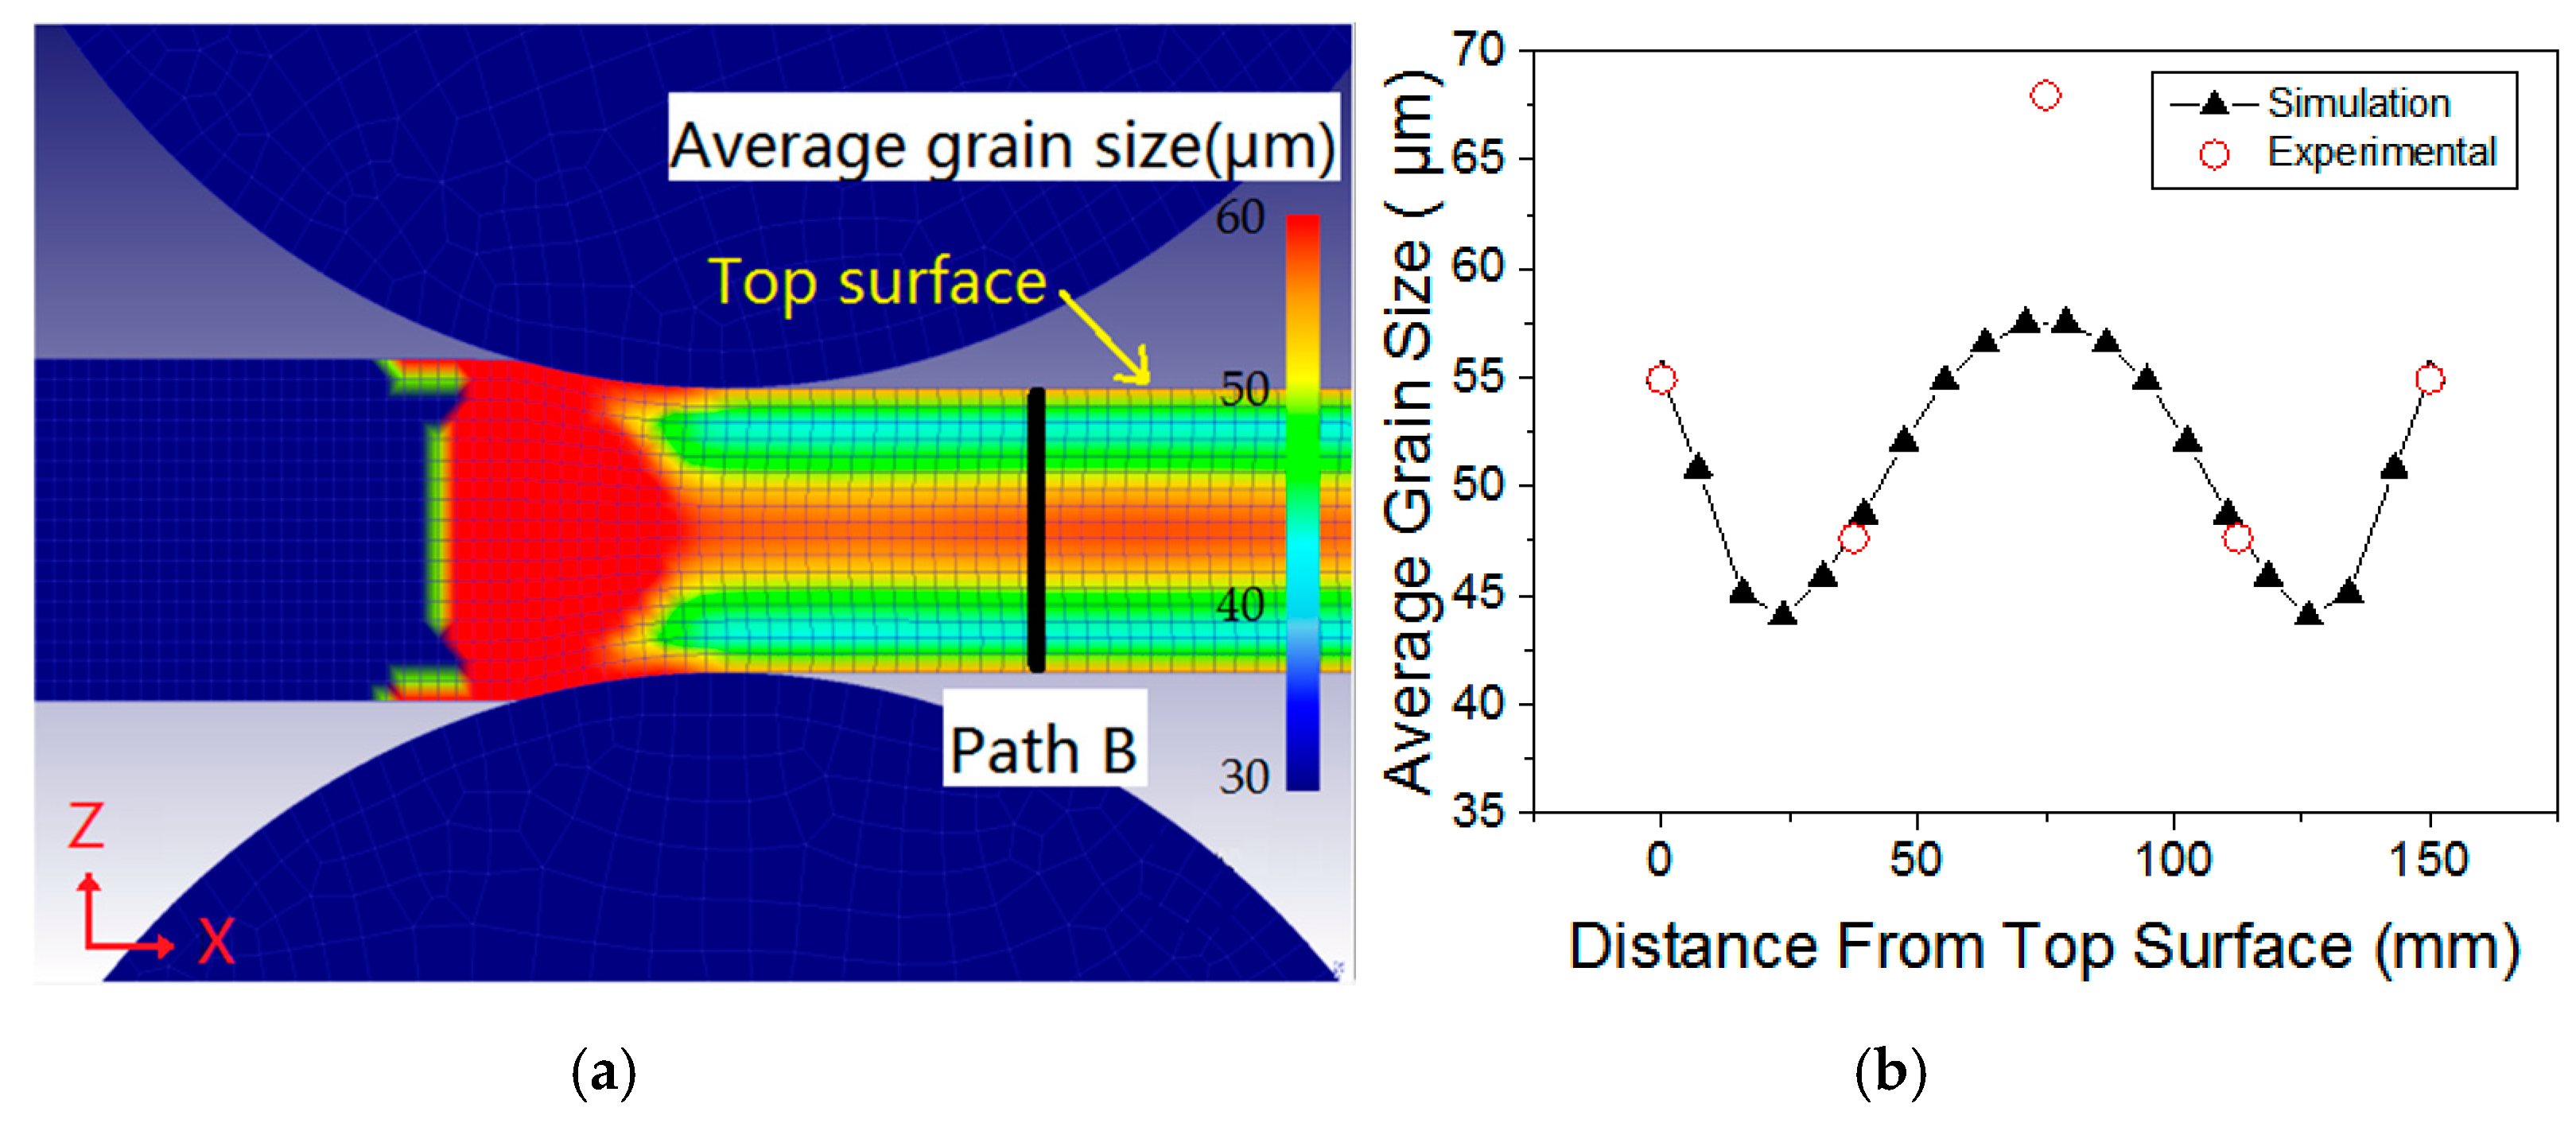
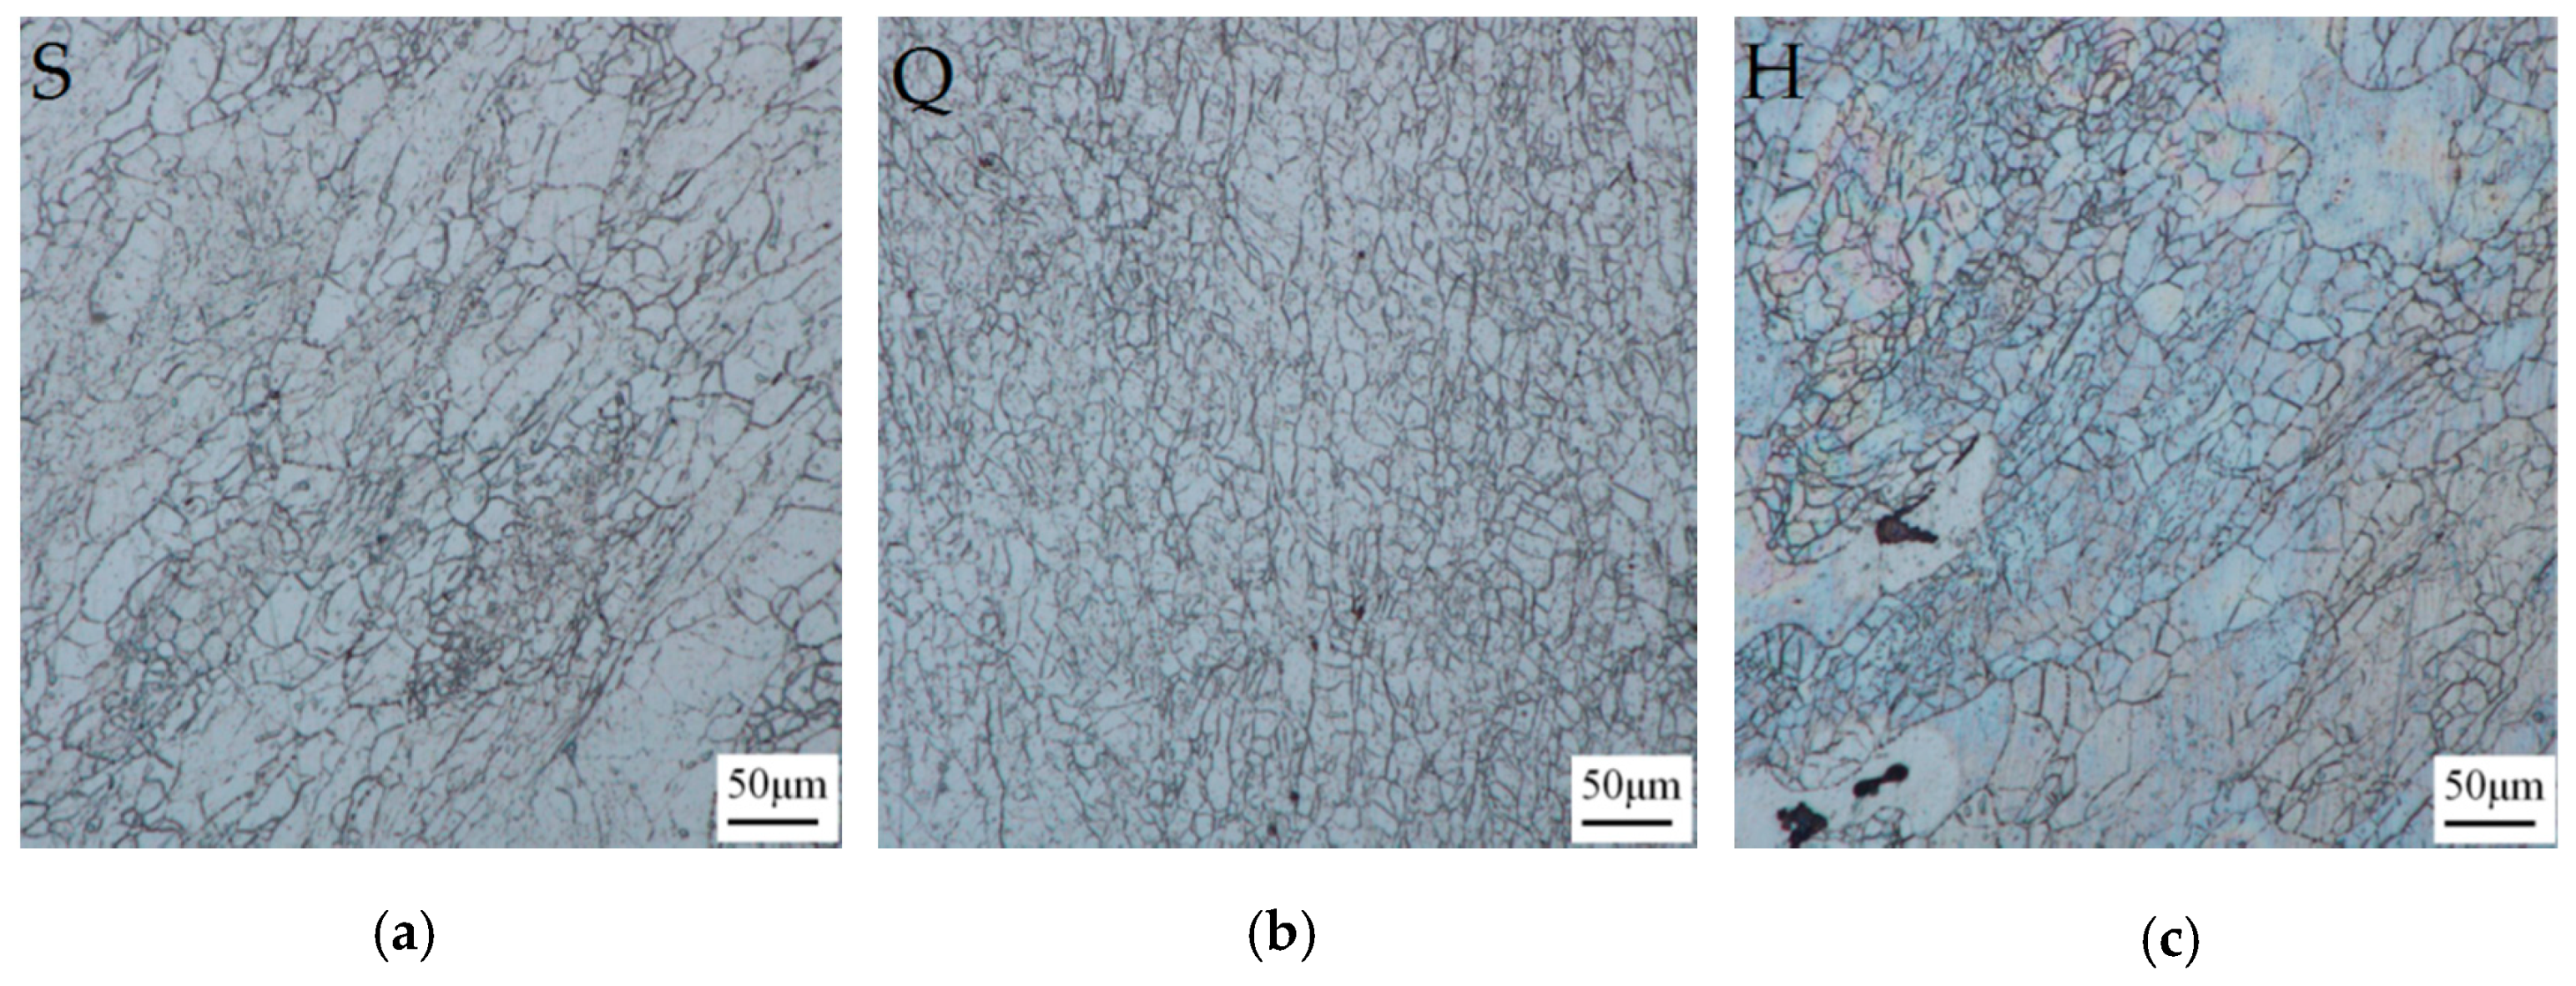
4.1. Average Grain Size Distribution along Plate Thickness Direction

Twenty sampling points at a spacing of 7.5 mm on path B (a through thickness path at the center of the length and width of the rolling plate) were selected for average grain size analysis, as shown in Figure 4a. The average grain size shows a W-shaped symmetrical distribution along path B, as shown in Figure 4b. The grain size from the surface layer to the center layer decreased firstly and then increased gradually. According to the experimental result, the actual average grain sizes of the S, Q, and H layer were 54.93 μm, 47.64 μm, and 67.97 μm, respectively. The microstructures of the S, Q, and H layer were shown in Figure 5, which shows that the grain size of Q layer is smaller than S and H layer, which is in agreement with the simulation result. In order to calculate the simulated yield strength, the relation between the grain size and the thickness obtained by the simulation can be expressed as Equation (1) ranging from S layer to H layer.
The variables are defined, as follows:
x(mm): the distance from top surface, φ (μm): the prediction value of average grain size.
φ = 52.8049 0.6505 x + 0.012 x 2
The distribution of temperature and equivalent strain at different layer of the plate during the hot rolling process was also plotted, as shown in Figure 6. The horizontal axis represents the time from initial change in temperature or equivalent strain until it reaches a steady state. Because the rolling speed in the simulation was 1 m/s, the temperature change in the 300 mm range of different layers of the rolled plate can be displayed (Figure 6a), while the equivalent strain in the 80 mm range of different layers can be displayed (Figure 6b).
It can be seen from Figure 6a that the temperature history of different layers of the plate was quite different during the rolling process. With the rolling process, the surface layer temperature rapidly dropped, because the surface layer of the plate was in direct contact with the rollers, the heat exchange increased and the temperature dropped significantly. On the contrary, the temperature of the subsurface layer and core layer raised in the early stage of rolling, as there was heat generated by plastic deformation without other energy loss. The reason temperature rise of the subsurface layer was larger than that of the core layer in the early stage of rolling is because more deformation heat was generated when the deformation of the subsurface layer was larger than that of the core layer (Figure 6b).
The strain history of different layers of the plate was quite different during the rolling process, as can be seen from Figure 6b. With the rolling process, the effective strain of all thickness layers increased obviously. The deformation of the surface layer was smaller than that of the subsurface layer because the friction hindered the flow of metal. While the compression deformation was difficult to affect the core, the core deformation was the least.
Furthermore, 20 sampling points at a spacing of 7.5 mm on path B were selected for dynamic recrystallization fraction analysis, and the result is shown in Figure 7. It can be seen from Figure 7 that the dynamic recrystallization fraction of different thickness layers is different due to the uneven temperature field and strain field of the plate during the rolling process, which shows a M-shaped symmetrical distribution along path B. Dynamic recrystallization is affected by the critical strain value, while a high temperature will reduce the critical strain value, which is conducive to the dynamic recrystallization. Recrystallization in the sub surface of the plate is most sufficient due to higher temperature and larger deformation. Recrystallization degree of the thick plate thickness center is the smallest, as deformation is difficult to penetrate into the center.
It can be concluded that the inhomogeneous rolling temperature and deformation are the important reasons for the inhomogeneous distribution of grain size. Among the three thickness layers, the plastic deformation of the subsurface layer was the largest, and the temperature was the highest in the rolling process. Therefore, the recrystallization of the subsurface layer was the most sufficient and the grain size was the smallest.

4.2. Yield Stress and Flow Stress Behavior

Yield strength is an important index for evaluating the mechanical properties of materials. The stress value is defined as the yield stress when 0.02% plastic strain occurs, as there is no obvious yielding stage in the process of deformation for aluminum alloy. The yield strength of each specimen was calculated according to the true stress-strain curves that are shown in Figure 8a. The values at S layer, Q layer, and H layer were 105.28 MPa, 114.05 MPa, and 108.45 MPa, respectively. Obviously, the yield strength at a different layer is different, which means that the properties of aluminum alloy 7050 are inhomogeneous in the thickness direction.
Figure 8b presents the true stress-strain curves of aluminum alloy 7050 plate at different temperatures with same strain rates. It can be seen from the figure that deformation temperature had an obvious effect on the flow stress behavior of aluminum alloy when the strain rate was equal, and the flow stress decreased with the increase of deformation temperature. The result was used to build the 7050 flow stress model corresponding to the FEM model described in Section 2.
When the deformation temperature increases from 30 °C to 150 °C, the true stress-strain curves can be divided into an elastic stage and stable deformation stage. The stress linearly increased with the increase of strain at the initial stage and then increased slowly because plastic deformation occurred.
When the temperature is between 250 °C and 450 °C, the deformation process can be divided into three stages: working hard stage (stage I), transition stage (stage II), and steady stage (stage III). In stage I, the rate of hardening is higher than the rate of softening and the flow stress increased rapidly with a small increase of the strain. This is because cross slip is the main softening mechanism in the early stage of deformation, the dislocation grows continuously, and the interaction between dislocations increases the resistance of dislocation movement. However, the softening that was caused by cross slip was not enough to overcome the hardening that was caused by the increase of dislocation density. Consequently, work hardening was dominant prior to peak stress. In stage II, the storage energy can become the driving force of recrystallization, which eliminates or changes the original deformation texture when the deformation reached the critical value, and then dynamic recrystallization softening occurred. In stage III, the softening rate was greater than the hardening rate, and the stress gradually decreased with the development of dynamic recrystallization, at the end of recrystallization, work hardening, and dynamic softening achieved a balance and the flow stress tends to a steady-state value.
It can be seen that the temperature change of the rolled plate in the hot rolling process influences the flow characteristics of the metal, which leads to the inhomogeneous deformation in the thickness direction of the rolled plate. On the other hand, the heat that is produced by plastic deformation and friction in the rolling process will also affect the temperature field distribution of the rolled sheet. In the end, the combined effect of these factors led to inhomogeneous mechanical properties in the thickness direction of the rolled plate.

4.3. Inhomogeneity of Mechanical Properties in Thickness Direction

Based on the results of the hot compression test, the strength distribution in the thickness direction of the aluminum alloy 7050 rolled plate can be plotted, as shown in Figure 9. In addition, it includes the yield strength that was calculated with the grain size fitting Equation (1) from the simulation. It can be seen that the yield strength increases first and then decreases from the surface layer to the core of the plate, and the yield strength reaches a maximum near the 1/4 layer. In terms of inhomogeneity, the experimental and simulation results both reflected that the mechanical properties of the material thickness have a greater relationship with the grain size distribution. Liang Zhou proposed the concept of inhomogeneity of performance by using the relatively extreme yield strength in the thickness direction [19]. Based on this, the relationship between the grain size and the inhomogeneity of the mechanical properties was established, and a method for measuring the inhomogeneity of the mechanical properties in the thickness direction of the aluminum alloy 7050 rolled plate was proposed.
The Hall–Petch relationship can describe the grain size strengthening for the plastic forming stage of aluminum alloy [20], which suggests that the yield strength increases with a decreasing grain size according to Equation (2).
σ s = σ 0 + K ϕ 1 / 2
σ s is the yield strength and φ is the average grain size. Typically, σ 0 is rationalized as either a frictional stress resisting the motion of gliding dislocations or as an internal back stress. For aluminum alloys, it is approximately equal to the yield strength of single crystalline aluminum. K is the Hall-Petch slope that is considered a measure of the resistance of the grain boundary to slip transfer. K value is usually 50–72 for the materials studied in this experiment. According to the distribution rule of grain size in the thickness direction of 7050 rolled plate that was obtained by simulation, the average grain size φ can be calculated by Equation (1).
Subsequently, the inhomogeneity Q of the mechanical properties of the aluminum alloy 7050 in the thickness direction can be calculated by Equation (3).
Q = α σ s max σ s min σ ¯ s
α is a correction coefficient. σ s max and σ s min are the maximum and minimum values of yield strength, respectively. σ ¯ s is an average value of the yield strength in the thickness direction, which is determined with Equation (4).
σ ¯ s = 0 H / 2 σ s d x H / 2
Based on the analysis above, the inhomogeneity of the simulated aluminum alloy 7050 plate is approximately 8.7%, and the error is only 5.3% compared with the inhomogeneity acquired from the experimental data, which shows that the method can effectively predict the inhomogeneity of the aluminum alloy 7050 plate.
When compared with the detailed characterization of average pass reduction ratio (APRR) [19], the grain size is better to predict the properties of 7050 alloy hot rolling plate. Therefore, the inhomogeneity of its mechanical properties along the thickness direction can be determined by evaluating the grain size distribution along the thickness direction of aluminum alloy 7050 thick plate.

5. Conclusions

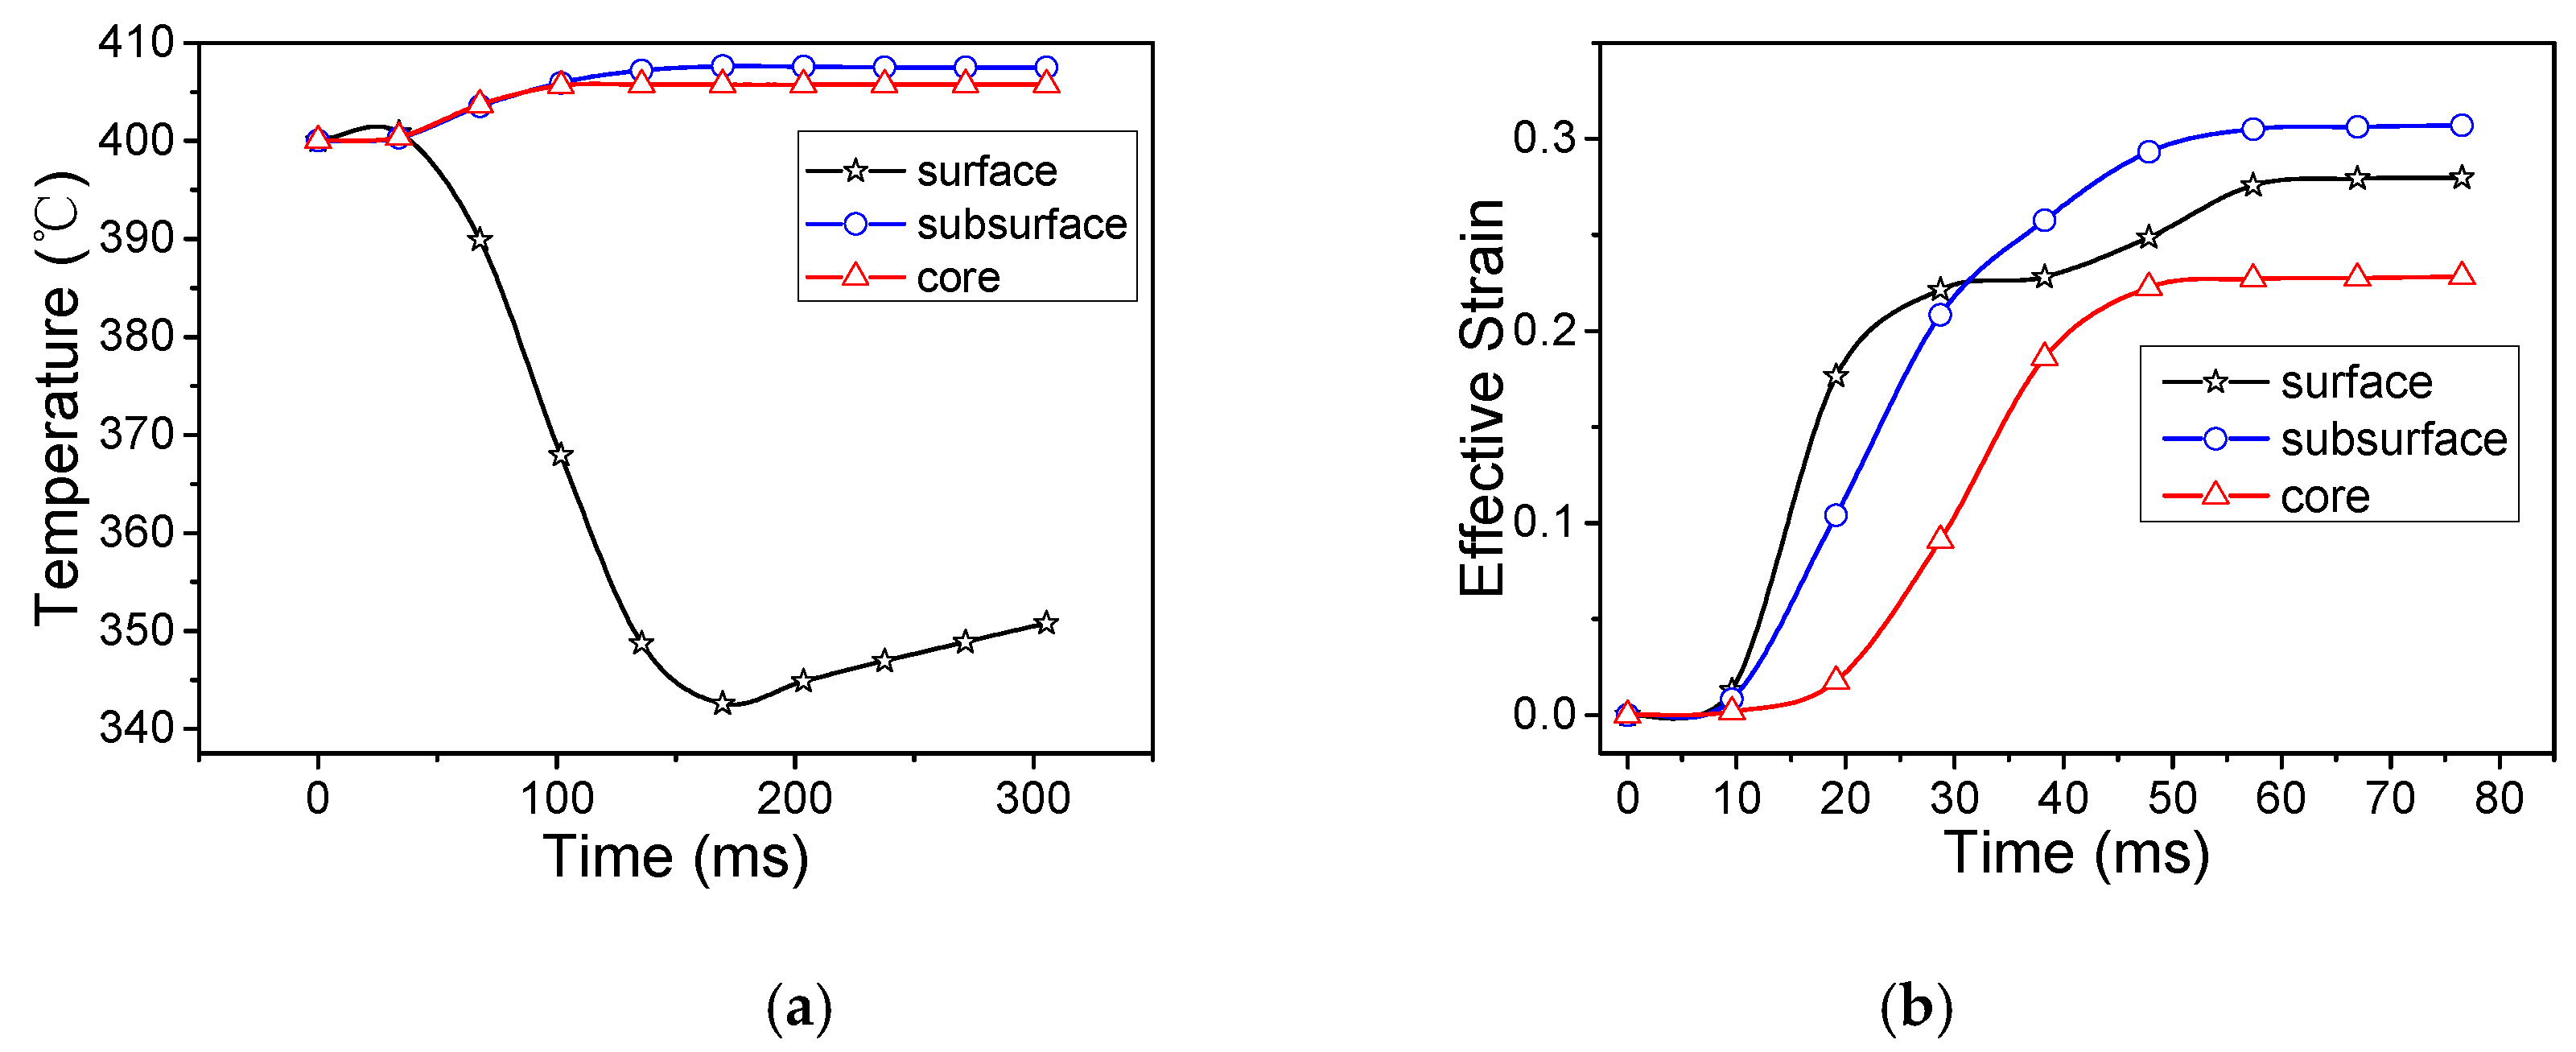
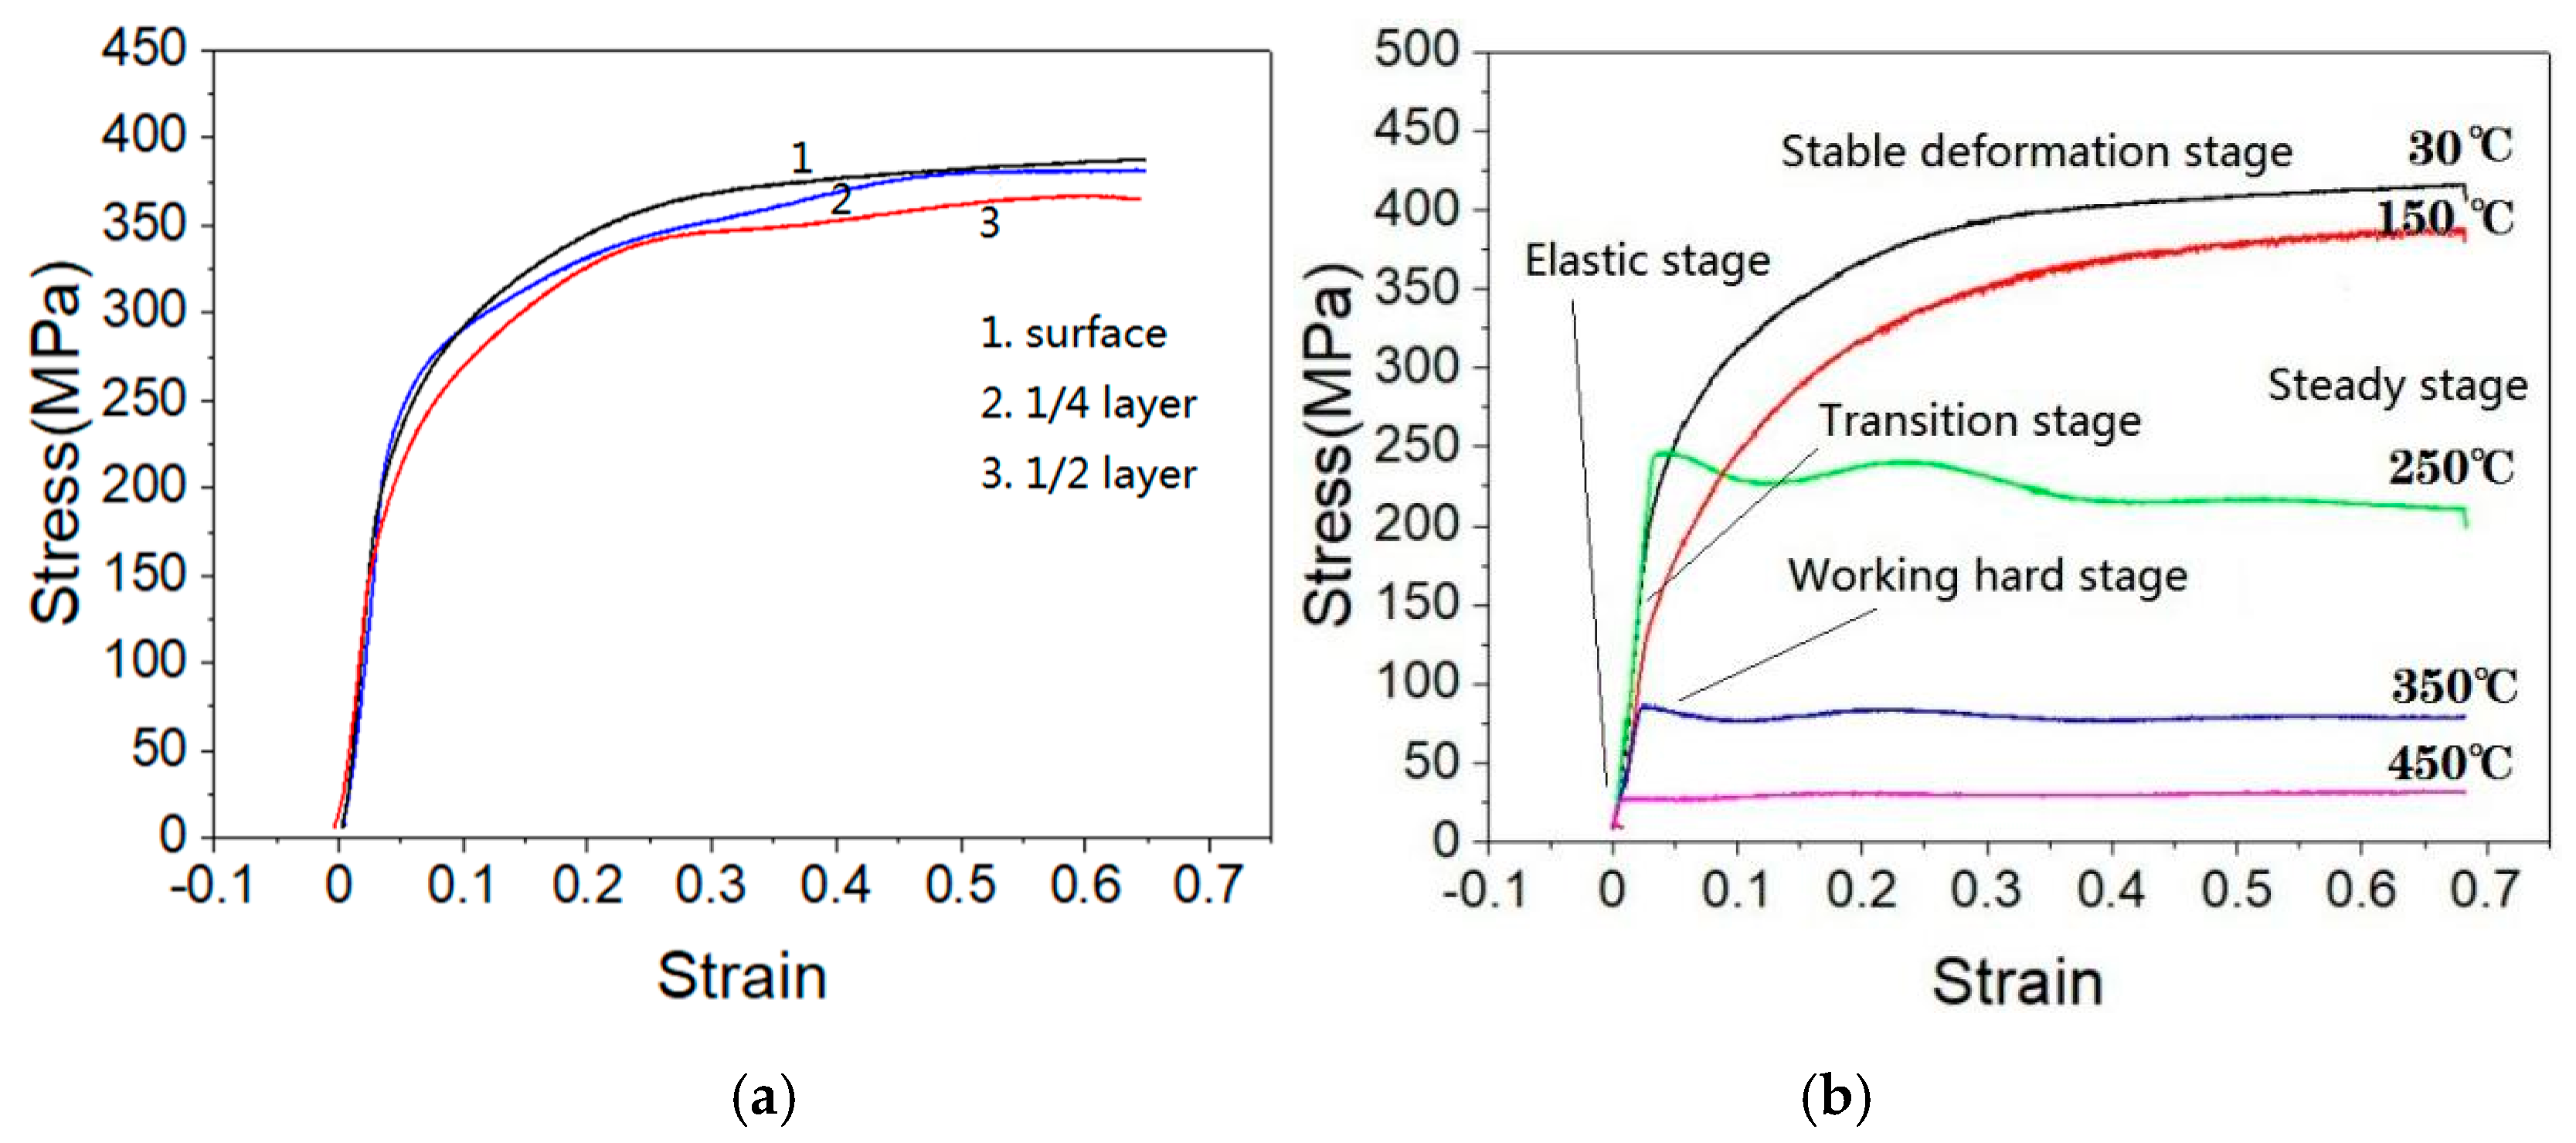
  • The hot compression deformation of 7050 aluminum alloy is contained of transition stage and steady state, which has obvious dynamic recovery and recrystallization. When the temperature is lower than 250 °C, the dynamic recovery is dominant, and the dynamic recrystallization is dominant at 350–450 °C. For the rolling process, the temperature is above 350 °C, the grain size is mainly influenced by dynamic recrystallization and the friction on the plate surface.
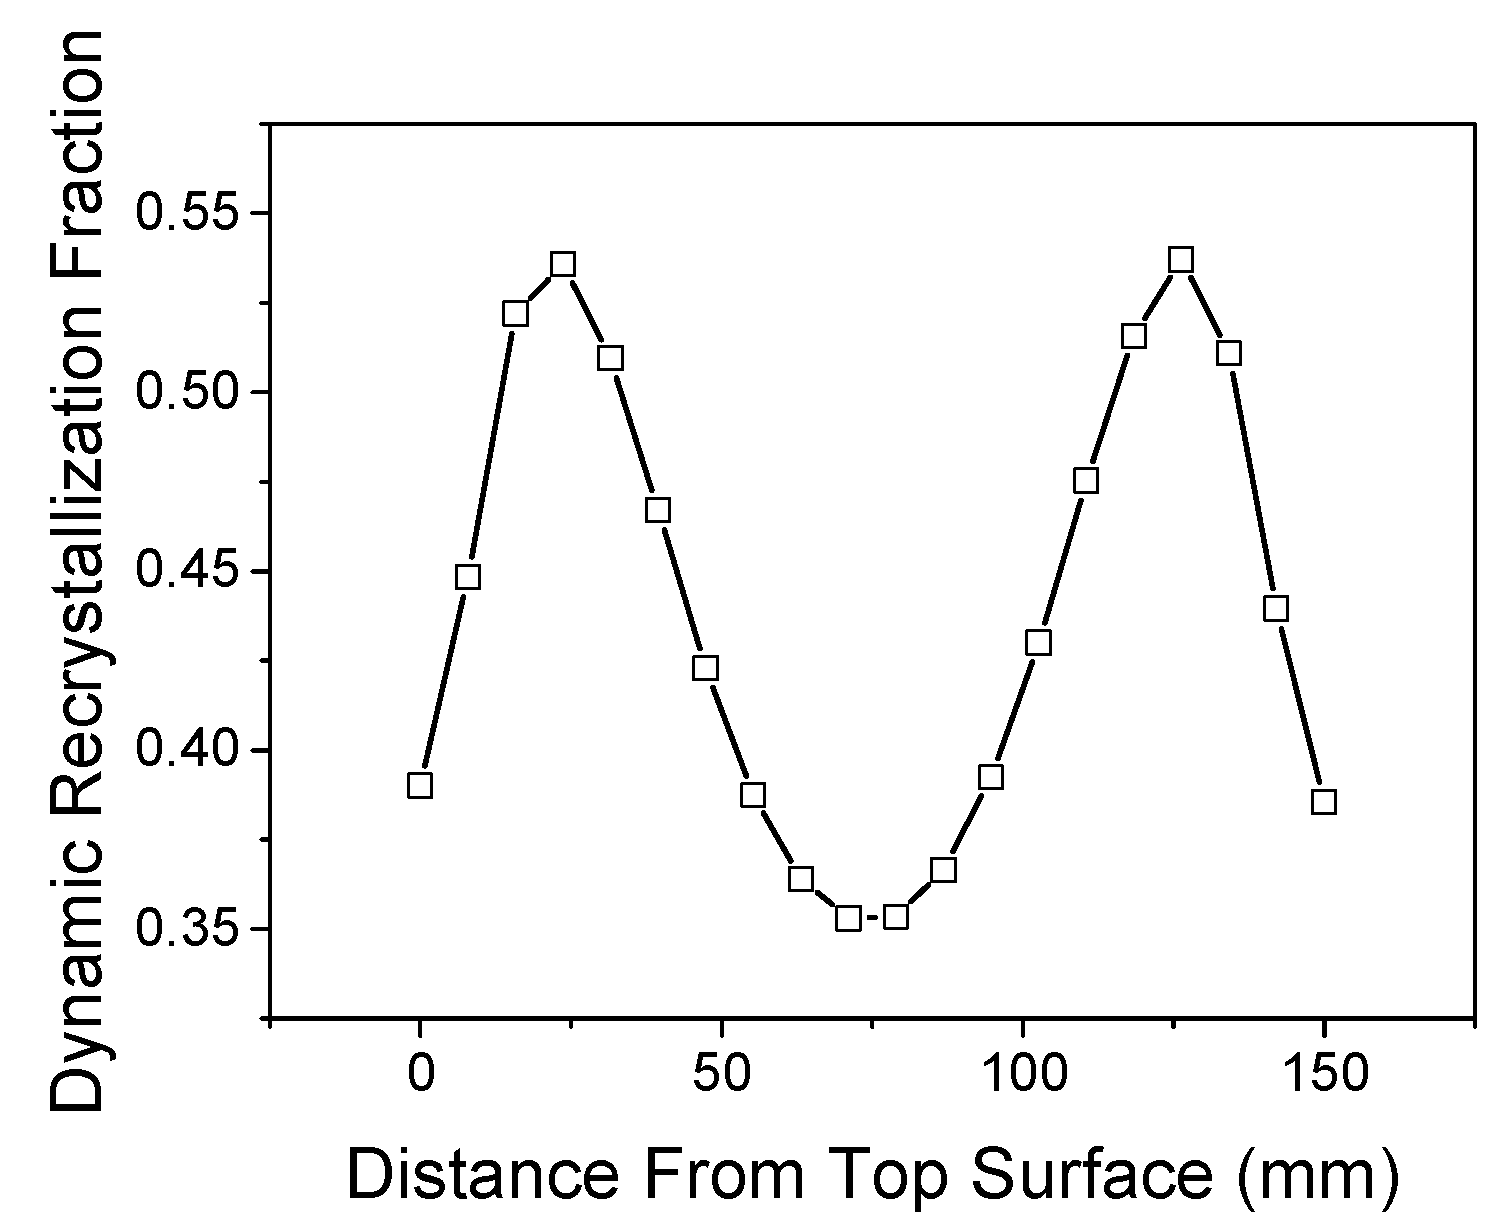
  • The distribution of grain size and yield strength along the thickness of symmetrically rolled aluminum plate is symmetrical. The grain size distribution of 7050 aluminum alloy plate is W-shaped in the thickness direction. During the rolling process, the distribution of temperature field and strain field along the thickness direction of the aluminum alloy plate is inhomogeneous, which results in the inhomogeneous distribution of the dynamic recrystallization fraction along the thickness direction, affects the distribution of the grain size along the thickness direction of the plate, and finally leads to the inhomogeneous property of the material.
  • The inhomogeneity of the mechanical properties in the thickness direction of the plate can be evaluated with the grain size. The aluminum alloy 7050 sheet with a 150 mm thickness was measured and predicted; the results show that the predicted inhomogeneity reached 8.7%, and the difference was about 5.3% compared with that of experimental value. It can provide reference for performance analysis of an aluminum alloy rolled plate.

Author Contributions

Conceptualization: H.G., X.C., Y.L., Y.W.; Validation: H.G., X.C., Y.L., Y.W., F.J., M.Z.; Formal analysis: H.G., X.C., M.Z.; Investigation: H.G., X.C., Y.L., F.J., M.Z.; Writing-Review and Editing: H.G., X.C.; Supervision: Y.W. All authors have read and agreed to the published version of the manuscript.

Funding

This study was funded by the National Natural Science Foundation of China (Grant Number: 51327902, U1637601).

Conflicts of Interest

The authors declare no conflict of interest.

References

  1. Fan, J.; Li, F. Study of Local Cold Working and Tensile Test for 7050 High Strength Aluminum Alloy Hole Plate. Rare Met. Mater. Eng. 2012, 41, 978–982. [Google Scholar]
  2. Wang, D.; Ma, Z.Y.; Gao, Z.M. Effects of severe cold rolling on tensile properties and stress corrosion cracking of 7050 aluminum alloy. Mater. Chem. Phys. 2009, 17, 228–233. [Google Scholar] [CrossRef]
  3. Han, N.M.; Zhang, X.M.; Liu, S.D. Effect of solution treatment on the strength and fracture toughness of aluminum alloy 7050. J. Alloys Compd. 2011, 509, 4138–4145. [Google Scholar] [CrossRef]
  4. Chen, K.; Liu, H.; Zhang, Z. The improvement of constituent dissolution and mechanical properties of 7050 aluminum alloy by stepped heat treatments. J. Mech. Process. Technol. 2003, 142, 190–196. [Google Scholar] [CrossRef]
  5. Mondal, C.; Mukhopadhyay, A.K.; Raghu, T. Tensile properties of peak aged 7055 aluminum alloy extrusions. Mater. Sci. Eng. 2007, A454, 673–678. [Google Scholar] [CrossRef]
  6. Yan, L.; Iian, S.; Li, Z. Effect of deformation temperature on microstructure and mechanic properties of 7050 aluminum alloy after heat treatment. Trans. Nonferrous Met. Soc. China 2013, 23, 625–630. [Google Scholar] [CrossRef]
  7. Dixit, M.; Mishra, R.S.; Sankaran, K.K. Structure–property correlations in Al 7050 and Al 7055 high-strength aluminum alloys. Mater. Sci. Eng. A 2008, 478, 163–172. [Google Scholar] [CrossRef]
  8. Zhang, J.X.; Ma, M.; Liu, W.C. Effect of initial grain size on the recrystallization and recrystallization texture of cold-rolled AA 5182 aluminum alloy. Mater. Sci. Eng. A 2017, 690, 233–243. [Google Scholar] [CrossRef]
  9. Ma, C.Q.; Hou, L.G.; Zhang, J.S. Influence of thickness reduction per pass on strain, microstructures and mechanical properties of 7050 Al alloy sheet processed by asymmetric rolling. Mater. Sci. Eng. 2016, 6505, 454–468. [Google Scholar] [CrossRef]
  10. Hao, A.G.; Ji, W.; Hao, H.L. A Study on Thermal Deformation Behavior and Machining Diagram of 7050 Aluminum Alloy. Hot Process 2018, 47, 141–144. [Google Scholar]
  11. Zhou, G.J.; Tang, J.G. Evolution of microstructure and texture of cast-rolled sheet in asynchronous rolling. Hot Process 2017, 46, 24–27. [Google Scholar]
  12. Yang, Y.B.; Zhang, Z.; Li, X. The effects of grain size on the hot deformation and processing map for 7075 aluminum alloy. Mater. Des. 2013, 51, 592–597. [Google Scholar] [CrossRef]
  13. Yu, X.W.; Chen, J.H.; Li, J.Y.; Wu, C.L. Effect of pre-deformation on quench-induced inhomogeneity of microstructure and hardness in 7050 aluminum alloy. Mater. Charact. 2019, 158, 110005. [Google Scholar] [CrossRef]
  14. He, J.G.; Wen, J.B. Hot Deformation Behavior and Processing Map of Cast 5052 Aluminum Alloy. Procedia Manuf. 2019, 37, 2–7. [Google Scholar] [CrossRef]
  15. Senuma, T.; Yada, H.; Yoshimura, H. Deformation Resistance and Recrystallization of Commercially Pure Titanium in the High Strain Rate Hot Deformation. Adv. Mater. Res. 1986, 626, 430–435. [Google Scholar]
  16. Liao, S.; Zhang, L.W. Two-dimensional and three-dimensional simulation of continuous rolling process of GCr15 bearing steel bars. Spec. Steel 2007, 05, 31–33. [Google Scholar]
  17. Li, A. Rheological behavior 7axx aluminum alloys under thermal compression. At. Energy Sci. Technol. 2019, 53, 504–510. [Google Scholar]
  18. Xiong, S.W.; Pan, Q.L.; Zhang, H.; Fan, X. Heat Deformation Behavior and Microstructure Evolution of Jet Forming 7055 Aluminum Alloy. Chin. J. Nonferrous Met. 2018, 28, 863–871. [Google Scholar]
  19. Zhou, L.; Chen, S.; Chen, K. Effect of average pass reduction ratio on thickness-oriented microstructure and properties homogeneity of an Al–Zn–Mg–Cu aluminum alloy thick plate. Appl. Phys. A 2019, 125, 387. [Google Scholar] [CrossRef]
  20. Hirota, N.; Yin, F.X.; Azuma, T.; Inoue, T. Yield stress of duplex stainless steel specimens estimate using a compound Hall–Petch equation. Taylor Fr. Group 2010, 11, 025044. [Google Scholar]
Figure 1. Deform modeling process.
Metals 10 00515 g001
Figure 2. Sampling location.
Metals 10 00515 g002
Figure 3. Specimen preparation process. (a) 7050-T7451 aluminum alloy plate; (b) aluminum alloy cylinder; (c) compression specimen.
Metals 10 00515 g003
Figure 4. Distribution of average grain size in thickness direction of hot rolled plate. (a) FEM model of thick plate hot rolling; (b) distribution of average grain size.
Metals 10 00515 g004
Figure 5. Microstructures of hot rolled aluminum alloy 7050 plate. (a) Top surface; (b) 1/4 layer; (c) 1/2 layer.
Metals 10 00515 g005
Figure 6. Distribution of temperature and equivalent strain of different layers of plate during the rolling process. (a) Temperature; (b) effective strain.
Metals 10 00515 g006
Figure 7. The distribution of dynamic recrystallization fraction.
Metals 10 00515 g007
Figure 8. True stress-strain curves. (a) Compression specimens of different layers at room temperature; (b) compression specimens of surface layer at different temperatures.
Metals 10 00515 g008
Figure 9. The strength distribution in the thickness direction.
Metals 10 00515 g009
Table 1. The Main rolling Parameters.
Rolling ParametersValue
Rolling temperature (t/°C)400
Roller radius (r1/mm)500
Roller speed (ω1/s−1)2
Length (L/mm)1500
Friction coefficient(m)0.4
Thickness (H/mm)180
Reduction (Δh/mm)30
Radiation and convective HTC (h1/W·m2·K−1)5
Contact HTC (h2/W·m2·K−1)30,000
Table 2. The chemical composition of aluminum alloy 7050.
CompositionTiFeCuMgZrZnAl
Wt %0.060.152.62.60.136.7Bal.

