Article

Thickness Effect on Microstructure, Strength, and Toughness of a Quenched and Tempered 178 mm Thickness Steel Plate

The State Key Laboratory of Rolling and Automation, Northeastern University, Shenyang 110819, China
*
Author to whom correspondence should be addressed.
Metals 2020, 10(5), 572; https://doi.org/10.3390/met10050572
Submission received: 27 March 2020 / Revised: 22 April 2020 / Accepted: 27 April 2020 / Published: 28 April 2020

Abstract

:
We investigate here the thickness effect on microstructures and mechanical properties of a quenched and tempered 178 mm thickness ASTM A517 GrQ steel. The microstructures at sub-surface, 1/4 thickness (t/4), and 1/2 thickness (t/2) were characterized. A comparison of hardness, strength, and impact toughness of the different positions shows that the lowest strength and toughness occurred at t/2, where a mixture of coarse, tempered martensite and bainite were found, and their inter-lath boundaries were occupied with highly dense, film-like or coarse, spheroidized carbides. The cooling rate for transformation was measured to be 0.6 °C/s at t/2 from the industrial processing data. In addition, the alloy elements at t/2 were heavily segregated, as revealed by electron probe microanalysis (EPMA) and a microhardness test. The resulted coarse microstructures thus lowered both the yield strength and the impact energies significantly, e.g., the crack propagation energy was completely lost at −60 °C. This study correlates the variation of mechanical properties to varied transformed microstructures based on the industrial quenching condition, which shows promise for improving the designing of the hardenability and controlling the carbides for ultra-thick quenched and tempered steel.

1. Introduction

Quenched and tempered steel plates with 178 mm thickness have been used for building jack-up legs of 400 ft offshore platforms and offshore wind power installation vessels, which are usually certificated as ASTM A517 GrQ Modified grade. The basic mechanical properties include yield strength not less than 690 MPa, Charpy impact energies not less than 69 J at −40 °C or even −60 °C, and area reduction not less than 35% for Z-direction tensile testing [1,2,3,4]. To satisfy these rigorous requirements, alloying for high hardenability, high-quality ingot casting, controlled rolling, and improved quenching capability are of equal importance. In order to increase hardenability, many alloying elements such as chromium, molybdenum, and nickel need to be added, which will consequently cause severe segregation during ingot casting—in particular much worse for larger ingots [5,6,7]. With a limited ingot-to-plate reduction ratio, controlled rolling is also a big challenge for conducting enough deformation at the middle thickness to break down solidification structures. Lastly, the cooling rates at the middle thickness will be dramatically dropped to less than 1 °C/s, no matter how severely quenched it is, resulting in a reduction of martensite content [8]. Thus, producing such high-strength, high-toughness, and heavy-gauge steel plates has been one of the greatest challenges faced by steel producers. The major one is to guarantee the properties at the middle thickness under the limited quenching capability due to thickness effect [5,9]. It is therefore of great importance to understand the thickness effect on the microstructures and properties for processing improvement.
In this paper, we investigated the microstructure, strength, and impact toughness at the sub-surface, 1/4 thickness (t/4), and 1/2 thickness (t/2) of an industrial quenched and tempered 178 mm thickness ASTM A 517 GrQ Modified steel plate. The mechanism of deteriorated toughness of the middle thickness was particularly discussed by evaluating the segregation and the limited quenching capability on transformation behavior and the resulting microstructure and carbide precipitation.

2. Materials and Methods

The investigated material was taken from a 178 mm thickness, quenched and tempered (Q and T) A 517 GrQ modified steel plate, which was produced by an industrial process of mold ingot casting, hot rolling, and quenching and tempering. The chemical composition from heat analysis is listed in Table 1.
The microstructures were characterized using optical microscopy (OM), scanning electron microscopy (SEM), electron back-scattered diffraction (EBSD), and transmission electron microscopy (TEM), respectively. The specimens were taken from the sub-surface, t/4, and t/2 positions of the plate, and were prepared by the respective standard processes. The longitudinal cross-section specimens for OM and SEM were mechanically grinded, polished, etched by 4% nital solution, and then observed by an Olympus BX53MRF metalloscope (Olympus Inc., Kyoto, Japan) and a Zeiss Ultra-55 scanning electron microscope (SEM) (Carl Zeiss AG, Jena, Germany). The crystallographic characterizations were performed using an SEM equipped with an EBSD system and Channel 5 software (version 5.0.9.0, OXIG Co. Ltd., Oxford, UK). The more detailed microstructures were characterized using an FEI Tecnai G2 F20 field-emission transmission electron microscope (FEI Co. Ltd., Hillsboro, OR, USA) equipped with energy-dispersive spectrometry (EDS). Thin foils of ~45 μm thickness for the TEM were prepared in a twin-jet electrolytic apparatus using a solution of 8% perchloric acid and 92% ethanol at −30 °C.
The segregation at t/2 of the plate was analyzed by Jeol JXA 8530F electron probe microanalysis (EPMA) (Jeol Co. Ltd., Kyoto, Japan) on microscale and optical emission spectrometry (OES) on macroscale. A D/max2400 X-ray diffractometer (XRD) (Rigaku Corporation, Tokyo, Japan) was used to evaluate the volume fraction of austenite and dislocation density of the different positions.
During the quenching of the plate by a newly developed industrial roller quenching machine, the temperatures were recorded by inserted thermocouples at the sub-surface, t/4, and t/2. The continuous cooling transformations were characterized using a Formastor-FII dilatometer (FUJI Electronic Industrial Co., Ltd., Tokyo, Japan), with cylinder specimens of 3 mm diameter and 10 mm length. The samples were austenitized at a heating rate of 5 °C/s to 900 °C for 300 s, followed by cooling procedures at eight varied cooling rates from 0.1 °C/s to 20 °C/s using nitrogen as the refrigerant.
The standard tensile testing was carried out for the sub-surface, t/4, and t/2 specimens with the long axis transverse to the rolling direction at room temperature. Vickers hardness was also measured across the thickness under a load of 300 g and a dwell time of 15 s. The Charpy impact tests of the sub-surface, t/4, and t/2 were conducted using an Instron SI-IM Canton MA impact machine (Instron, Norwood, MA, USA), with 10 mm × 10 mm × 55 mm specimens longitudinal to the rolling direction (T-L orientation). The Charpy V-notch energies (CVN) were obtained at temperatures ranging from 0 °C to −120 °C. In addition, the instrumented impact testing at −60 °C was performed to analyze the impact crack initiation and propagation stages using an Instron Dynatup 9200 instrumented impact tester (Instron, Norwood, MA, USA) equipped with an oscilloscope.

3. Results

3.1. Microstructural Characterization
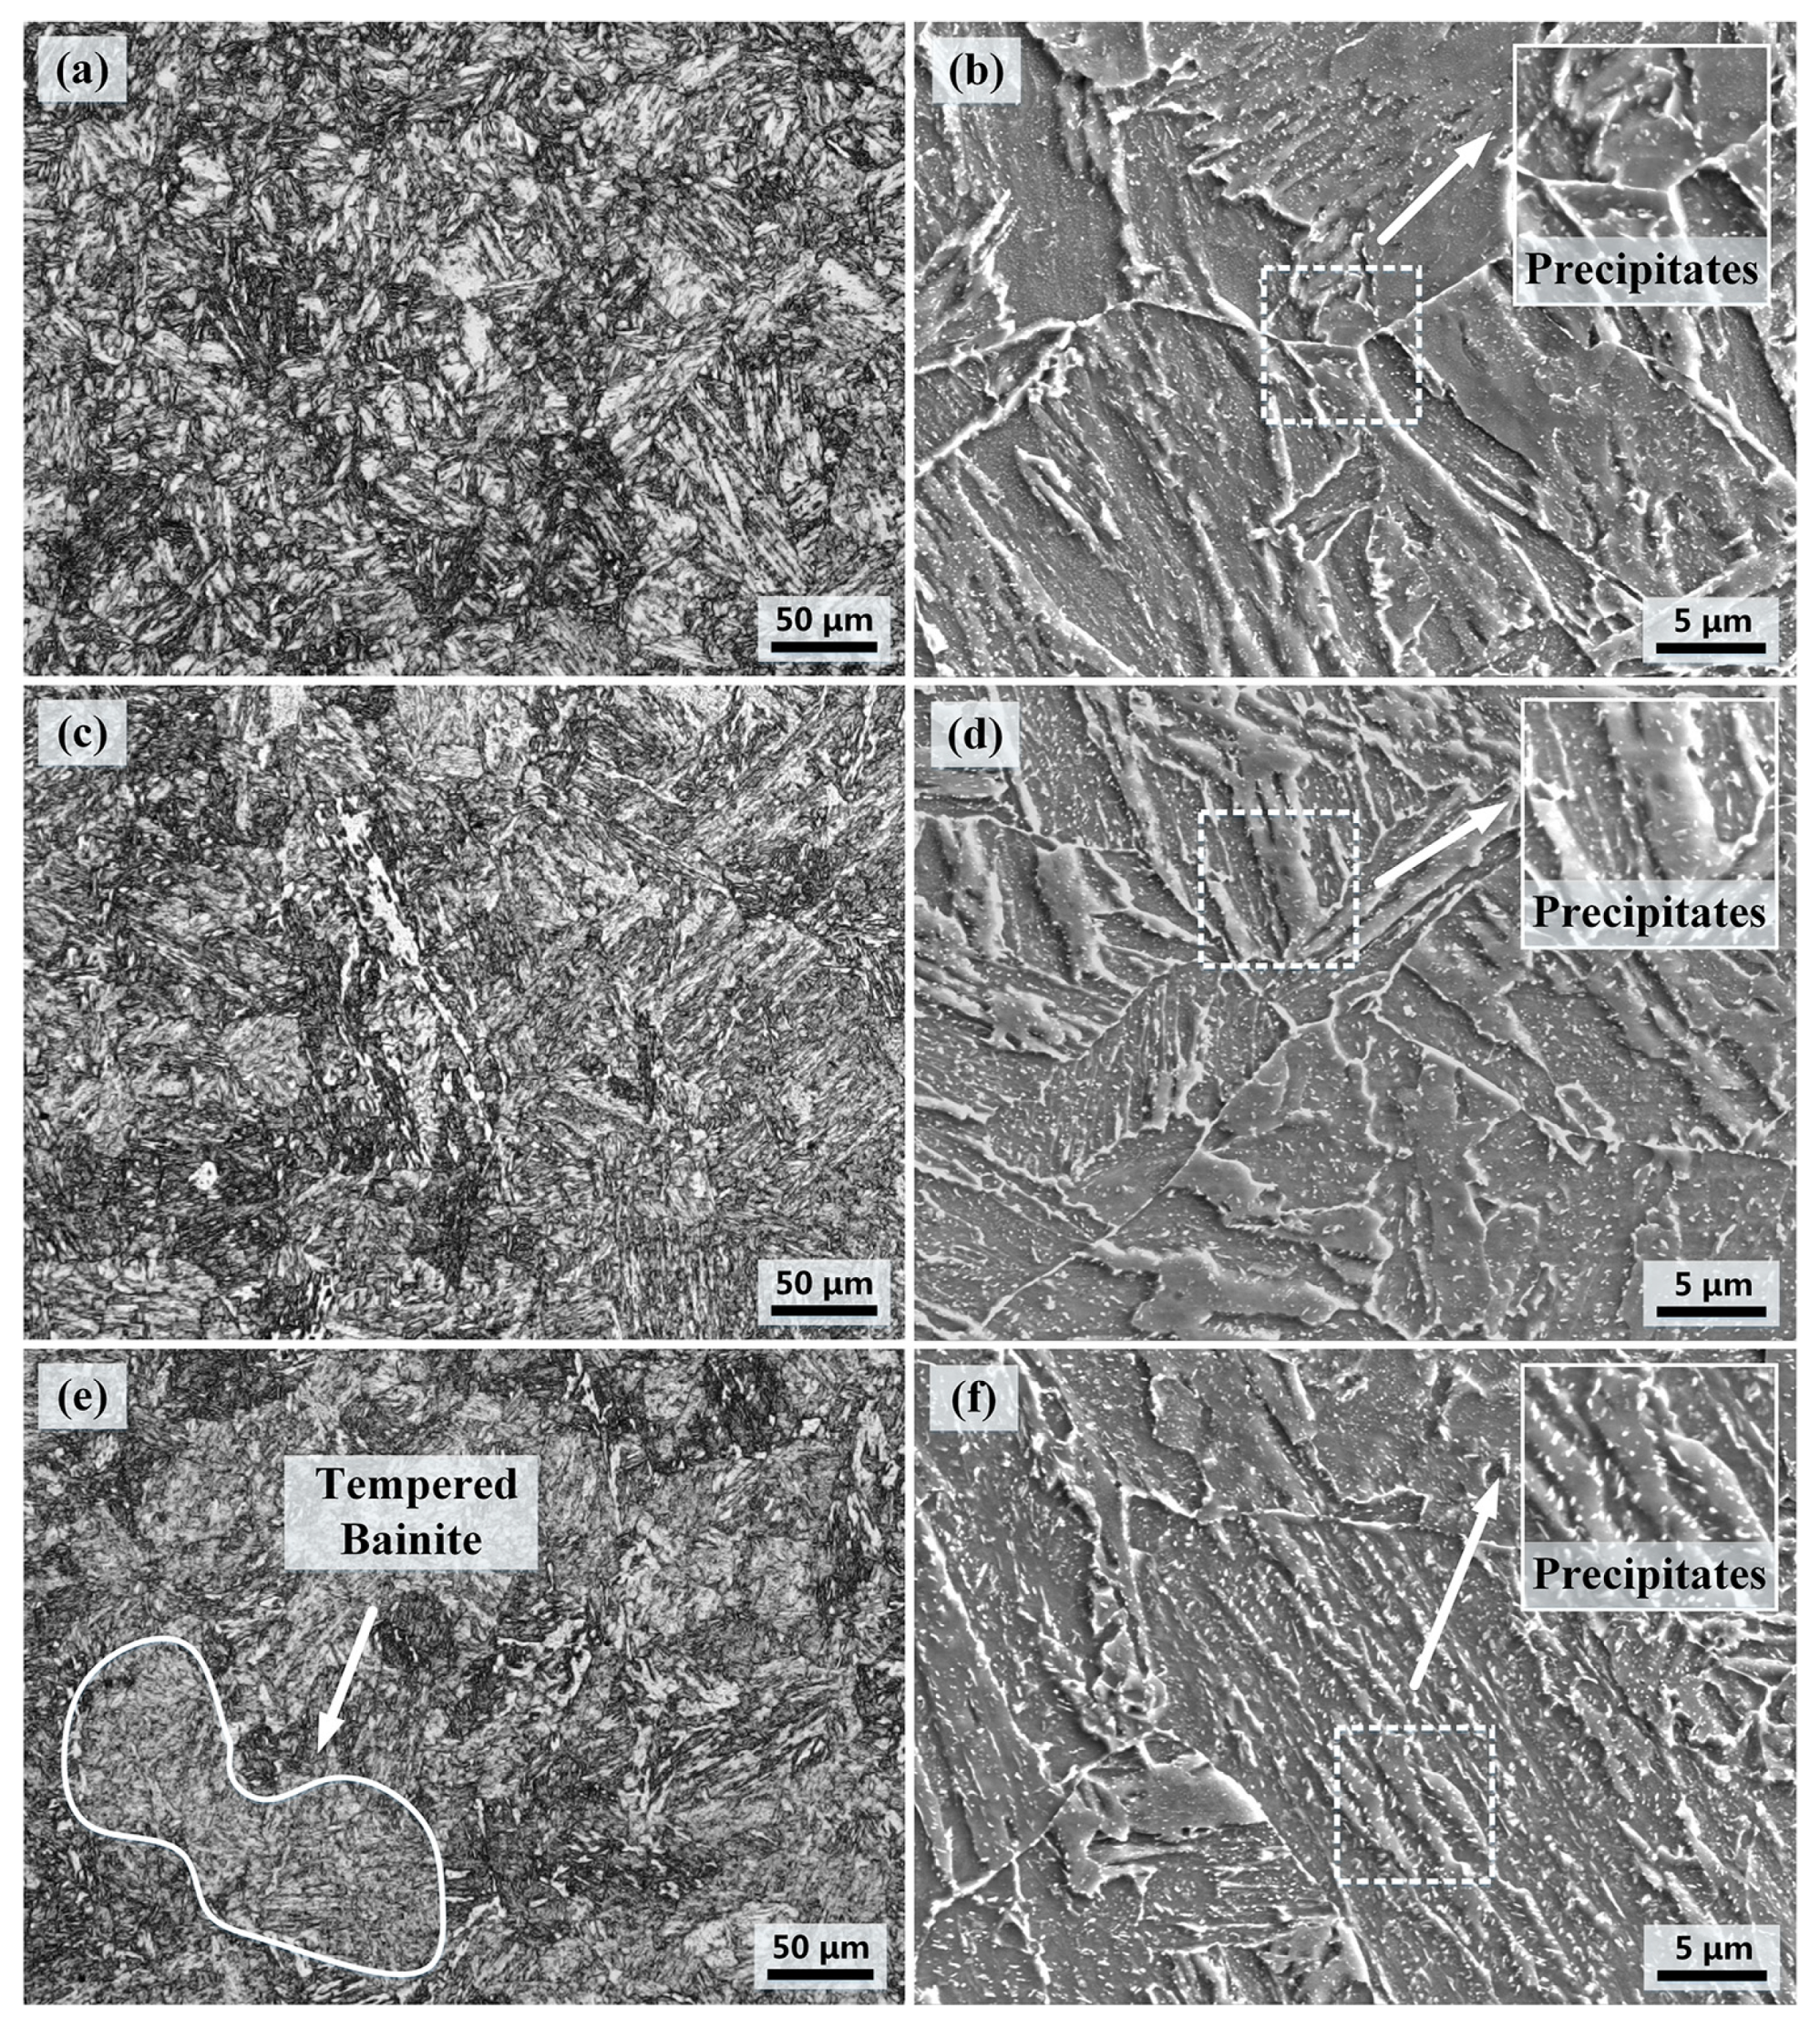
3.1.1. OM and SEM

Figure 1 shows OM and SEM micrographs of the sub-surface, t/4, and t/2 positions of the as-received Q and T steel plate. The variation in fraction of tempered martensite, and its size and morphology of tempered microstructure is considerable among the positions across the thickness direction. At the sub-surface and t/4, fine-scale tempered lath martensite was fully obtained, while at t/2, other than tempered martensite, tempered bainite also appeared and its fraction was estimated to be around 25%.
Figure 1b,d,f show that carbide precipitates were the largest at t/2, where inner-lath, short, rod-like carbides were aligned in a specific angle and inter-lath, long, needle-like carbides were along the lath boundaries, which means the carbide precipitation during quenching and tempering is more complex at the middle thickness for thick plates.

3.1.2. EBSD

Figure 2 shows the crystallographic characteristics of the different thickness positions of the steel by EBSD, where 15° is taken to be the critical misorientation angle to distinguish low-angle grain boundaries (LAGB) and high-angle grain boundaries (HAGB) [10]. The red lines in Figure 2b,d,f represent LAGB of 2–15°, and the blue lines are HAGB higher than 15°. Lath structures were clear in groups of parallel HAGB, which could be referred to as blocks or packets. The average sizes of the blocks were estimated to be 3.77 μm, 4.20 μm, and 4.65 μm for the sub-surface, t/4 and t/2, respectively. This means that the effective grain sizes for strengthening and toughening were increased with increasing depth from the plate surface. The sizes of sub-structures in terms of lath width also exhibited the same trend. Figure 3 plots the relative frequencies of misorientations for the three positions, and the percentages of HAGB were statistically accounted to be 65%, 64%, and 61% for the sub-surface, t/4, and t/2, respectively.

3.1.3. XRD

The XRD spectrum of the varied positions of as-received Q and T steels are plotted in Figure 4. Austenite peaks did not appear in all specimens, indicating the fraction of the retained austenite can be negligible in the steel [11].
From the XRD patterns in Figure 4, full width at half maximum (FWHM) can be determined and therefore the dislocation density can approximately be estimated using the modified Williamson–Hall equation: [12,13,14]
( 2 δ cos θ λ 0.9 D ) 2 ( 2 sin θ λ ) 2 = M 2 b 2 π ρ 2 × 0.285 × [ 1 q h 2 k 2 + k 2 l 2 + l 2 h 2 ( h 2 + k 2 + l 2 ) 2 ]
where δ, θ, and λ represent the FWHM, diffraction angle, and wavelength of X-rays, respectively. The value of λ is 0.15405 nm for Cu radiation. D, ρ, and b are average grain size, dislocation density, and magnitude of the Burgers vector, respectively. M is a constant of 2, which depends on the effective outer cut-off radius of dislocations [15]. h, k, and l are the Miller indices of each peak, and q is a parameter of dislocation character. According to the method in the literature [16], the dislocation densities were calculated as to be 2.18 × 10¹⁴ m−2, 4.17 × 10¹⁴ m−2 and 5.12 × 10¹⁴ m−2 for the sub-surface, t/4, and t/2 of the experimental steel, respectively.

3.1.4. TEM

Figure 5 shows the TEM images of the experimental steel at the sub-surface, t/4, and t/2. The precipitates at the sub-surface were majorly spheroidal and the rod-like shapes at the martensite lath boundaries and in the matrix. The spheroidal and rod-like shape precipitates at the sub-surface are about 20–100 nm (diameter) and 75–250 nm (length) (Figure 5a,b), respectively. The spheroidal shapes precipitated at t/4 (Figure 5d,e) and in the t/2 (Figure 5g,h) are about 125–320 nm, which are much larger than that of the sub-surface. From the sub-surface to t/2, the amount of the large size carbides precipitated at the boundaries increased while the amount of rod-like carbides precipitated in the matrix and boundaries decreased. The carbides precipitated at the martensite lath boundaries are larger than that in the matrix.
The EDS analysis in Figure 5c shows the spheroidal precipitate P1 which precipitated between two laths was a Cr-rich carbide, and Figure 5i shows that the rod-like precipitates P3 are also Cr-rich carbides, and the V and Mo elements mainly dissolve into Cr-rich carbides. Figure 5e shows that the larger spheroidal precipitate P2, which precipitated at the lath boundaries, is a Fe3C. P4 precipitated at the martensite lath boundaries, and P4 in Figure 5h was identified as Fe3C with a large amount of Cr, V, and Mo by SAED and EDS. Moreover, much finer microalloying precipitates with a diameter of 15–25 nm were observed in the matrix at t/2, which are most likely to be NbC—the dashed rectangle regions in Figure 5g.

3.2. Mechanical Properties

3.2.1. Tensile Properties

The tensile properties of the steel at varied thicknesses are compared in Table 2. From the sub-surface to the t/2 of the steel, the corresponding yield strength was decreased from 782 MPa to 750 MPa, and the tensile strength was decreased from 852 MPa to 830 MPa, respectively. The strength of the t/2 is the lowest with the lowest elongation of 18.0% and the lowest reduction of area of 70% as well.

3.2.2. Hardness Across the Thickness

Figure 6 plots the hardness variations across the thickness of the steel, where large fluctuations in hardness were found. The average values changed from 305 HV to 270 HV from the surface position to the middle thickness, where the hardness was the lowest due to insufficient quenching.

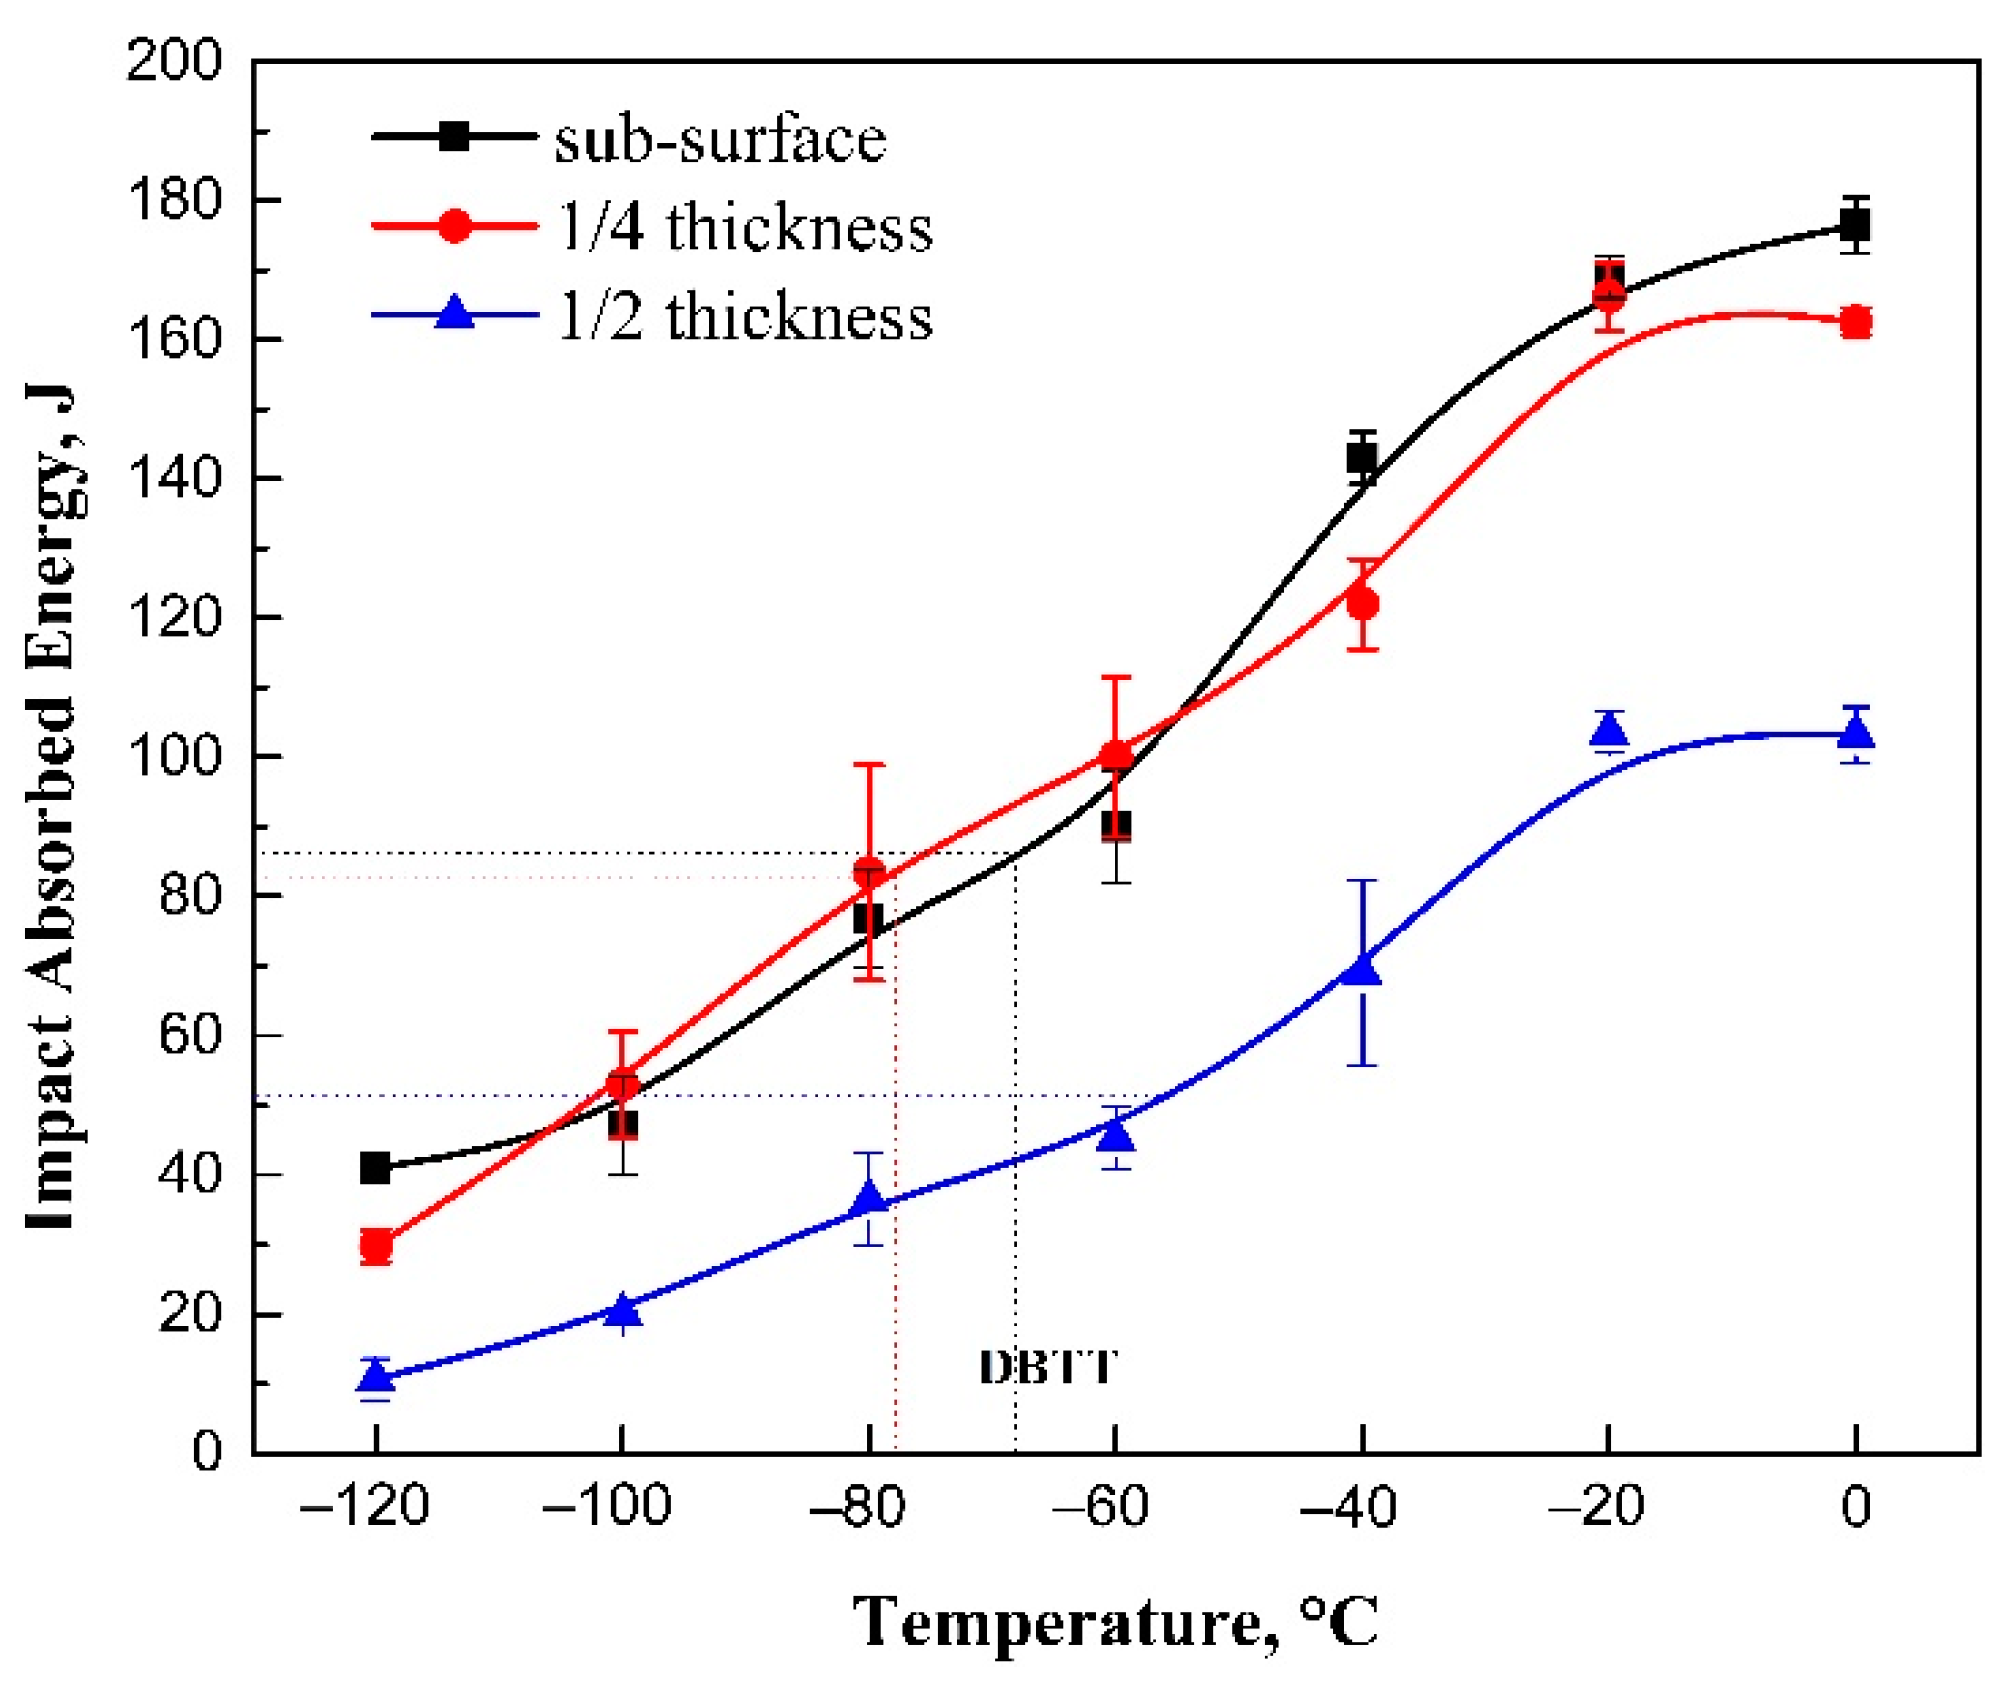
3.2.3. Impact Toughness as A Function of Temperature

Figure 7 plots the impact energies as a function of testing temperature for the different thickness specimens. As the temperatures decreased from 0 °C to −120 °C, the average CVN dropped from 177 J to 41 J for the sub-surface and from 163 J to 30 J for the t/4, showing a slight difference between the two positions. However, over the whole temperature range, the t/2 had the lowest impact energies, which dropped from 112 J to 11 J, showing a toughness value lower than the sub-surface and t/4. For all the positions, the decreases in CVN are in a linear way from −20 °C to −120 °C, without steep ductile-to-brittle transitions (DBT). The ductile-brittle transition temperatures (DBTT) were estimated as −67 °C, −78 °C, and −56 °C for the sub-surface, t/4, and t/2, respectively, if 50% impact energies of the upper shelf energies were taken as criteria.

3.2.4. Impact Fracture Behavior at −60 °C

Observations on the fracture surfaces of the impacted specimens at −60 °C were made using SEM for all the positions. The average CVNs at −60 °C were 89.2 J, 100.0 J, and 54.2 J for the sub-surface, t/4, and t/2, respectively. As shown in Figure 8a–c, the specimens were all fractured in a quasi-cleavage mode mixed with ductile and cleavage zones, and the area fractions of fibrous and shear lip were measured to be ~46%, ~54%, and ~30% for corresponding positions. The fracture surfaces of the sub-surface and t/4 specimens showed a high amount of deep and wide dimples, while the appearance of the t/2 specimen was shallow and small, as well as cleavage facets and tear ridges which appeared within the fibrous zone.
Figure 9 shows the curves of the impact load and the impact energy as a function of hammer displacement at −60 °C. The fracture process can be divided into five stages based on the variation in load including the elastic stage (E1), the plastic (E2) deformation stage for crack initiation, the crack propagation stage (E3), the brittle fracture stage (E4), and the post-brittle fracture stage (E5) [17,18,19]. Table 3 lists the absorbed energy of the crack initiation and crack propagation stage. The crack initiation energy (E1 and E2) were determined to be 44.0 J, 40.2 J, and 33.5 J at the sub-surface, t/4, and t/2, respectively, indicating that the variation from the sub-surface to t/4 can influence elastic and plastic deformation stages to a small extent. However, there were obvious differences in the subsequent crack propagation stage: the crack propagation energy (E3) from the sub-surface to t/2 was 28.4 J, 29.1 J, and 0 J, respectively, which indicates a higher degree of difficulty in the crack propagation process at the sub-surface and t/4 than t/2. The crack propagation stage was not found at t/2, as shown in Figure 9, which means the t/2 subjected to a brittle fracture at −60 °C. Furthermore, the crack arrestability during the propagation stage (Pa/Pm) is stronger at t/4.

3.3. Segregation at t/2

OM micrograph of Figure 10a displays alternate dark and bright bands at t/2, and Figure 10b compares the corresponded microhardness values between them. Considerable higher hardness of the dark bands, 309 HV–322 HV compared to 267 HV–276 HV of the adjacent bright regions, suggests severe segregation occurred at t/2.
The extent of segregation at t/2 was analyzed using EPMA, as shown in Figure 11. The enrichment of C, Mn, Ni, and Mo was marked within a band of 150 µm width (corresponds to the dark region in Figure 10a), whereas the segregation of Cu was much weaker. The segregation of elements, especially C and Mn, was also confirmed by OES by macroscale sampling, as listed in Table 4.

3.4. Continuous Cooling Transformation (CCT) Behavior

The quenching temperature curves of the sub-surface, t/4, and t/2 of the investigated steel plate were plotted in Figure 12, showing dramatic differences in temperature drop between the positions. Over the range of 600–300 °C, the cooling rate at t/2 was about 0.6 °C/s, much lower that of 6.8 °C/s for the sub-surface position. Combining with the CCT diagram, the measured temperature results will be invaluable to studying the variation of transformation behavior caused by thickness effect.
Figure 13 plots the static CCT diagram of the t/2 superimposed with the temperature curves derived from Figure 12, and the corresponding microstructures are shown in Figure 14. The critical cooling rate to make the steel fully martensitic is about 1 °C/s, at which the hardness was increased to 427 HV from 316 HV at 0.5 °C/s. Combining the measured cooling rates for different positions, we can clearly see that the transformed microstructure would be bainitic and partially martensitic at t/2, and fully martensitic at t/4 and sub-surface.

4. Discussion

4.1. Thickness Effect on Microstructure Variation

Based on the temperatures recorded during quenching and the CCT diagram plotted from experiments, the resulted microstructures at the typical positions of the 178 mm thickness plate, produced by quenching and tempering, could be interpreted by the quantitative effect of thickness on the transformation, especially at t/2. The critical cooling rate to form full martensite is about 1.0 °C/s for the investigated steel. The cooling rate at the middle thickness during quenching was measured as 0.6 °C/s, much lower than the critical cooling rate, meaning that only partial martensite can be formed after bainitic transformation, which explains the resulting microstructure at t/2 constituting ~25% tempered bainite other than tempered martensite by OM in Figure 1. Moreover, the block width decreases with increasing cooling rate [20], and martensite laths were also refined [21,22], which is consistent with the results observed in Figure 2 that the block width is 3.77 μm, 4.20 μm, and 4.65 μm for the sub-surface, t/4 and t/2, respectively. The lower cooling rate at t/2 leads to a larger block width. Besides partial martensite at t/2, high-density carbides with a variation of shapes and sizes can also be seen in the SEM and TEM micrographs (Figure 1 and Figure 5), reflecting the complexities of the carbide precipitation behavior there. Slow cooling leads to a long duration at the relative high temperature stage. From Figure 12 the duration time for the drop from 500 °C to 150 °C was estimated to be about 20 min at t/2, which provides the opportunity of auto-tempering during and after quenching. The carbon is assumed to segregate sufficiently at the lath boundaries and dislocations caused by the martensitic and bainitic transformations. In addition, the severe segregation of carbon and other alloy elements was revealed at t/2 as shown in Figure 10 and Figure 11 and would introduce more complexities of the carbide precipitation behavior, which were seen in the variety of shapes, sizes, and distribution locations in Figure 1 and Figure 5.

4.2. Thickness Effect on Strength Variation

The complexities of the microstructures in quenched and tempered steel, combining a great thickness effect on quenching and the severe segregation at t/2, make it difficult to accurately evaluate the strengthening components. The yield strength of Q and T steel includes the strengthening mechanisms from the friction stress of ferritic matrix ( Δ σ 0 ), solid solution ( Δ σ S S ), grain boundary ( Δ σ G B ), dislocation ( Δ σ D S ) and precipitation ( Δ σ P S ), which can be expressed by Equation (2) [23,24,25,26,27].
Δ σ y = Δ σ 0 + Δ σ S S + Δ σ G B + Δ σ D S 2 + Δ σ P S 2
Δ σ 0 + Δ σ S S + Δ σ G B = 88 + ( 32.24 [ M n ] + 83.16 [ S i ] + 360.36 [ C ] + 33 [ N i ] ) + 11 [ M o ] + 354.2 [ N ] ) + 17.40 d 1 / 2
where [Mn], [Si], [C], [Ni], and [Mo] are the weight percentage of alloying elements, shown in Table 4. [N] is the free nitrogen content considered as 0 in this case because of adding high-content Al and B. The effect of Cr on solid solution strengthening has been omitted because of the small atomic misfit between Cr and Fe [25]. The blocks can be taken as the effective grains that contribute the strength [28,29], thus d is the block width.
Δ σ D S = 0.38 μ b ρ
where μ is the shear modulus of 82 GPa, b is the Burgers vector of 0.248 nm [30], and ρ is the dislocation density.
We assume here that the yield strength fully satisfies Equation (2), from which precipitation strengthening can be calculated. With the above approaches, it is possible to quantify the contribution of the strengthening components at the different thicknesses of the heavy-thick steel. Figure 15 shows that the strength variation at the varied positions is mainly due to the strengthening components by effective grain boundaries, dislocation, and precipitation.
The block sizes were increased gradually from the sub-surface to the t/2 because of increasingly insufficient quenching, as shown in Figure 2 and Figure 12, so that the strength contributed by the effective grain sizes is smallest at t/2 among the positions. The high-density dislocation in lath martensite is another major strengthening contribution. It can be estimated to be 159 MPa and 175 MPa for the t/4 and t/2, respectively, based on evaluated higher dislocation density from corresponding FWHM in Figure 4. This might be caused by more severe segregation at these two positions (Table 4).
Besides the above two major strengthening mechanisms, the precipitation strengthening also plays an important role in Q and T steel, which is mainly determined by the size and volume fraction of the particles. At the sub-surface, the carbides were much smaller in size and some rods were observed, indicating that the carbide precipitation progress is varied across the thickness. Auto-tempering will inevitably occur due to the long duration at high temperatures after quenching [31,32], as the temperature curves at t/4 and t/2 show in Figure 12. Assisted with highly segregated elements, the coarsening would readily occur on the precipitated carbides and the progress would be more rapid during the subsequent tempering. Therefore, we see high-density carbides with significantly large sizes in the SEM and TEM micrographs of the t/4 and t/2 specimens (Figure 1 and Figure 5). Considering the effect of size and volume fraction, the precipitation strengthening contribution was evaluated for the positions, e.g., 196 MPa for the sub-surface, 139 MPa for the t/4, and 114 MPa for the t/2, as depicted in Figure 15.

4.3. Thickness Effect on Toughness Variation

The temperature curve at t/2 was closer to that of t/4 than the sub-surface (Figure 12). However, the impact energies at the testing temperatures were instead much lower than those at t/4. There must be a position between t/4 and t/2 which reaches a critical cooling rate during quenching, below which full martensite cannot be obtained. The critical cooling rate can be confirmed to be between 1 °C/s and 0.5 °C/s from the steep drop in hardness from 427 HV to 315 HV from CCT in Figure 13. The CCT diagram is superimposed with the schematic cooling rates at different positions derived from Figure 12. We can see that at t/2 the cooling rate is closer to 0.6 °C/s, producing a coarse microstructure consisting of bainite and partial martensite with a low fraction of HAGB (Figure 1 and Figure 2). Thus, in the segregated t/2 region, the carbides that had been readily nucleated in the bainite and auto-tempered martensite resulted in chains of high-density coarse carbides along the interlath boundaries during the subsequent tempering.
These carbide chains, providing plenty of crack initiation sites and crack propagation paths, as well as their coarse matrix microstructure with low fraction of HAGB, explain why no crack propagation period is observed in Figure 9 with the E3 energy of zero, around 30 J less than that of the sub-surface and t/4 specimens (Table 3). The main variation of impact toughness can therefore be contributed to the completely lost capability to resist crack propagation at t/2.

5. Conclusions

In this work we investigated the variation of microstructure and mechanical properties at different thicknesses of a quenched and tempered 178 mm thickness steel plate, and the following conclusions can be drawn:
(1)
The microstructure at t/2 consists of tempered martensite and a large amount of tempered bainite with coarse size and a low fraction of HAGB, as well as high-density coarse carbides along interlath boundaries, which is significantly differs from that at the sub-surface and t/4. The microstructural variation results from the dramatic drop of the cooling rate from 6.8 °C/s at the sub-surface to 0.6 °C/s at t/2 where only partially martensitic transformation occurred.
(2)
The lowest strength of 750 MPa at t/2 is from the weaker strengthening contributions from coarse block size and precipitation of coarser carbides. Based on the variation in strengthening components, it could be promising for designing the strength required at the middle thickness for ultra-heavy steel by considering the quenching capability measured.
(3)
The lowest impact toughness at t/2 is caused by the complete loss of crack propagation energy and significantly lower crack initiation energy, which could have arisen from the coarse bainitic or martensitic structure and high-density large carbides at the interlath boundaries.
(4)
With a dramatic decrease of quenching intensity and severe segregation at t/2 of the ultra-heavy steel plate, further study is needed to understand the complexity in partially martensitic transformation and carbide precipitation.

Author Contributions

Conceptualization, Q.W. and Q.Y.; investigation, Q.W.; data curation, Q.W. and Q.Y.; writing—original draft preparation, Q.W.; writing—review and editing, Q.W., Q.Y., L.K., and H.W.; funding acquisition, Z.W. All authors have read and agreed to the published version of the manuscript.

Funding

This research was funded by the National Key R&D Program of China, grant number 2016YFB0300600.

Acknowledgments

This work was financially supported by the National Key R&D Program of China (No. 2016YFB0300600). Qibin Ye gratefully acknowledges Tianliang Fu, from the State Key Laboratory of Rolling and Automation, Northeastern University, who kindly provided the precious industrial quenching temperature curves.

Conflicts of Interest

The authors declare no conflict of interest.

References

  1. Zhou, T.; Yu, H.; Wang, S. Effect of microstructural types on toughness and microstructural optimization of ultra-heavy steel plate: EBSD analysis and microscopic fracture mechanism. Mater. Sci. Eng. A 2016, 658, 150–158. [Google Scholar] [CrossRef]
  2. Liu, D.; Cheng, B.; Chen, Y. Strengthening and toughening of a heavy plate steel for shipbuilding with yield strength of approximately 690 MPa. Metall. Mater. Trans. A 2013, 44, 440–455. [Google Scholar] [CrossRef]
  3. Yu, W.; Li, G.; Cai, Q. Effect of a novel gradient temperature rolling process on deformation, microstructure and mechanical properties of ultra-heavy plate. J. Mater. Process. Technol. 2015, 217, 317–326. [Google Scholar]
  4. Gottlieb, J.; Kern, A.; Schriever, U.; Steinbeck, G. High-performance steels for pressure vessels. Steel Constr. 2010, 3, 49–55. [Google Scholar] [CrossRef]
  5. Xie, B.-S.; Cai, Q.-W.; Yun, Y.; Li, G.-S.; Ning, Z. Development of high strength ultra-heavy plate processed with gradient temperature rolling, intercritical quenching and tempering. Mater. Sci. Eng. A 2017, 680, 454–468. [Google Scholar] [CrossRef]
  6. Lesoult, G. Macrosegregation in steel strands and ingots: Characterisation, formation and consequences. Mater. Sci. Eng. A 2005, 413–414, 19–29. [Google Scholar] [CrossRef]
  7. Pickering, E.J.; Bhadeshia, H.K.D.H. Macrosegregation and microstructural evolution in a pressure-vessel steel. Metall. Mater. Trans. A 2014, 45, 2983–2997. [Google Scholar] [CrossRef]
  8. Wang, X.Y.; Su, H.; Pan, T.; Liang, F.R.; Li, X.Y. Effect of surface cooling rate on section temperature field of ultra-heavy plate steel by ANSYS. Mater. Sci. Technol. 2013, 21, 49–54. [Google Scholar]
  9. Sun, X.J.; Yuan, S.F.; Xie, Z.J.; Dong, L.L.; Shang, C.J.; Misra, R.D.K. Microstructure-property relationship in a high strength-high toughness combination ultra-heavy gauge offshore plate steel: The significance of multiphase microstructure. Mater. Sci. Eng. A 2017, 689, 212–219. [Google Scholar] [CrossRef]
  10. Winning, M.; Rollett, A.D. Transition between low and high angle grain boundaries. Acta Mater. 2005, 53, 2901–2907. [Google Scholar] [CrossRef]
  11. Zhang, K.; Zhang, M.; Guo, Z.; Chen, N.; Rong, Y. A new effect of retained austenite on ductility enhancement in high-strength quenching–partitioning–tempering martensitic steel. Mater. Sci. Eng. A 2011, 528, 8486–8491. [Google Scholar] [CrossRef]
  12. Ungár, T.; Dragomir, I.; Révész, Á.; Borbély, A. The contrast factors of dislocations in cubic crystals: The dislocation model of strain anisotropy in practice. J. Appl. Crystallogr. 1999, 32, 992–1002. [Google Scholar] [CrossRef] [Green Version]
  13. Ungár, T.; Ott, S.; Sanders, P.G.; Borbély, A.; Weertman, J.R. Dislocations, grain size and planar faults in nanostructured copper determined by high resolution X-ray diffraction and a new procedure of peak profile analysis. Acta Mater. 1998, 46, 3693–3699. [Google Scholar] [CrossRef]
  14. Shintani, T.; Murata, Y. Evaluation of the dislocation density and dislocation character in cold rolled Type 304 steel determined by profile analysis of X-ray diffraction. Acta Mater. 2011, 59, 4314–4322. [Google Scholar] [CrossRef]
  15. Renzetti, R.A.; Sandim, H.R.Z.; Bolmaro, R.E.; Suzuki, P.A.; Möslang, A. X-ray evaluation of dislocation density in ODS-Eurofer steel. Mater. Sci. Eng. A 2012, 534, 142–146. [Google Scholar] [CrossRef]
  16. Chen, J.; Li, C.; Ren, J.; Tu, X.; Chen, L. Strength and toughness of Fe-1.2Mn-0.3Cr-1.4Ni-0.4Mo-C tempered steel plate in three cooling processes. Mater. Sci. Eng. A 2019, 754, 178–189. [Google Scholar] [CrossRef]
  17. Zhao, J.; Hu, W.; Wang, X.; Kang, J.; Yuan, G.; Di, H.; Misra, R.D.K. Effect of microstructure on the crack propagation behavior of microalloyed 560MPa (X80) strip during ultra-fast cooling. Mater. Sci. Eng. A 2016, 666, 214–224. [Google Scholar] [CrossRef]
  18. Deng, W.; Zhao, D.; Qin, X.; Du, L.; Gao, X.; Wang, G. Simulation of central crack closing behavior during ultra-heavy plate rolling. Comput. Mater. Sci. 2009, 47, 439–447. [Google Scholar] [CrossRef]
  19. Hashemi, S.H. Apportion of Charpy energy in API 5L grade X70 pipeline steel. Int. J. Press. Vessels Pip. 2008, 85, 879–884. [Google Scholar] [CrossRef]
  20. Morito, S.; Igarashi, R.; Kamiya, K.; Ohba, T.; Maki, T. Effect of cooling rate on morphology and crystallography of lath martensite in Fe-Ni alloys. Mater. Sci. Forum 2010, 638–642, 1459–1463. [Google Scholar] [CrossRef]
  21. Gao, Q.; Liu, Y.; Di, X.; Yu, L.; Yan, Z. Martensite transformation in the modified high Cr ferritic heat-resistant steel during continuous cooling. J. Mater. Res. 2012, 27, 2779–2789. [Google Scholar] [CrossRef]
  22. Zheng, Y.; Wang, F.; Li, C.; Lin, Y.; Cao, R. Effect of martensite structure and carbide precipitates on mechanical properties of Cr-Mo alloy steel with different cooling rate. High Temp. Mater. Process. 2019, 38, 113–124. [Google Scholar] [CrossRef]
  23. Yen, H.-W.; Chen, P.-Y.; Huang, C.-Y.; Yang, J.-R. Interphase precipitation of nanometer-sized carbides in a titanium–molybdenum-bearing low-carbon steel. Acta Mater. 2011, 59, 6264–6274. [Google Scholar] [CrossRef]
  24. Morito, S.; Yoshida, H.; Maki, T.; Huang, X. Effect of block size on the strength of lath martensite in low carbon steels. Mater. Sci. Eng. A 2006, 438–440, 237–240. [Google Scholar] [CrossRef]
  25. Kim, B.; Boucard, E.; Sourmail, T.; San Martín, D.; Gey, N.; Rivera-Díaz-del-Castillo, P.E.J. The influence of silicon in tempered martensite: Understanding the microstructure–properties relationship in 0.5–0.6wt.% C steels. Acta Mater. 2014, 68, 169–178. [Google Scholar] [CrossRef]
  26. Chauhan, A.; Bergner, F.; Etienne, A.; Aktaa, J.; de Carlan, Y.; Heintze, C.; Litvinov, D.; Hernandez-Mayoral, M.; Oñorbe, E.; Radiguet, B.; et al. Microstructure characterization and strengthening mechanisms of oxide dispersion strengthened (ODS) Fe-9%Cr and Fe-14%Cr extruded bars. J. Nucl. Mater. 2017, 495, 6–19. [Google Scholar] [CrossRef]
  27. Cheng, X.Y.; Zhang, H.X.; Li, H.; Shen, H.P. Effect of tempering temperature on the microstructure and mechanical properties in mooring chain steel. Mater. Sci. Eng. A 2015, 636, 164–171. [Google Scholar] [CrossRef]
  28. Shibata, A.; Nagoshi, T.; Sone, M.; Morito, S.; Higo, Y. Evaluation of the block boundary and sub-block boundary strengths of ferrous lath martensite using a micro-bending test. Mater. Sci. Eng. A 2010, 527, 7538–7544. [Google Scholar] [CrossRef]
  29. HajyAkbary, F.; Sietsma, J.; Böttger, A.J.; Santofimia, M.J. An improved X-ray diffraction analysis method to characterize dislocation density in lath martensitic structures. Mater. Sci. Eng. A 2015, 639, 208–218. [Google Scholar] [CrossRef]
  30. Saastamoinen, A.; Kaijalainen, A.; Porter, D.; Suikkanen, P.; Yang, J.-R.; Tsai, Y.-T. The effect of finish rolling temperature and tempering on the microstructure, mechanical properties and dislocation density of direct-quenched steel. Mater. Charact. 2018, 139, 1–10. [Google Scholar] [CrossRef]
  31. Wu, Y.X.; Sun, W.W.; Styles, M.J.; Arlazarov, A.; Hutchinson, C.R. Cementite coarsening during the tempering of Fe-C-Mn martensite. Acta Mater. 2018, 159, 209–224. [Google Scholar] [CrossRef]
  32. Wu, Y.X.; Sun, W.W.; Gao, X.; Styles, M.J.; Arlazarov, A.; Hutchinson, C.R. The effect of alloying elements on cementite coarsening during martensite tempering. Acta Mater. 2020, 183, 418–437. [Google Scholar] [CrossRef]
Figure 1. Optical microscopy (OM) (a,c,e) and SEM (b,d,f) micrographs of the experimental steels. (a,b) sub-surface, (c,d) 1/4 thickness (t/4), (e,f) 1/2 thickness (t/2).
Metals 10 00572 g001
Figure 2. Inverse pole figure (IPF) maps and grain boundary misorientation distributions of the varied positions. (a,b) sub-surface, (c,d) t/4, (e,f) t/2.
Metals 10 00572 g002
Figure 3. Relative frequency of misorientation angle obtained by EBSD.
Metals 10 00572 g003
Figure 4. XRD spectrum of the experimental steels at the different thicknesses.
Metals 10 00572 g004
Figure 5. TEM morphology of the experimental steel. (a,b) sub-surface, (d,e) t/4, (g,h) t/2, (c,f,i) represent the EDS images of P1, P2, and P3, respectively.
Metals 10 00572 g005
Figure 6. Hardness variations in the thickness direction of the experimental steel.
Metals 10 00572 g006
Figure 7. Absorbed energies of the experimental steel as a function of temperatures at the different thickness.
Metals 10 00572 g007
Figure 8. Micrographs of the impact fracture tested at −60 °C. (a) sub-surface, (b) t/4, (c) t/2, (d,g) present A and B positions in Figure 8a, (e,h) present C and D positions in Figure 8b, (f,i) present E and F positions in Figure 8c.
Metals 10 00572 g008
Figure 9. Curves of load and Charpy V-notch energies (CVN) vs. displacement obtained from the instrumented impact testing at −60 °C. (a) sub-surface, (b) t/4, (c) t/2.
Metals 10 00572 g009
Figure 10. Microhardness comparison between alternate bands at t/2. (a) OM of the segregation bands, (b) hardness of the segregation bands.
Metals 10 00572 g010
Figure 11. Electron probe microanalysis (EPMA) map scanning results. (a) SEM micrograph of the macrosegregation region, (bf) the corresponding distribution of C, Cu, Mn, Ni, Mo, respectively.
Metals 10 00572 g011
Figure 12. Measured industrial quenching temperature curves of the 178 mm thick steel plate.
Metals 10 00572 g012
Figure 13. CCT diagram superimposed with the schematic cooling rate at different positions derived from Figure 12.
Metals 10 00572 g013
Figure 14. Optical micrographs of the t/2 specimens after continuous cooling at (a) 0.2 °C/s, (b) 0.5 °C/s, (c) 1 °C/s, (d) 2 °C/s, (e) 5 °C/s, (f) 10 °C/s.
Metals 10 00572 g014
Figure 15. Strengthening components evaluated for the varied thickness positions of the steel.
Metals 10 00572 g015
Table 1. Heat analysis of chemical composition of the experimental steel, in wt. %.
CSiMnNiCrMoCuNbVAlBFe
0.120.231.062.500.500.500.260.020.030.050.0015Balance
Table 2. Tensile properties of the different thickness positions of the experimental steel.
PositionRp0.2 (MPa)Rm (MPa)A (%)Z (%)
Sub-surface78285220.075
t/475784120.574
t/275083018.070
Table 3. Experiment data from instrumented Charpy impact tests.
PositionPm (kN)Pf (kN)Pa (kN)EcfE3 (J)E4 (J)E5 (J)
E1 (J)E2 (J)
surface26.125.02.315.828.228.410.26.6
t/425.024.09.214.325.929.117.513.2
t/227.427.43.016.716.8015.75.0
Table 4. Measured chemical composition of the experimental steel, in wt. %.
PositionCSiMnNiMoCu
sub-surface0.130.221.062.400.500.26
t/40.140.231.082.400.510.26
t/20.150.241.122.500.520.27

