Article

Microstructure Characterization of SAW and TIG Welded 25Cr2Ni2MoV Rotor Steel Metal

1
Department of Mechanical Engineering, Tsinghua University, Beijing 100084, China
2
Key Laboratory for Advanced Materials Processing Technology, Ministry of Education, Beijing 100084, China
3
State Key Laboratory of Tribology, Tsinghua University, Beijing 100084, China
4
Collaborative Innovation Center of Advanced Nuclear Energy Technology, Tsinghua University, Beijing 100084, China
5
Shanghai Electric Power Generation Equipment Co., Ltd., Shanghai 200240, China
*
Author to whom correspondence should be addressed.
Metals 2020, 10(5), 603; https://doi.org/10.3390/met10050603
Submission received: 10 April 2020 / Revised: 2 May 2020 / Accepted: 4 May 2020 / Published: 7 May 2020

Abstract

:
Low pressure turbine rotors are manufactured by welding thick sections of 25Cr2Ni2MoV rotor steel using tungsten inert gas (TIG) backing weld, and submerged arc welding (SAW) filling weld. In this study, the microstructure of columnar grain zones and reheated zones in weld metal was characterized meticulously by Optical Microscope (OM), Scanning Electron Microscope (SEM) and Electron Back-Scatter Diffraction (EBSD). The results showed that, compared with SAW weld metal microstructure, TIG weld metal microstructure was relatively fine and homogeneous, due to its lower heat input and faster cooling rate than SAW. The maximum effective grain size in TIG and SAW weld were 7.7 μm and 13.2 μm, respectively. TIG weld metal was composed of lath bainite (LB) and blocky ferrite (BF), while SAW weld metal was composed of acicular ferrite (AF), lath bainite (LB)and ferrite side plate (FSP). Tempered martensite (TM) was detected along columnar grain boundaries in both TIG and SAW weld metals, which was related to the segregation of solute elements during weld solidification. Electron Probe Micro-Analysis (EPMA) results showed that the contents of Ni and Mn at the dendritic boundaries were 50% higher than those at the dendritic core in TIG weld. Similarly, 30% of Ni and Mn segregation at dendritic boundaries was also found in SAW weld. In addition, the microhardness of the two welded joints was tested.

1. Introduction

NiCrMoV steel was widely used to manufacture low pressure rotors in steam turbines, due to its sufficient strength to support the turbines and sufficient, deep hardenability to ensure the suitable microstructure in the center of a large forging [1,2]. However, it is difficult to manufacture large-scale and high-quality heavy section rotors by hot forging directly. Nowadays, welding has become an appropriate method to fabricate large-scale rotors [3]. In practice, multi-layer and multi-pass welding technologies are utilized for welding thick plates, attributing to their advantage the ability to normalize the pre-layer and/or pre-pass microstructure, and therefore increase the ductility and improve the welding quality [4,5]. In the manufacturing process of large-scale rotors, narrow gap tungsten inert-gas welding (NG-TIG) was performed for backing weld firstly, followed by multi-layer and multi-pass narrow-gap submerged-arc welding (NG-SAW), due to its higher efficiency and lower cost [4,6,7].
The microstructure of weld metals is determined by weld heat input, cooling rates, chemical compositions and post-weld heat treatment (PWHT) [8,9,10,11]. Qi et al. [12] compared the microstructures obtained by laser welding and submerged arc welding in the X100 pipeline steel coarse-grained heat-affected zone (CGHAZ), and indicated that the microstructure of laser welding of CGHAZ and of submerged arc welding of CGHAZ was lath martensite (LM) and granular bainite (GB), respectively. Keehan et al. [13] studied the effect of cooling rates on the weld metal microstructure of high strength steel. With the decrease in cooling rates, the as-deposited last bead microstructure changed gradually, from lower bainite and martensite, interspersed with coalesced bainite via a mixture of relatively fine upper and lower bainite, to coarse upper bainite. Prijanovič et al. [14] investigated the effect of various welding speeds and linear heat inputs of remote robotic laser welding on microstructural changes. They found that the microstructural ratio between martensite and bainite was approximately 70/30 at an optimal laser welding parameter, i.e., a welding speed of 0.6 m/min and a laser power of 300 W. Mao et al. [15] found that when the Ni content in weld metal increased from 0% to 6%, the microstructures in the weld-deposited metal changed from the domination of the granular bainite, to the majority of the lath bainite and/or the lath martensite, and when Ni content exceeded 4%, the columnar grain width and the prior austenite grain size showed a decreasing trend. Huang et al. [16] also revealed that a small addition of nickel significantly affected the formation of martensite-austenite (M-A) constituents and acicular ferrite (AF). With increased Ni content, the percentage of M-A constituents decreased and AF increased.
In order to make the weld metal possess good mechanical properties, especially the impact toughness, it is expected that there will be more AF or lath bainite (LB) in the rotor steel weld metal, rather than Widmanstätten ferrite (WF) and grain boundary allotriomorphic ferrite (GBF), with poor strength and toughness. It is important to choose the appropriate filler metal. The filler metal composition should be similar to that of the base metal, and it is important that the alloying elements can be modified suitably to obtain the optimal microstructure [17,18]. Bhole et al. [17] indicated that the combined presence of Ni (2.03–2.91 wt.%) and Mo (0.7–0.995 wt.%) in the API HSLA-70 weld metal by submerged arc welding led to a high-volume fraction of fine AF with good toughness, since the amount of both second phase and GBF were reduced. Kang et al. [18] suggested the optimum levels of Mn and Ni to be 0.5–1% and 4–5% based on hardness and impact toughness.
Although an abundance of research has been conducted in relation to the HAZ microstructure of low alloy and high strength (HSLA) steel, little, specific attention has been paid to studying the weld metal microstructure of rotor steel. In addition, most literature concerning the microstructures after welding only focuses on the effect of macroscopic composition in weld metal and neglects the effect of micro-segregation of alloy elements on microstructure. In this paper, we will illuminate the influence of solute segregation on microstructure and the distinction of the microstructure of SAW and TIG weld of 25Cr2Ni2MoV rotor steel, including the columnar grain zone and the reheated zone. Meanwhile, micro-hardness mapping in the two weld metals (including HAZ and base metal) was obtained.

2. Materials and Methods

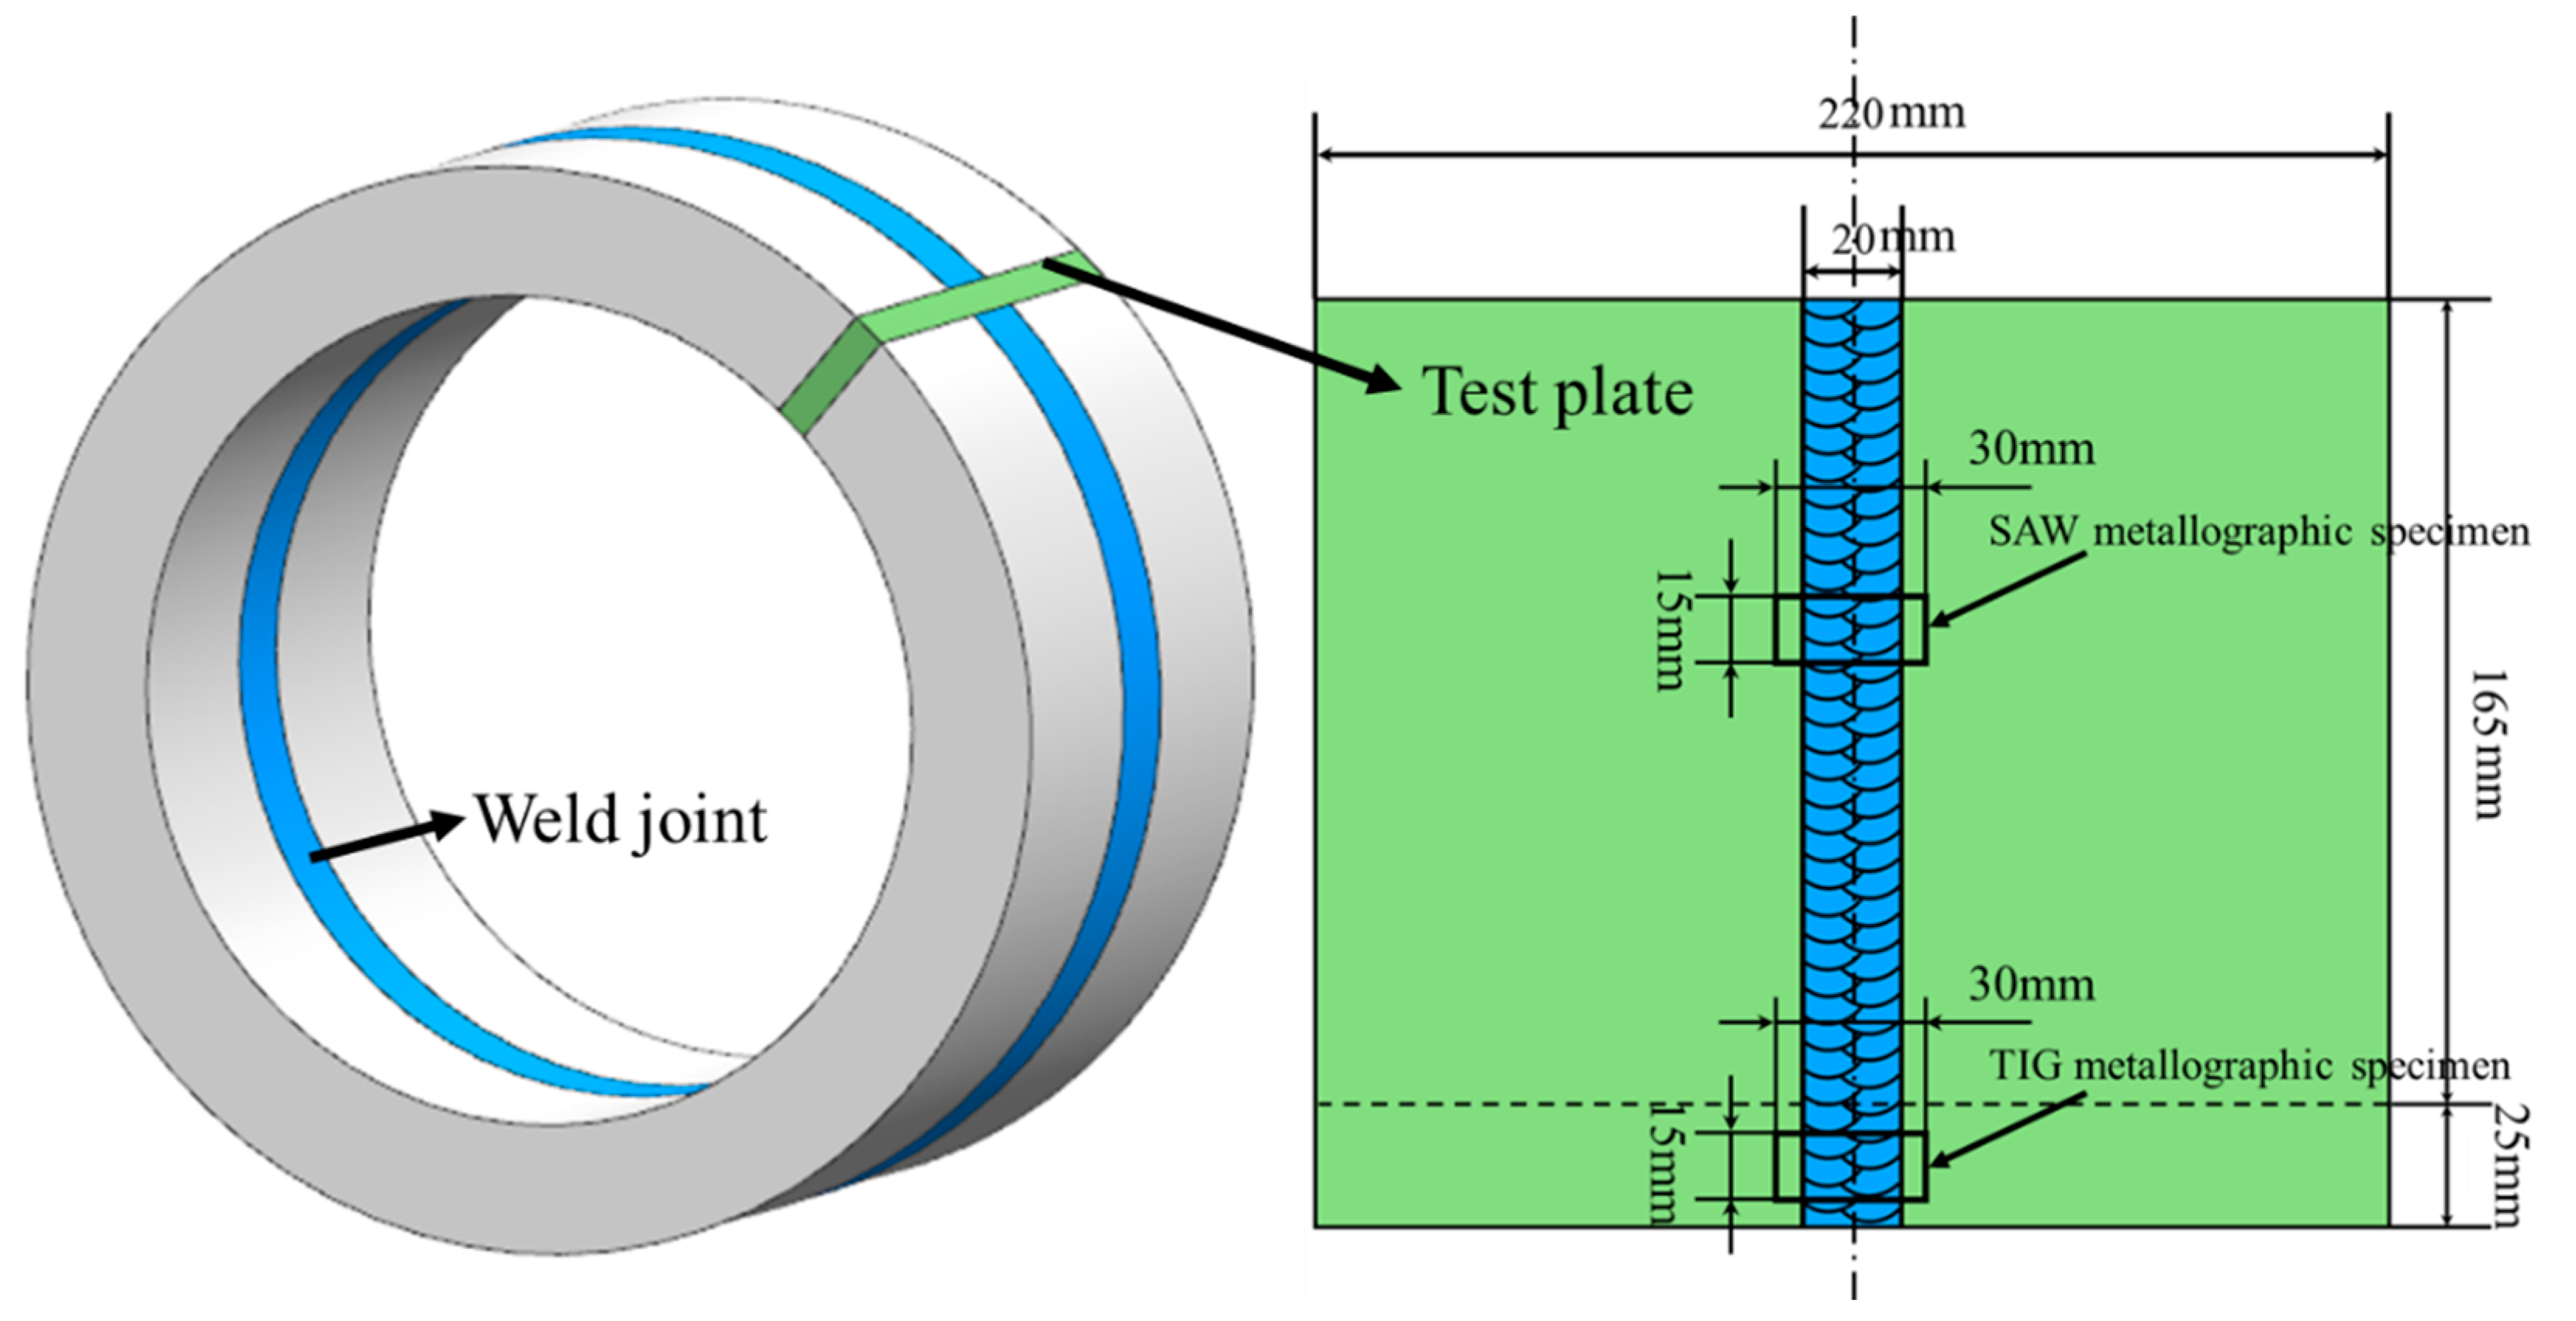
2.1. Materials and Welding

A 1:1 welded rotor mock in its as-welded state was investigated in the present study. As shown in Figure 1, the external diameter and the internal diameter of the simulator are 840 mm and 460 mm, respectively. The depth and width of the welds are 190 mm and 20 mm, respectively. The weld joint was fabricated by narrow gap tungsten inert-gas welding (NG-TIG) in the backing part and narrow-gap submerged-arc welding (NG-SAW) in the filling part. The test plate with size 220 mm × 190 mm × 20 mm was cut from the mock. The dimensions and location of the metallographic specimens used in this study are shown in Figure 1. The filler materials were chosen in accordance with ASME ER90S-B3 standard. The chemical compositions of the base metals (BM) and the filler metals (FM) are listed in Table 1. The welding parameters of TIG and SAW are listed in Table 2.

2.2. Microstructural Characterization

The metallographic specimens were grounded and polished mechanically and etched by 3% Nital solution. Then, the columnar grain and reheated zone microstructures were observed via optical microscopy (OM, CX14, Olympus, Tokyo, Japan) and scanning electron microscopy (SEM, LYRA3, TESCAN, Kohoutovice, Czech). The electropolished samples were used for (EBSD, PHI710, ULVAC-PHI Inc., Kanagawa, Japan) analysis. The electro-polishing was conducted in an electrolyte solution composed of 65 mL phosphoric acid, 15 mL sulfuric acid, 12 mL glycerol, 3 mL water and 5 g chromium trioxide at 6 V and 75 °C. Electron Back-Scatter Diffraction (EBSD) data were obtained with a 200 nm step size, and the data were analyzed using TSL-OIM Analysis Software (EDAX Inc, Philadelphia, PA, USA). In addition, in order to analyze the segregation behavior of alloy elements during the welding solidification process, electron probe microanalysis (EPMA, JXA8230, JEOL, Tokyo, Japan) was conducted using a JEOL JXA8230 equipped with four independent wavelength dispersive spectrometers. The EPMA was performed using an accelerating voltage of 15 kV and a beam current of 32 nA. The step size of the EPMA line scan was set to 5 μm in order to accurately obtain the composition profiles across the entire columnar structure. Considering the complex inhomogeneity of microstructure and measured area was indiscernible, hardness indentation was used to mark the test area. A micro-hardness test was performed on the metallographic specimen surface for each weld metal under 200 g for 10 s via dwelling on a Vickers micro-hardness tester (FM-810A, FUTURE-TECH, Kawasaki, Japan). The distance between hardness points was 2 mm.

3. Results

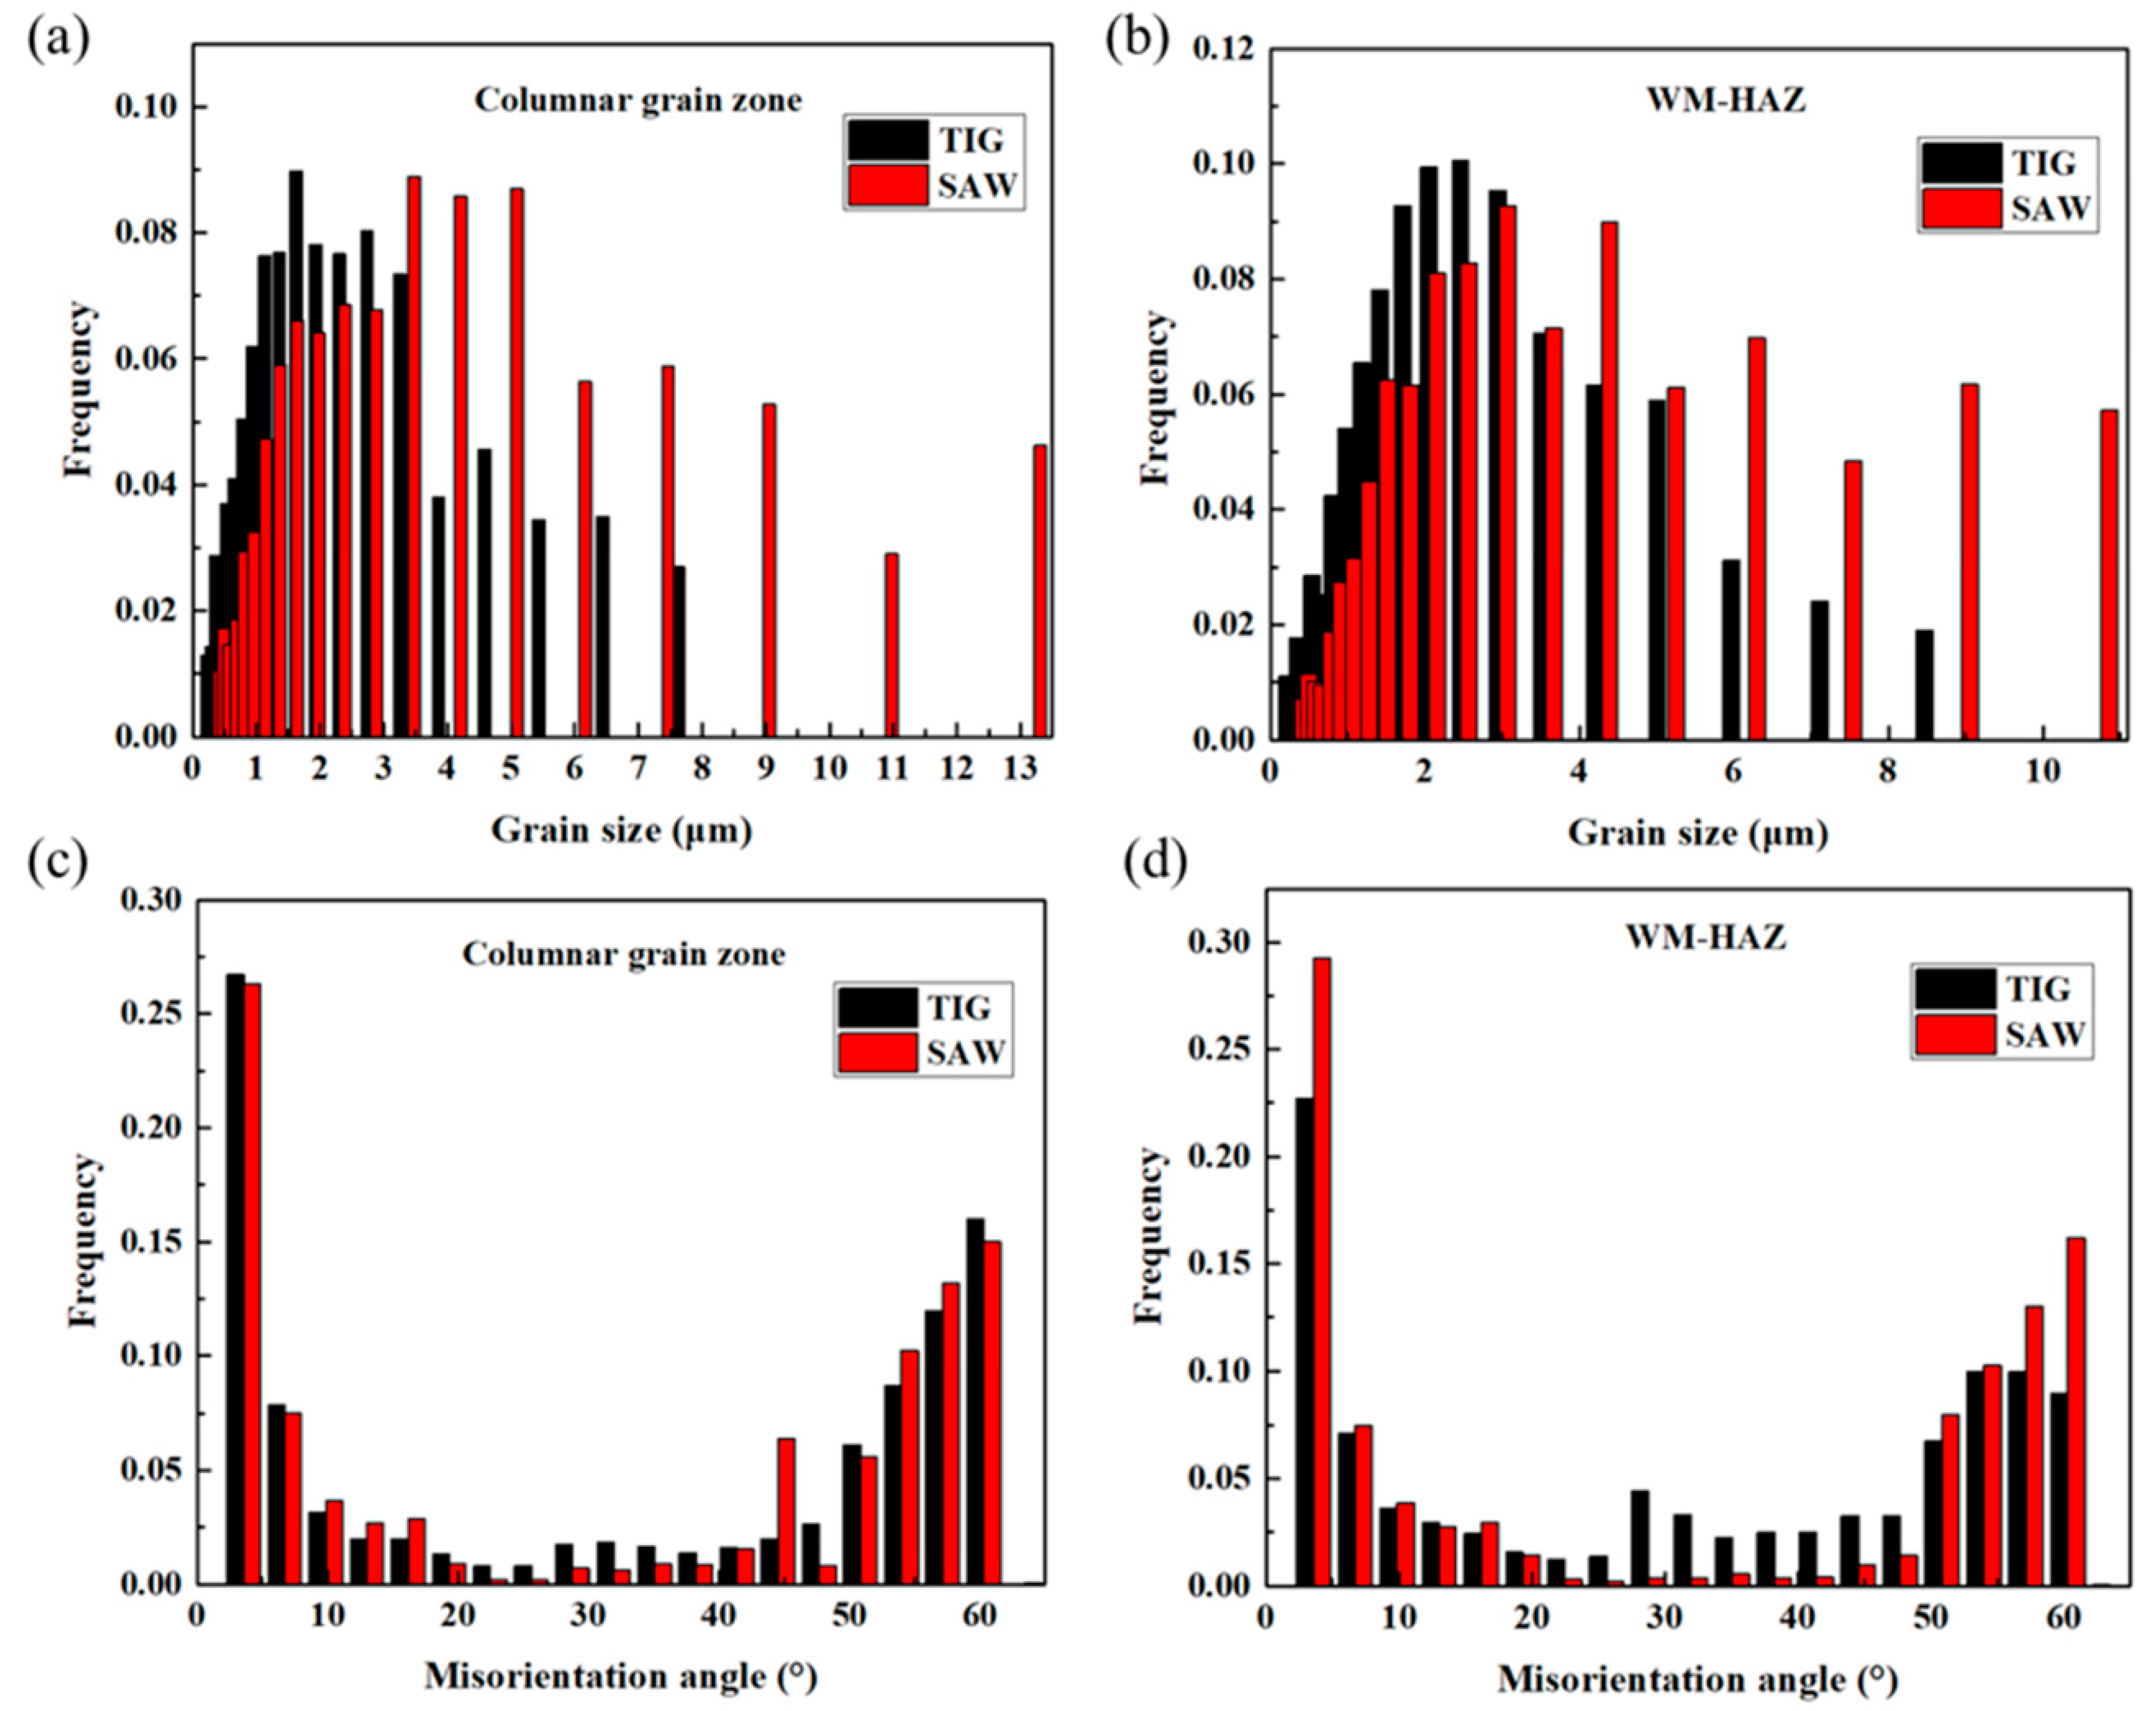
3.1. Columnar Grain and Reheated Zone Microstructures

In the present study, the multi-pass weld metal was divided into two regions, which were the columnar grain zone, without any reheated processes, and the reheated zone, which transformed from columnar grain when subjected to the same thermal cycles as heat affected zones in weld metal (referred as WM-HAZ). Generally, the reheated zone can be divided into two sub-zones, which are the coarse-grained zone, referred to as WM-CG, and the fine-grained zone, referred to as WM-FG [19]. Figure 2 shows the macroscopic morphology of TIG and SAW multi-layer and multi-pass weld metal. It is obvious that the width of the reheated zone of SAW weld is larger than that of TIG weld, which is related to the higher heat input of SAW.
Figure 3 shows the microstructure of the columnar grain zone of TIG and SAW weld. Dendrite structures (formed during solidification) can be observed from the optical microstructure at low magnification in both weld metals. Macroscopically, the columnar grain size of TIG weld (15–20 μm) is slightly larger than that of SAW weld (10–15 μm), as shown in Figure 3c,d. Kou [20] and Munitz [21] suggested that columnar grain size is affected by cooling rates and solidification time. As the cooling rate increases and the solidification time decreases, the columnar grain size becomes smaller. Furthermore, Zhang et al. [22]. showed that the columnar grain size was also related to the Ni equivalent in the weld metal. When the Ni equivalent is within a certain range, as the Ni equivalent increases, the columnar grain size first decreases and then increases. Compared with current research, although the cooling rate of TIG welding is faster, the difference in columnar grain size is not significant, due to the difference of Ni equivalent in the two weld metals. As shown in Figure 3c,d, there are significant differences in the microstructure of the columnar grain zone of the two welds. The columnar grain zone microstructure of TIG weld is dominated by lath bainite (LB), while the microstructure of the columnar grain zone of SAW weld is composed of acicular ferrite (AF). The microstructural differences of the two weld metals is mainly caused by the different deoxidization methods. During submerged arc welding, flux is used to deoxidize, and then many non-metallic inclusions are retained in the weld pool [7]. These retained non-metallic inclusions can act as nucleating agents for acicular ferrite, promoting the formation of acicular ferrite [23]. For TIG weld, no inclusions in the weld metal are found to provide locations for acicular ferrite nucleation, causing austenite to transform to bainite. It is observed that, at the boundary of the two weld columnar grain zones, the microstructure becomes coarser, which may be related to the segregation of solute elements during welding solidification.
Figure 4 shows the optical microstructure of the reheated zone in two weld metals. The width of the reheated zone in TIG and SAW weld were 180 and 500 μm, respectively, as shown in Figure 4a,d. The microstructure of the reheated zone of TIG weld is too fine to determine, meanwhile, the prior austenite grain boundaries (PAGBs) are hardly detected, as shown in Figure 4e. In contrast, the microstructure of the reheated zone of SAW weld is mainly composed of lath bainite (LB) with apparent PAGBs. Considering the higher heat input of SAW, as shown in Table 2, the peak temperature of and holding time in the reheated zone increased, which made the reheated zone wider and a steep temperature gradient was generated. Then, the reheated zone was divided into two parts, WM-CG and WM-FG, as shown in Figure 4b,c, respectively. The prior austenite grain size of WM-CG and WM-FG in SAW weld were 39 and 21 μm, respectively. The grain size in the reheat zone of TIG welding was much smaller than that of SAW welding, which can be attributed to the lower heat input in the subsequent passes, as shown in Table 2. The results of the grain size are consistent with previous reports [24,25]. Wang [24] and Yang et al. [25] studied the effect of different peak temperatures and heat input on HAZ microstructure and found that the reheated zone microstructure became finer and homogeneous with the decrease in peak temperature and heat input.
Figure 5 shows the SEM micrographs of TIG and SAW weld metal. As shown in Figure 5a, the microstructure of dendritic boundary regions of TIG weld is composed of tempered martensite (TM), while the microstructure of dendrite core regions is dominated by lath bainite (LB). In the reheated zone of TIG weld (Figure 5b), the microstructure is composed of lath bainite and blocky ferrite (BF) with a fine grain size. Compared with the microstructure of TIG weld, the microstructure in dendrite core regions of SAW weld consists of AF and ferrite side-plate (FSP). The microstructure of dendritic boundary regions of SAW weld is the same as that of TIG, both of which are tempered martensite, shown in Figure 5c. Figure 5d shows the microstructure of the reheated zone of SAW weld, which is typically comprised of LB. In addition, some martensite and austenite (M-A) islands can be observed along the prior austenite grain boundaries (PAGBs) and bainite packet boundaries.
Figure 6 presents the EBSD results, including crystallographic orientation maps and image quality maps of the columnar grain zone and the reheated zone. Wright et al. [26] indicated that the image quality of the diffraction patterns can be used to map out the elastic strain qualitatively. In the dendritic boundary regions of TIG and SAW weld metal, the relatively low image quality of the diffraction patterns resulted from martensite transformation, rather than a poorly prepared surface. The distributions of the effective grain size and grain boundary misorientation in the columnar grain zone and the reheated zone are displayed in Figure 7. In the columnar grain zone, the effective grain size of TIG weld is 0.3–7.7 μm, with the mean grain size of 2.4 μm. However, for the columnar grain zone of SAW weld, the presence of a certain amount of coarse ferrite side plate (FSP) increased the effective grain size to 13.2 μm and the mean grain size to 3.6 μm. There is a similar phenomenon in the reheated zone. The effective grain size of TIG weld in the reheated zone is 0.3–8.5 μm, with a mean grain size of 2.6 μm. For the reheated zone of SAW, the effective grain size (0.3–10.7 μm) and mean grain size (3.1 μm) are larger than those in the TIG reheating zone, due to its specific wide coarse grain zone. The results of misorientation distributions indicate that the fraction of high-angle boundaries of SAW weld is greater than that of TIG weld in the columnar grain zone and the reheated zone. For SAW weld, the columnar grain zone contains an amount of AF, and almost all ferrite plates of AF are high-angle boundaries [27]. The prior austenite grain is divided into several parts by packet boundaries in the reheated zone, and the lath bainite packet boundaries belong to large-angle boundaries [28,29]. A small quantity of lath bainite can be observed around blocky ferrite in the reheated zone of TIG weld, but the lath boundaries inside a packet are low-angle boundaries.
Figure 8 shows the micro-hardness distribution in each joint. As can be observed in Figure 8 the hardness of TIG weld is slightly higher than that of SAW weld. The hardness of TIG and SAW weld were 320 HV and 315 HV, respectively. The hardness of weld metal was affected by the grain size, dislocation density, the distribution of carbides and other factors. For TIG weld, the grains were finer, but contained partial blocky ferrite with lower dislocation density. For SAW weld, the grains were relatively larger, but contained more AF with high dislocation density. This is one possible reason why TIG weld metal hardness is comparable to that of SAW. The hardness in the heat affected zones (HAZ) on both sides of the two welds was higher than those of weld metals (WM) and base metals (BM), and this is consistent with previous reports [7]. The low hardness in the weld center may be related to the softening effect caused by multiple thermal cycles.

3.2. Micro-Segregation at Columnar Grain Boundary

To clarify the relationship between chemical composition and microstructure, the EPMA quantitative point analysis of Ni, Mn, Mo and Cr at the dendritic boundaries and dendrite core regions of the two weld metals is shown in Figure 9. Considering the high requirements of the EPMA test on the surface quality of the sample, the sample was first chemically etched and marked with micro-hardness indentation, and then the sample was electropolished. Figure 9a,b shows the EPMA results in the columnar grain zone of TIG and SAW weld, respectively. The concentrations of Ni, Mn and Mo at the dendritic boundaries are higher than those in the dendrite core regions. The maximum Ni and Mn contents observed at the dendritic boundaries of TIG weld were 1.82% and 2.02%, respectively, and the minimum values found at the dendritic core were 1.20% and 1.31%. This inhomogeneous distribution of alloying elements observed in weld metal is consistent with Khodir’s experimental results [30]. During the welding solidification process, solute elements are re-distributed, and this results in micro-segregation across the dendrite substructure in fusion welds. The location of micro-segregation depends on the equilibrium distribution coefficient k [31]. When the equilibrium distribution coefficient k is less than 1, the solute elements are segregated to dendritic boundary regions, and the degree of micro-segregation will increase with decreasing k value. When the equilibrium distribution coefficient k is greater than 1, the solute elements are segregated to dendritic core regions, and the degree of micro-segregation will increase with increasing k value. The equilibrium distribution coefficient is defined as k = CS/CL, as shown in Figure 10. CS and CL are the compositions of the solid and liquid at the S/L interface, respectively. Assuming that the solidus and liquidus lines are both straight lines, the value of k is independent to temperature. According to the triangle similarity principle, as temperature decrease from T1 to T2, k = CS/CL=tanα/tanβ, is invariable because of the constant α and β. In order to obtain the equilibrium distribution coefficient of weld metal at the initial stage of solidification, a simple Fe-Ni binary equilibrium phase diagram was used to estimate the k value. Figure 11 shows the simple Fe-Ni binary diagram. Considering the influence of other alloy elements in weld metal, the Ni equivalent was used to approximately replace the Ni content in order to use this Fe-Ni binary equilibrium phase diagram to explain the micro-segregation in this study. The nickel equivalent could be estimated using Equation (1) [22]:
Nieq = 30%C + Ni% + 0.5Mn% + 0.3Cu%
Nickel equivalents estimated from Equation (1) were 2.664 and 2.974 for TIG and SAW weld metals, respectively. When the temperature decreases from 1800 K to the peritectic reaction temperature, and the Ni content is less than 5.2%, k is a constant (0.77) at this stage. During solidification, micro-segregation will occur in dendritic boundary regions, and the solid phase is δ-ferrite. The Ni content in the dendritic core can also be calculated as kC0, where C0 is the nominal composition of the Ni element. Through the analysis of the phase diagram and Ni equivalent in weld metal, the results show that micro-segregation will occur in both SAW and TIG weld metal during solidification from liquid phase to δ-ferrite, but the compositions of the final dendritic boundary regions are different due to the various nominal alloy compositions. When austenitzing solute elements, such as Ni and Mn, which are segregated at dendritic boundary regions, austenite is transformed from δ-ferrite at lower temperatures. With temperature decreasing, the bainite transformation occurred first at higher temperatures within the dendritic core regions owing to the lower solute content, and then martensite formed at dendritic boundaries regions [32]. For SAW weld, due to the presence of non-metallic inclusions, the austenite principally transformed to AF in the dendritic core regions. The out of sync phase transformation, caused by the inhomogeneous solute redistribution, will induce strain. Simultaneously, martensite transformation will also produce residual stress, which is consistent with the IQ map in Figure 6a,c.

4. Conclusions

The microstructure of TIG backing parts and SAW filling parts in a 25Cr2Ni2MoV steel low-pressure steam turbine welded rotors simulator has been investigated systematically by means of OM, SEM, EBSD and EPMA. The major conclusions can be drawn as follows:
  • In TIG weld, the microstructure was composed of lath bainite, blocky ferrite and tempered martensite. In SAW weld metals, the microstructure consisted of acicular ferrite, lath bainite, ferrite side plate and tempered martensite.
  • The grain size in columnar grain zone of TIG and SAW weld had a distinct discrepancy. The maximum effective grain sizes in TIG and SAW weld were 7.7 and 13.2 μm, respectively, which was attributed to the appearance of a coarse ferrite side plate in SAW weld.
  • The widths of the reheated zone were 180 and 500μm in TIG and SAW weld, respectively. Higher heat input of SAW welding led to the reheated zone having a larger size and temperature gradient, which caused the formation of WM-CG and the WM-FG zone. The prior austenite grain sizes of WM-CG and the WM-FG zone were 39 and 21 μm, respectively. PAGB could not be distinguished in the reheated zone of TIG weld.
  • During solidification, partial alloy elements, such as Ni and Mn, segregated at the dendritic boundaries. The contents of Ni and Mn at dendritic boundaries were 50% higher than those at dendritic core regions for SAW, and 30% higher for TIG. Ni and Mn segregation reduced the transformation temperature and resulted in martensite formation at room temperature in dendritic boundaries regions.
  • The hardness of TIG and SAW weld has no obvious distinction. The hardness of TIG and SAW weld is 320 HV and 315 HV, respectively.

Author Contributions

Writing—original draft preparation, C.H.; writing—review and editing, K.L.; supervision, Z.C. and J.P.; project administration, M.F.; funding acquisition, X.L. All authors have read and agreed to the published version of the manuscript.

Funding

This research was funded by National Natural Science Foundation of China [Project 51775300 and 51901113].

Acknowledgments

Shanghai Turbine Company, Shanghai, China and State Key Laboratory of Tribology, Beijing, China.

Conflicts of Interest

The authors declare no conflict of interest.

References

  1. Bandyopadhyay, N.; Briant, C.; Hall, E.J. Carbide precipitation, grain boundary segregation, and temper embrittlement in NiCrMoV rotor steels. Metall. Mater. Trans. A 1985, 16, 721–737. [Google Scholar] [CrossRef]
  2. Chen, R.K.; Gu, J.F.; Han, L.Z.; Pan, J.S. Novel process to refine grain size of NiCrMoV steel. Mater. Sci. Technol. Lond. 2013, 28, 773–777. [Google Scholar] [CrossRef]
  3. Liu, P.; Lu, F.; Liu, X.; Ji, H.; Gao, Y. Study on fatigue property and microstructure characteristics of welded nuclear power rotor with heavy section. J. Alloys Compd. 2014, 584, 430–437. [Google Scholar] [CrossRef]
  4. Liu, X.; Cai, Z.; Yang, S.; Feng, K.; Li, Z. Characterization on the Microstructure Evolution and Toughness of TIG Weld Metal of 25Cr2Ni2MoV Steel after Post Weld Heat Treatment. Metals 2018, 8, 160. [Google Scholar] [CrossRef] [Green Version]
  5. Bai, F.; Ding, H.; Tong, L.; Pan, L.; Wang, L. Microstructural Changes and Impact Toughness of Fill Pass in X80 Steel Weld Metal. Metals 2019, 9, 898. [Google Scholar] [CrossRef] [Green Version]
  6. Li, Y.; Cai, Z.; Li, K.; Pan, J.; Liu, X.; Sun, L.; Wang, P. Investigation of local brittle zone in multipass welded joint of NiCrMoV steel with heavy section. J. Mater. Res. 2018, 33, 923–934. [Google Scholar] [CrossRef]
  7. Rathod, D.W.; Francis, J.A.; Roy, M.J.; Obasi, G.; Irvine, N.M. Thermal cycle-dependent metallurgical variations and their effects on the through-thickness mechanical properties in thick section narrow-gap welds. Mat. Sci. Eng. A-Struct. 2017, 707, 399–411. [Google Scholar] [CrossRef]
  8. Zhang, L.; Pittner, A.; Michael, T.; Rhode, M.; Kannengiesser, T. Effect of cooling rate on microstructure and properties of microalloyed HSLA steel weld metals. Sci. Technol. Weld. Join. 2015, 20, 371–377. [Google Scholar] [CrossRef]
  9. Wen, C.; Wang, Z.; Deng, X.; Wang, G.; Misra, R.D.K. Effect of Heat Input on the Microstructure and Mechanical Properties of Low Alloy Ultra-High Strength Structural Steel Welded Joint. Steel Res. Int. 2018, 89, 1700500. [Google Scholar] [CrossRef]
  10. Han, X.-L.; Wu, D.-Y.; Min, X.-L.; Wang, X.; Liao, B.; Xiao, F.-R. Influence of post-weld heat treatment on the microstructure, microhardness, and toughness of a weld metal for hot bend. Metals 2016, 6, 75. [Google Scholar] [CrossRef] [Green Version]
  11. Bose-Filho, W.W.; Carvalho, A.L.M.; Strangwood, M. Effects of alloying elements on the microstructure and inclusion formation in HSLA multipass welds. Mater. Charact. 2007, 58, 29–39. [Google Scholar] [CrossRef]
  12. Qi, X.; Di, H.; Sun, Q.; Wang, X.; Chen, X.; Gao, Y.; Liu, Z. A comparative analysis on microstructure and fracture mechanism of X100 pipeline steel CGHAZ between laser welding and arc welding. J. Mater. Eng. Perform. 2019, 28, 7006–7015. [Google Scholar] [CrossRef]
  13. Keehan, E.; Zachrisson, J.; Karlsson, L. Influence of cooling rate on microstructure and properties of high strength steel weld metal. Sci. Technol. Weld. Join. 2013, 15, 233–238. [Google Scholar] [CrossRef]
  14. Prijanovič, U.; Prijanovič Tonkovič, M.; Trdan, U.; Pleterski, M.; Jezeršek, M.; Klobčar, D. Remote fibre laser welding of advanced high strength martensitic steel. Metals 2020, 10, 533. [Google Scholar]
  15. Mao, G.; Cao, R.; Yang, J.; Jiang, Y.; Wang, S.; Guo, X.; Yuan, J.; Zhang, X.; Chen, J. Effect of nickel contents on the microstructure and mechanical properties for low-carbon bainitic weld metals. J. Mater. Eng. Perform. 2017, 26, 2057–2071. [Google Scholar] [CrossRef]
  16. Huang, G.; Wan, X.; Wu, K.; Zhao, H.; Misra, R. Effects of small Ni addition on the microstructure and toughness of coarse-grained heat-affected zone of high-strength low-alloy steel. Metals 2018, 8, 718. [Google Scholar] [CrossRef] [Green Version]
  17. Bhole, S.D.; Nemade, J.B.; Collins, L.; Liu, C. Effect of nickel and molybdenum additions on weld metal toughness in a submerged arc welded HSLA line-pipe steel. J. Mater. Process. Technol. 2006, 173, 92–100. [Google Scholar] [CrossRef]
  18. Kang, B.Y.; Kim, H.J.; Hwang, S.K. Effect of Mn and Ni on the variation of the microstructure and mechanical properties of low-carbon weld metals. ISIJ Int. 2000, 40, 1237–1245. [Google Scholar] [CrossRef] [Green Version]
  19. Wang, X.L.; Nan, Y.R.; Xie, Z.J.; Tsai, Y.T.; Yang, J.R.; Shang, C.J. Influence of welding pass on microstructure and toughness in the reheated zone of multi-pass weld metal of 550 MPa offshore engineering steel. Mat. Sci. Eng. A-Struct. 2017, 702, 196–205. [Google Scholar] [CrossRef]
  20. Kou, S.; Le, Y. The effect of quenching on the solidification structure and transformation behavior of stainless steel welds. Metall. Mater. Trans. A 1982, 13, 1141–1152. [Google Scholar] [CrossRef]
  21. Munitz, A. Microstructure of rapidly solidified laser molten AI-4.5 Wt Pct Cu Surfaces. Metall. Mater. Trans. B 1985, 16, 149–161. [Google Scholar] [CrossRef]
  22. Zhang, Z.; Farrar, R.A. Columnar grain development in C-Mn-Ni low-alloy weld metals and the influence of nickel. J. Mater. Sci. 1995, 30, 5581–5588. [Google Scholar] [CrossRef]
  23. Babu, S.S. The mechanism of acicular ferrite in weld deposits. Curr. Opin. Solid State Mater. Sci. 2004, 8, 267–278. [Google Scholar] [CrossRef]
  24. Wang, B.; Hu, J.; Hu, Y.; Pu, L. The effect of peak temperature on HAZ microstructure and toughness of V- and Nb-bearing microalloyed steels. Trans. Indian Inst. Met. 2019, 72, 1119–1127. [Google Scholar] [CrossRef]
  25. Yang, X.; Di, X.; Liu, X.; Wang, D.; Li, C. Effects of heat input on microstructure and fracture toughness of simulated coarse-grained heat affected zone for HSLA steels. Mater. Charact. 2019, 155, 109818. [Google Scholar] [CrossRef]
  26. Wright, S.I.; Nowell, M.M.; Field, D.P. A review of strain analysis using electron backscatter diffraction. Microsc. Microanal. 2011, 17, 316–329. [Google Scholar] [CrossRef]
  27. Gourgues, A.-F.; Flower, H.M.; Lindley, T.C. Electron backscattering diffraction study of acicular ferrite, bainite, and martensite steel microstructures. Mater. Sci. Technol.-Lond 2000, 16, 26–40. [Google Scholar] [CrossRef]
  28. Wen, C.; Deng, X.; Tian, Y.; Wang, Z.; Misra, R.D.K. Microstructural evolution and toughness of the various HAZs in 1300-MPa-grade ultrahigh-strength structural steel. J. Mater. Eng. Perform. 2019, 28, 1301–1311. [Google Scholar] [CrossRef]
  29. Morsdorf, L.; Jeannin, O.; Barbier, D.; Mitsuhara, M.; Raabe, D.; Tasan, C.C. Multiple mechanisms of lath martensite plasticity. Acta Mater. 2016, 121, 202–214. [Google Scholar] [CrossRef]
  30. Khodir, S.; Shibayanagi, T.; Takahashi, M.; Abdel-Aleem, H.; Ikeuchi, K. Microstructural evolution and mechanical properties of high strength 3–9% Ni-steel alloys weld metals produced by electron beam welding. Mater. Des. 2014, 60, 391–400. [Google Scholar] [CrossRef]
  31. Kou, S. Welding Metallurgy, 2nd ed.; John Wiley & Sons Inc.: Hoboken, NJ, USA, 2003; pp. 431–446. [Google Scholar]
  32. Keehan, E.; Karlsson, L.; Andrén, H.O.; Bhadeshia, H.K.D.H. Influence of carbon, manganese and nickel on microstructure and properties of strong steel weld metals: Part 2—Impact toughness gain resulting from manganese reductions. Sci. Technol. Weld. Join. 2013, 11, 9–18. [Google Scholar] [CrossRef]
Figure 1. The schematic welded rotor simulator and the dimensions and location of the metallographic specimens.
Metals 10 00603 g001
Figure 2. Macrographs of weld metal: (a) TIG, (b) SAW.
Metals 10 00603 g002
Figure 3. Optical microstructures in the columnar grain zone of weld metal:(a) and (c) TIG, (b) and (d) SAW.
Metals 10 00603 g003
Figure 4. Optical microstructures of the reheated zone of weld metal: (ac) SAW; (d,e) TIG.
Metals 10 00603 g004
Figure 5. SEM micrographs in the columnar grain zone and the reheated zone of weld metal: (a) Columnar grain zone of TIG; (b) Reheated zone of TIG; (c) Columnar grain zone of SAW; (d) Reheated zone of SAW.
Metals 10 00603 g005
Figure 6. EBSD image quality (IQ) and inverse pole figure (IPF): (a) and (e) columnar grain zone of TIG; (b) and (f) reheated zone of TIG; (c) and (g) columnar grain zone of SAW; (d) and (h) reheated zone of SAW.
Metals 10 00603 g006
Figure 7. The distributions of grain size and number fraction of misorientation angles in columnar grain and reheated zones of weld metal. (a) The distribution of grain size of columnar grain zone in TIG and SAW weld; (b) The distribution of grain size of WM-HAZ in TIG and SAW weld; (c) The distribution of misorientation angles of columnar grain zone in TIG and SAW weld; (d) The distribution of misorientation angles of WM-HAZ in TIG and SAW weld.
Metals 10 00603 g007
Figure 8. Micro-hardness maps of weld metal: (a) TIG, (b) SAW.
Metals 10 00603 g008
Figure 9. EPMA line scan of weld metal: (a) and (c) TIG; (b) and (d) SAW.
Metals 10 00603 g009
Figure 10. The schematic diagram of equilibrium distribution coefficient k.
Metals 10 00603 g010
Figure 11. The high temperature portion of Fe-Ni binary diagram.
Metals 10 00603 g011
Table 1. The composition of base metal and filler metals (wt.%).
MaterialsCSiMnCrMoNiVAlCuTi
BM0.220.070.182.340.752.240.050.003//
TIG FM0.080.611.620.200.531.440.0050.0030.130.06
SAW FM0.090.211.410.570.512.23//0.04/
Table 2. The detailed welding process parameters.
Welding MethodWire Diameter (mm)Current (A)Voltage (V)Speed (mm/min)GasHeat Input (KJ/cm)
TIG121011.290Ar 99.999%13
SAW3.242029420/26

