4.1. Bainitic Transformation
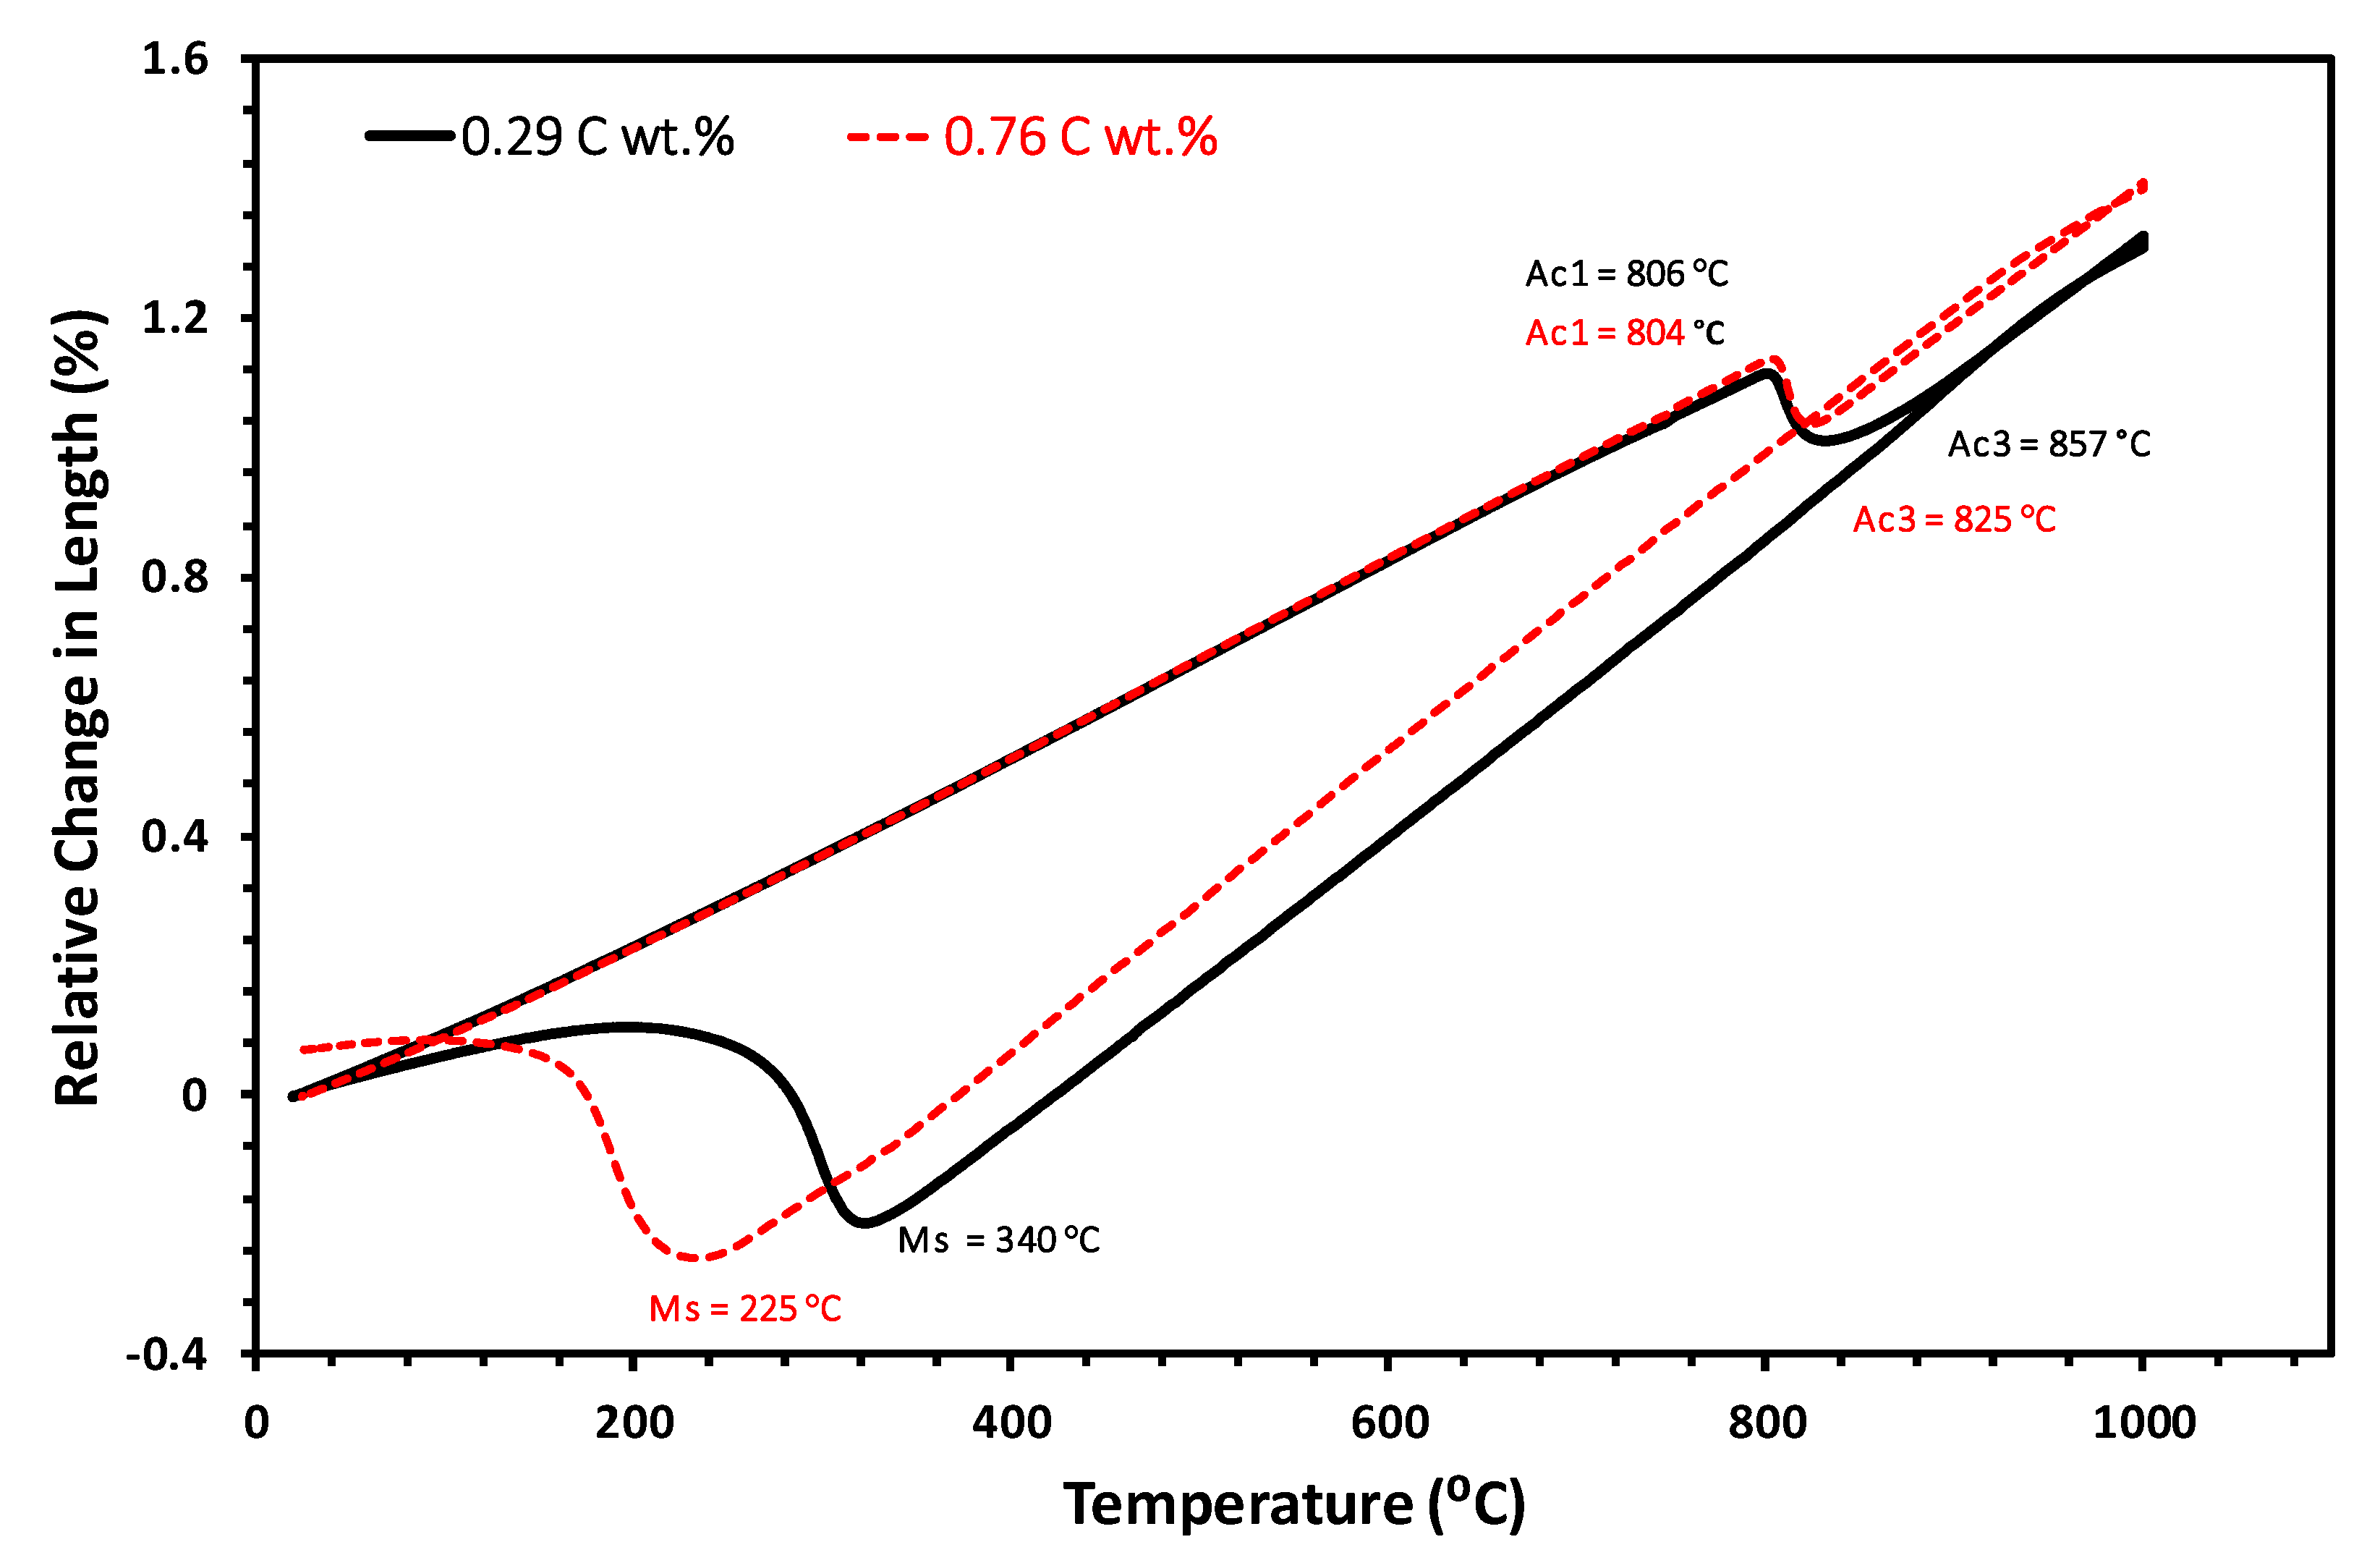
As expected, for the case steel, the RLC-T curves show constant slope down to the isothermal bainitic transformation temperature, indicating that no phase transformation occurred during cooling. However, for the core steel, this behavior depends on the applied T
γ. Thus, while for full austenitization, T
γ = 900 °C, martensitic transformation is observed around 360–370 °C, with a higher degree of transformation for the T
iso = 250 °C, for T
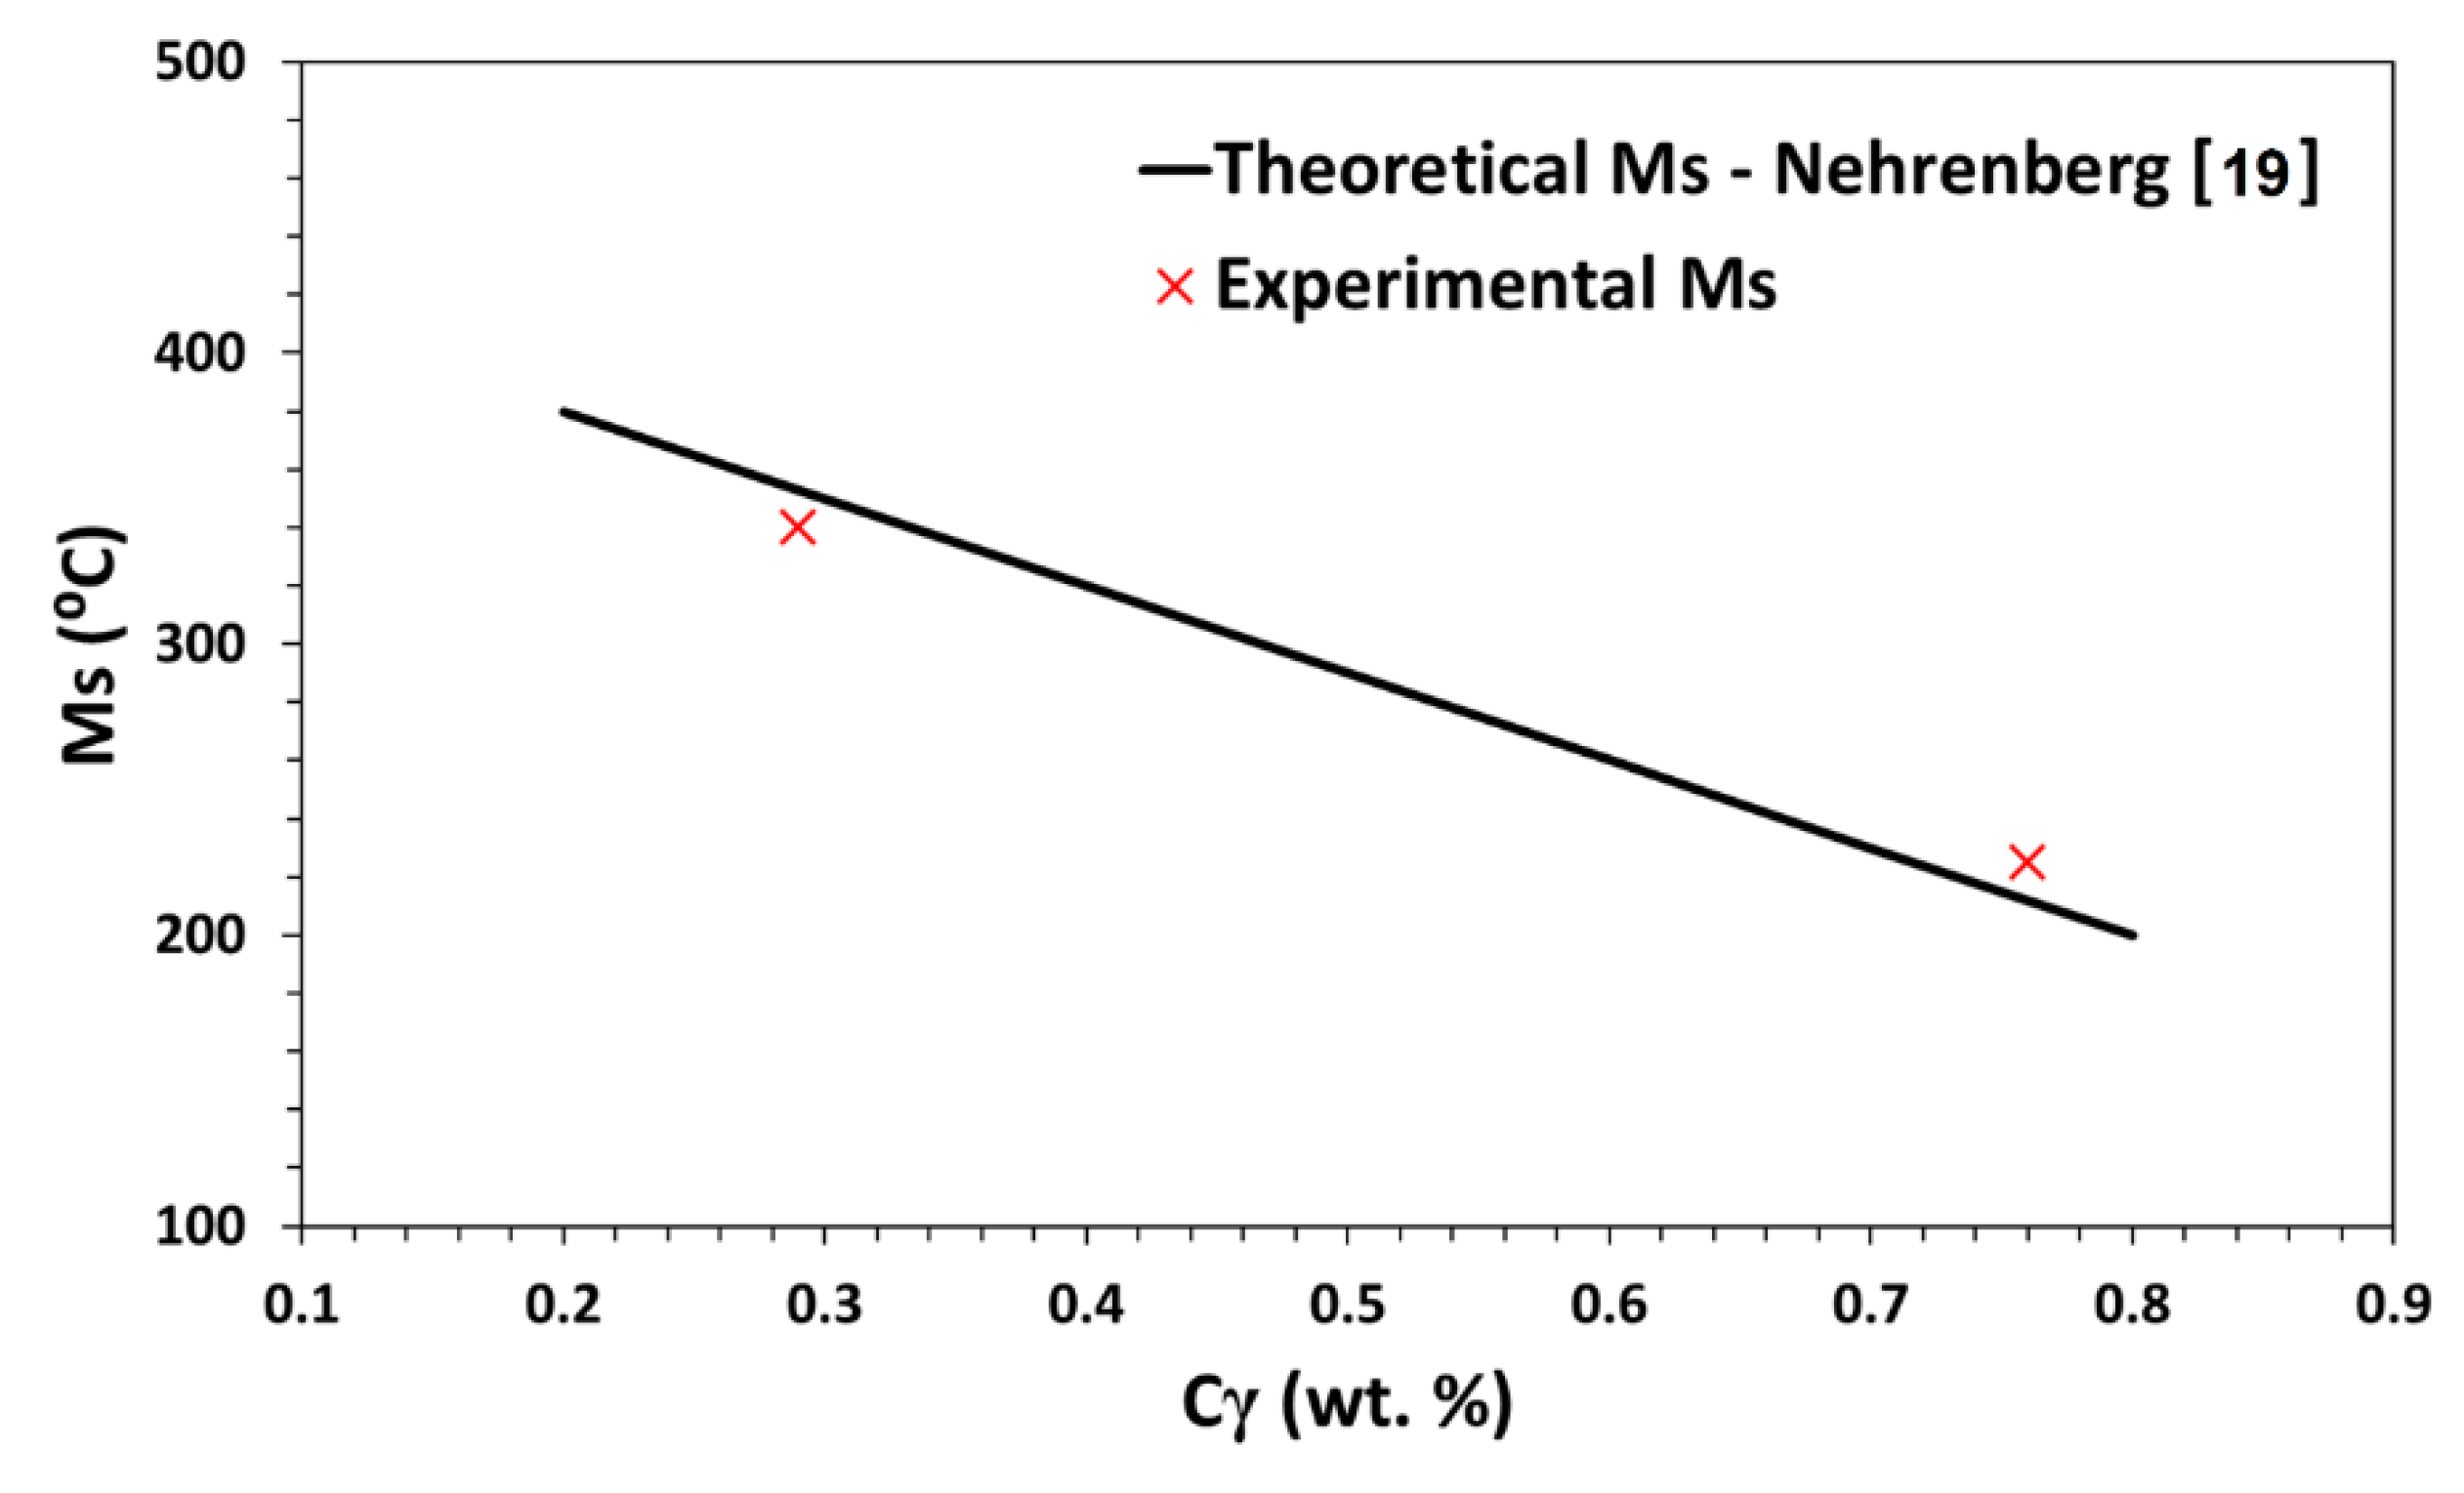
γ = 830 °C martensite (α’) only forms when cooling to 250 °C, at 291 °C. Those results are in line with the expected C enrichment of austenite when austenitizing in the α + γ field, i.e., intercritical austenitization at 830 °C. Note that the observed Ms temperature,
Table 5, fits well with that estimated in
Figure 3, corroborating the validity of the performed calculations.
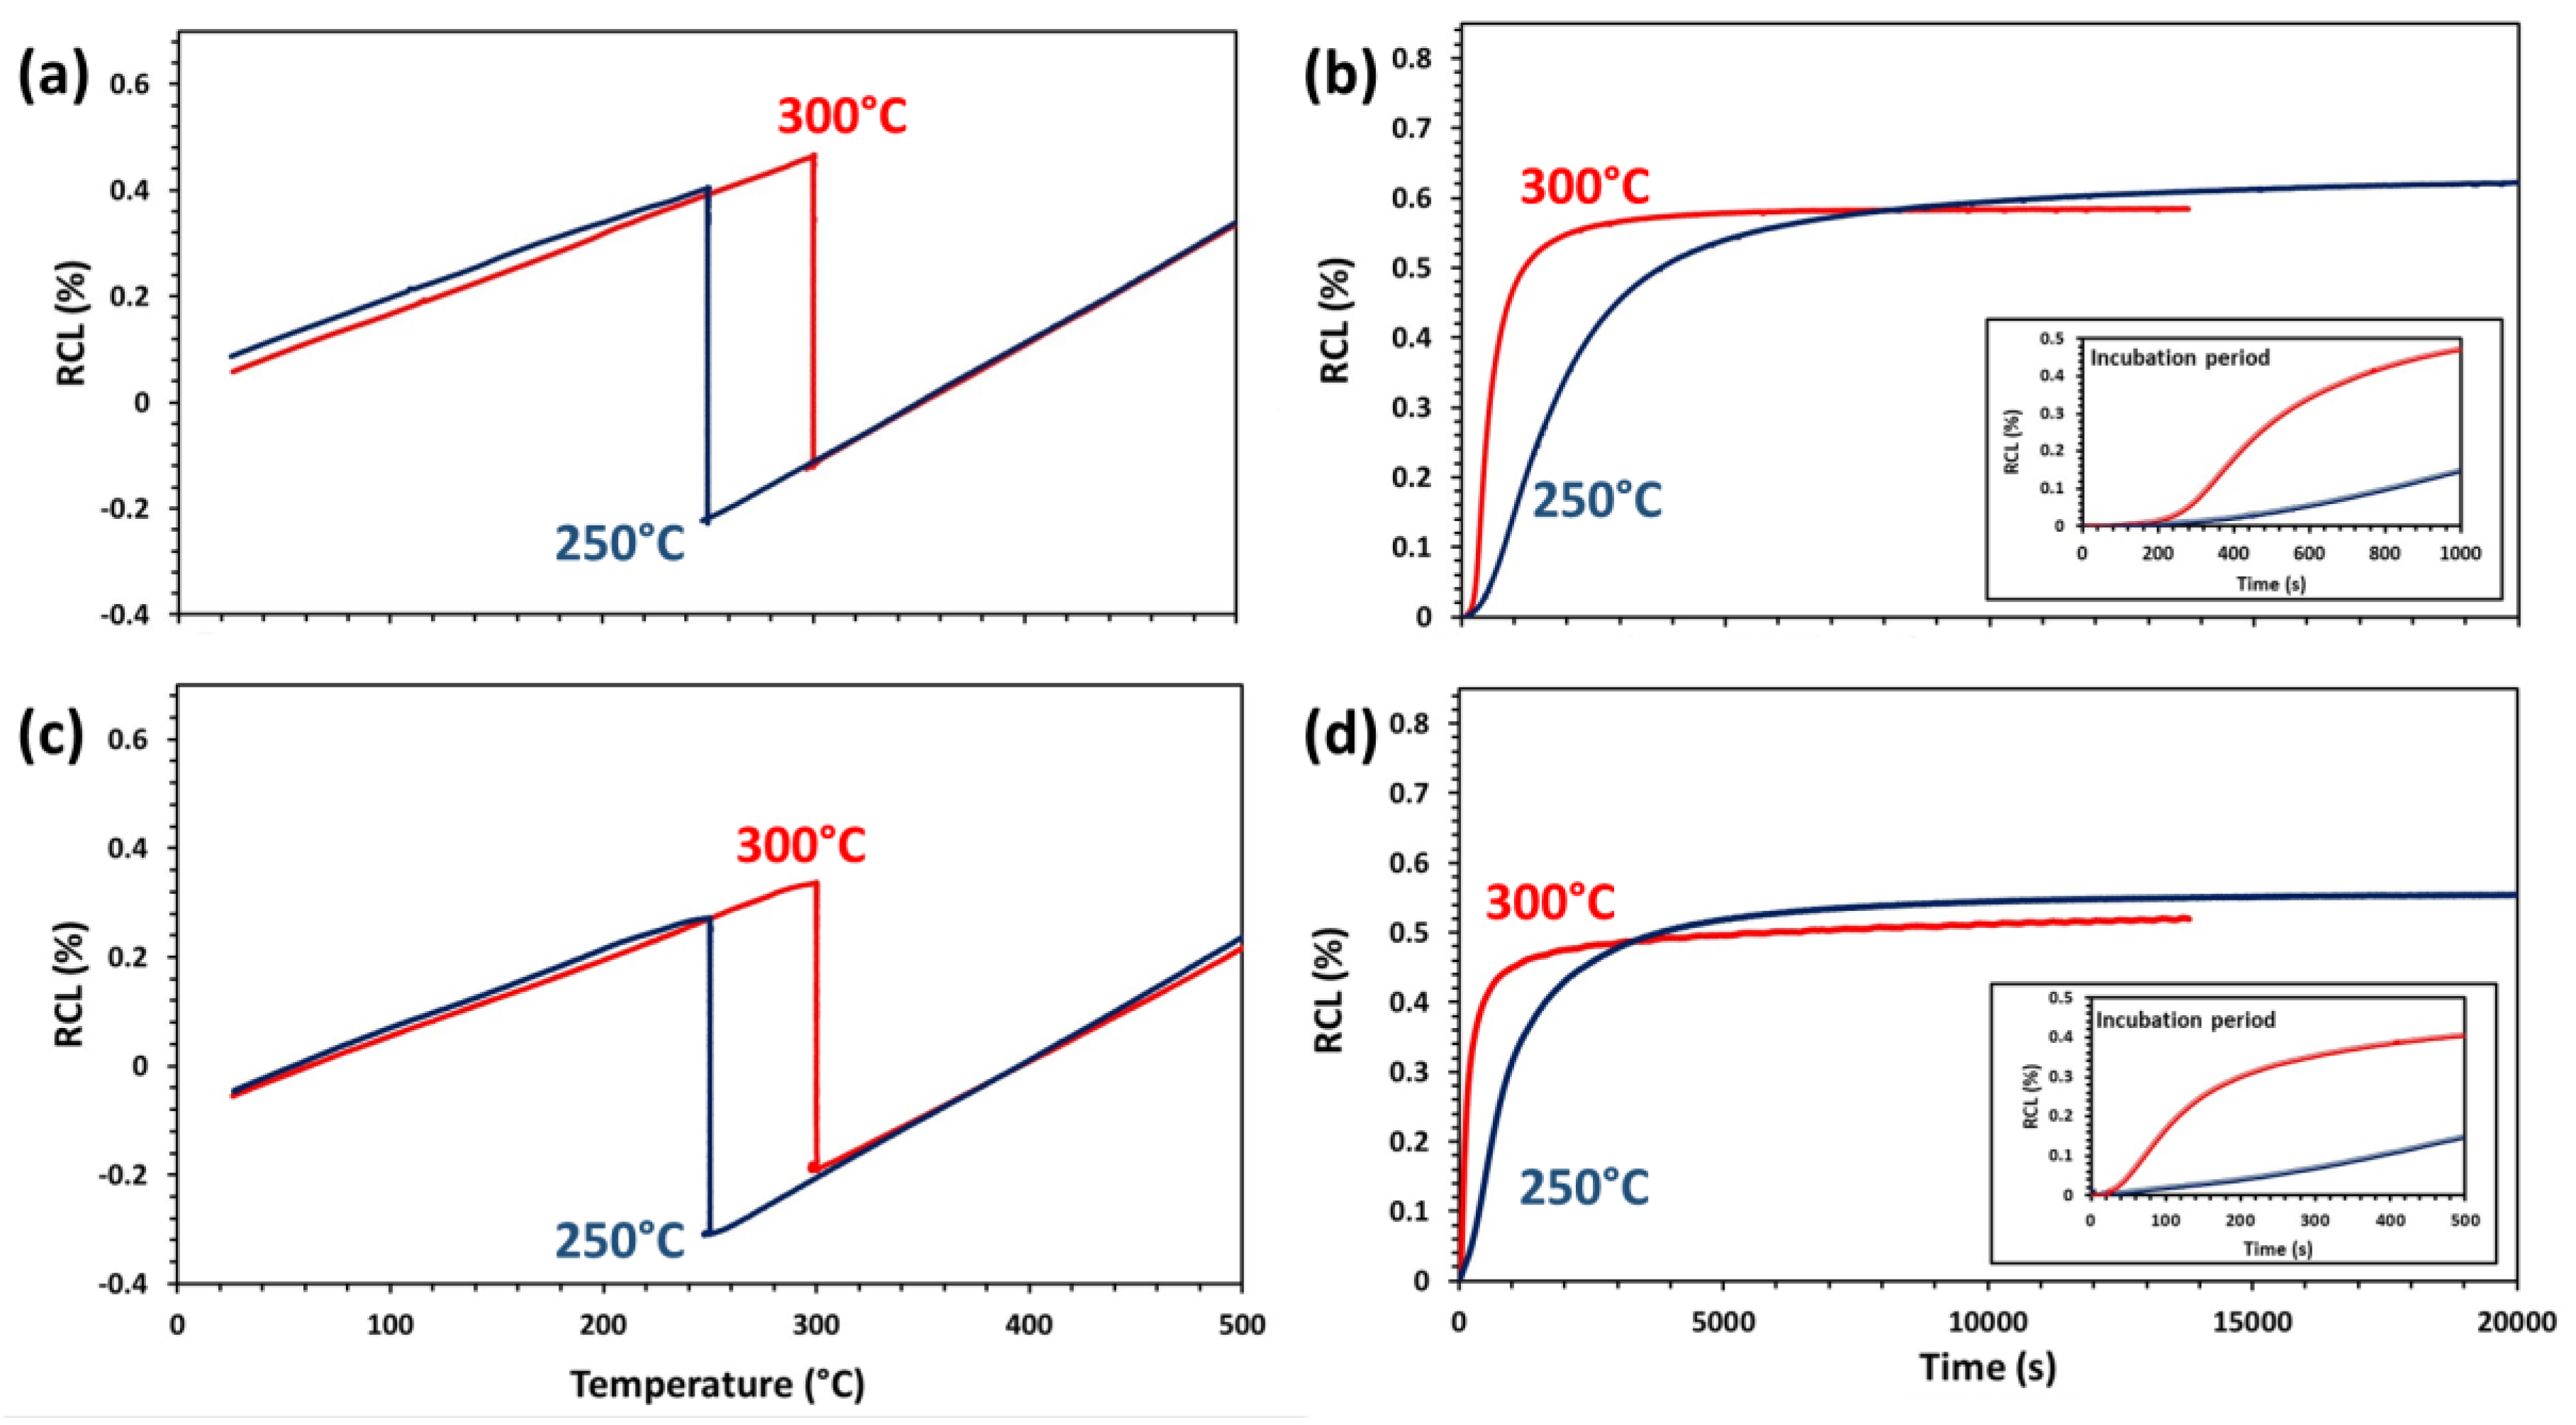
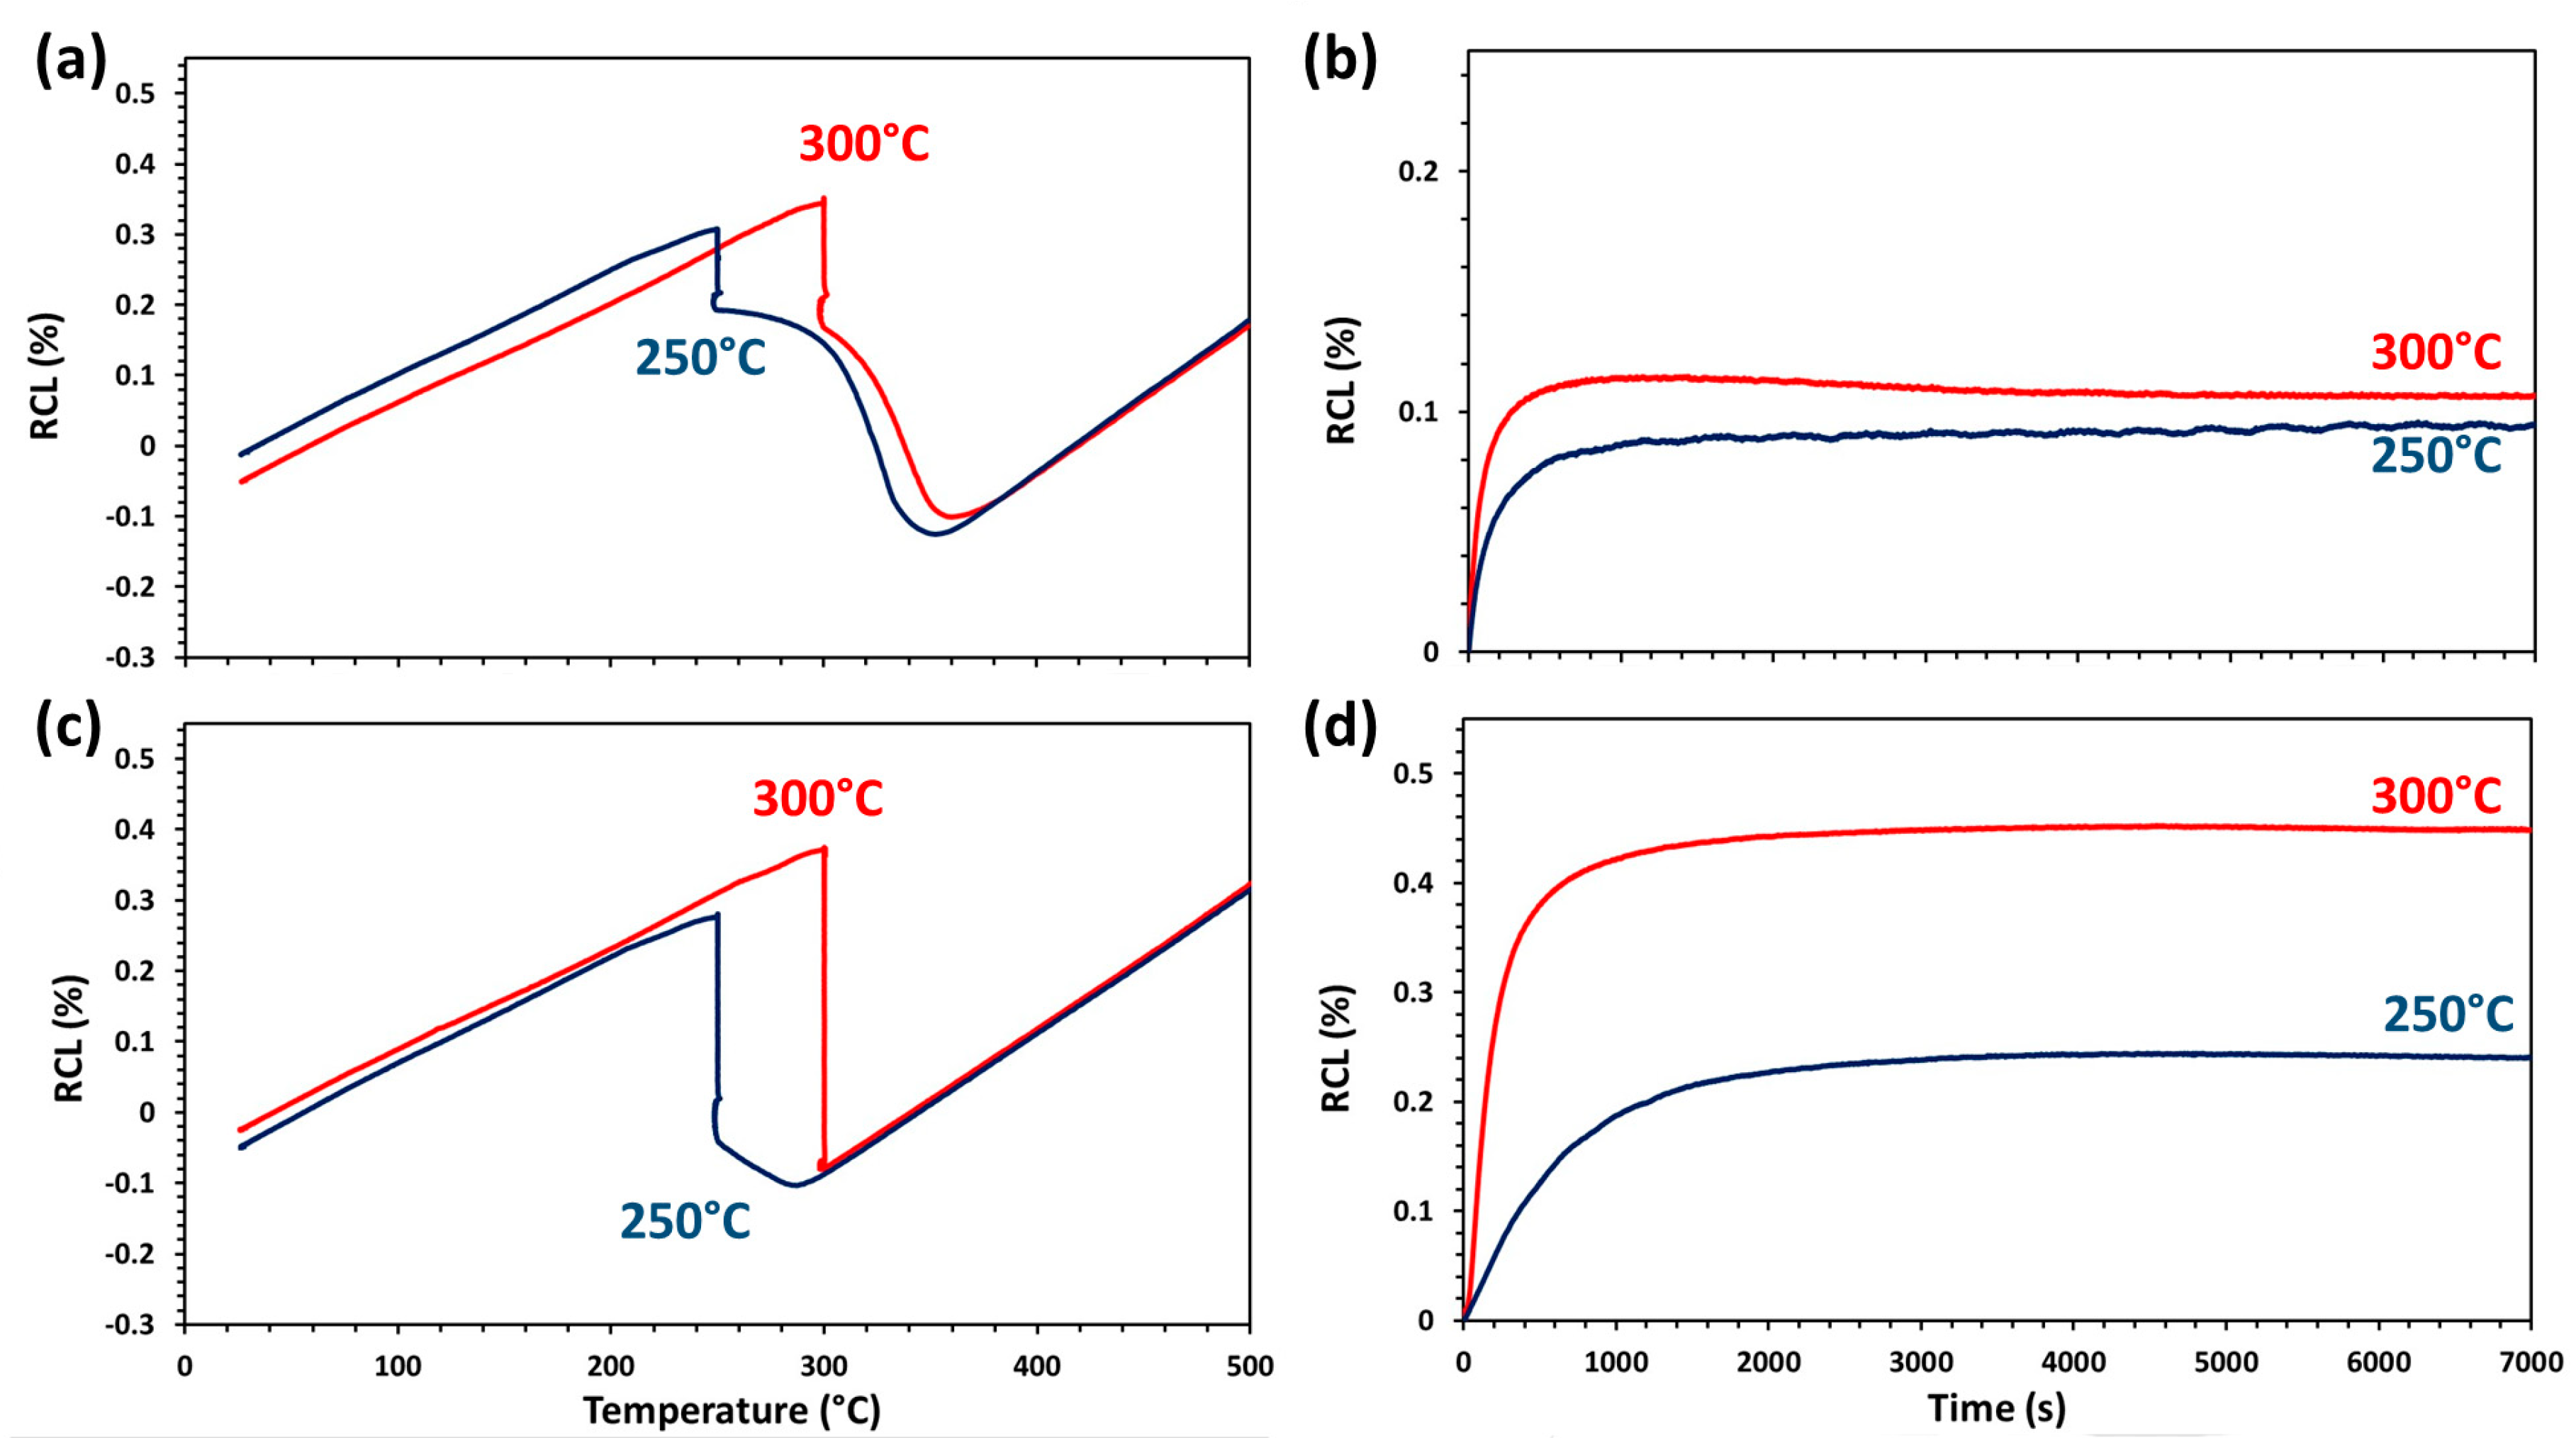
The sigmoidal curve obtained during isothermal bainitic transformation,
Figure 4b–d and
Figure 5b–d, has a first stage named incubation time during which the transformation has not yet started, or it is not yet detectable by the experimental techniques used. The core steel shows almost no incubation time. On the other hand, for the case steel, bainitic transformation starts after an incubation time of 400 and 200 s at 250 and 300 °C, respectively, and for T
γ = 830 °C these incubation times are even shorter, an effect that can be attributed to the accelerating effect on bainitic transformation when decreasing the prior austenite grain size (PAGS) [
22,
23]. It is also worth noting that, in any case, the reported incubation times are much shorter than those reported by Garcia-Mateo et al. [
28] for wrought steels of similar chemical composition, 1.0 and 0.8 C (wt.%). The short incubation times for the case steel can be associated with the formation of acicular bainite in non-metallic inclusions and a concomitant catalytic effect on the bainitic reaction, local chemistry variations associated with chemical microsegregation in the cast steel may have an influence as well. However, currently there are not enough data and this matter can be the subject of future research.
A second stage in the curve, where nucleation and growth occur, is characterized by a steady and continuous increase of the RCL, leading to the final stage where no further transformation occurs and a steady state or plateau is reached. The times to reach the end of the transformation, contained within the plateau of the RCL curve, were calculated according to the procedures described by Santajuana et al. [
29] with a threshold of zero. The results thus obtained for the 0.76 wt.% C showed that, regardless of the chosen T
γ, at 250 °C, 4 h are needed while at 300 °C the transformation only needed 2 h. In the case of the core steel, the times are drastically reduced to 20 and 12 min, for T
γ = 900 °C, and to 40 and 25 min, for T
γ = 830 °C, for the transformation at 250 and 300 °C, respectively. The results also agree with the bainite transformation theory reported by Bhadeshia [
2] in terms of slower transformation, as the transformation temperature decreases and/or C of the transforming austenite increases.
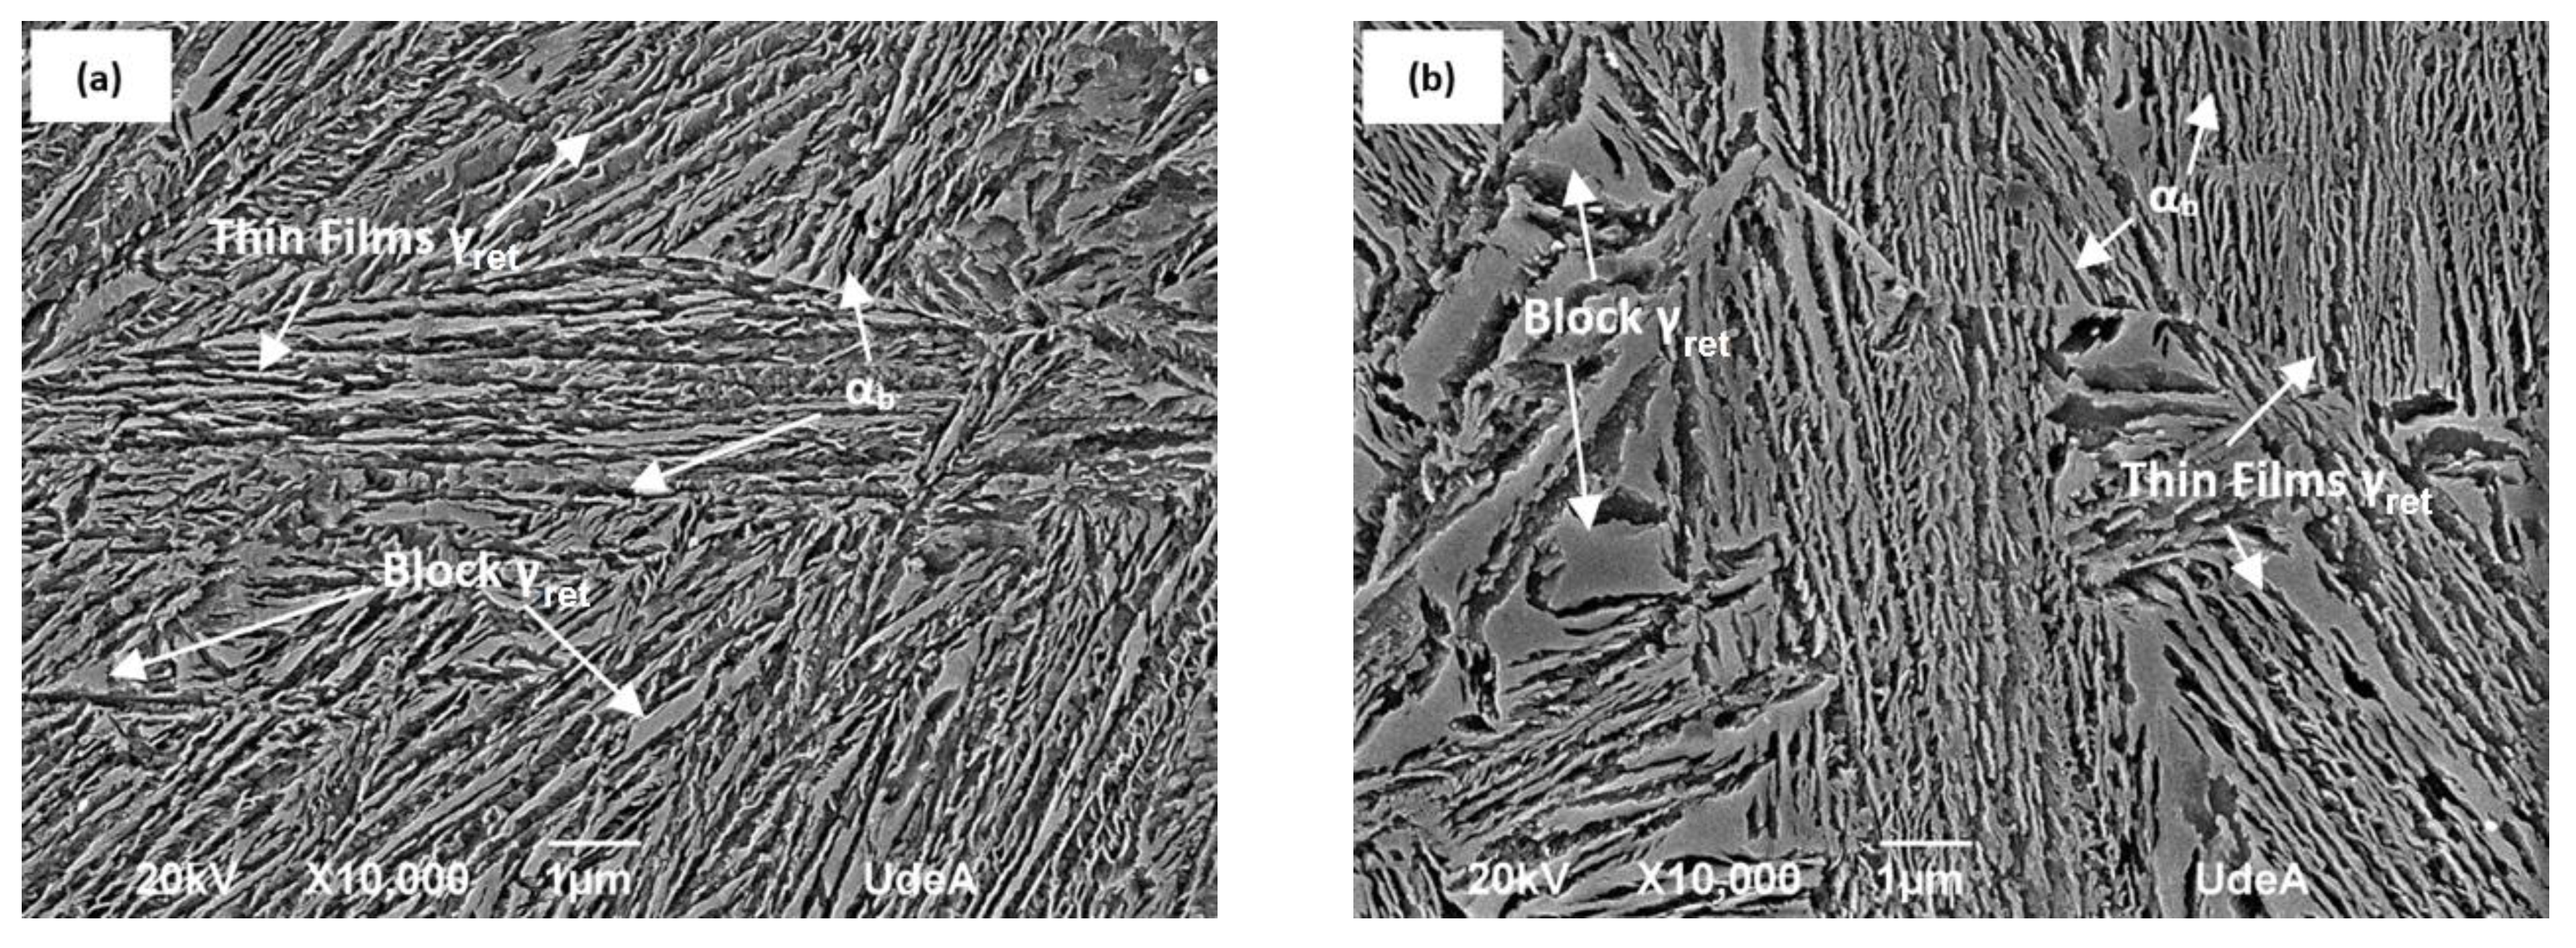
According to the To line theory, development by Bhadeshia [
2], that rules the bainitic transformation, it is expected that the lower the transformation T and/or the C content of the parent γ, the higher is the amount of α
b that it forms, and that should be directly linked to higher RCL-t dilatometric curves. It is clear that, this being the case for the 0.76 wt.% C steel,
Figure 4b,d, it is not for the core steel.
Figure 5b,d show that a large amount of austenite transforms to martensite before isothermal holding, and under this condition much less ferritic bainitic may be transformed from residual austenite and the principal microestructural change is the tempering of the martensite.
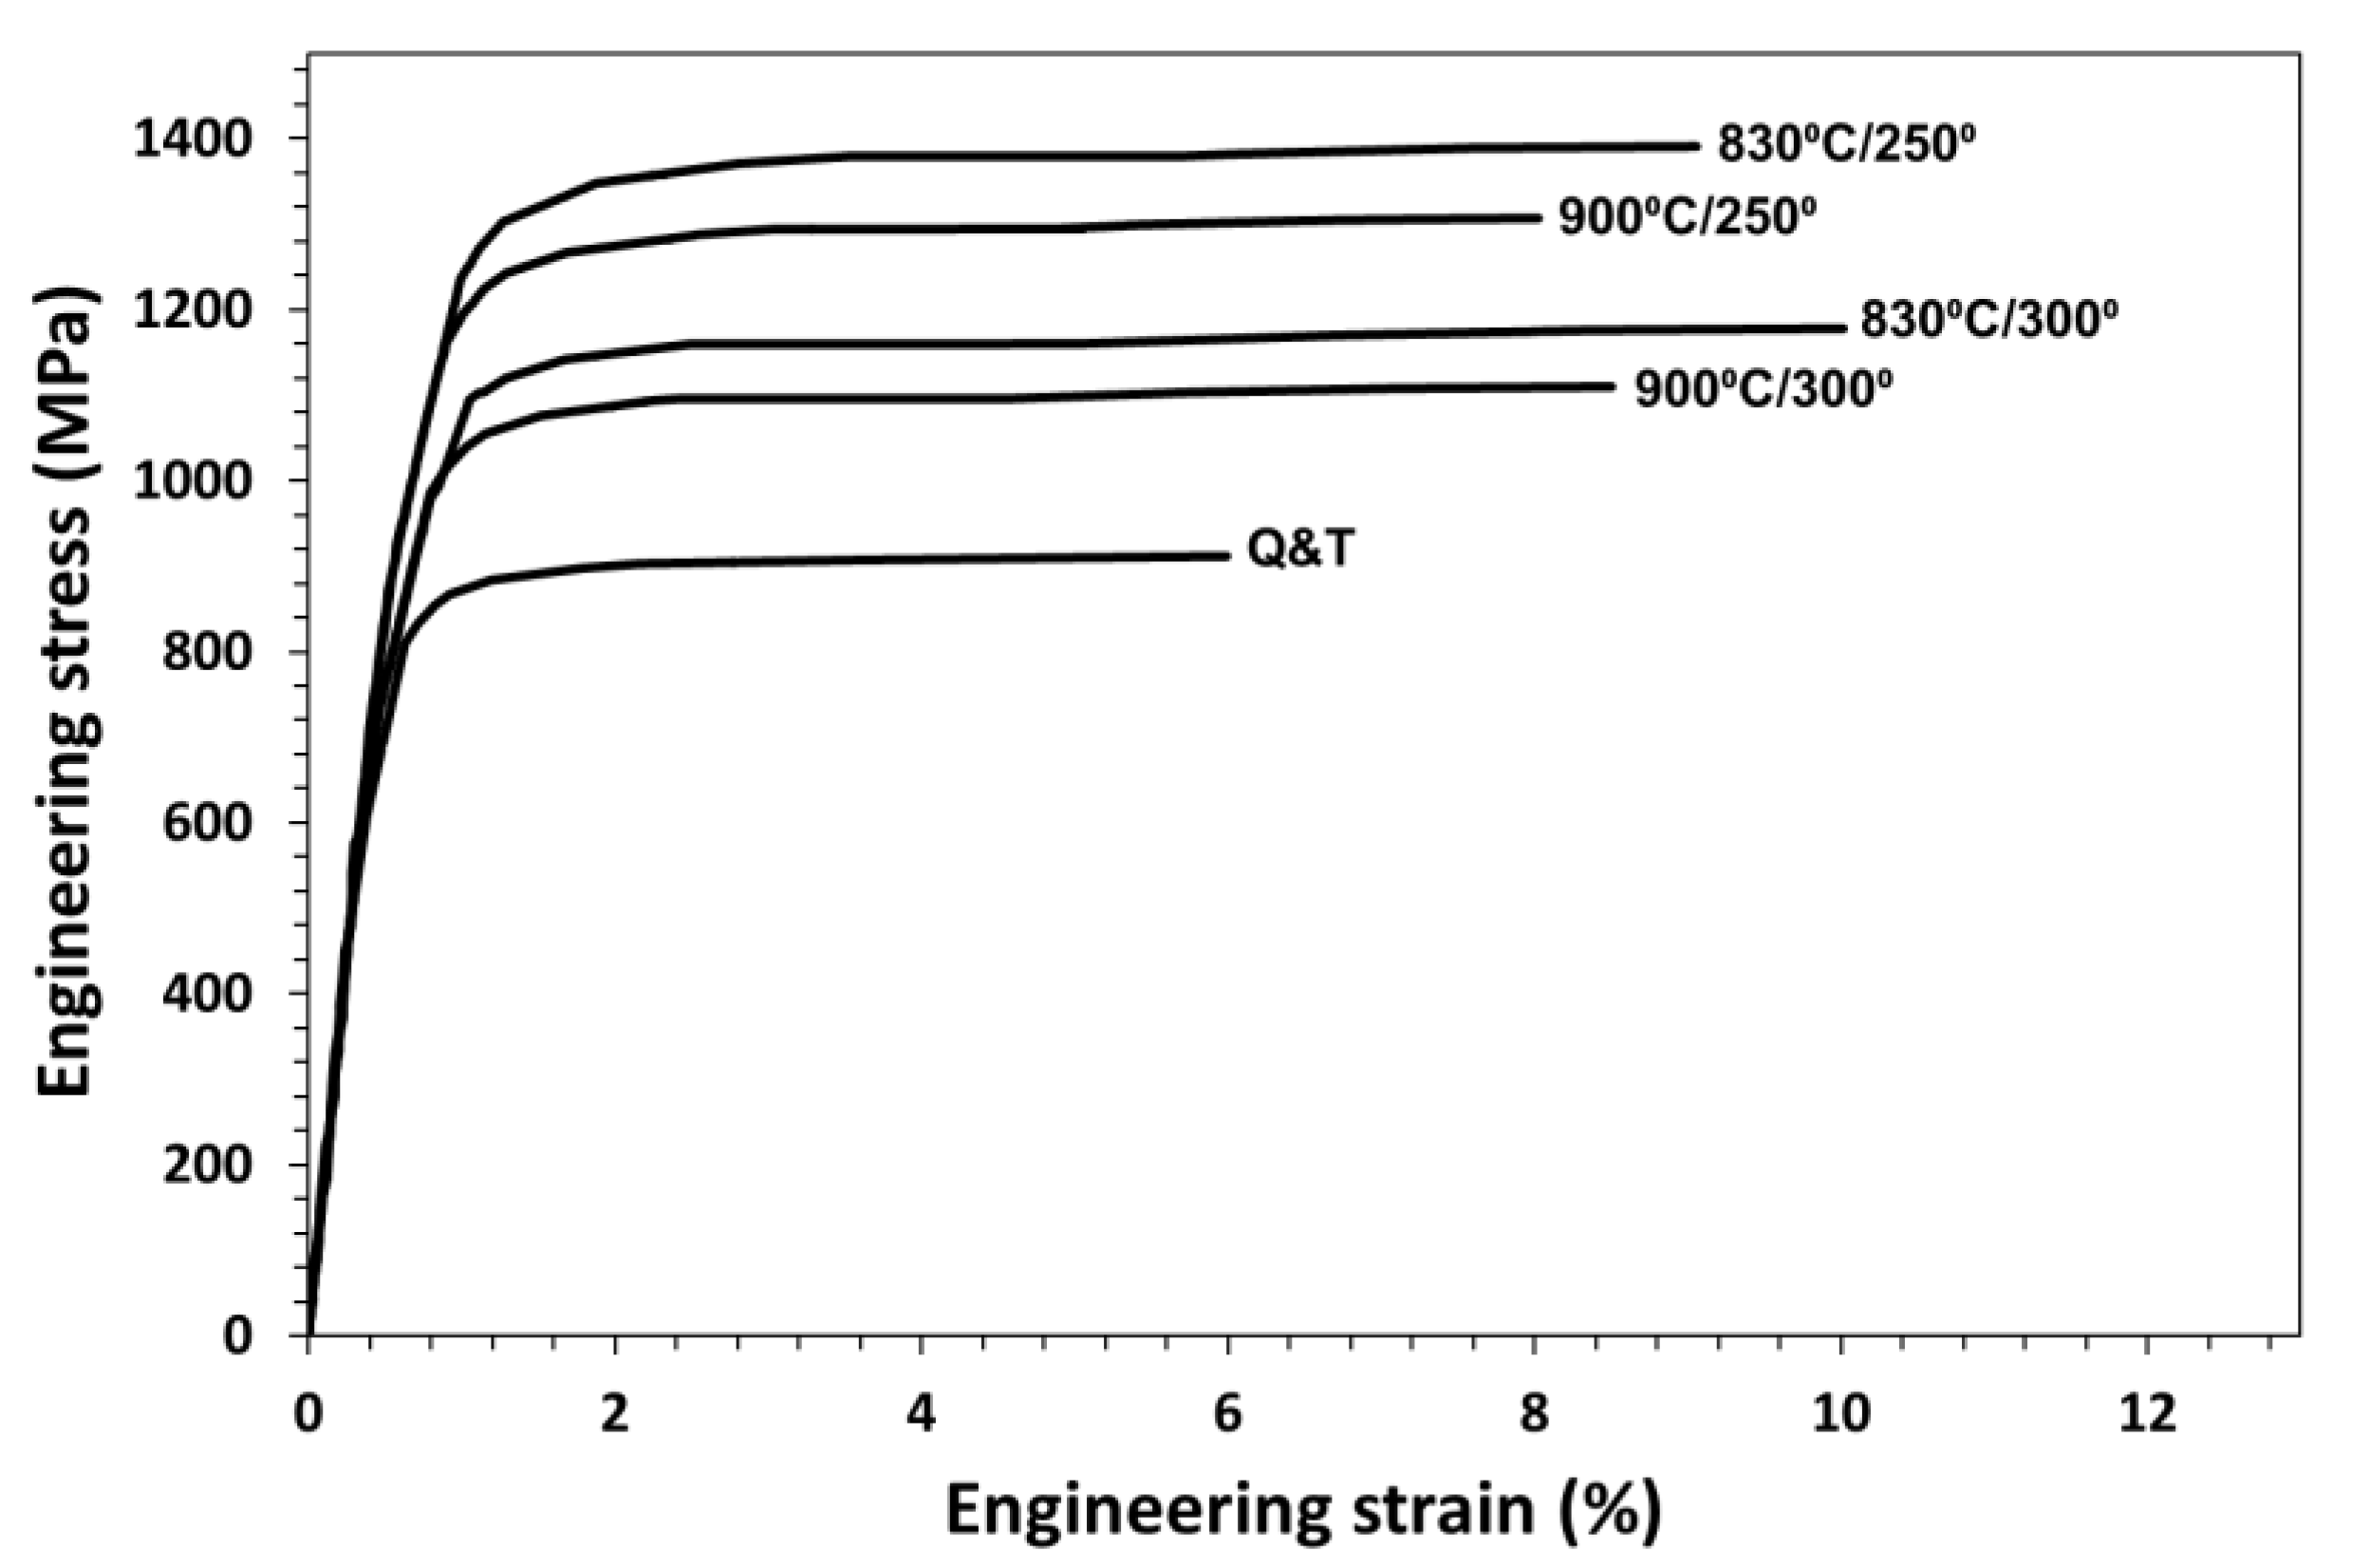
4.2. Mechanical Properties
The tensile and Charpy V-notched impact energy tests were conducted at room temperature in samples heat-treated under the conditions just described, and results thus obtained are summarized in
Table 6. Given that the phase composition and microstructure change gradually from the surface to the core (see
Figure 10 and
Figure 11) in the tensile and Charpy specimens, the description of the mechanisms behind the mechanical behavior are very complicated, and, therefore, it is hard to reach clear conclusions. The next paragraphs intend to throw some light on these matters.
The results showed that, regardless of the austenitization T, in terms of strength (YS and UTS), ductility (TE) and impact energy, the microstructures obtained by isothermal heat treatment performed much better than those obtained by the more traditional Q&T treatment. Regarding the effect of the isothermal heat treatment temperature, at 250 °C the microstructures are stronger but toughness and ductility suffer and are lower than in the case of treatment at 300 °C, which is rationalized in terms of a higher fraction of martensite through the section of the sample. As for the effect of T
γ, data of microstructural characterization in
Table 5 show, for a given value of the T
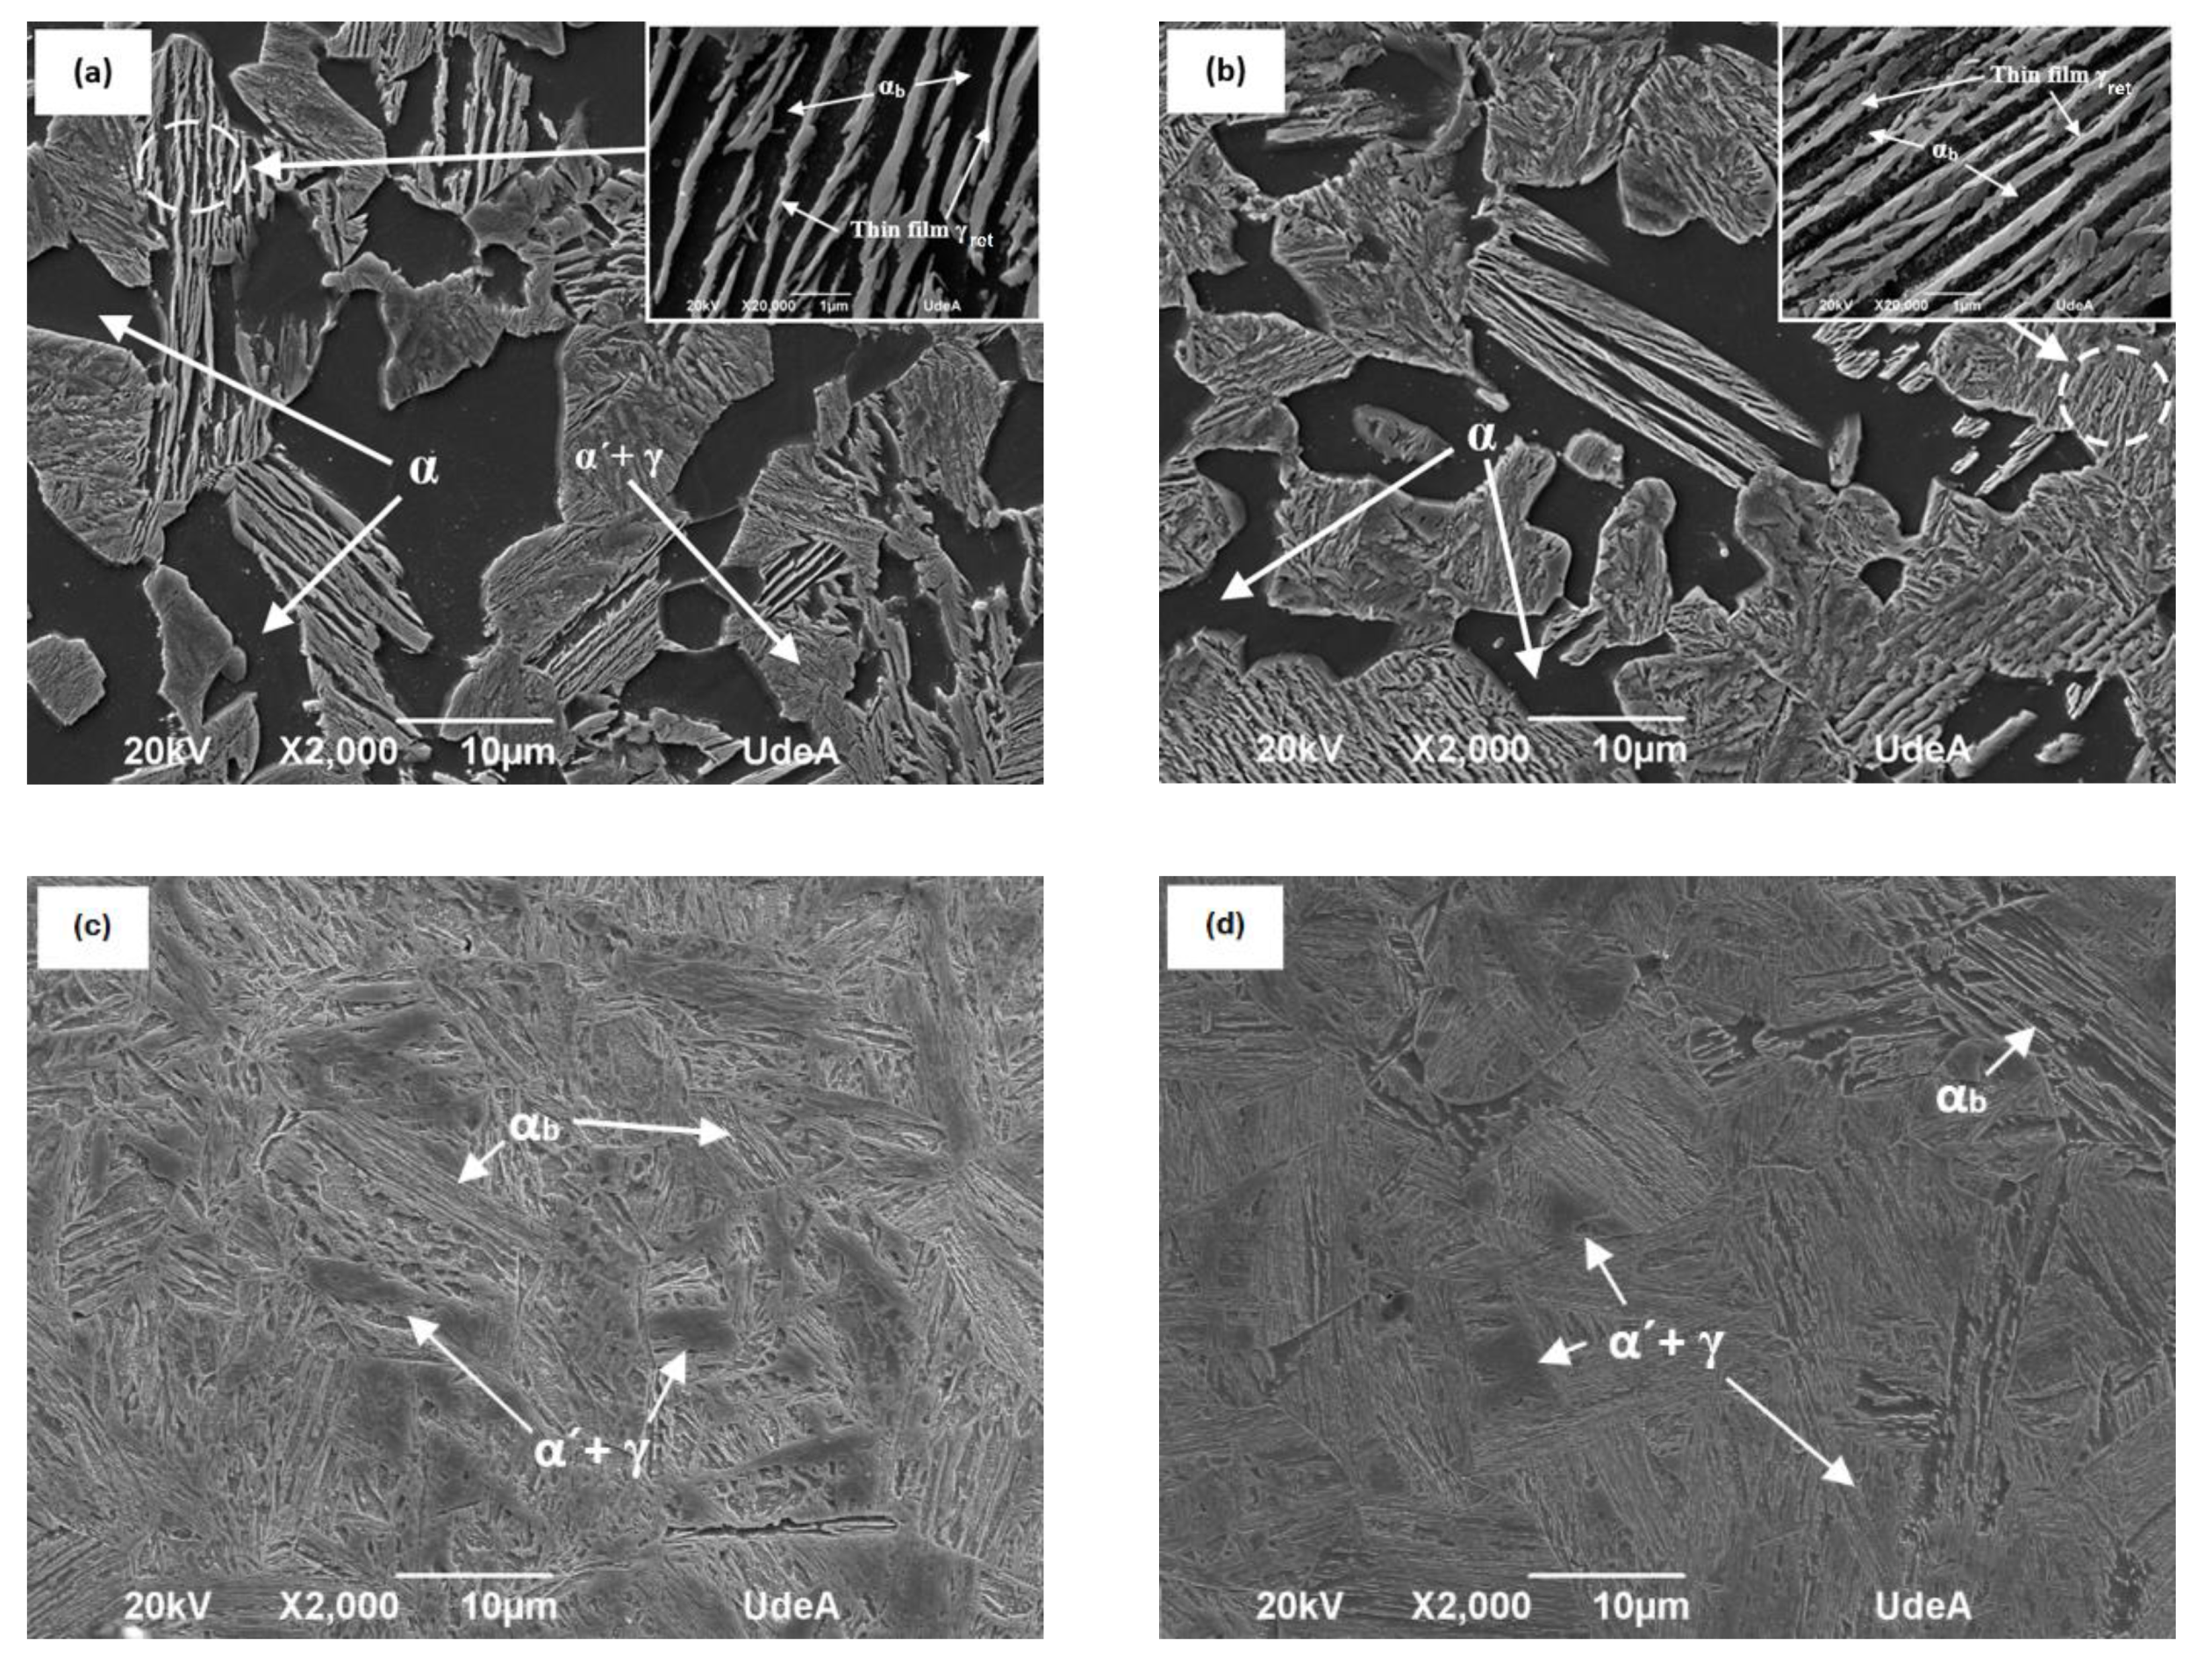
iso, that although austenitization at 830 °C instead at 900 °C will only produce small variations in the microstructural parameters and hardness value of the case steel, it will have a rather marked effect in the core of carbo-austempered samples at both isothermal quenching temperatures.
Table 5 shows that intercritical austenitization at 830 °C gives to the core the same or higher fraction of bainitic ferrite and thinner bainitic ferrite and austenite films, which improves strength when compared with samples austenitized at 900 °C, together with a high amount of unstransformed ferrite, which being more effective than martensite and bainitic ferrite to accommodate plastic strain will improve ductility and impact toughness of carburized steel, as shown in
Table 6.
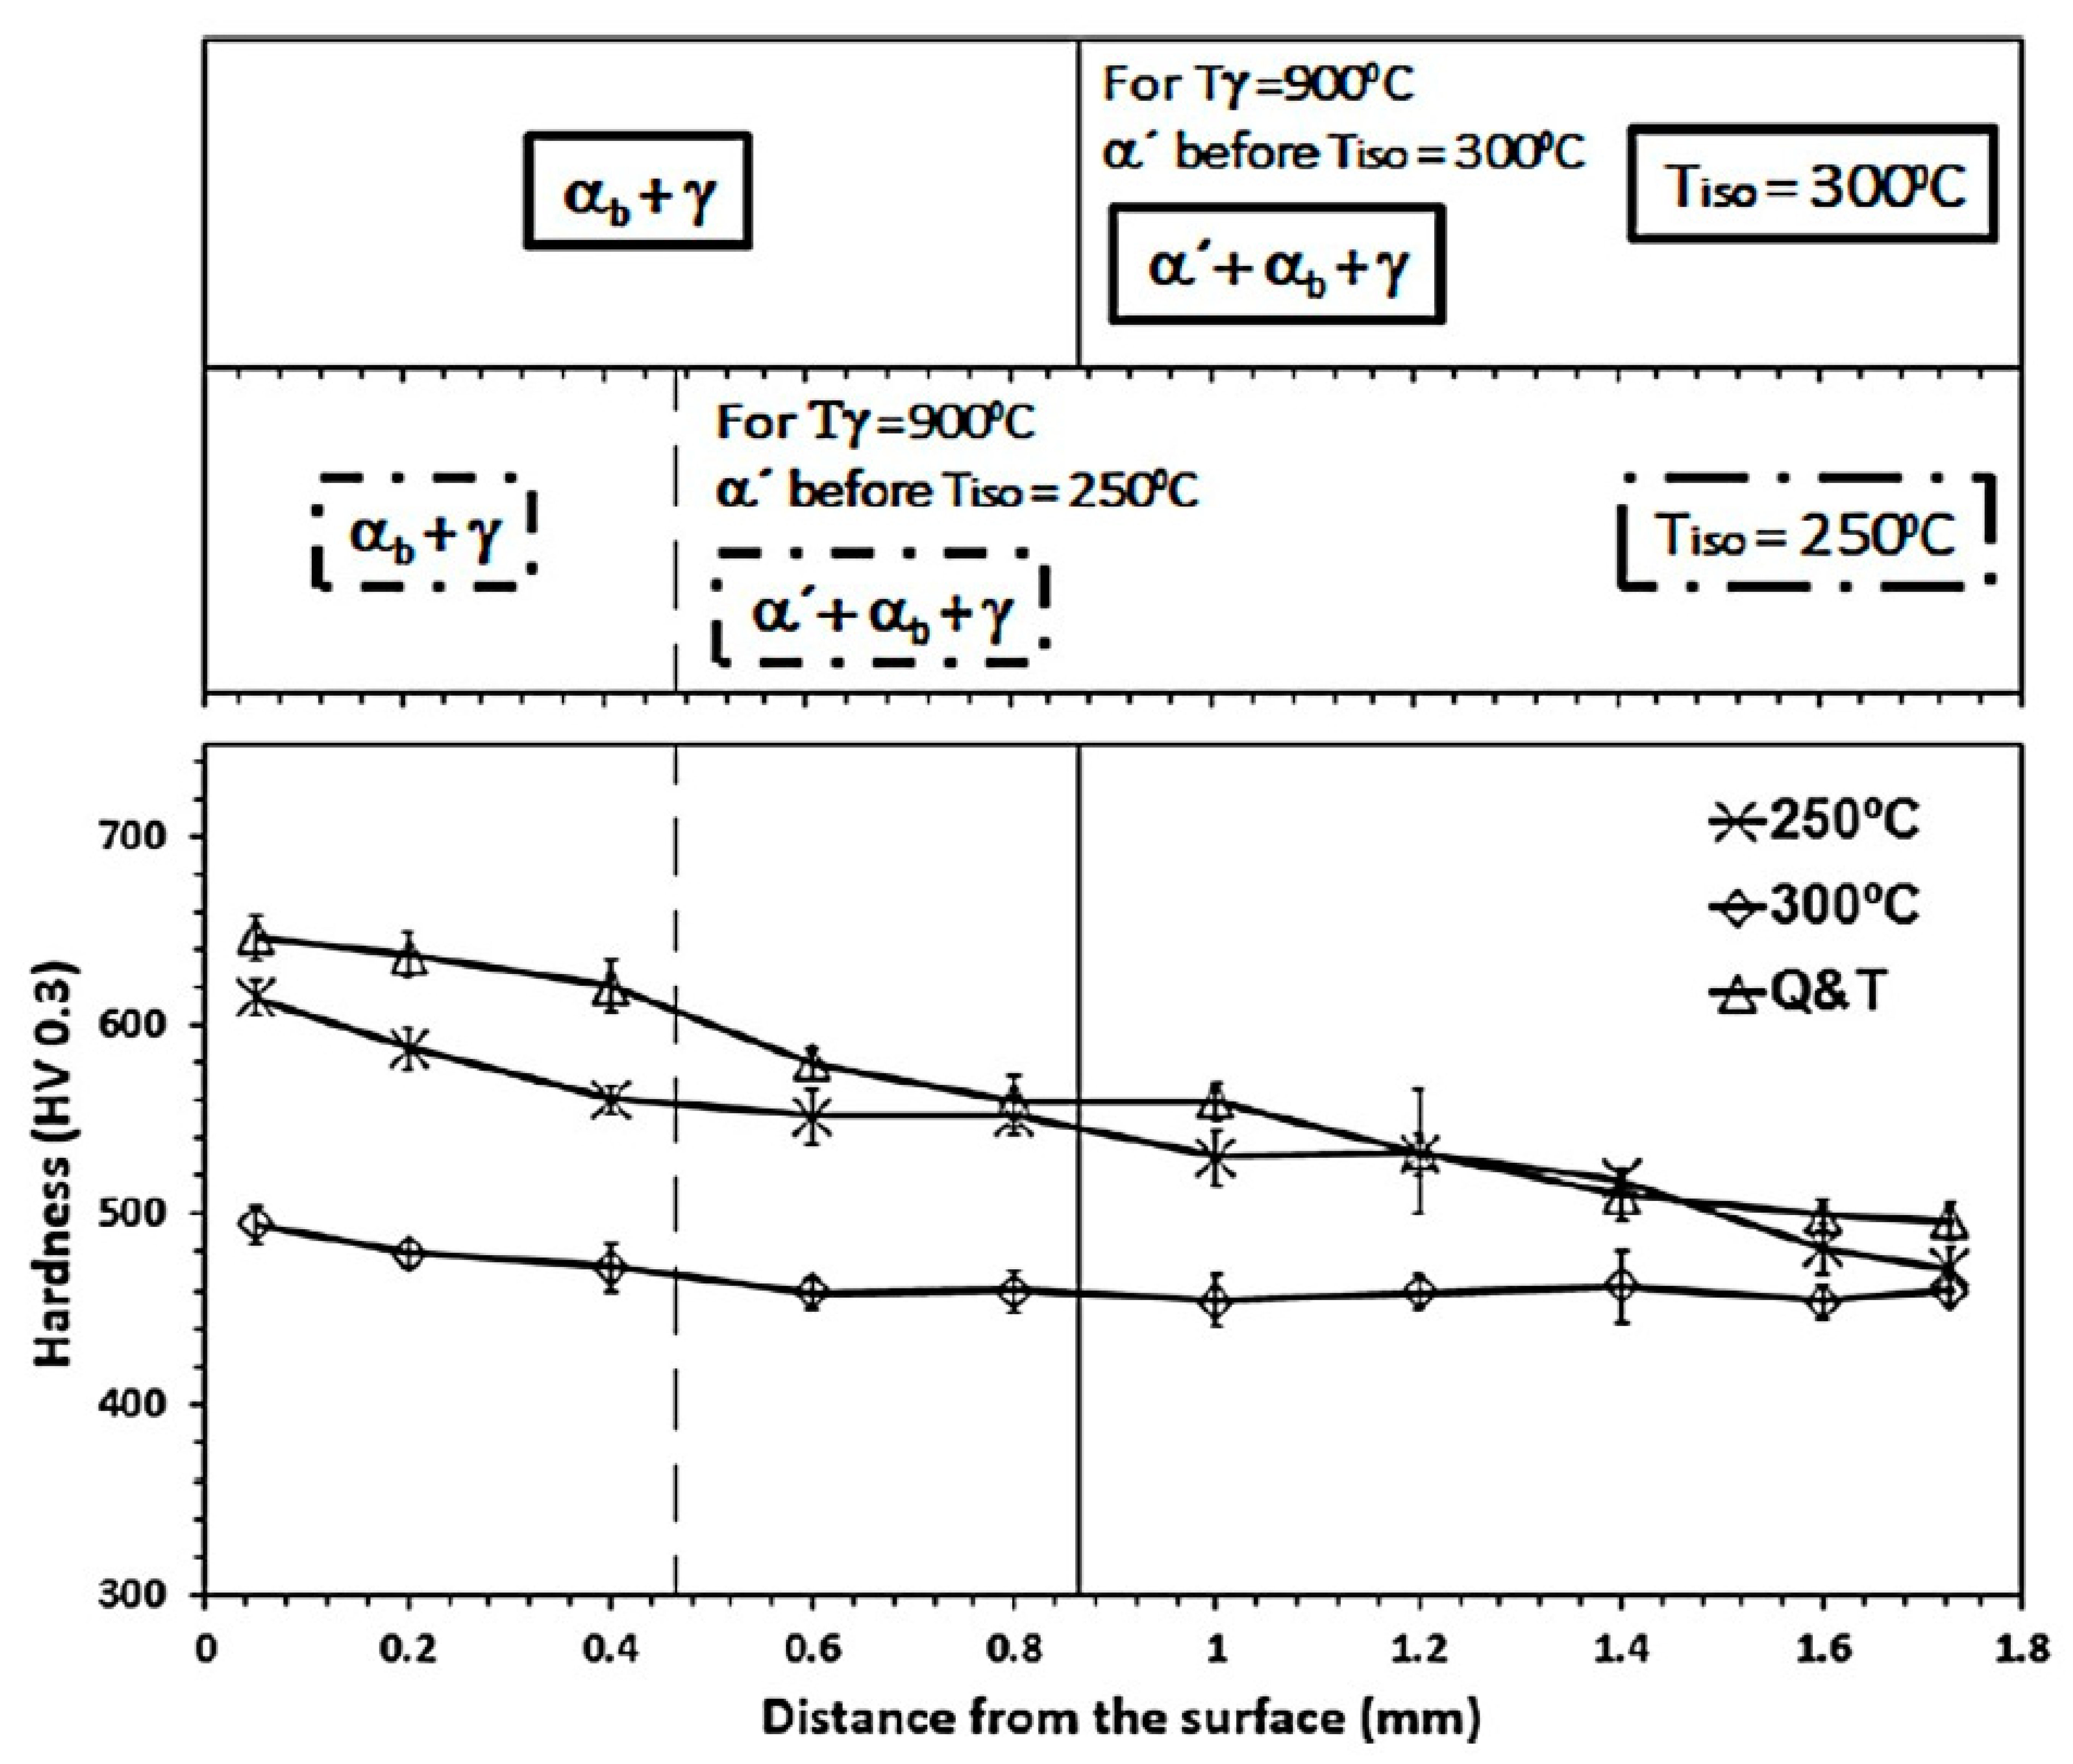
For the T
γ = 900 °C condition,
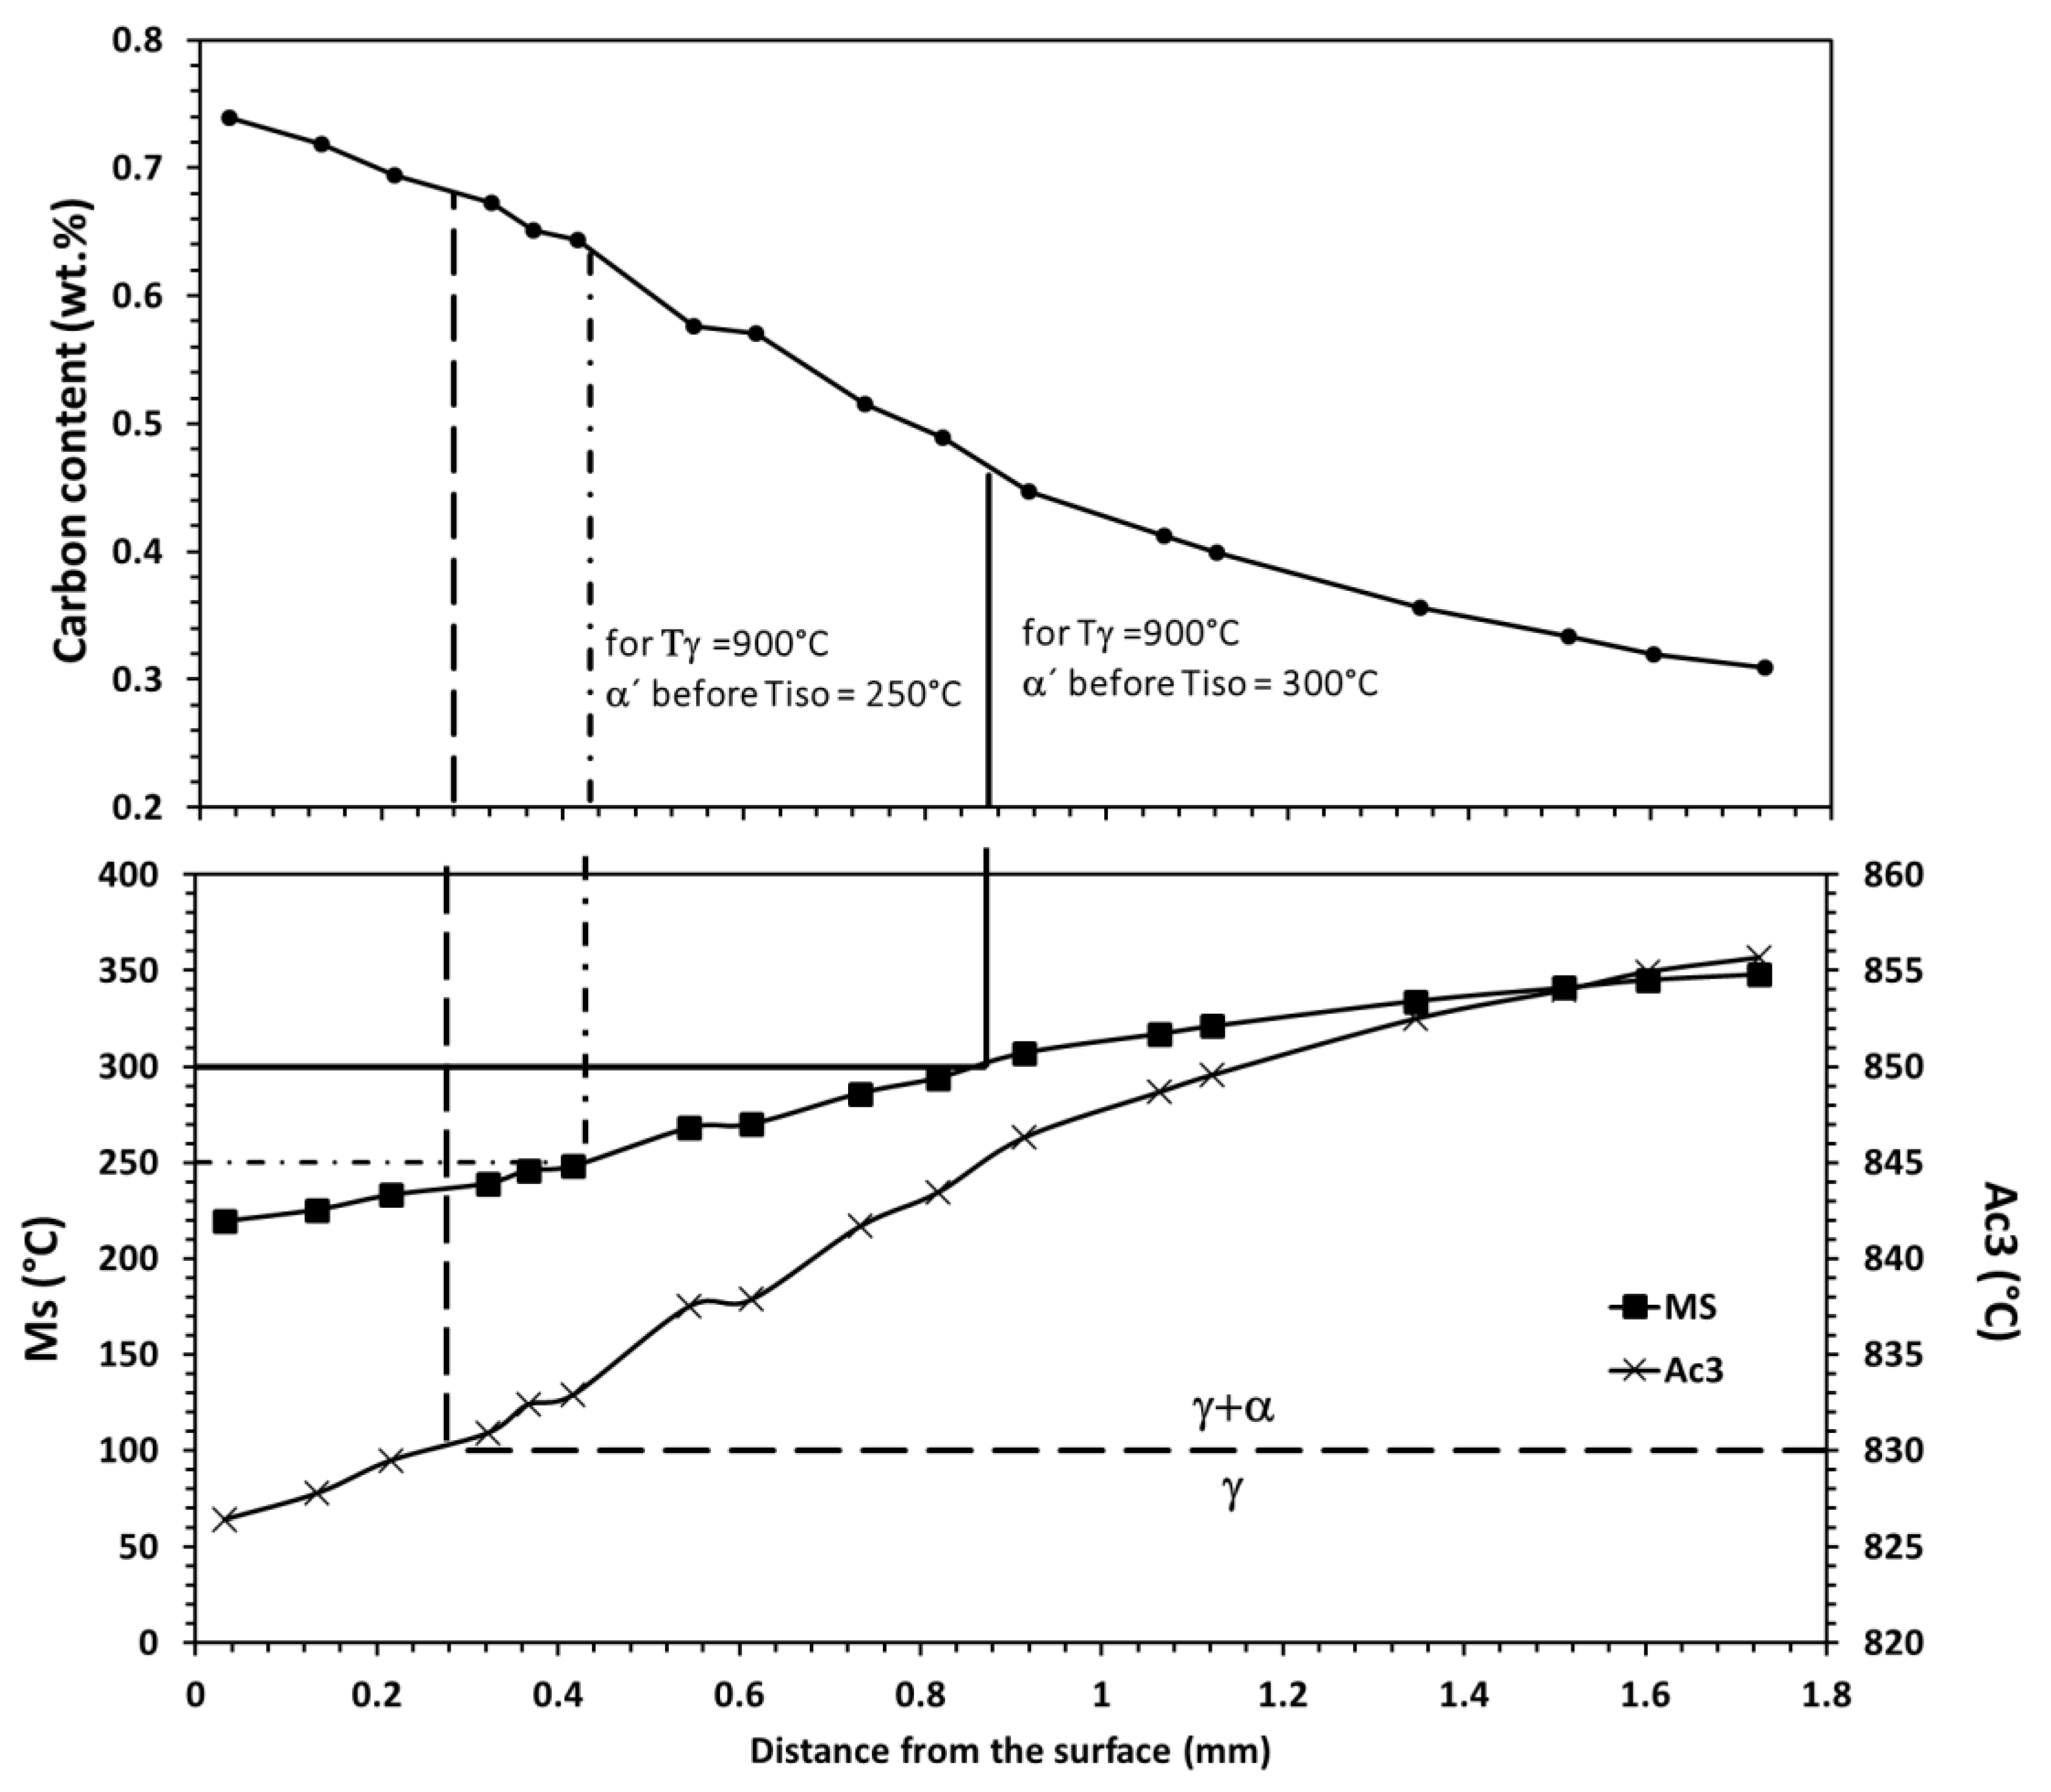
Figure 10, from the surface to the core, the material is fully austenitized previous to the isothermal treatment. Based on the calculation shown in
Figure 9 and
Figure 10 indicates with vertical lines the depth at which martensitic transformation is expected to occur depending on the isothermal T. Note that those calculation agrees with previous experimental observations in
Figure 4 and
Figure 5. It is evident that in the region where only α
b and γ
ret is expected in the microstructure, as the C content decreases, and more α
b forms, HV gently decreases for both T
iso, the reduction is associated with thicker α
b plates. Differences in the HV values between both transformations T are also justified in the same terms, i.e., more α
b and thinner at T
iso = 250 °C than at T
iso = 300 °C.
Once α’ appears in the microstructure, previous to the isothermal treatment, it has been already discussed that there is less bainitic transformation. Thus, as the core is approached, the microstructure is composed of tempered α’ + α
b + γ
ret with increasing quantities of tempered α’ in detriment of that of α
b and γ
ret. While the drop in HV for the 250 °C treatment is only 50 units, in the 300 °C case HV is almost negligible as less α’ is forming as compared to lower temperature treatment. Close to the core, the reported HV values are in line with those presented in
Table 5, which is an indicative that the selected heat treatments were successfully applied.
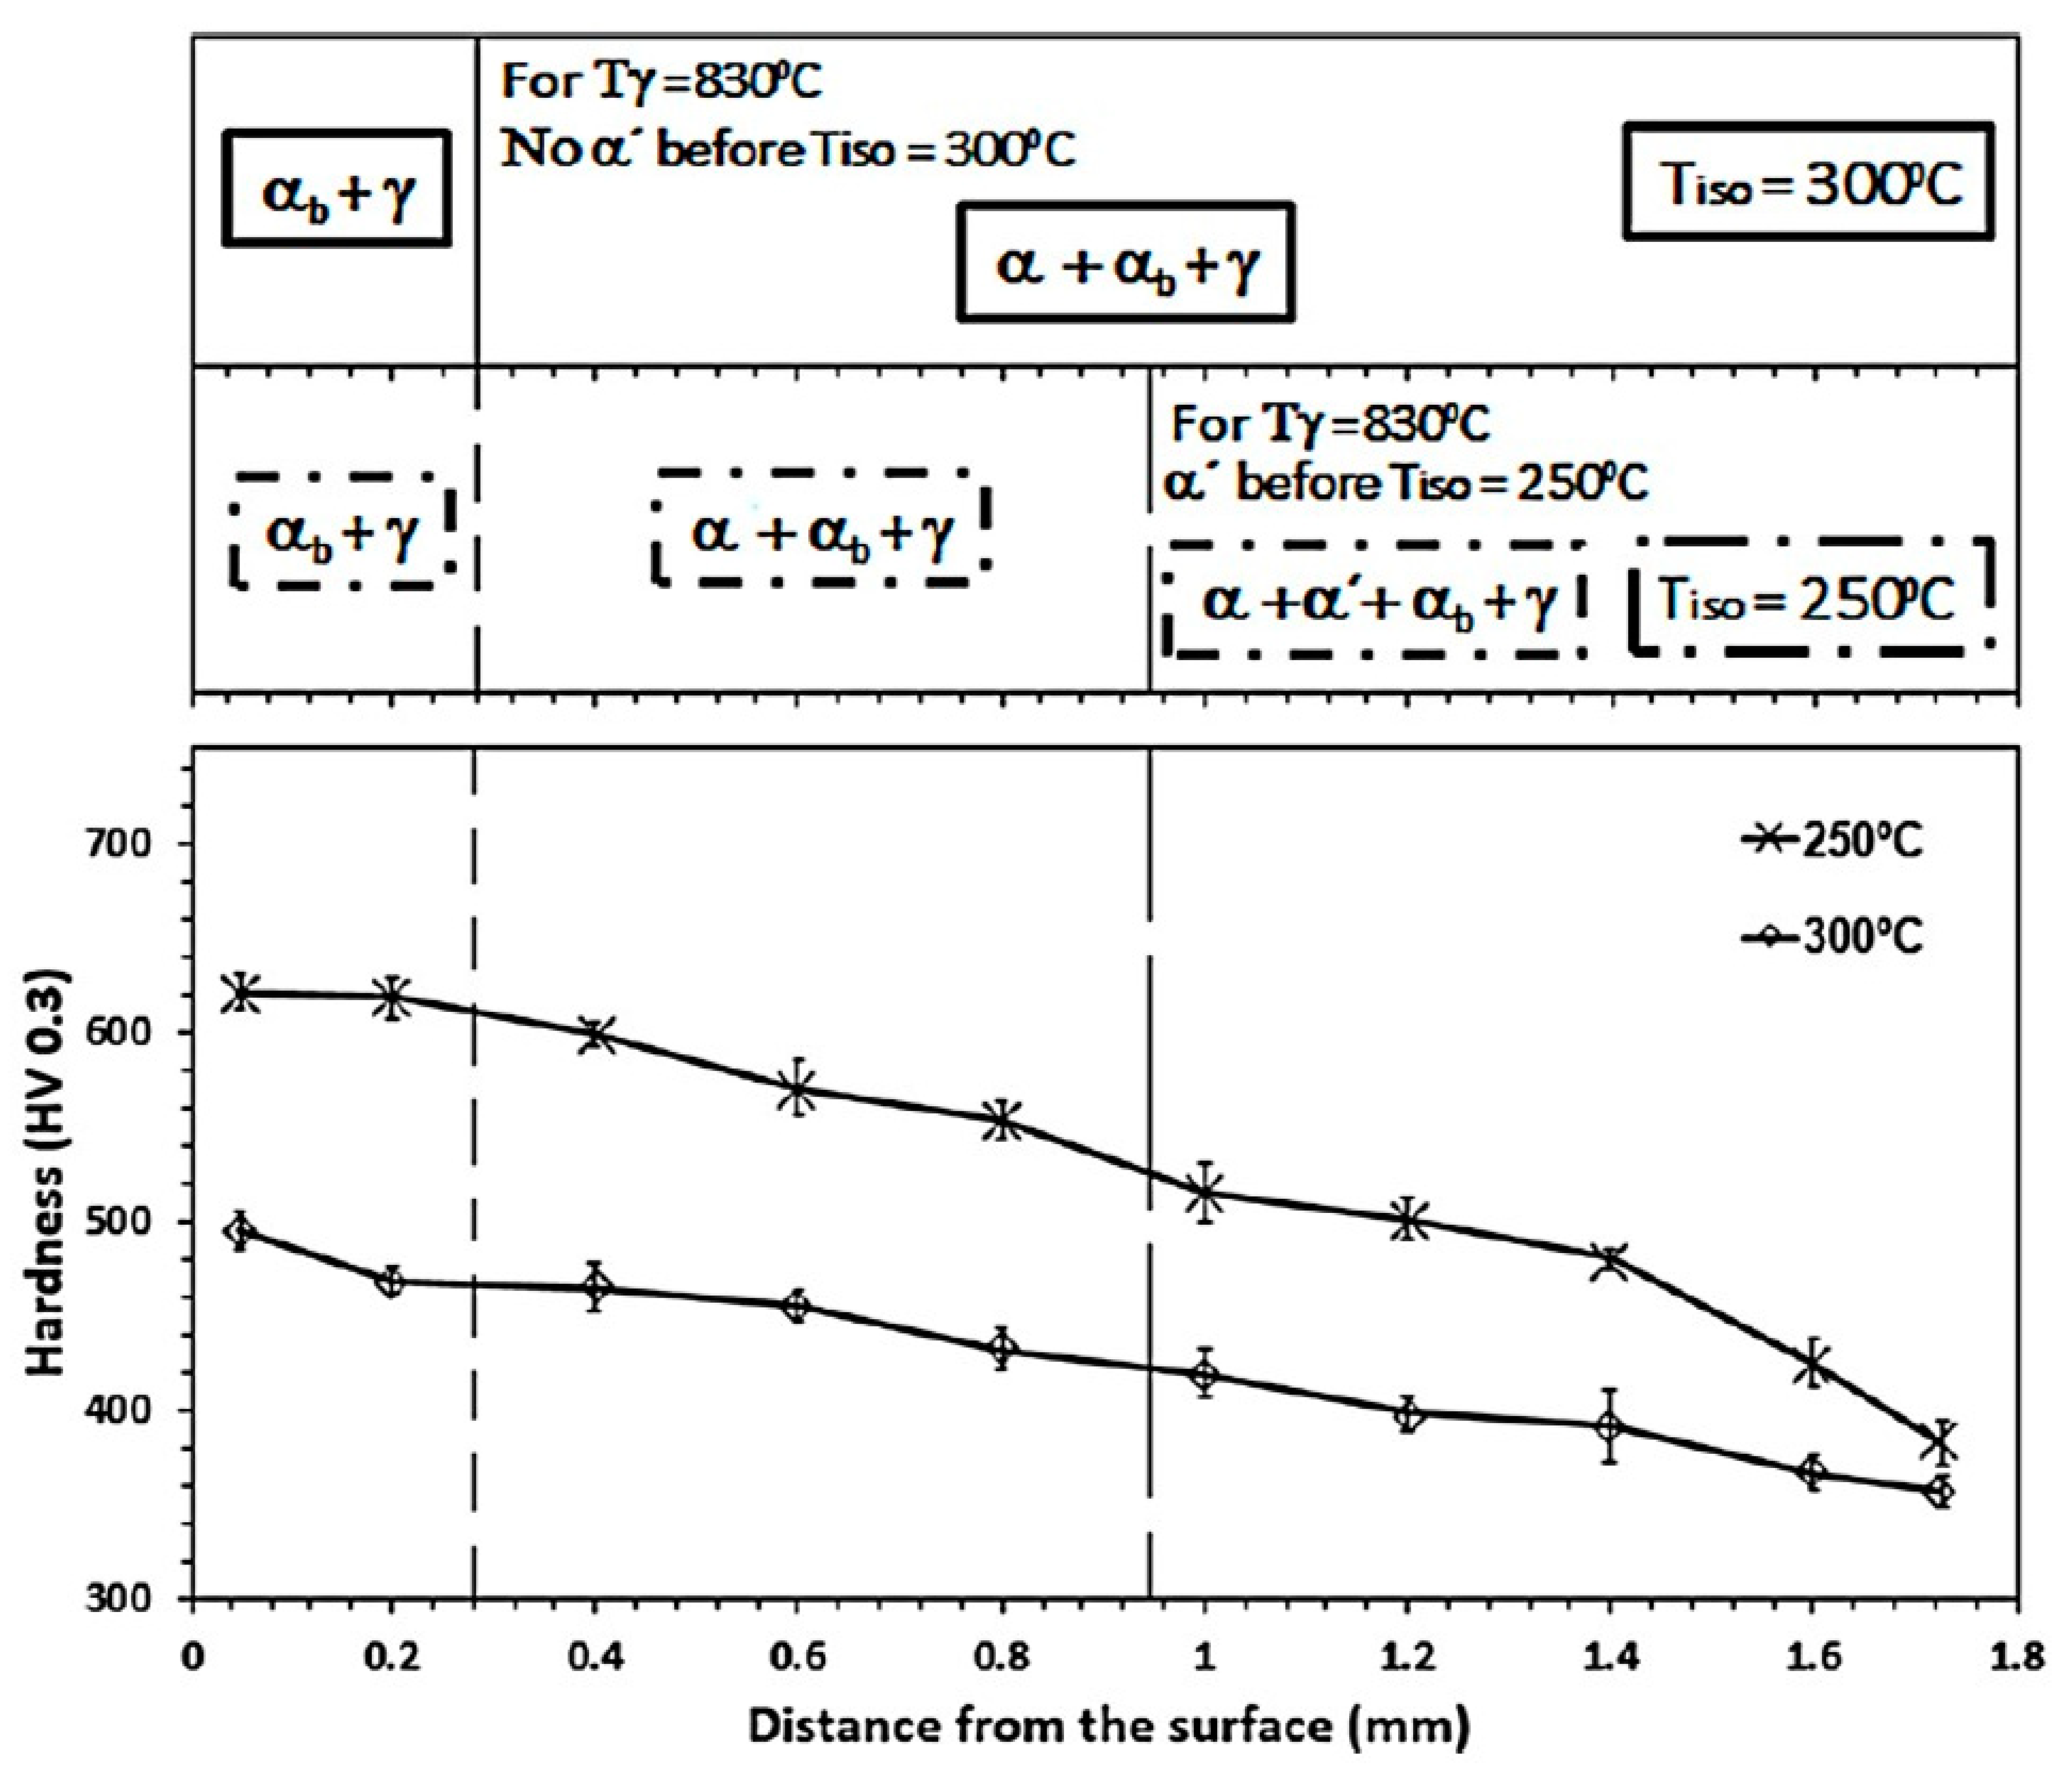
For the discussion of the HV profile with T
γ = 830 °C, the situation is a bit more complex, as we have to consider that, while there are regions of the material that are fully austenitized—see vertical lines in
Figure 9—there are other regions that are in the α + γ field, and the austenite is then C enriched (γ
+). Such enrichment, as it has been shown, implies that Ms temperatures are lower than those calculated for the T
γ = 900 °C. For the core steel, it was estimated that the C content of the of austenite (γ+) at T
γ = 830 °C was 0.43 wt.%, see
Table 3, and the calculated Ms temperature for that C level in
Figure 9 (~300 °C) is similar to that experimentally determined, see
Table 5. Using this same approach, if we consider now that, at a depth of 0.95 mm, a C content of 0.44 wt.% was measured, see
Figure 9; thus, when that part of the carburized steel is heated at T
γ=830 °C it is in the α + γ field, see
Figure 9, and it is estimated that the austenite contains about 0.64 wt.% C. In this same
Figure 9, the Ms temperature for a 0.64 wt.% C is ~250 °C, meaning that if T
iso is 300 °C, martensite should not be expected in the whole depth, while if Tiso is decreases to 250 °C, martensite will appear from a depth of 0.95 mm to the core. By using this same type of calculations and attending to the results in
Figure 9, it is possible to prepare
Figure 10 and
Figure 11 to gather all these results in a schematic way.
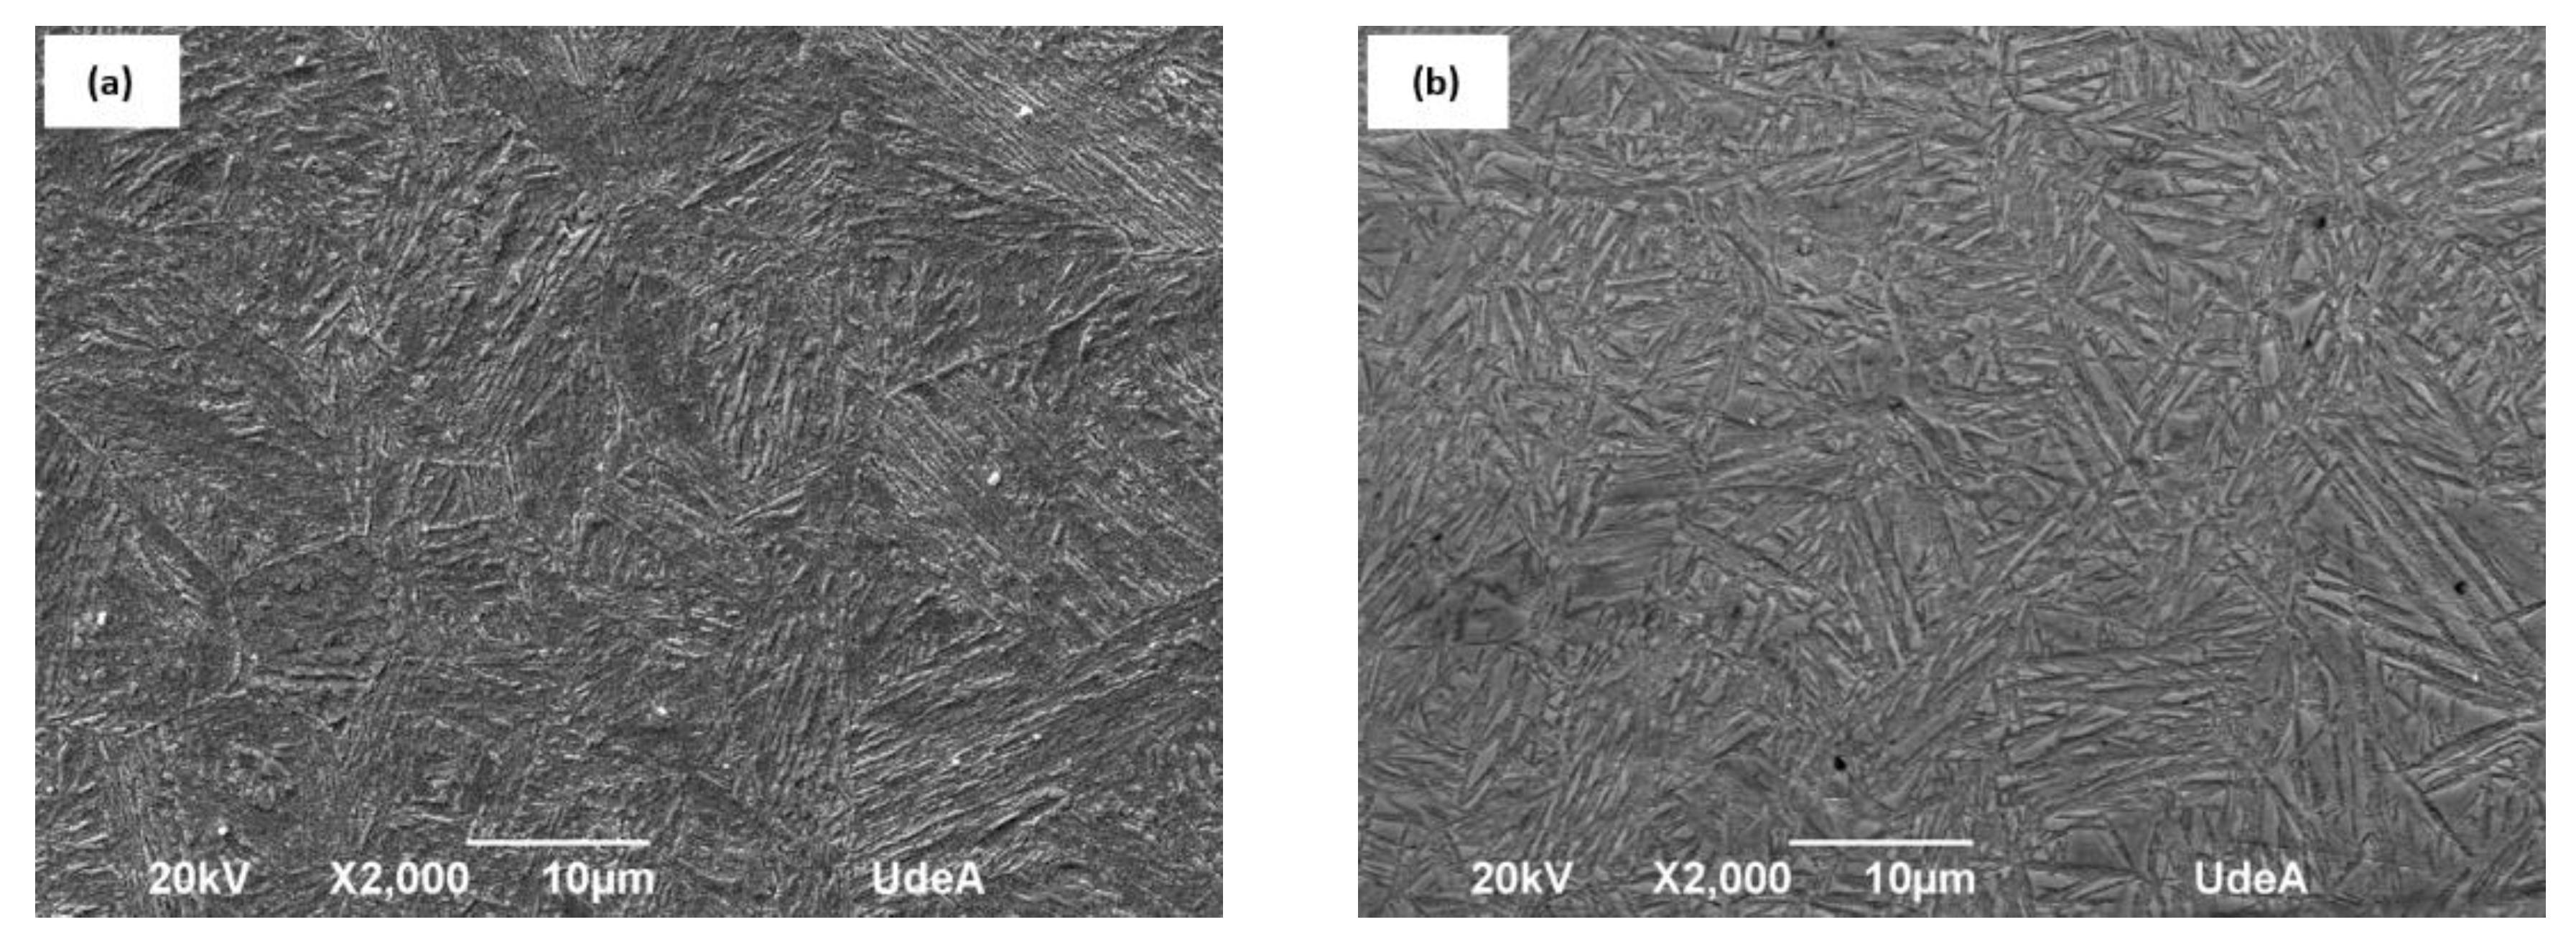
As in the case of full austenitization, when only α
b + γ
ret is expected in the microstructure, as the C content decreases, and more α
b forms, HV gently decreases for both T
iso, the reduction is associated with thicker α
b plates, and the small differences found with the case of T
γ = 900 °C, again indicates the little effect that PAGS might have for those chemical compositions on the resulting α
b. The presence of proeutectoid ferrite into mixed microstructures of α + α
b + γ
ret, leads to a gentle decrease of the HV, as more α in detriment of α
b is present in the microstructure—see, for example, the case of the T
iso = 300 °C. The formation of α’, T
iso = 250 °C, reduced the amount of α
b, and it results in a more step decrease in HV values. As before, close to the core, the reported HV values are in line with those presented in
Table 5.

 ,
, 


