Article

Hot Deformation Behavior and Processing Map of High-Strength Nickel Brass

1
Engineering Research Center for Waste Oil Recovery Technology and Equipment of Ministry of Education, Chongqing Technology and Business University, Chongqing 400067, China
2
College of Mechanical Engineering, Chongqing Technology and Business University, Chongqing 400067, China
3
College of Material Science and Engineering, Chongqing University, Chongqing 400044, China
*
Author to whom correspondence should be addressed.
Metals 2020, 10(6), 782; https://doi.org/10.3390/met10060782
Submission received: 10 May 2020 / Revised: 7 June 2020 / Accepted: 10 June 2020 / Published: 12 June 2020
(This article belongs to the Special Issue High-Temperature Behavior of Metals)

Abstract

:
The flow behavior of a new kind of high-strength nickel brass used as automobile synchronizer rings was investigated by hot compression tests with a Gleeble-3500 isothermal simulator at strain rates ranging from 0.01 to 10 s−1 and a wide deformation temperature range of 873–1073K at intervals of 50 K. The experimental results show that flow stress increases with increasing strain rate and decreasing deformation temperature, and discontinuous yielding appeared in the flow stress curves at higher strain rates. A modified Arrhenius constitutive model considering the compensation of strain was established to describe the flow behavior of this alloy. A processing map was also constructed with strain of 0.3, 0.6, and 0.9 based on the obtained experimental flow stress–strain data. In addition, the optical microstructure evolution and its connection with the processing map of compressed specimens are discussed. The predominant deformation mechanism of Cu-Ni-Al brass is dynamic recovery when the deformation temperature is lower than 973 K and dynamic recrystallization when the deformation temperature is higher than 973 K according to optical observation. The processing map provides the optimal hot working temperature and strain rate, which is beneficial in choosing technical parameters for this high-strength alloy.

1. Introduction

Hot deformation is a complex plastic deformation processing method and can be affected by many factors, such as strain rate, deformation and microstructure. In the automobile industry, especially in the manufacturing of components, high wear resistance is essential. High-strength brass is often chosen as a component material because of its good strength, toughness, and corrosion resistance and remarkable wear resistance. High-strength brass contains an α + β or β phase which may contain some conditional elements, such as nickel, aluminum, iron, and silicon. These additions enhance the strength property due to solute strengthening, precipitation strengthening, and grain refinement [1,2]. In the case of nickel brass, used to fabricate synchronizer ring gears, it has a narrow deformation temperature range in which it deforms and a fragile temperature interval, which may lead to defects in the final component after deformation. Thus, a comprehensive study on hot compression behavior and workability is required to successfully obtain qualified products without any deformation defects.
A constitutive equation has been widely employed to describe the flow behavior of all kinds of metals, and has also been applied to the finite element method for simulating deformation processes. As a result, an accurate constitutive model is important for feasible numerical simulation. Many researchers have established constitutive models for high-strength brass [3,4,5,6], but there have been few reports on nickel brass. The Arrhenius model and modified Arrhenius model [7,8] have been extensively adopted in metals and alloys for their excellent accuracy. Therefore, the modified Arrhenius model considering the compensation of strain is employed to establish the constitutive model of Cu-Ni-Al brass. Though the constitutive model can describe flow behavior and perform finite element simulation during hot deformation, it lacks microstructure features to show its workability, which means that nickel brass lacks sufficient workability information when subjected to hot deformation processes. At present, the hot processing map is widely used to measure workability and has become a useful method for optimizing the hot deformation parameters for metals to obtain the safe and advisable regions for hot deformation processes. As yet, the processing map has been widely employed for various metals, such as magnesium alloys [9,10,11,12,13,14], aluminum alloys [15,16], titanium alloys [17,18,19,20,21], superalloys [22,23,24], steel [25,26,27,28], high entropy alloys [29,30], and copper alloys [31]. However, little research has reported on the hot deformation behavior and processing map of the Cu-Ni-Al brass alloy which is used to fabricate synchronizer rings. In addition, coarsening of the dynamic recrystallization grains and inhomogeneous microstructure are universal problems in the Cu-Ni-Al nickel brass alloy after the hot deformation process, but most practical production only focuses on the final shape of the products rather than its forming mechanism.
As a result, this new nickel brass material is essential and there is very little research concentrating on it. Therefore, in this study, hot flow behavior at the strain rates of 0.01, 0.1, 1, and 10 s−1 and deformation temperature ranging from 873 to 1073 K at intervals of 50 K were investigated by a Gleeble-3500 simulator, and microstructure features were also observed. The constitutive model and processing map of Cu-Ni-Al nickel brass were constructed based on the experimental data to help describe flow behavior and choose suitable hot deformation parameters. Furthermore, the combination of the constitutive model, processing map, and microstructure evolution was applied to establish guidelines for optimizing parameters and techniques during hot deformation processes.

2. Materials and Methods

The material used in the tests was an extruded nickel brass alloy cylinder, offered by Luzhou Long River Mechanical Company Ltd., Luzhou, China. The chemical composition and microstructure of the material are shown in Table 1 and Figure 1, respectively. The crystal structure of this brass is body-centered cubic (bcc), and the phase is a β-phase matrix with granular hard-strengthening particles. The specimens were prepared as cylinders with a radius of 8mm and a height of 12 mm for hot compression tests. The tests were carried out on an isothermal simulator (Gleeble-3500, Dynamic Systems Inc., New York, NY, USA) with strain rates of 0.01, 0.1, 1, and 10 s−1 and deformation temperatures ranging from 873 to 1073 K at intervals of 50 K. The prepared specimens were heated to experimental temperatures at a heating rate of 5 K·s−1 and held for 3 min to ensure uniform temperature distribution. Then hot compression tests were conducted with a 60% reduction in height, meaning that the total true strain of each specimen was 0.9. A graphite lubricant was used to reduce friction between the interface of specimen ends and the experimental apparatus during the compression process. Finally, the true stress and true strain curves were obtained automatically by a computer-equipped monitor. After the tests, the specimens were quenched in room-temperature water to keep their hot forming microstructure.
The compressed specimens were cut along the compression axis by a wire electrical discharge machine (BMG-640X, Treasure Marge Precision Machinery Ltd., Suzhou, China) for subsequent microstructure observations. The sections were grinded, polished, and etched in a corrosive solution of 15 mL HNO3 + 21 mL CH3COOH + 14 mL distilled water for 10 s. The optical microstructure of the center sections was examined by an optical metallographic microscope (Leica DM ILM, Leica Microsystems Inc., Wetzlar, Germany).

3. Results and Discussion

3.1. True Stress and True Strain Curves

The true stress–true strain curves of Cu-Ni-Al nickel brass obtained from compression tests are presented in Figure 2. It can be seen that the deformation temperature and strain rate have important effects on true flow stress under all deformation conditions. The curves clearly show that true stress increases when the deformation temperature is decreased from 1073 to 873 K or the strain rate is increased from 0.01 to 10 s−1, which also indicates that Cu-Ni-Al nickel brass is a deformation temperature- and strain rate-sensitive material. This is because these processes reduce the movements of dislocation: the migration of grain boundaries is limited by lower deformation temperatures and there is not enough time for dynamic softening (dynamic recovery and dynamic recrystallization) at higher strain rates. On one hand, the obstructions of dislocation motion and crystal slip become easy due to the increased average kinetic energy of atoms at relatively high deformation temperatures [32]. On the other hand, higher temperatures promote the mobility at grain boundaries, which results in dislocation attenuation and the nucleation and growth of dynamically recrystallized grains [33]. In Figure 2, the curves with lower strain rate (≤1 s−1) undergo high stress, then increase slowly or keep relatively steady along with increasing strain, which means that work hardening dominates compared with the dynamic softening mechanism, especially at lower deformation temperatures. At the same strain rate, true stress decreases with increasing deformation temperature because the atomic kinetic energy and atomic vibration amplitude of material increase at high deformation temperatures, which improves the coordination of grains and eventually leads to increasing plasticity and decreasing strength. At the same deformation temperature, true stress increases with increasing strain rate because there is not enough time for softening and work hardening is the main deformation mechanism. When the strain rate is 10 s−1, as shown in Figure 2d, the true stress curves rapidly reach a peak with a value that is initially like that of the other curves, suddenly decreases visibly, then increases, and eventually stays steady, which means that work hardening and softening are dynamically balanced. This phenomenon at the small strain stage indicates discontinuous dynamic recrystallization under the conditions of a high strain rate. The value of true stress ranges from 0 to 90 MPa which indicates that this material is very soft at temperatures of 873 to 1073 K.

3.2. Arrhenius Model

To better understand the relationship between true stress and some deformation parameters during hot compression tests, such as strain rate, temperature, strain, etc., the Zener–Hollomon model (Arrhenius model) [34] was adopted. The model is usually presented as the following equations:
ε ˙ = A F ( σ ) exp ( Q / R T )
F ( σ ) = A 1 σ n 1   for   α σ < 0.8
F ( σ ) = A 2 exp ( β σ )   for   α σ > 1.2
F ( σ ) = A [ sinh ( α σ ) ] n   for all   α σ
Among the above equations, ε is strain rate (s−1) and σ is characteristic flow stress (MPa), where peak stress is used to build a model. T is absolute temperature (K). Q is deformation activation energy (KJ·mol−1). R is the gas constant (8.314 J·mol−1·K−1). A, A1, A2, n, n1, α and β are material constants that have no relationship with temperature, where α = β/n1. Substituting the above Equations (2)–(4) into Equations (5)–(7) and taking the natural logarithm results in:
ln ε ˙ = ln A 1 + n 1 ln σ ( Q R T )
ln ε ˙ = ln A 2 + β σ ( Q R T )
ln ε ˙ = ln A + n ln ( sinh ( α σ ) ) ( Q R T )
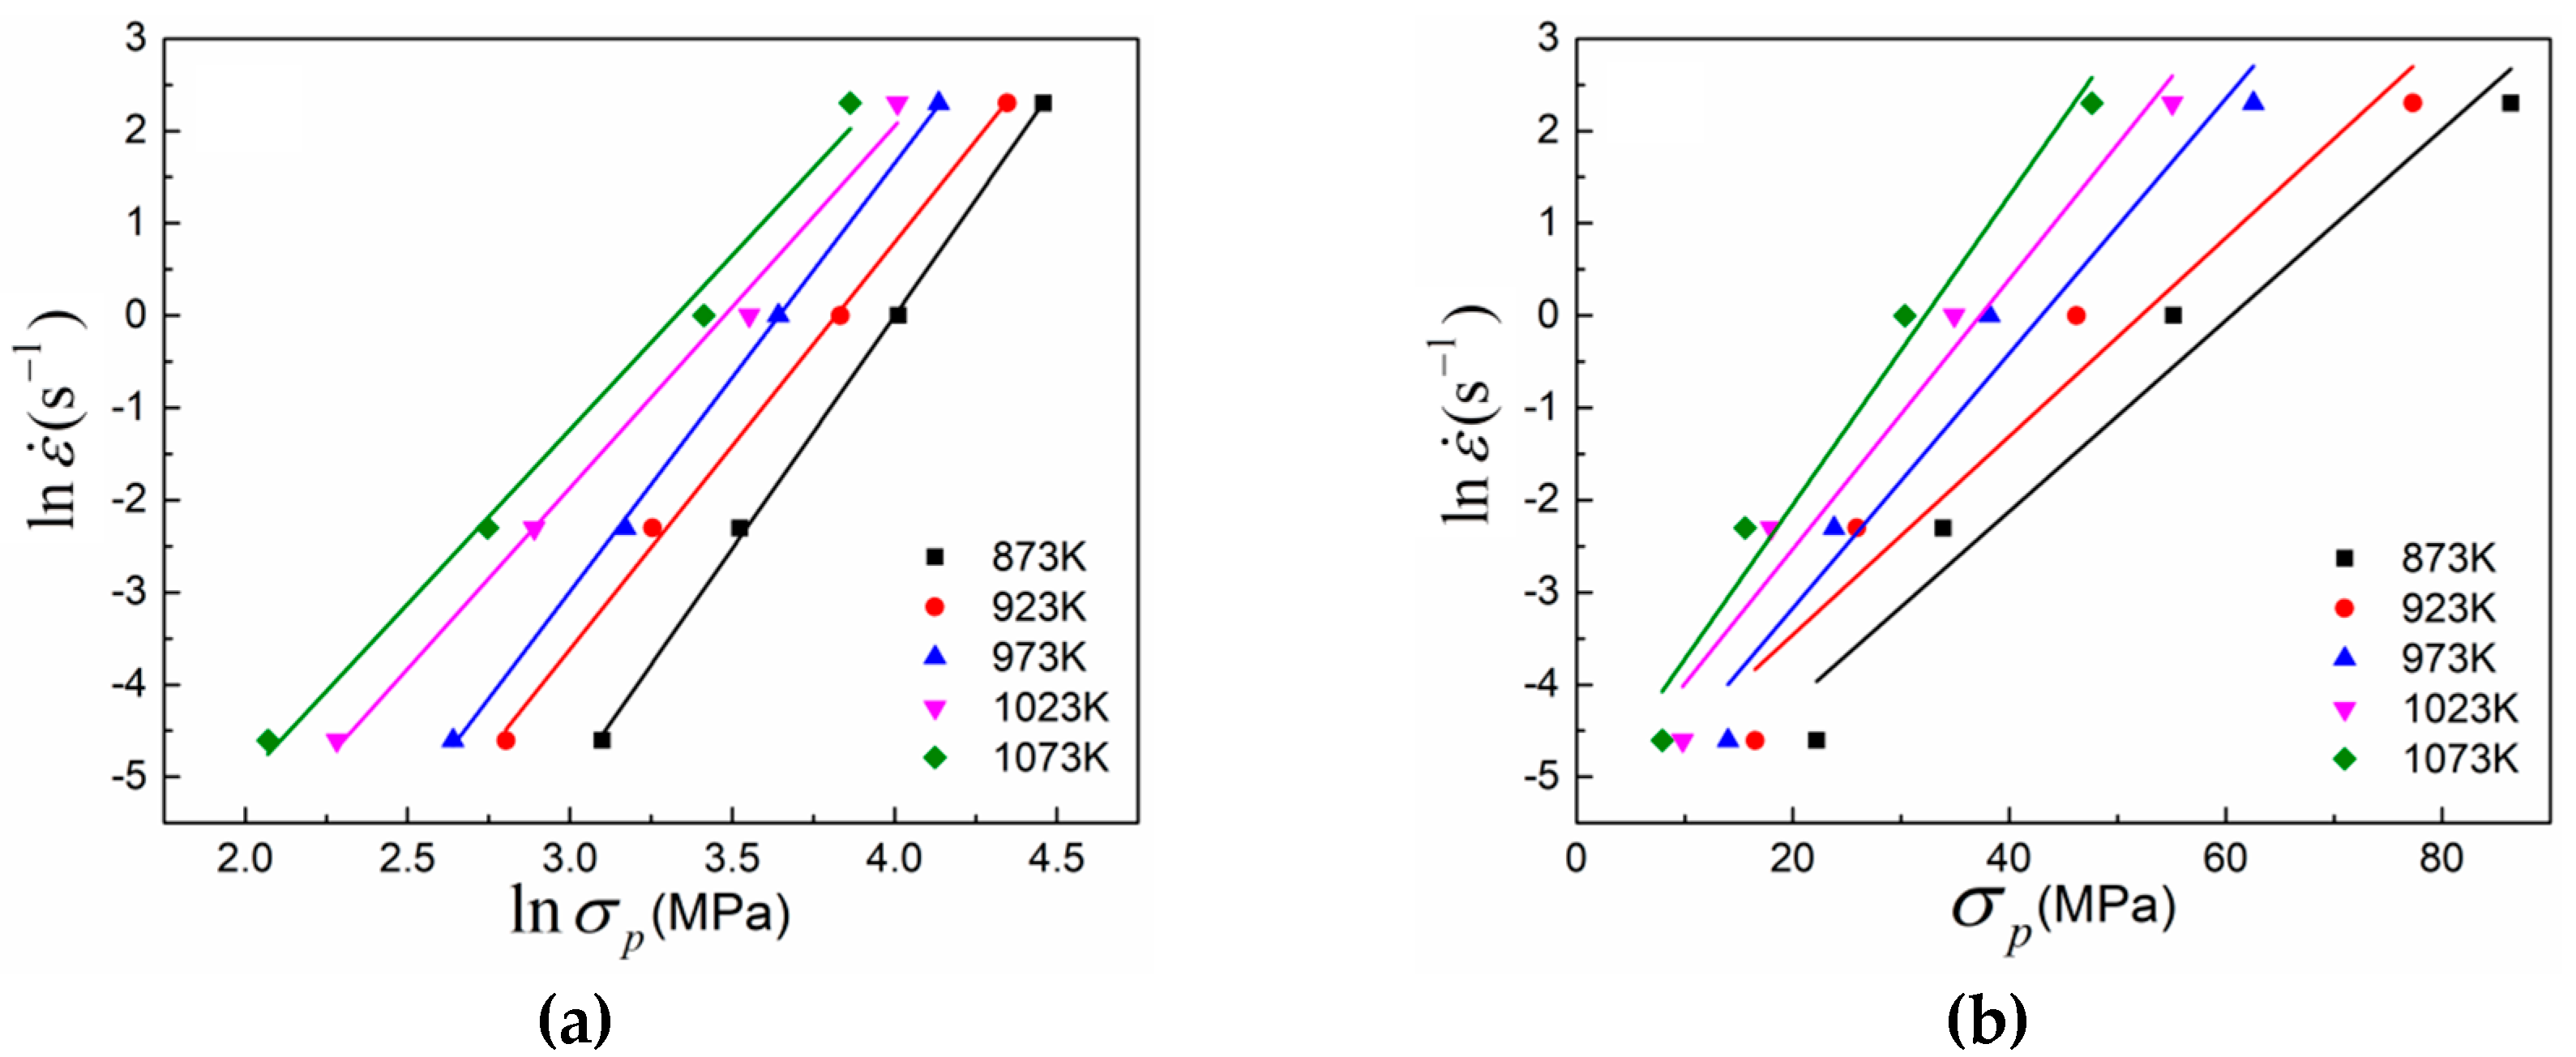
According to Equations (5) and (6), the values of n 1 and β can be determined to be 4.35852 and 0.13252 by calculating the average slopes of the linear fitted lines of the ln ε ˙ ln σ p and ln ε ˙ σ p curves plotted on Figure 3a,b. The value of α can be calculated to be 0.030405 MPa−1 from the determined n 1 and β.
Equations (8)–(9) can be transformed according to Equation (7), and ln ε ˙ ln ( sinh ( α σ p ) ) has a linear relationship with ln ε ˙ and 1000/T in each equation, respectively. Therefore, the deformation activation energy Q is determined by the linear fitting lines of the ln ε ˙ ln ( sinh ( α σ p ) ) and ln ( sinh ( α σ p ) ) −1000T−1 curves, as shown in Figure 3c,d. The constants n and S are the slopes of these two curves, and the average values of n and S are 3.16684 and 4.846375, respectively. Q is determined by the ln ε ˙ ln ( sinh ( α σ p ) ) and ln ( sinh ( α σ p ) ) −1000T−1 curves, and its calculated value is 127.6 KJ·mol−1. Additionally, much research has shown that high activation energy is generally attributed to dynamic recovery (DRV) and dynamic recrystallization (DRX). Thus, the dominant mechanism here is dynamic recrystallization (DRX) due to the low activation energy Q. lnA-Q/RT is the intercept of the ln ε ˙ ln ( sinh ( α σ p ) ) curve, as shown in Figure 3c, which can be calculated from the fitting curve of ln ε ˙ ln ( sinh ( α σ p ) ) : its average value is 1,616,711.73.
n = ln ε ˙ ln [ sinh ( α σ ) ] | T
Q = R n ln [ sinh ( α σ ) ] ( 1 / T ) | ε ˙ = R n S
As a result, the constitutive model based on peak value at all experimental deformation conditions was constructed below; the equation was given as:
ε ˙ = 1616711 . 73 sinh ( 0.030405 σ p ) 3.16684 exp ( 127600.73 / R T )
The Arrhenius model based on peak stress is not exhaustive for describing the hot deformation behavior of Cu-Ni-Al nickel brass under other levels of strain; therefore, Lin [35,36] modified the Arrhenius model and adopted strain as a parameter of Arrhenius model. Zener and Hollomon [34] proposed a relationship between deformation temperature and strain rate, expressed as:
Z = ε ˙ exp ( Q / R T )
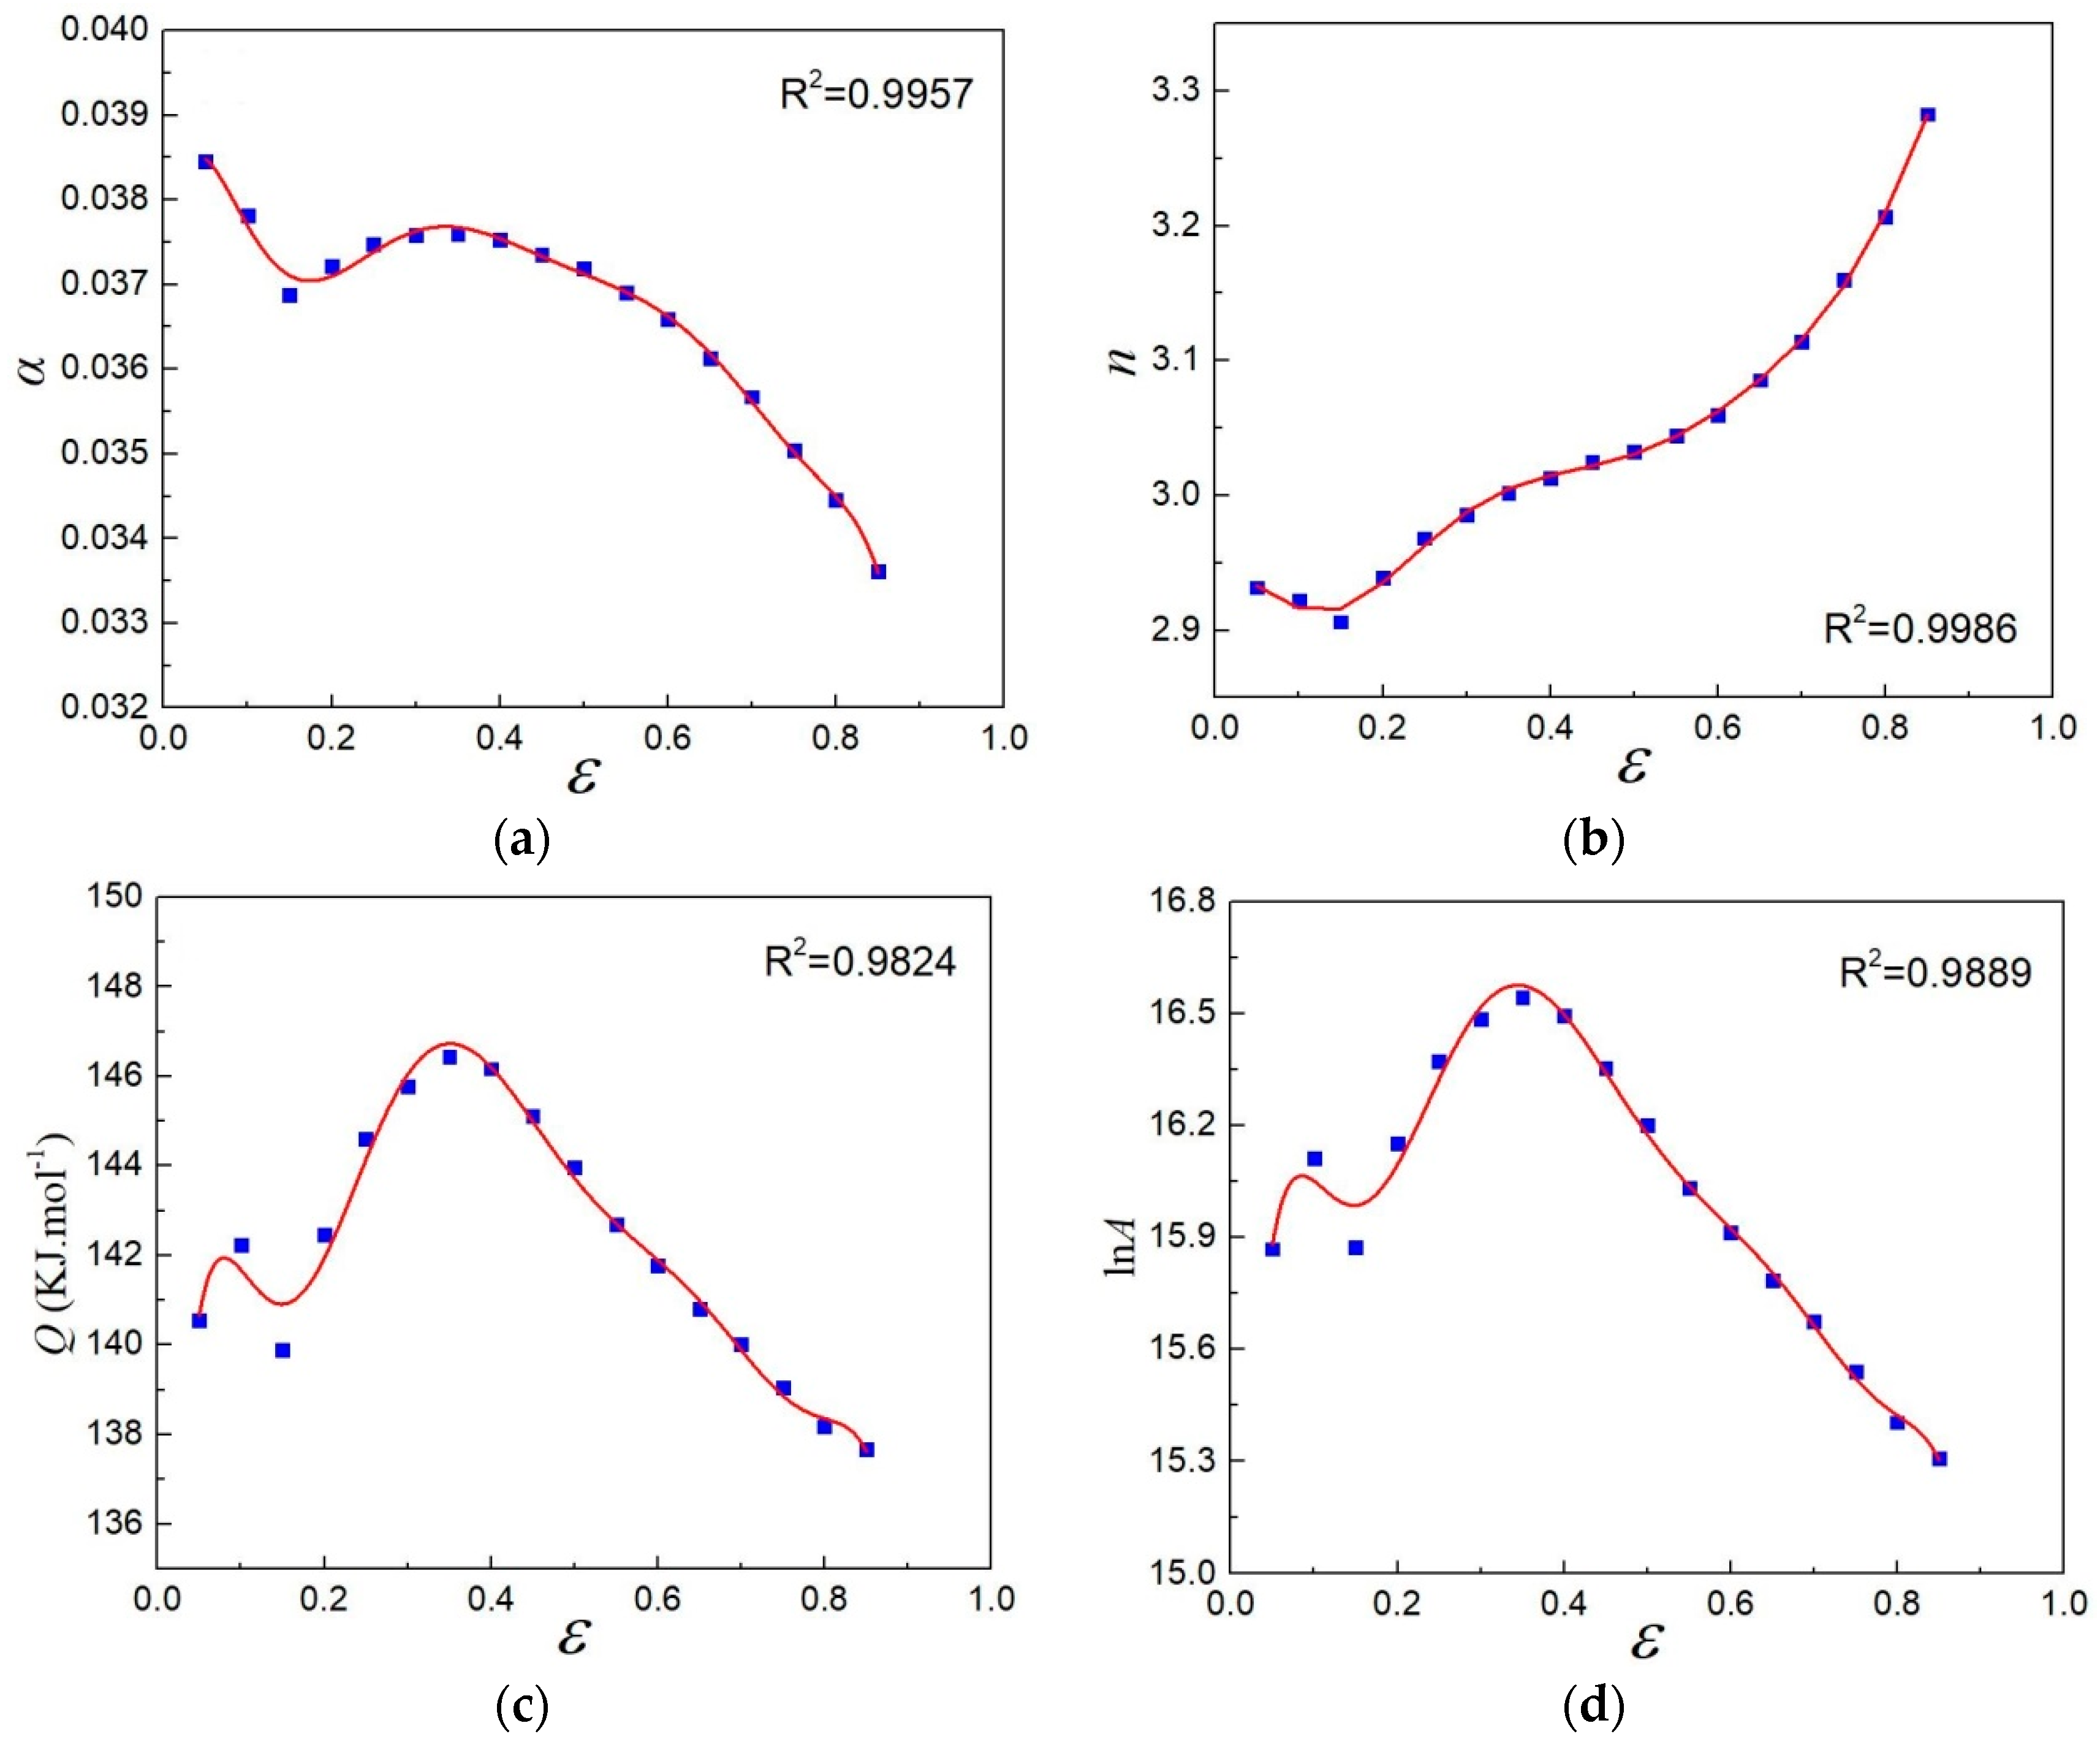
By connecting Equations (1)–(4) and (11), a modified Arrhenius model was constructed, considering different strain ranges from 0.05 to 0.85 with an interval of 0.05 to describe the flow behavior of the Ni-Cu-Al nickel brass alloy at other levels of strain. Material constants, such as α, n, Q and lnA, are related to strain, as shown in Figure 4.
The calculation results indicate that the material constants vary with strain, and that the constitutive model equation for each amount of strain is independent. Therefore, to make this Arrhenius-type constitutive model applicable to other levels of strain, the eighth-order polynomial regression method was used to obtain the relationship between strain and these material constants. The relation between these parameters and strain is given by Equation (12) and the determination coefficients are in Table 2. Finally, a modified Arrhenius-type constitutive model was constructed using an introduced Z parameter, and is given by Equation (13).
{ α ( ε ) = B 0 + B 1 ε + B 2 ε 2 + B 3 ε 3 + B 4 ε 4 + B 5 ε 5 + B 6 ε 6 + B 7 ε 7 + B 8 ε 8 n ( ε ) = C 0 + C 1 ε + C 2 ε 2 + C 3 ε 3 + C 4 ε 4 + C 5 ε 5 + C 6 ε 6 + C 7 ε 7 + C 8 ε 8 Q ( ε ) = D 0 + D 1 ε + D 2 ε 2 + D 3 ε 3 + D 4 ε 4 + D 5 ε 5 + D 6 ε 6 + D 7 ε 7 + D 8 ε 8 ln A ( ε ) = E 0 + E 1 ε + E 2 ε 2 + E 3 ε 3 + E 4 ε 4 + E 5 ε 5 + E 6 ε 6 + E 7 ε 7 + E 8 ε 8
σ = 1 α ( ε ) ln { ( Z / A ( ε ) ) 1 n ( ε ) + [ ( Z / A ( ε ) ) 2 n ( ε ) + 1 ] 1 2 }
where Z = ε ˙ exp [ Q ( ε ) / R T ] .
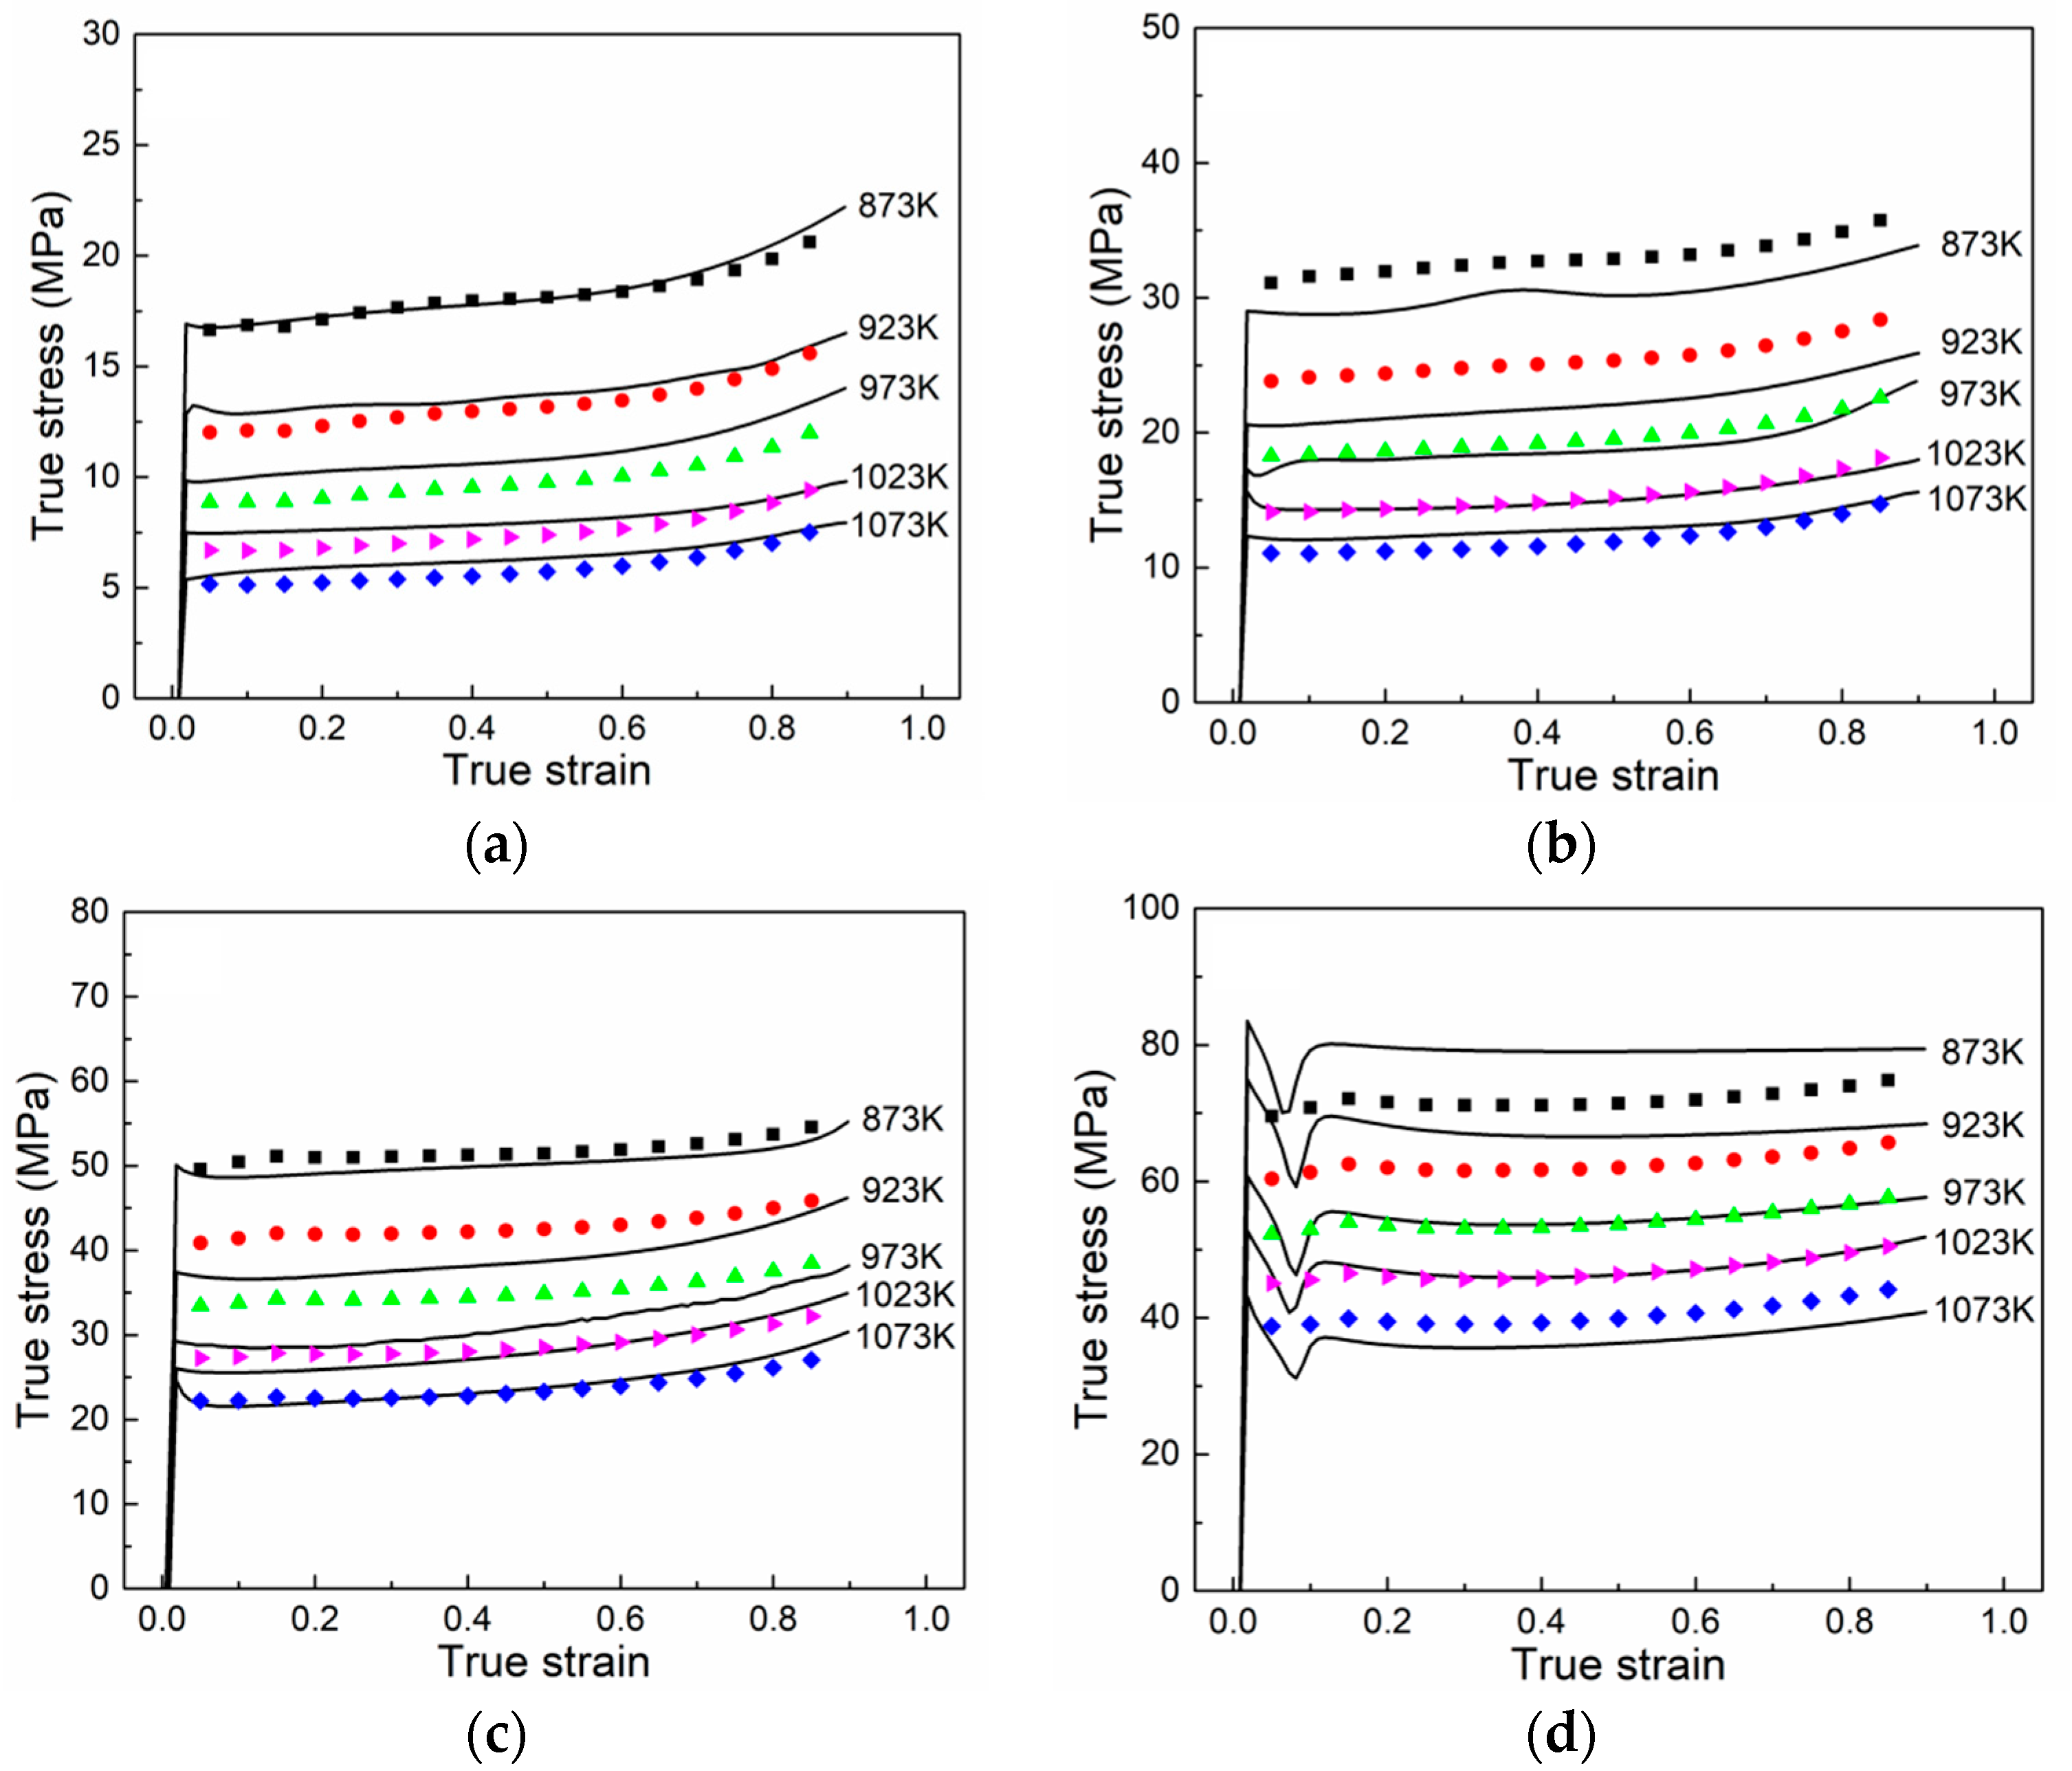
Figure 5 shows the comparison between the experimental values and predicted values using this modified equation. The average absolute relative error (AARE), employed to quantitatively describe the accuracy of the modified constitutive model, is 6.35%, and the root mean squared error (RMSE) is 2.71 MPa, meaning that this modified constitutive model considering strain compensation has a good correlation capability.

3.3. Processing Map

3.3.1. The Principle of the Processing Map

The processing map was constructed based on the dynamic material model (DMM) to analyze the intrinsic workability of various alloys. In DMM theory, the power dissipation (P) of materials during hot deformation contains two parts: (1) part G which results in heat generation during deformation; (2) part J which leads to microstructural changes. Each part can be represented in terms of flow stress, strain, and strain rate. In the dynamic material model, the total input power (P) of the system is given by the below Equation (14) [37,38]:
P = σ ε ˙ = G + J = 0 ε ˙ σ d ε ˙ + 0 σ ε ˙ d σ
where G represents dissipation by plastic work, J represents dissipation by microstructure evolution, σ is flow stress and ε ˙ is strain rate. The proportion of G and J during the hot forming process is defined by strain rate sensitivity (m), and m is given by:
m = J G = ε ˙ σ σ ε ˙ = ( ln σ ) ( ln ε ˙ )
To describe power dissipation conditions during the hot forming process quantitatively, the power dissipation coefficient η is used, and different values of η may imply different forming mechanisms. η is defined by:
η = J J max = 2 m m + 1
where the ideal linear dissipation unit m = 1 and the maximum value of J is J max .
The 3D change maps of strain rate sensitivity m and power dissipation coefficient η are graphics constituted of curves with the same values under a specific strain. Generally, a higher η-value indicates good workability, but this is not absolute. Flow instabilities that also have a high η-value, such as adiabatic shear bands and small cracks, should be considered and avoided. According to the principle of maximum entropy production rate, Prasad [37,39] created a principle to determine whether the material has workability or not based on DMM theory. The principle is given by:
ξ ( ε ˙ ) = ln ( m m + 1 ) ln ε ˙ + m < 0
where the instability parameter ξ ( ε ˙ ) is a function of deformation temperature, strain rate, and strain, because m is related to deformation temperature and strain rate at a specific strain value. Generally, when strain is given, the first step is to find the true stress at all conditions, and then m and ξ ( ε ˙ ) can be calculated and the instability map can be obtained by drawing the contour map of ξ ( ε ˙ ) versus deformation temperature T and ln ε ˙ . For this principle, when the value of ξ ( ε ˙ ) is negative, the material under the corresponding conditions will be unstable and may lead to instabilities such as flow localization and adiabatic shear bands, etc., which may cause the failure of final components. Therefore, the construction of the processing map demonstrating materials’ workability is significant for deformation processes.

3.3.2. Construction of Processing Map

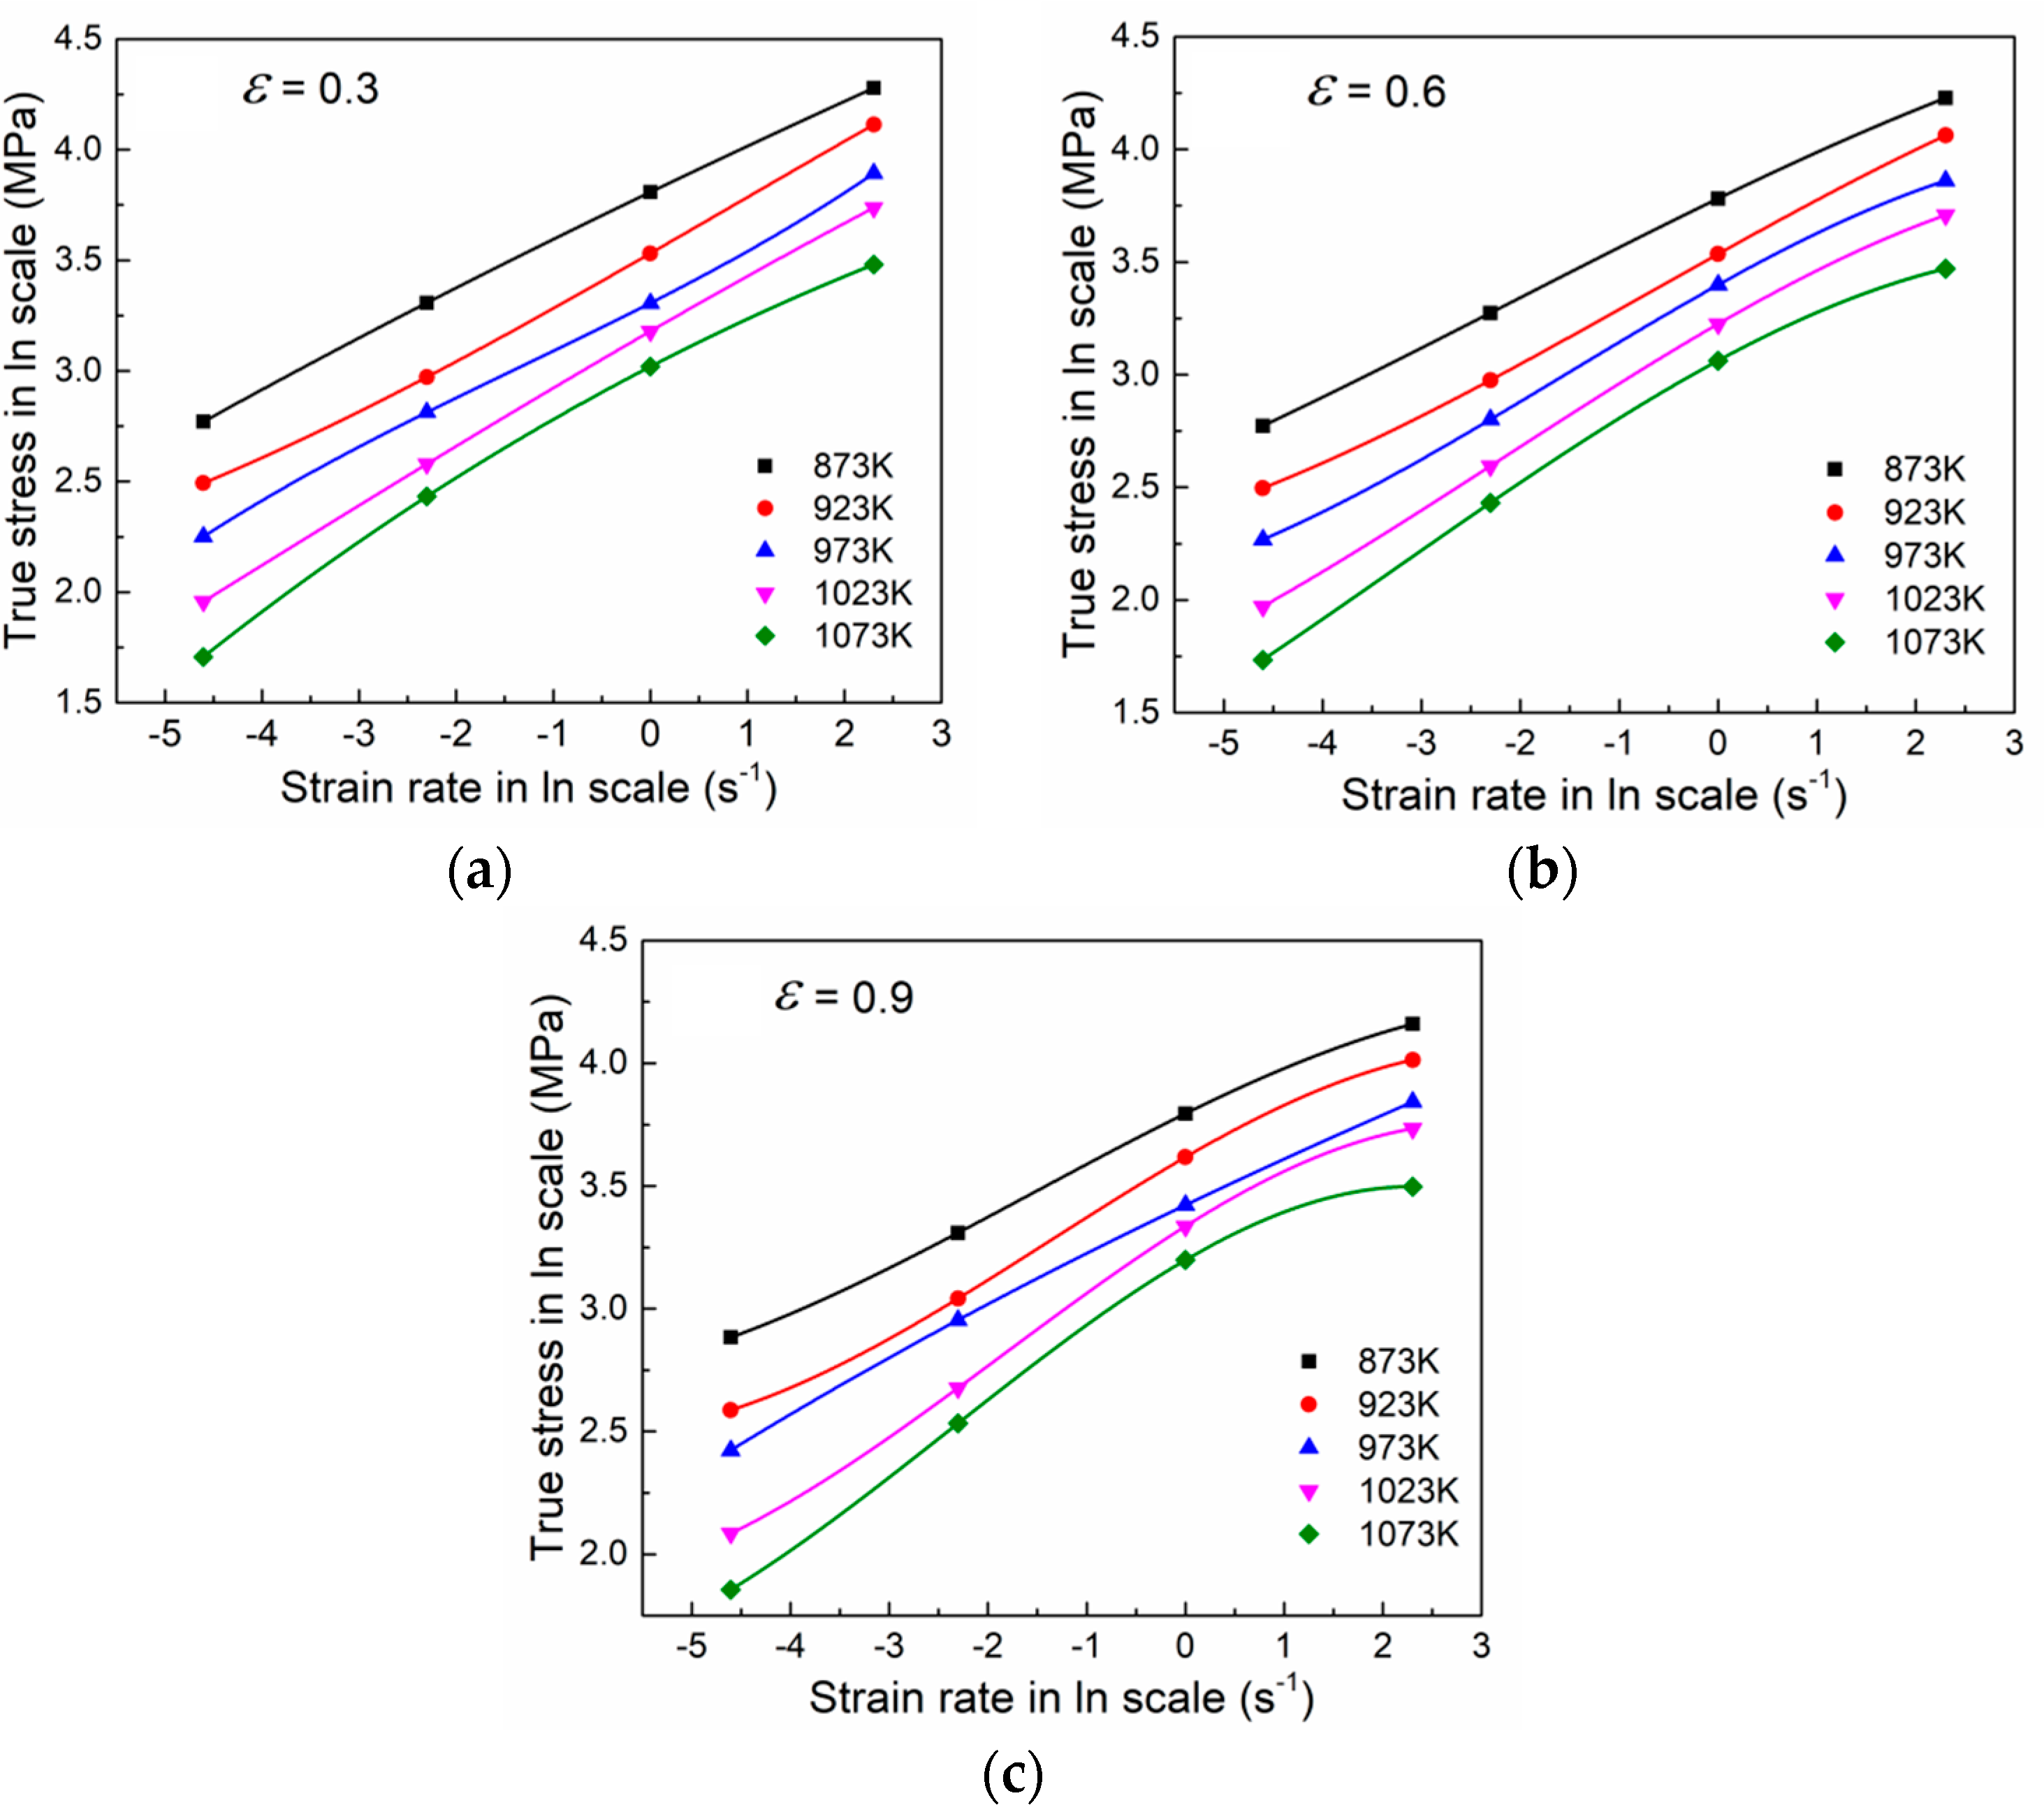
In order to establish the processing map, true stress at the strain levels of 0.3, 0.6, and 0.9 under all deformation conditions was obtained from the true stress–true strain curves. Flow stress increased rapidly at the initial stage, then the curves increased slightly or stayed steady with increasing strain; this phenomenon indicates that the work hardening and dynamic softening mechanisms both appeared during the hot deformation process, and that dynamic softening gradually becomes the dominant mechanism, especially in the stable flow curves. The obtained data enable the plotting of curves showing ln σ versus ln ε ˙ using polynomial fitting. According to the cubic spline polynomial function in Equation (18), the cubic spline curves for ln σ versus ln ε ˙ are obtained, as shown in Figure 6. Subsequently, taking the partial derivative of Equation (18), the strain rate sensitivity coefficient m can be appropriately expressed by Equation (19).
ln σ = a + b ( ln ε ˙ ) + c ( ln ε ˙ ) 2 + d ( ln ε ˙ ) 3
m = ( ln σ ) ( ln ε ˙ ) | ε , T = b + 2 c ( ln ε ˙ ) + 3 d ( ln ε ˙ ) 2
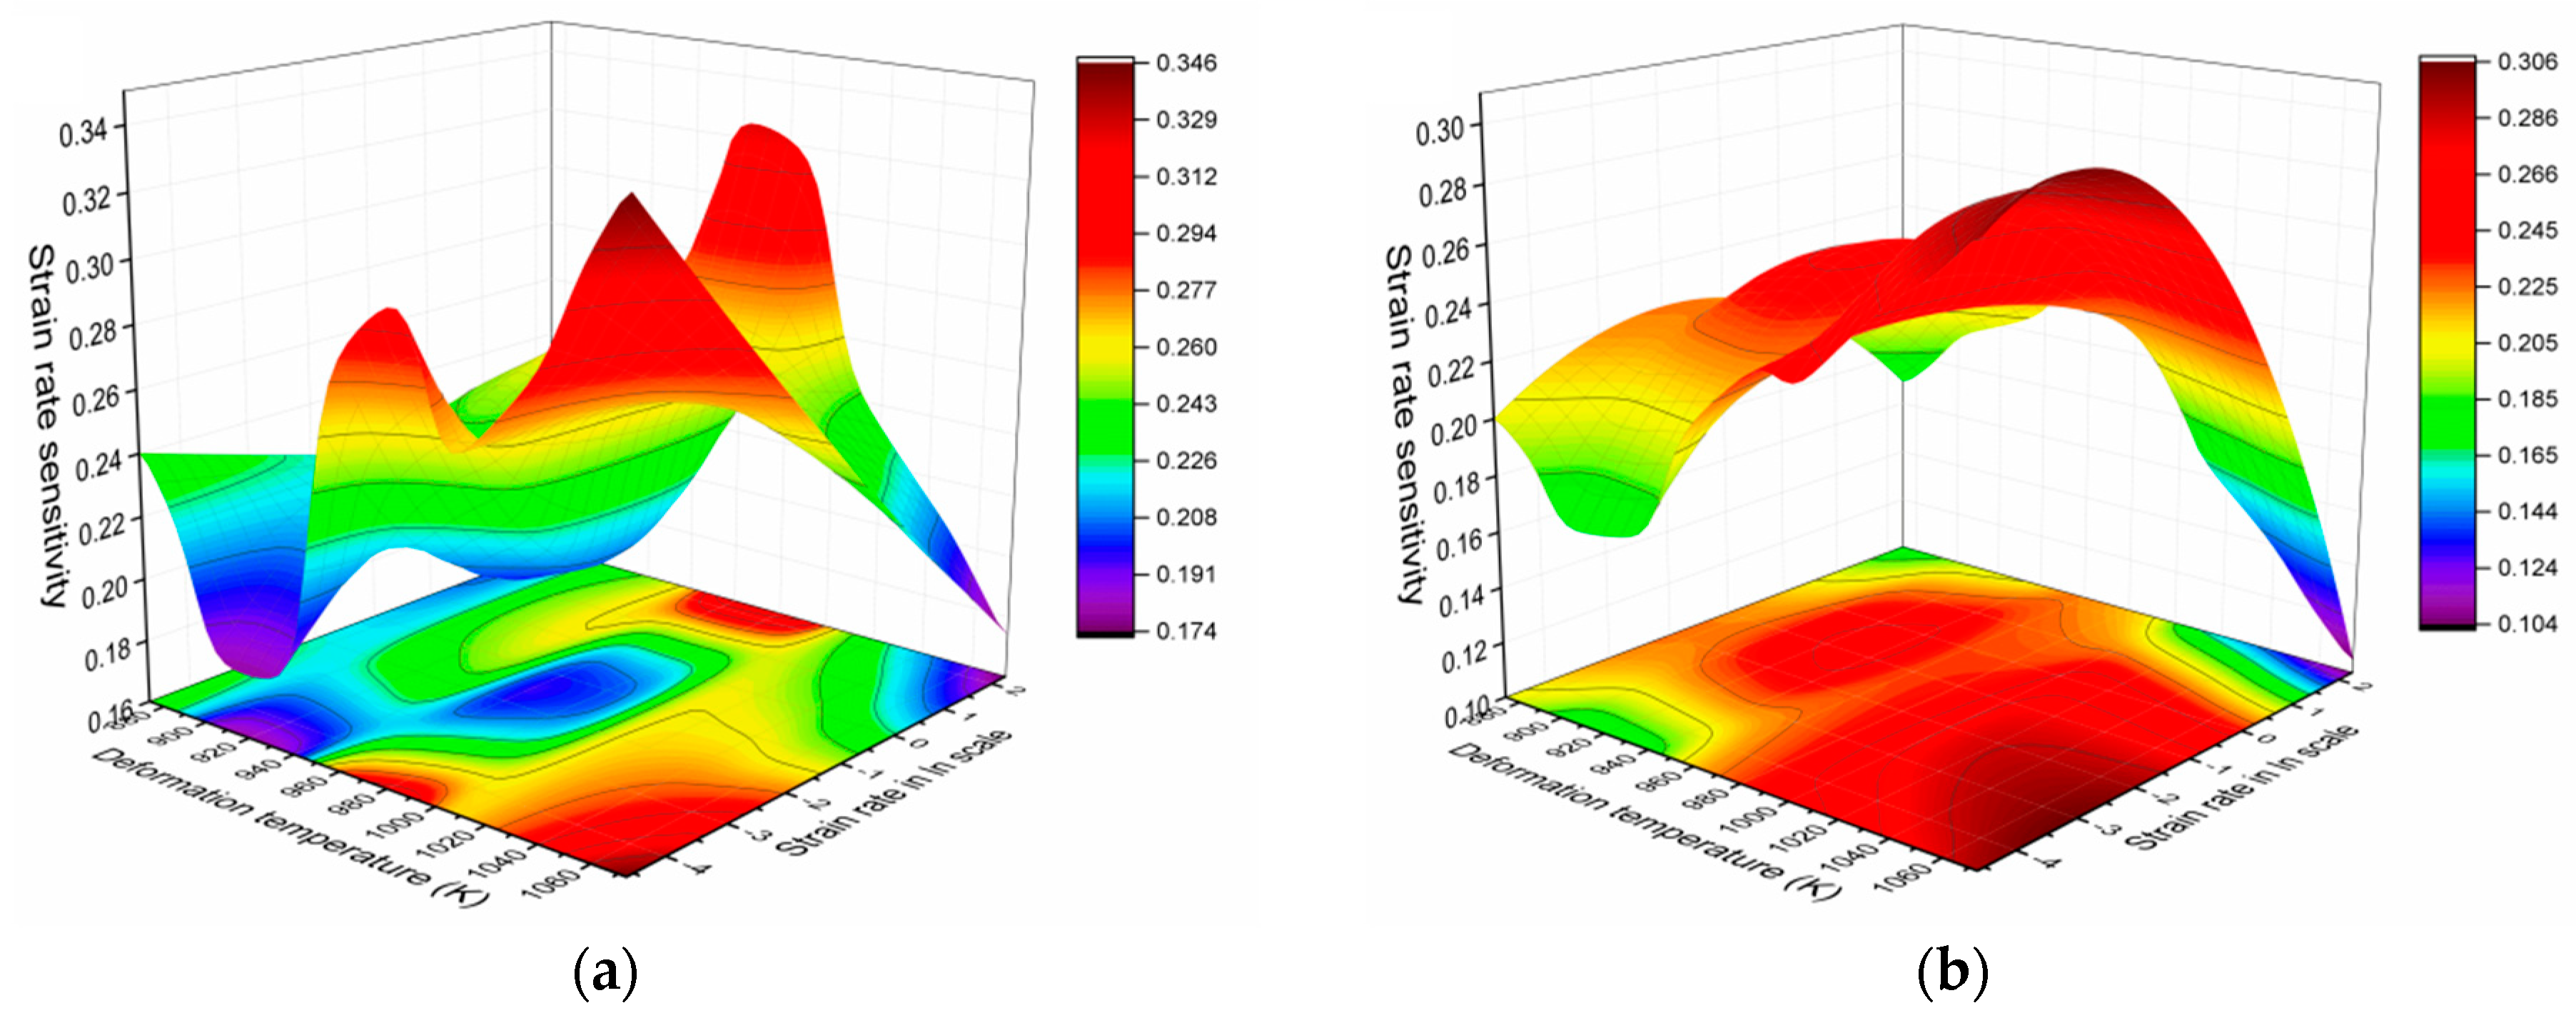
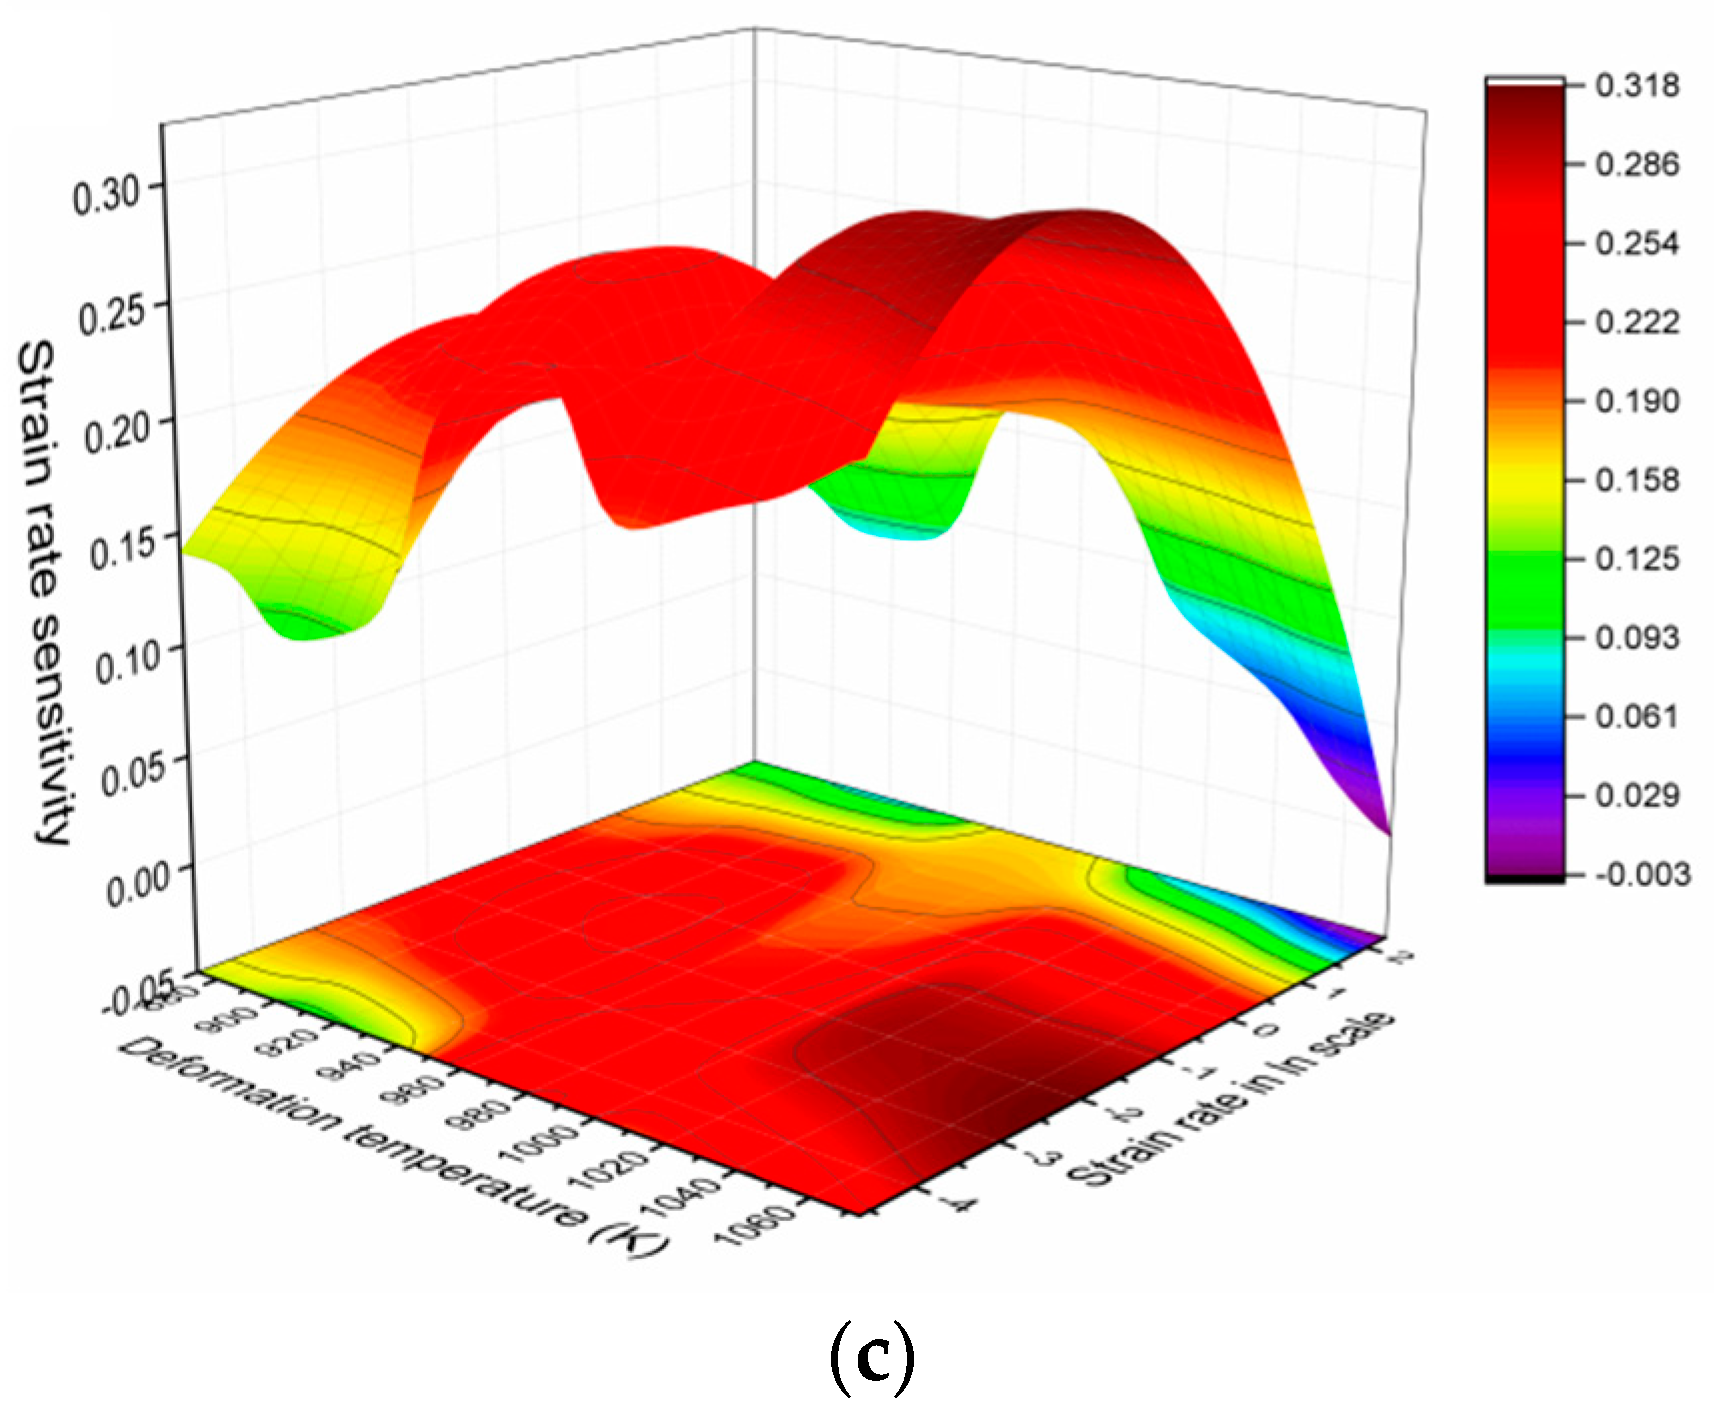
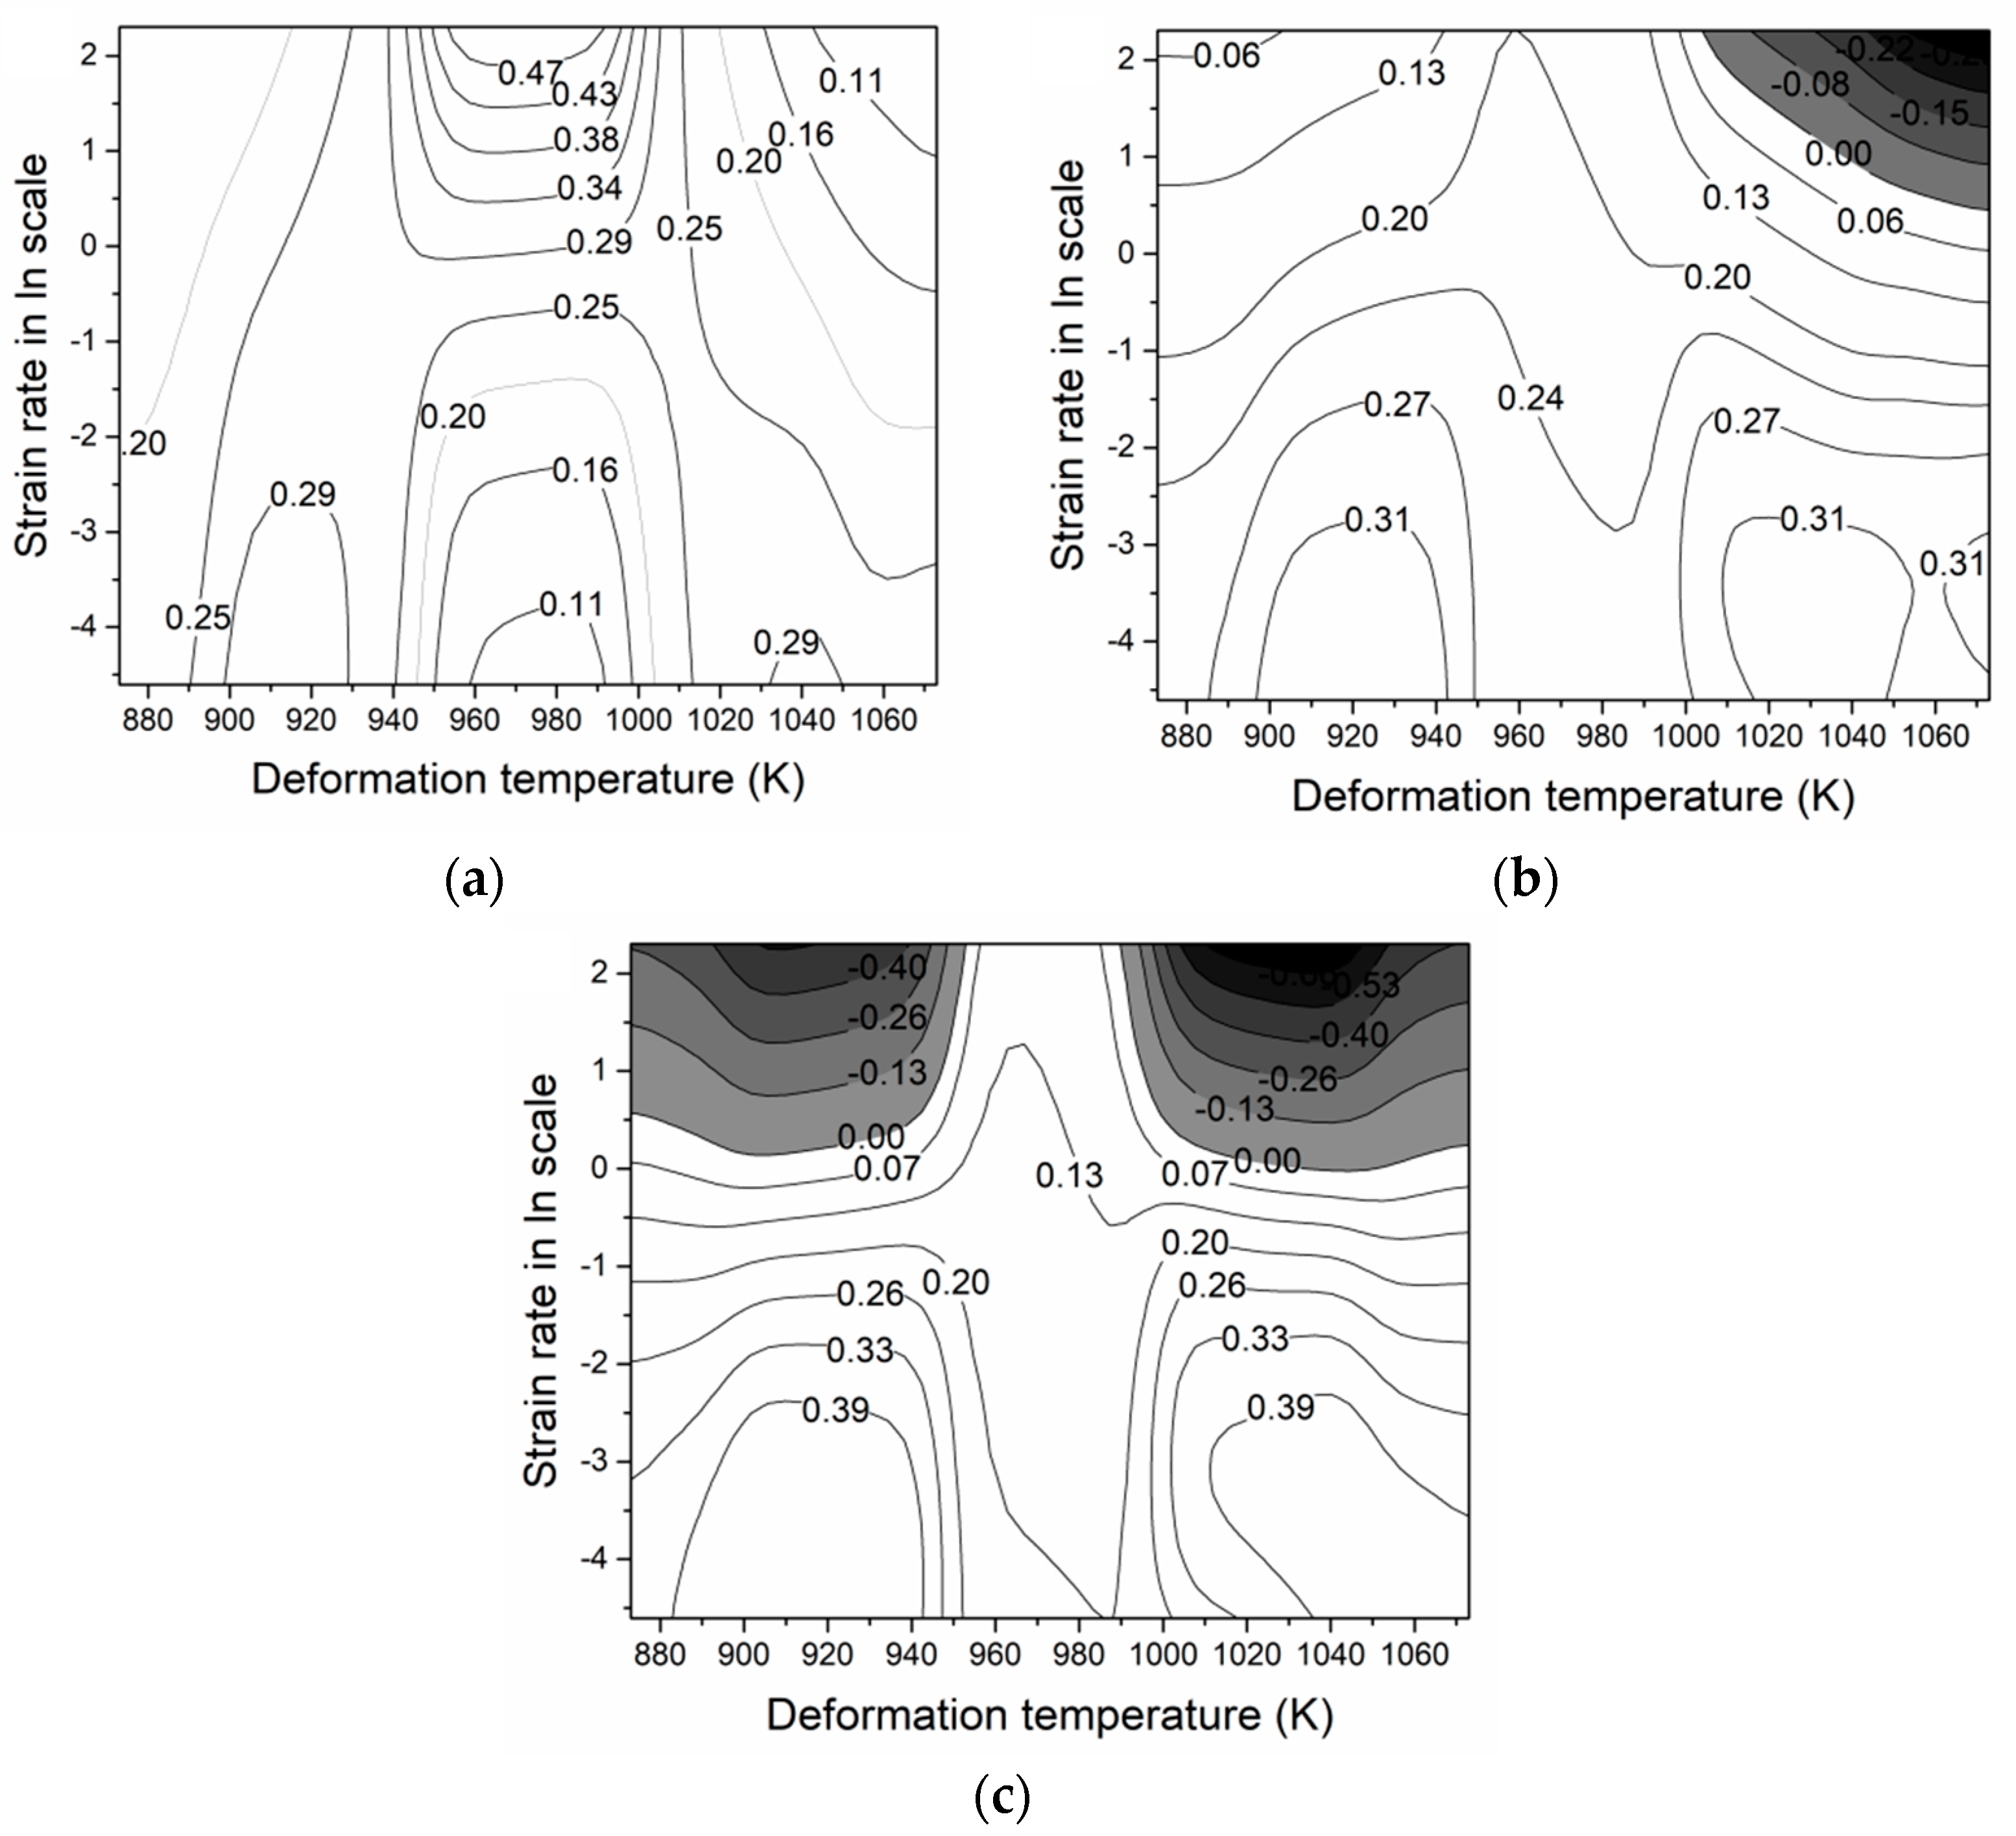
After making cubic spline curves of ln σ versus ln ε ˙ , the polynomial coefficients a, b, c and d can be obtained by fitting, and so the values of the partial derivative m under all experimental deformation conditions can be calculated using Equation (19). The fluctuation in m reflects internal microstructure evolution during the hot deformation process; it is an important index for describing superplastic deformation behaviors. High strain rate sensitivity is more likely to obtain good plasticity properties and low strain rate sensitivity may imply the formation of defects inside the material [40]. Figure 7 is the 3D change map of the strain rate sensitivity m at different strains. It can be seen that m is increased with increasing deformation temperature and decreasing strain rate, in general. This is because variation in m is related to the non-basal slip mechanism [20]. The critical stress of non-basal slip is moderate when the deformation temperature is higher; at the same time, at lower strain rates, enough time enables non-basal slip to become the dominant forming mechanism and raise the power dissipation from microstructure evolution, which leads to higher values of m at both high deformation temperatures and low strain rates. Furthermore, strain is a significant factor for m, as the value of m is increased with increasing strain. In Figure 7, the m-values of nickel brass range from 0 to 0.33; the area filled by warm colors such as red corresponds to high m-values and the area filled by cold colors such as blue corresponds to low m-values. Specifically, the m-value of the Ni-Cu-Al nickel brass alloy is approximately 0 for high strain rates with high deformation temperatures, and a maximum value of about 0.33 for low strain rates with high deformation temperatures. Furthermore, the peak m-value at strain of 0.3 is higher than at 0.6 and 0.9, and the m-value at strain of 0.3 is mostly also higher than at strain of 0.6 and 0.9 under the same deformation conditions. Moreover, the high m-value area at strain of 0.9 is larger than at strain of 0.3 and 0.6, and the area of high m-value is increased with increasing strain, which also confirms that strain has an effect on microstructure evolution.
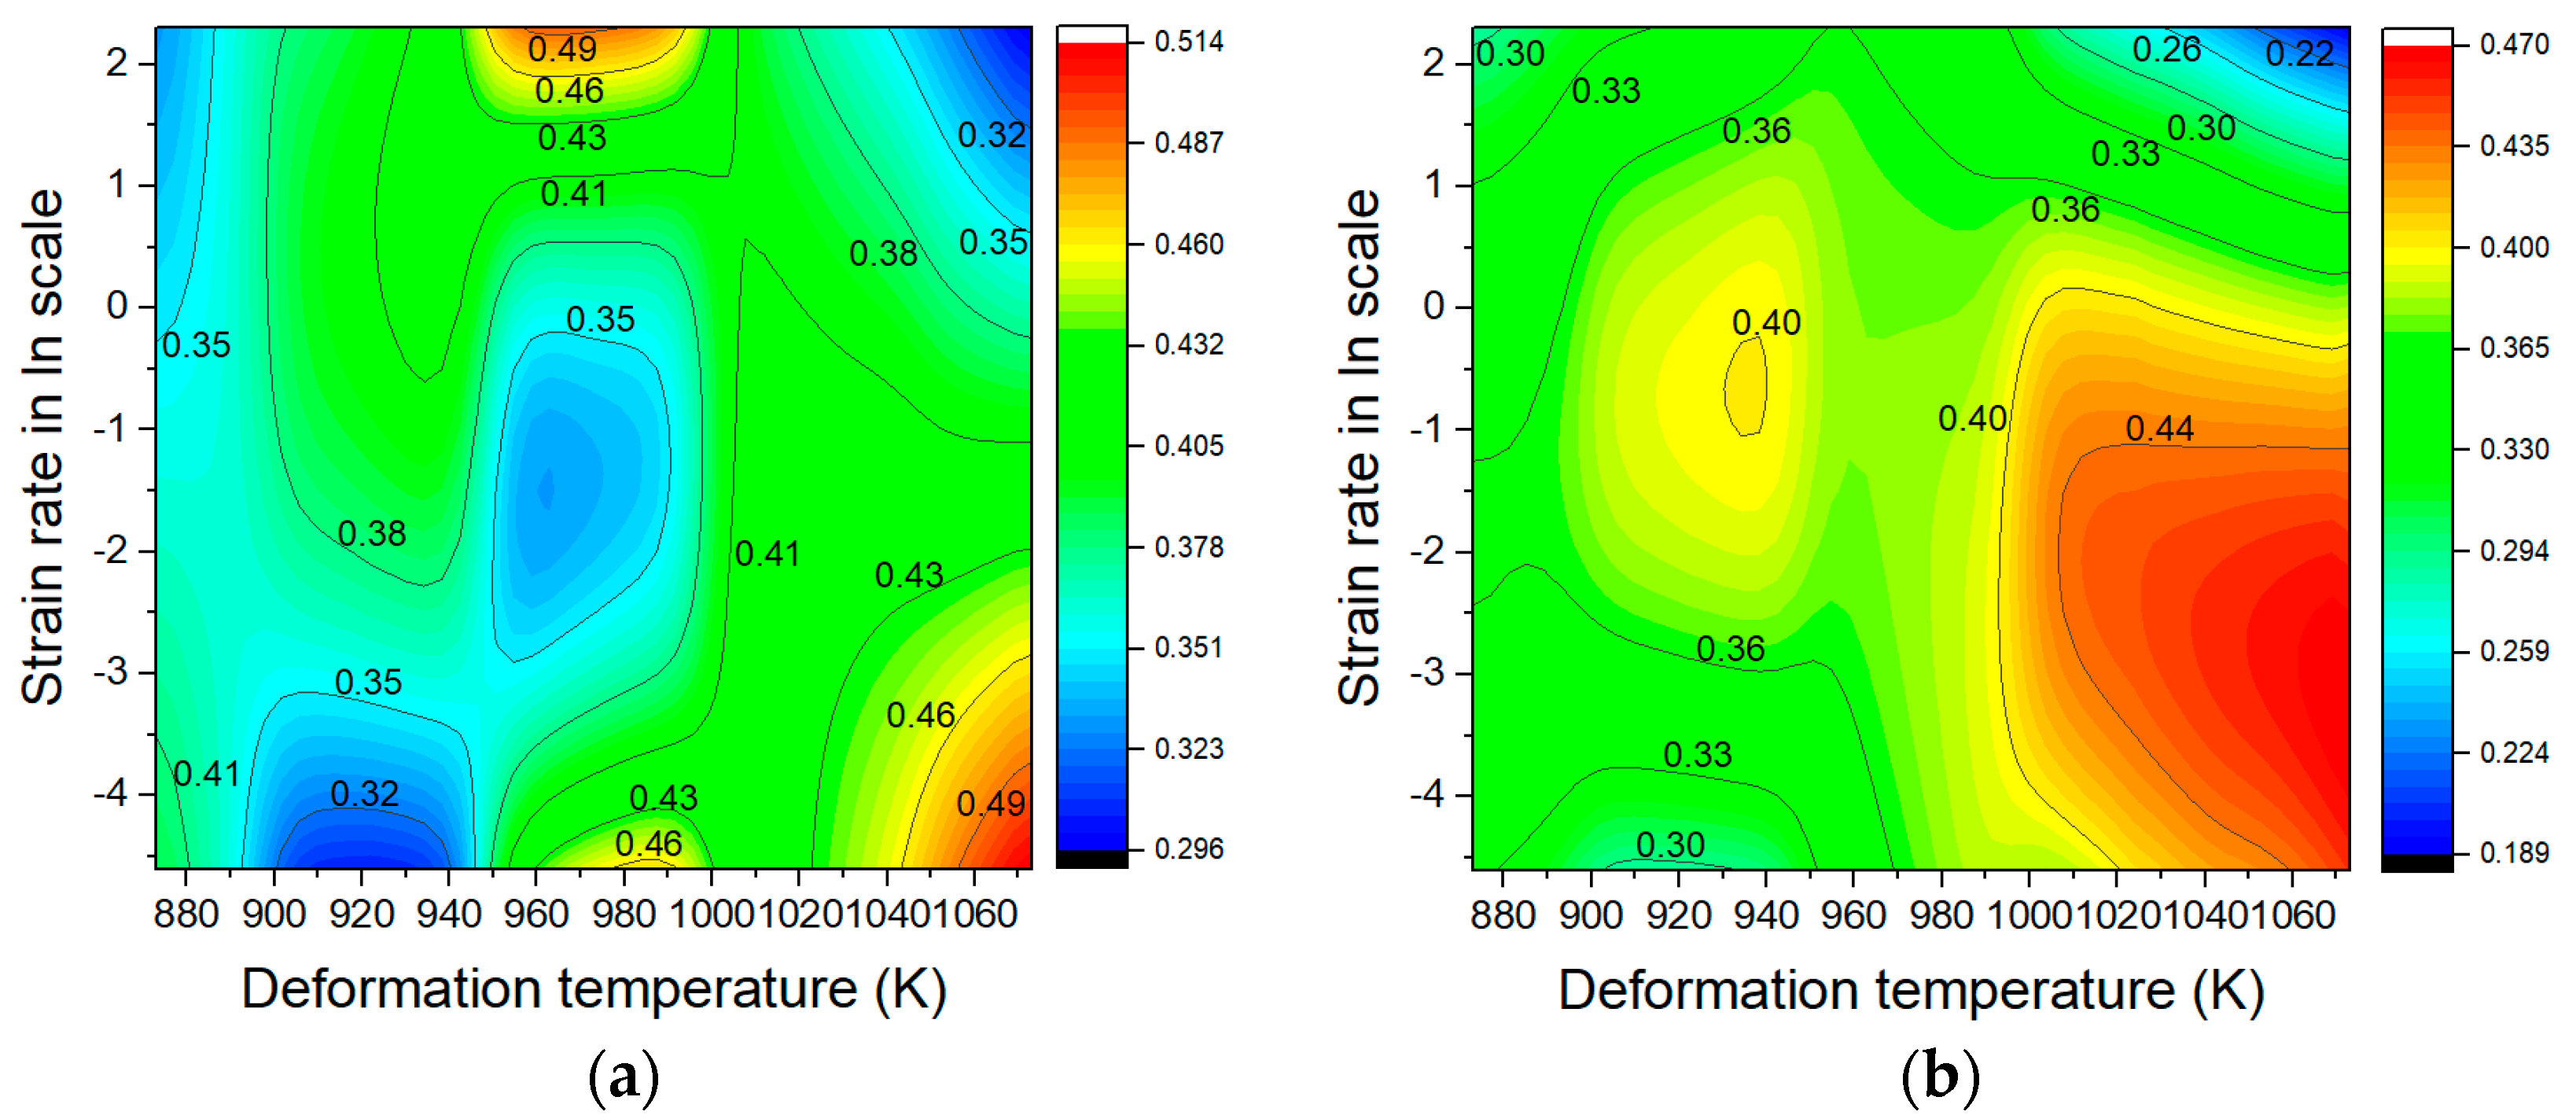
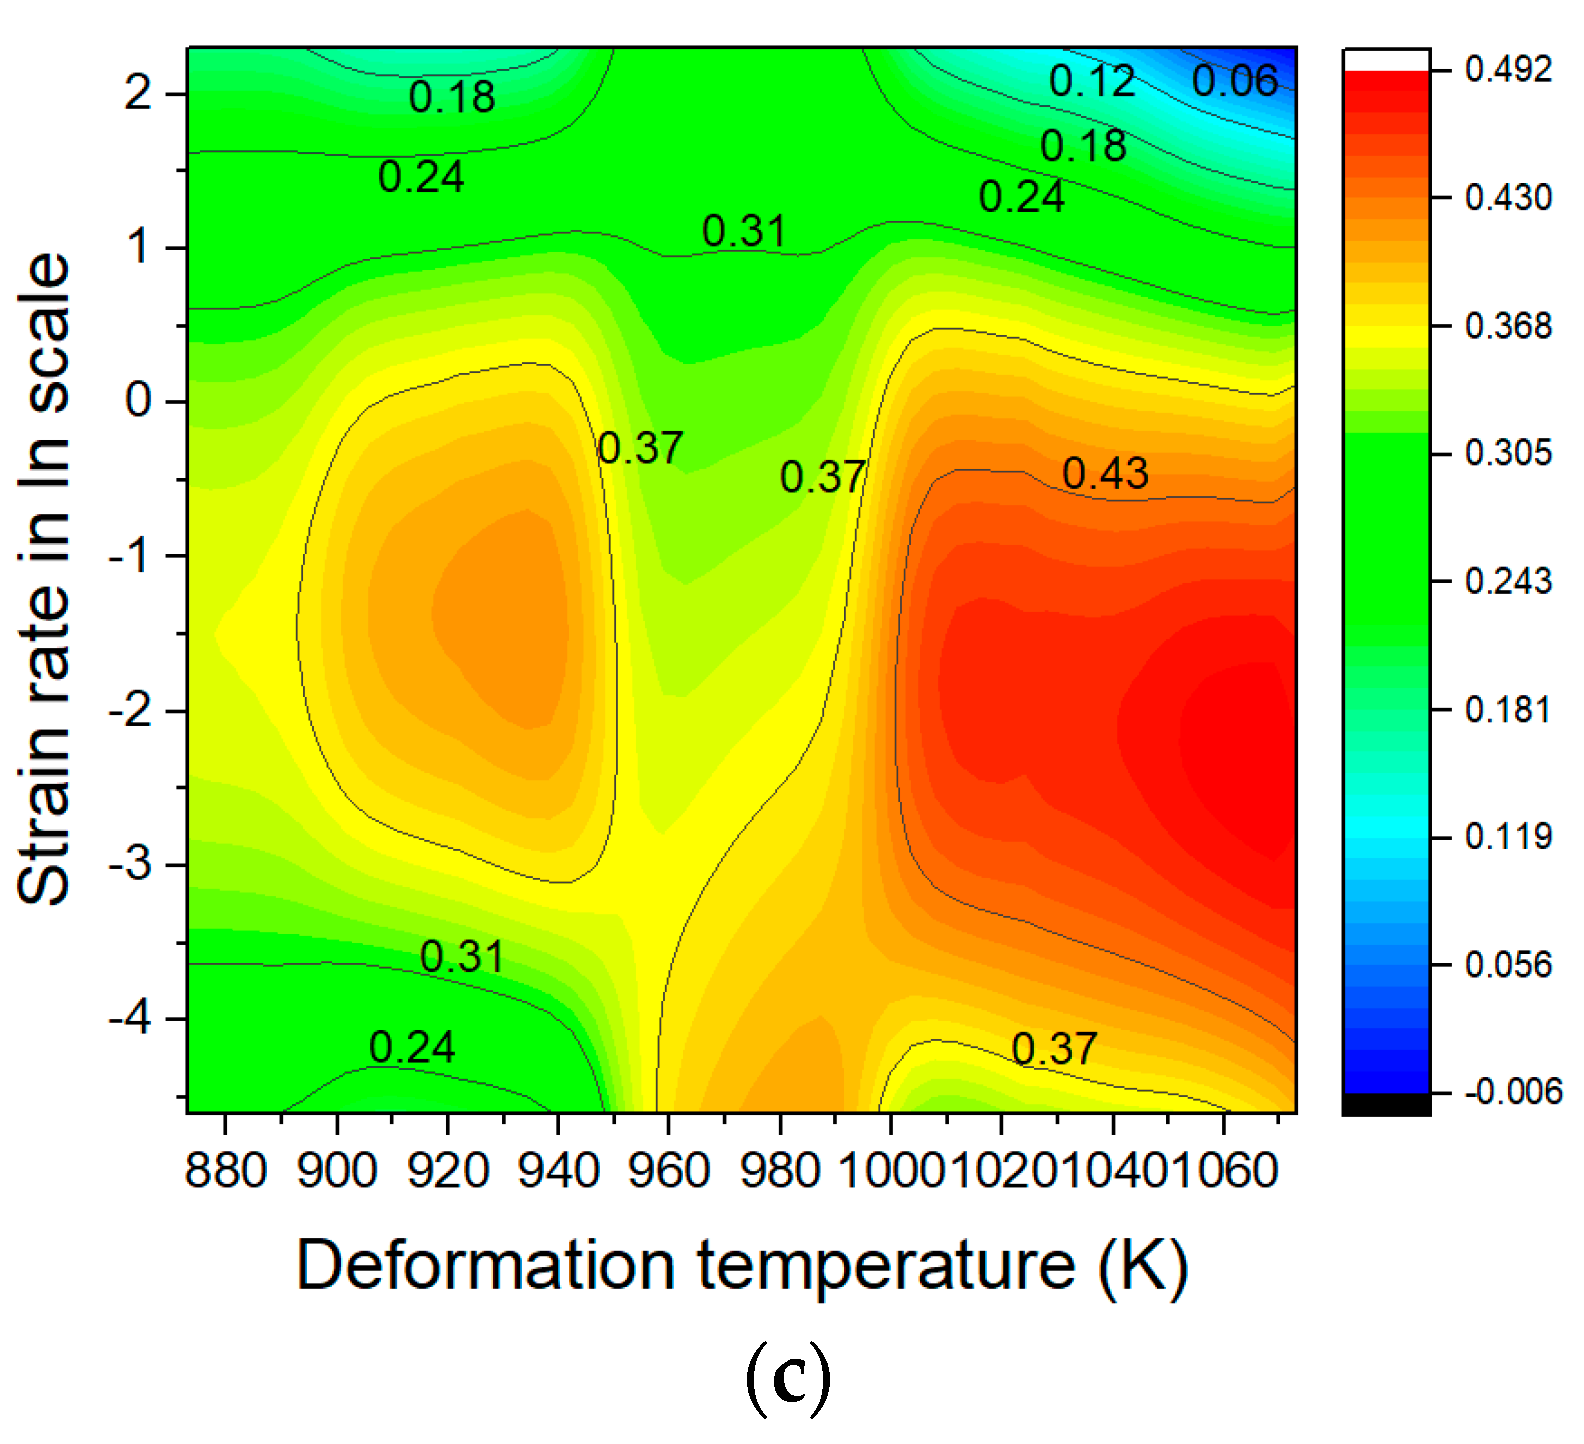
It is known that the power dissipation coefficient η describes the relative rate of internal entropy produced during the hot deformation process. According to the m-values, the power dissipation coefficient η can be calculated using Equation (16) and so the contour maps of the power dissipation coefficient η were constructed using an interpolation method based on a series of limited values of η at strain levels of 0.3, 0.6, and 0.9. As presented in Figure 8, the power dissipation coefficient η tends to increase with increasing deformation temperatures and decreasing strain rate, and the η-values range from 0.06 to 0.49. The regions colored in red, orange and yellow, associated with η > 0.4, represent the best conditions for hot deformation, which are at 0.01–1s-1 with deformation temperatures from 990 to 1073 K and at 0.8–10 s−1 with deformation temperatures from 900 to 1010 K at strain of 0.3. With increasing strain, the η-values decrease, and the best conditions for hot deformation associated with η > 0.4 are in the region of 0.02–1 s−1 along with deformation temperatures from 1000 to 1073 K at strain of 0.9, and the area of best hot deformation is smaller than at the strain levels of 0.3 and 0.6, which shows that the area associated with η > 0.4 shrinks with increasing strain. In addition, η changes significantly at about 950 K: η decreases from 873 to 923 K and then increases. This phenomenon may due to the brittle hot working region of brass. Simultaneously, the power dissipation coefficient η is also related to dynamic recovery and dynamic recrystallization, but there is only a dynamic recrystallization mechanism for brass due to its low stacking fault energy.
The map of the instability parameter ξ ( ε ˙ ) calculated by Equation (17) is plotted in Figure 9. The colored region (black and gray) shows that the billets deformed under the corresponding deformation conditions are unstable according to the criteria. It can be shown that the values of ξ ( ε ˙ ) at strain of 0.3 are all positive which means that the material can deform without any defects at strain of 0.3. With increasing strain, negative values of ξ ( ε ˙ ) begin to appear in the region of high strain rate with high temperatures. At strain of 0.9, the colored area with ξ ( ε ˙ ) < 0 becomes larger than at strain of 0.3 and 0.6. Therefore, the region of instability is larger with increasing strain; this also explains why some complex components need several processes to be shaped as designed, especially for those components that are too difficult to be filled by only one process. As a result, the appearance of this region of instability indicates that this region is prone to the occurrence of defects, so hot deformation in this region should be avoided.
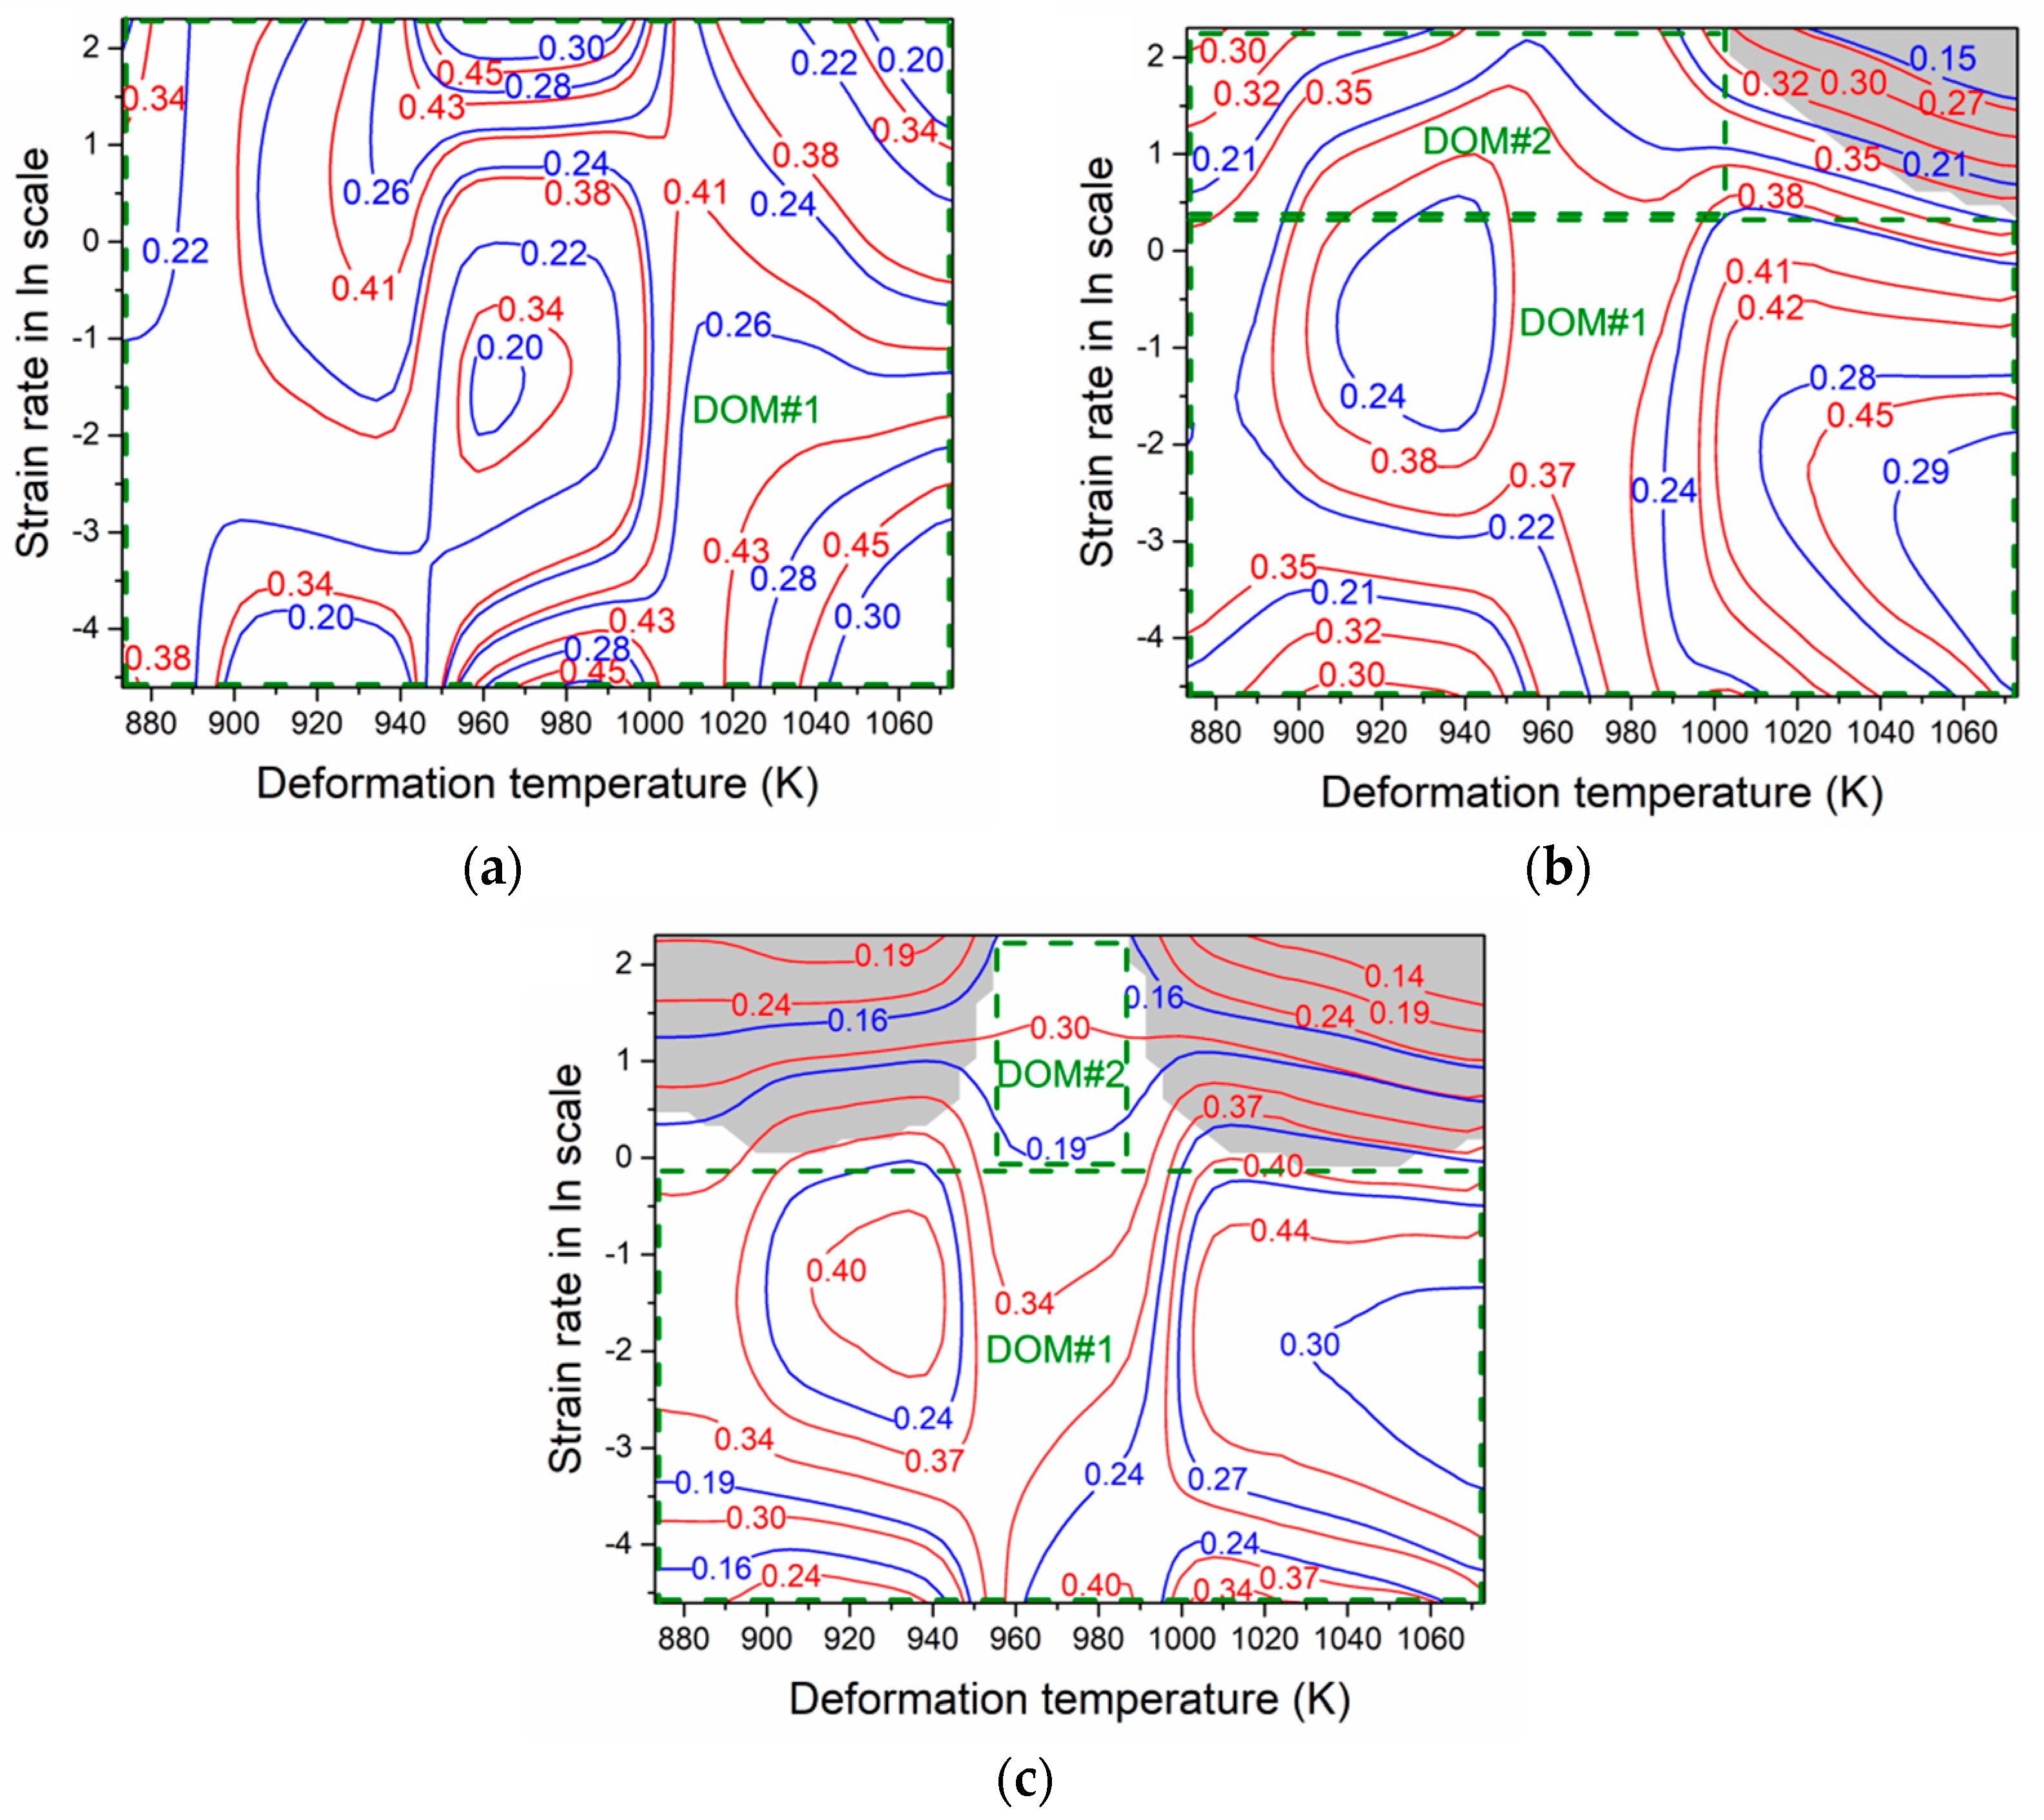
The processing map was adopted to analyze microstructure features. The processing map consists of strain rate sensitivity m (blue line) and power dissipation coefficient η (red line), and the workability principle has been constructed as shown in Figure 10 at the strain levels of 0.3, 0.6, and 0.9, which was also used to confirm the microstructure characteristics after deformation compared with the theoretical calculations. The grey region of the map means that the corresponding deformation condition may lead to defects, and the other region of the map means that the material under the corresponding deformation temperature and strain rate is safe to deform without defects. There are regions framed by a green box, which means that they are not instability regions. Figure 10a shows that all deformation conditions are stable for deforming; with increasing strain, the instability region is expanded. The safe region at strain of 0.9 is DOM#1 while the deformation temperature is 873–1073 K with strain of 0.01–0.85 s−1, and DOM#2 while the deformation temperature is 955–983 K with strain of 0.85–10 s−1. The power dissipation coefficient and strain rate sensitivity are also important elements to consider and they are discussed below.

3.4. Microstructure Observations

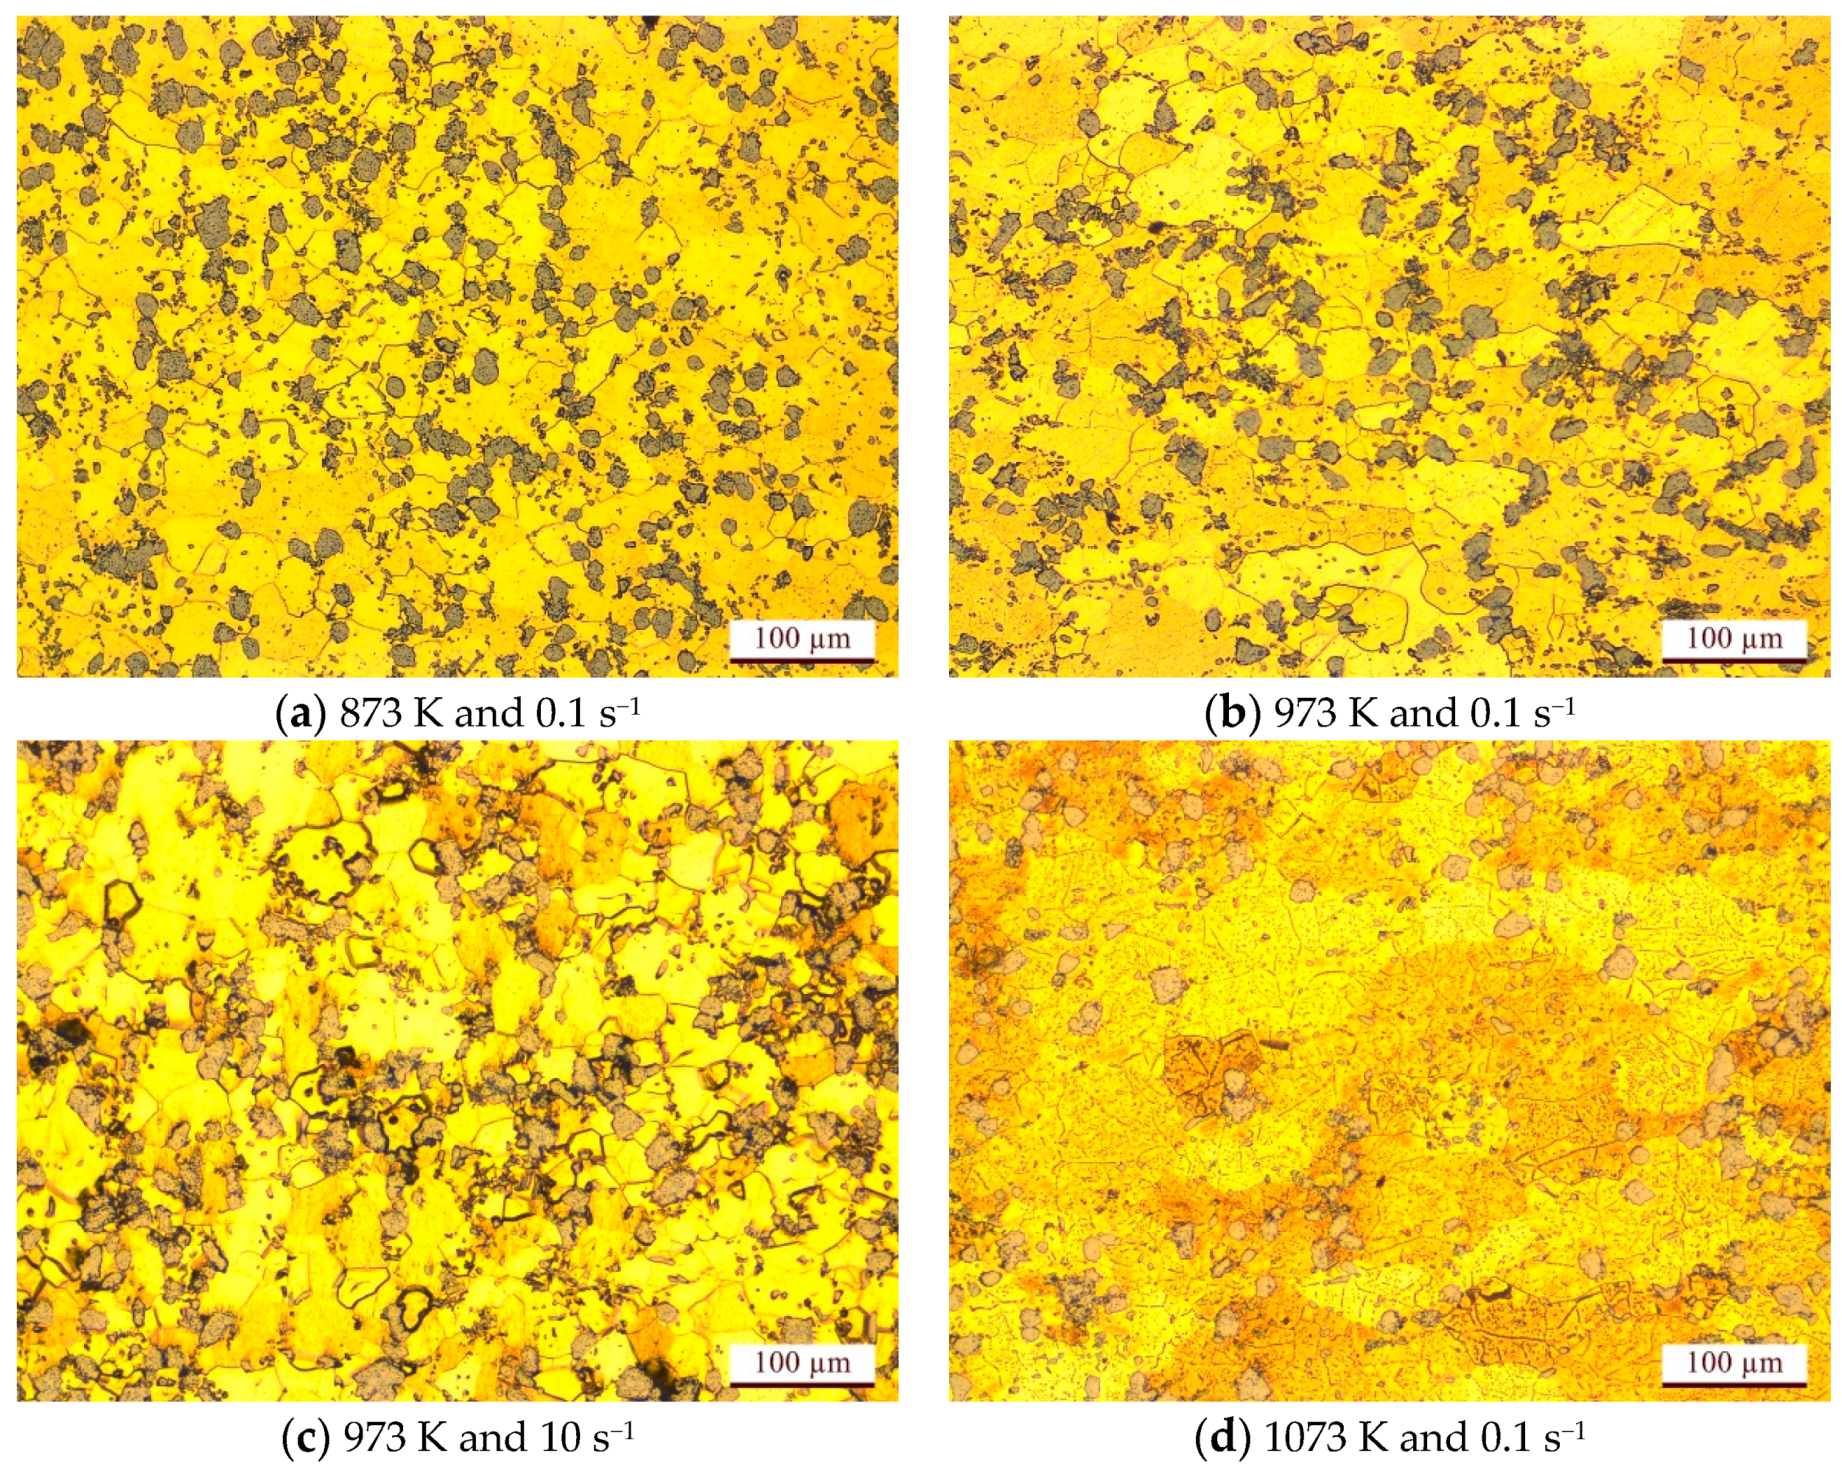
Microstructure is significantly affected by strain rate sensitivity and the power dissipation coefficient, which means that it has a connection with strain, strain rate, and deformation temperature. Therefore, the microstructure of compressive specimens was observed by an optical microscope (OM) to evaluate and identify the processing map constructed above. The OM images of deformed specimens are shown in Figure 11 and Figure 12: the gray hard particles are distributed evenly on the Ni-Cu-Al brass β-phase base. Figure 11a–d shows the microstructure after deformation in the safe working region, while Figure 12a–d shows the microstructure after deformation in the instability region. Figure 11a,b,d shows the strain rate of 0.1 s−1. In Figure 11a, the corresponding m and η are 0.22 and 0.34, respectively, and the unchanged microstructure at deformation temperature of 873 K compared with the original microstructure indicates that dynamic recovery is the dominant forming mechanism during hot deformation. In Figure 11b, at the deformation temperature of 973 K, the corresponding m and η are 0.20 and 0.36, the microstructure has slightly changed compared with the original sample’s microstructure because of heating and deformation, and some small recrystallization grains have appeared around hard particles. With increasing strain rate, these recrystallization grains appear more and the grain boundaries are more manifest than at the strain rate of 0.1 s−1, as shown in Figure 11c. In Figure 11d, at the deformation temperature of 1073 K, the microstructure is different compared with the original sample due to heating at high temperature and deformation, the grain boundary becomes vague, and dislocation cells are clear to distinguish, which also means that it is possible that the deformation mechanism is dynamic recrystallization (DRX) because more energy has been used in the microstructure evolution, with a higher power dissipation coefficient (η = 0.47).
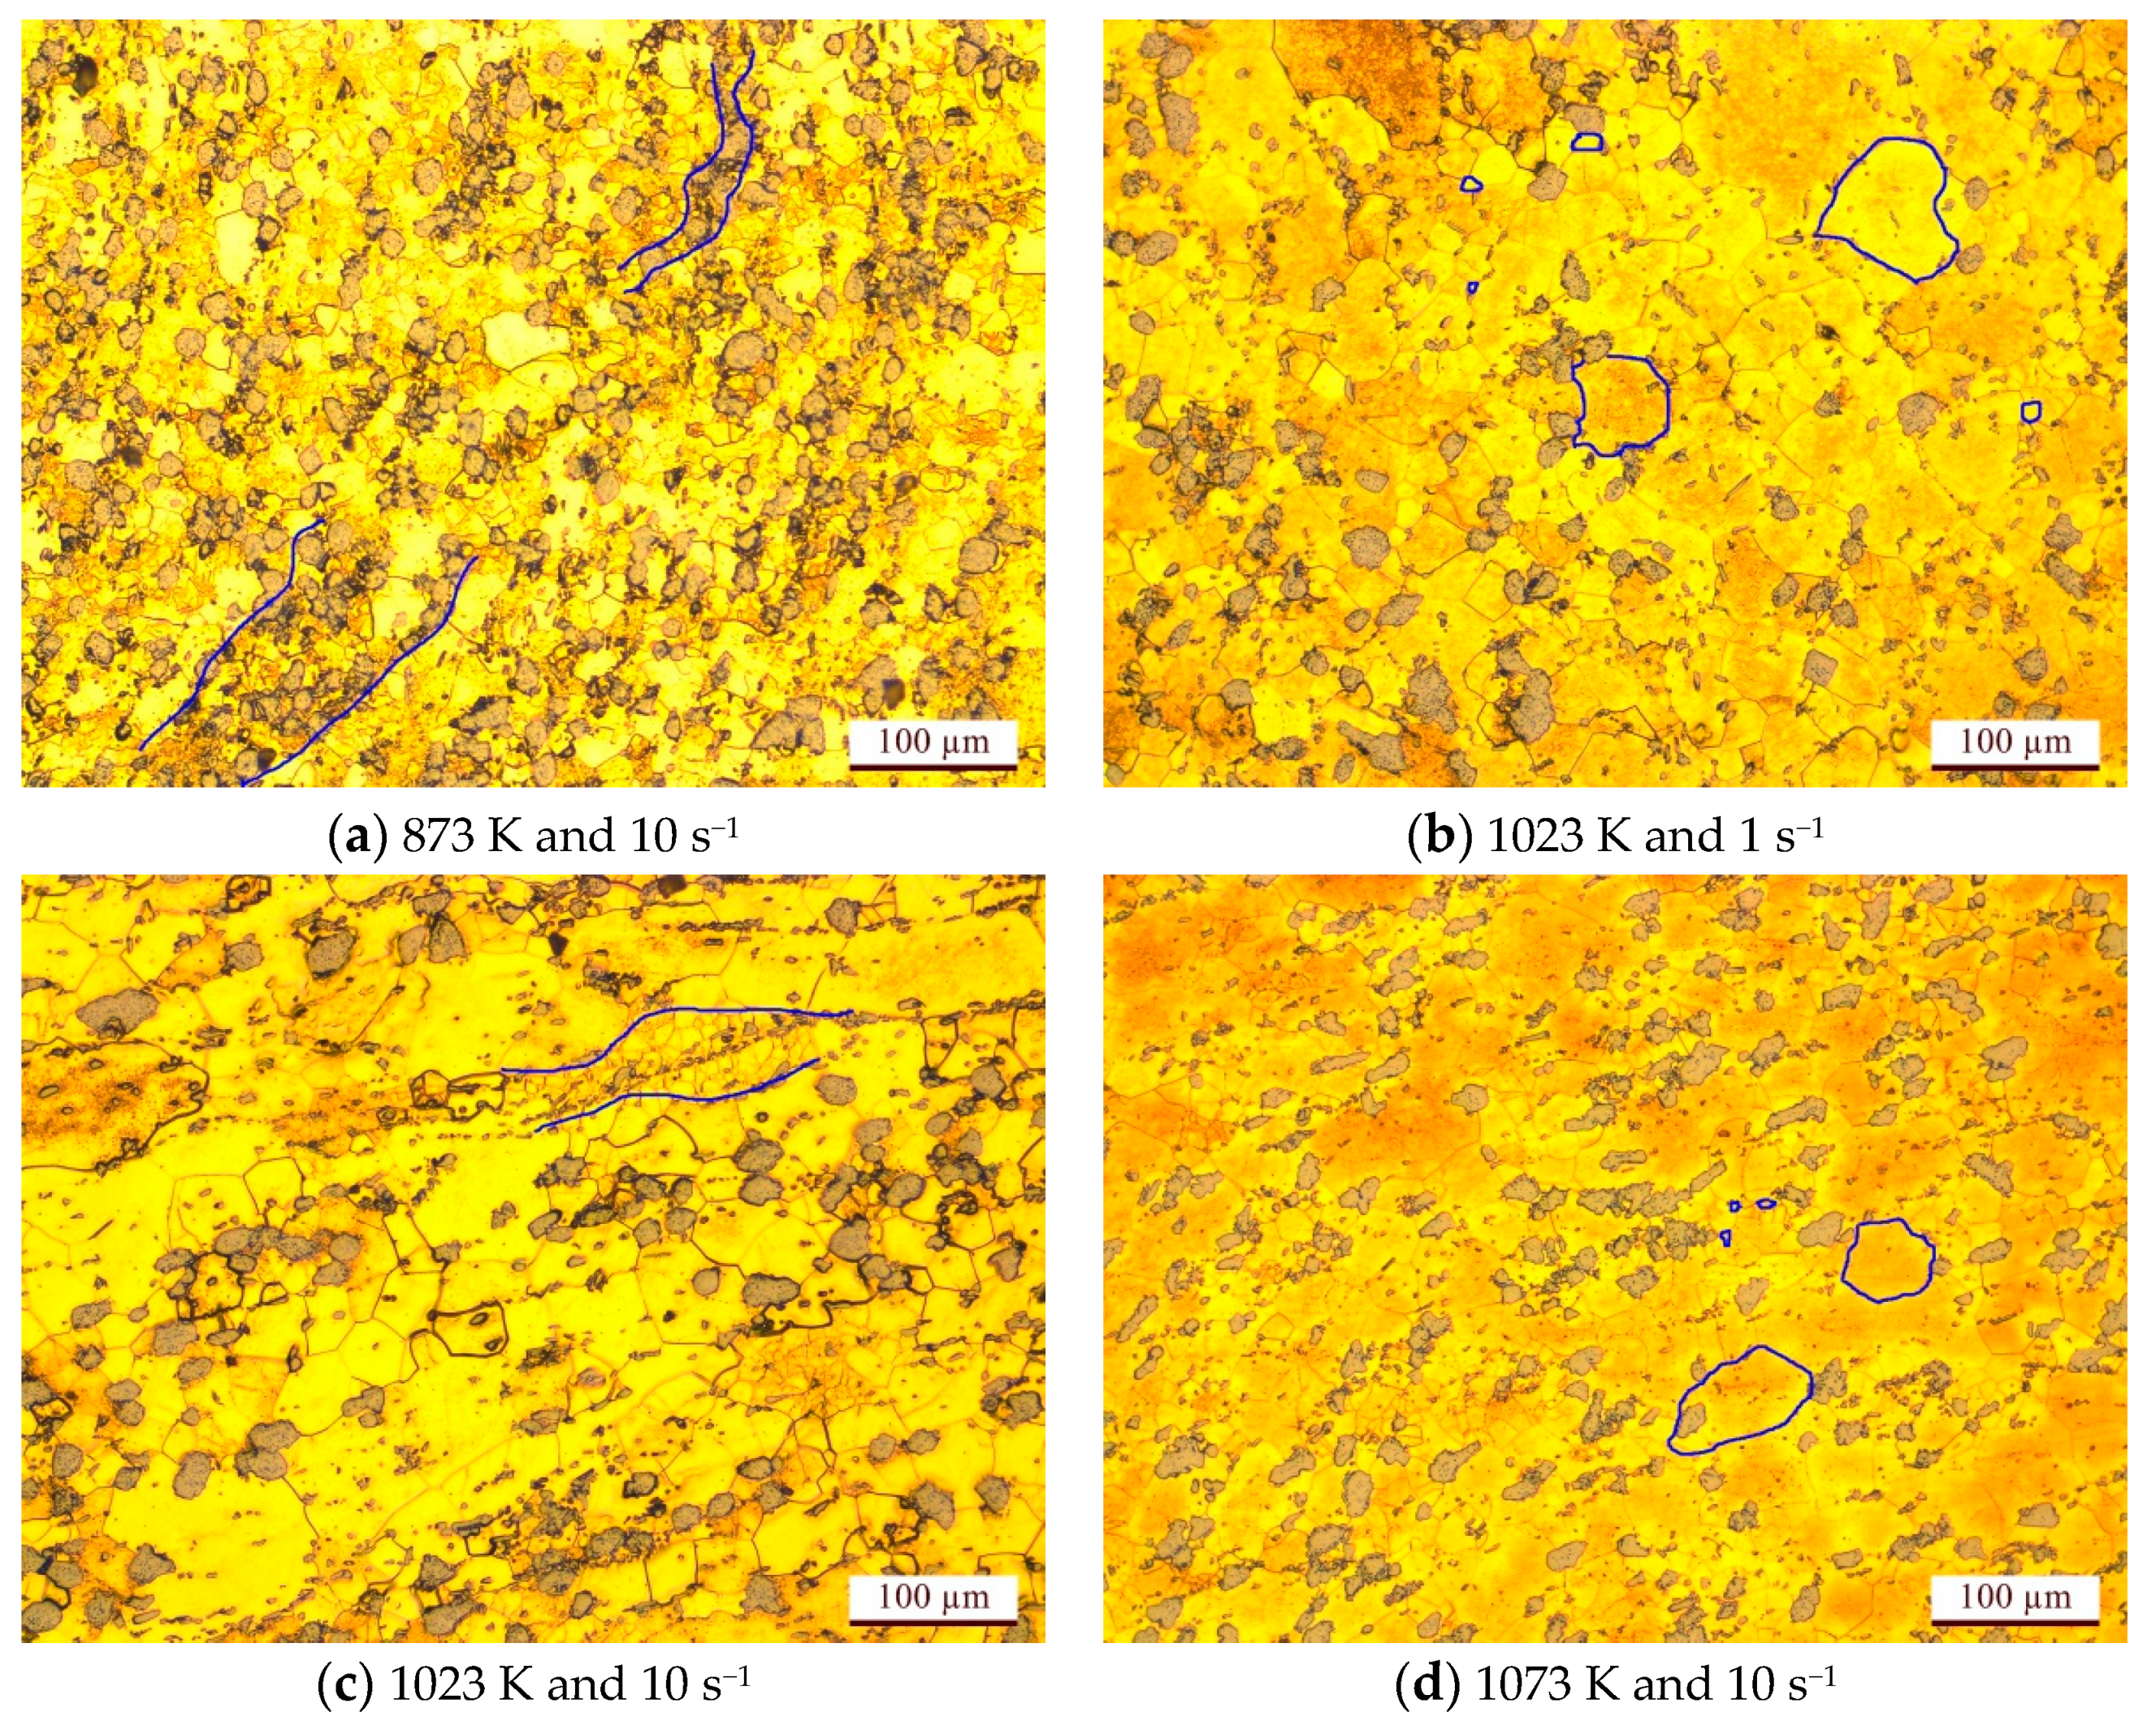
In Figure 12, the corresponding deformation conditions in the optical microstructure pictures are possibly unstable for deformation and some instability microdefects have appeared, such as mixed crystal and flow localization. Figure 12a,c,d shows the microstructure at the strain rate of 10 s−1 and different deformation temperatures. In Figure 12a, at the deformation temperature of 873 K, it is visible that flow localization has occurred with a power dissipation coefficient η of 0.19, and hard particles have assembled due to deformation. In Figure 12c,d, with increasing temperature, the microstructure changes a lot, the grains grow with heating, the corresponding power dissipation η is 0.19 and 0.13, respectively, and higher strain rates lead to flow localization due to the short deformation time. In Figure 11b, mixed crystal appears because of the high temperature and high strain rate. It can be concluded that, at the conditions of low m-value (<0.16) and low η-value (<0.24), the risk of the occurrence of micro deformation defects is high and these two values can be employed as a criterion for choosing proper working technique parameters.

4. Conclusions

A series of compression tests were conducted on a Gleeble-3500 isothermal simulator, and true stress–true strain curves were obtained at temperatures ranging from 873–1073 K and strain rates of 0.01, 0.1, 1, and 10 s−1. The conclusions of this paper are as follows:
(1) The true stress of the Cu-Ni-Al brass alloy increases with decreasing deformation temperature and increasing strain rate.
(2) The Arrhenius constitutive model of Cu-Ni-Al brass considering compensation for strain has been established based on experimental data; the material constants α, n, Q and lnA in the constitutive equation are functions of strain. In addition, the predictive evaluation index AARE is 6.35%, and this can be used to describe the flow behavior of Cu-Ni-Al brass effectively.
(3) Processing maps were constructed to identify which deformation conditions are safe for deformation. The results show that the safe region for deformation at the strain rate of 0.9 is deformation temperatures of 873–1073K with strain of 0.01–0.85 s−1, and deformation temperatures of 955–983 K with strain of 0.85–10 s−1.
(4) The microstructure observations show that the main softening mechanisms are dynamic recovery and dynamic recrystallization. The phenomenon of dynamic recrystallization with newly refined grains occurs when the deformation temperature is higher than 973 K. Finally, the main instability microdefects are mixed crystals and flow localization, which should be avoided in physical production.

Author Contributions

Data collection and model construction, Q.L. and X.L.; funding acquisition, Q.L., X.Z. and P.L.; writing—original draft, X.L. and Q.L.; writing—review and editing, Q.L., X.L., X.Z., and P.L. All authors have read and agreed to the published version of the manuscript.

Funding

This work was funded by the Chongqing Basic Science and Advanced Technology Research Program (grant number cstc2017jcyjAX0175), Chongqing Municipal Education Commission Foundation (grant numbers KJQN201900836, KJZD-M201900802 and KJZD-K201800801), and Chongqing Technology and Business University (grant number 1752009).

Acknowledgments

The authors sincerely appreciate the support of material used for experiments from the Luzhou LongRiver Mechanical Company Ltd., Luzhou, China.

Conflicts of Interest

The authors declare no conflict of interest.

Nomenclature

Symbol/AcronymFull NameSymbol/AcronymFull Name
OMOptical microscope σ Flow stress (MPa)
DMMDynamic material model ε ˙ Strain rate (s−1)
βBrass beta-phase (bcc) ε True strain
RGas constant
(8.314 J.mol-1.K-1)
A, A1, A2, n, n1, α, β, SMaterial constants
TDeformation temperature (K)QDeformation activation energy (KJ·mol−1)
PPower dissipationGHeat generation
JMicrostructural changes ξ ( ε ˙ ) Instability parameter
mStrain rate sensitivity indexηPower dissipation index

References

  1. Mindivan, H.; Çimenoǧlu, H.; Kayali, E.S. Microstructures and wear properties of brass synchroniser rings. Wear 2003, 254, 532–537. [Google Scholar] [CrossRef]
  2. Shufeng, L.; Hisashi, I.; Katsuyoshi, K. Microstructure, Phase Transformation, Precipitation Behavior and Mechanical Properties of P/M Cu40Zn–1.0 wt.% Ti Brass Alloy via Spark Plasma Sintering and Hot Extrusion. J. Mater. Sci. Technol. 2013, 11, 16–22. [Google Scholar]
  3. Padmavardhani, D.; Prasad, Y.V.R.K. Characterization of hot deformation behavior of brasses using processing maps: Part II. β Brass and α-β brass. Metall. Trans. A 1991, 22, 2993–3001. [Google Scholar] [CrossRef]
  4. Padmavardhani, D.; Prasad, Y.V.R.K. Effect of zinc content on the processing map for hot working of α brass. Mater. Sci. Eng., A 1992, 157, 43–51. [Google Scholar] [CrossRef]
  5. Pernis, R.; Kasala, J.; Bořuta, J. High temperature plastic deformation of CuZn30 brass-Calculation of the activation energy. Kovove Mater. 2010, 48, 41–46. [Google Scholar] [CrossRef] [Green Version]
  6. Spigarelli, S.; Mehtedi, M.E.; Cabibbo, M.; Gabrielli, F.; Ciccarelli, D. High temperature processing of brass: Constitutive analysis of hot working of Cu–Zn alloys. Mater. Sci. Eng., A 2014, 615, 331–339. [Google Scholar] [CrossRef]
  7. Mosleh, A.; Mikhaylovskaya, A.; Kotov, A.; Kwame, J.; Aksenov, S. Superplasticity of Ti-6Al-4V Titanium Alloy: Microstructure Evolution and Constitutive Modelling. Materials 2019, 12, 1756. [Google Scholar] [CrossRef] [PubMed] [Green Version]
  8. Mosleh, A.; Mikhaylovskaya, A.; Kotov, A.; Pourcelot, T.; Aksenov, S.; Kwame, J.; Portnoy, V. Modelling of the Superplastic Deformation of the Near-α Titanium Alloy (Ti-2.5Al-1.8Mn) Using Arrhenius-Type Constitutive Model and Artificial Neural Network. Metals 2017, 7, 568. [Google Scholar] [CrossRef] [Green Version]
  9. Zhi, C.; Ma, L.; Jia, W.; Huo, X.; Fan, Q.; Huang, Z.; Le, Q.; Lin, J. Dependence of deformation behaviors on temperature for twin-roll casted AZ31 alloy by processing maps. J. Mater. Res. Technol. 2019, 8, 5217–5232. [Google Scholar] [CrossRef]
  10. Srinivasan, N.; Prasad, Y.V.R.K.; Rama Rao, P. Hot deformation behaviour of Mg–3Al alloy—A study using processing map. Mater. Sci. Eng., A 2008, 476, 146–156. [Google Scholar] [CrossRef]
  11. Ding, X.; Zhao, F.; Shuang, Y.; Ma, L.; Chu, Z.; Zhao, C. Characterization of hot deformation behavior of as-extruded AZ31 alloy through kinetic analysis and processing maps. J. Mater. Process. Technol. 2020, 276, 116325. [Google Scholar] [CrossRef]
  12. Cheng, W.; Bai, Y.; Ma, S.; Wang, L.; Wang, H.; Yu, H. Hot deformation behavior and workability characteristic of a fine-grained Mg‒8Sn‒2Zn‒2Al alloy with processing map. J. Mater. Sci. Technol. 2019, 35, 1198–1209. [Google Scholar] [CrossRef]
  13. Chen, X.; Liao, Q.; Niu, Y.; Jia, Y.; Le, Q.; Ning, S.; Hu, C.; Hu, K.; Yu, F. Comparison study of hot deformation behavior and processing map of AZ80 magnesium alloy casted with and without ultrasonic vibration. J. Alloys Compd. 2019, 803, 585–596. [Google Scholar] [CrossRef]
  14. Guo, Y.; Xuanyuan, Y.; Lia, C.; Sen, Y. Characterization of Hot Deformation Behavior and Processing Maps of Mg-3Sn-2Al-1Zn-5Li Magnesium Alloy. Metals 2019, 9, 1262. [Google Scholar] [CrossRef] [Green Version]
  15. Liu, Y.; Geng, C.; Lin, Q.; Xiao, Y.; Xu, J.; Kang, W. Study on hot deformation behavior and intrinsic workability of 6063 aluminum alloys using 3D processing map. J. Alloys Compd. 2017, 713, 212–221. [Google Scholar] [CrossRef]
  16. Wang, H.; Wang, C.; Mo, Y.; Wang, H.; Xu, J. Hot deformation and processing maps of Al–Zn–Mg–Cu alloy under coupling-stirring casting. J. Mater. Res. Technol. 2019, 8, 1224–1234. [Google Scholar] [CrossRef]
  17. Lin, X.; Dong, F.; Zhang, Y.; Yuan, X.; Huang, H.; Zheng, B.; Wang, L.; Wang, X.; Luo, L.; Su, Y.; et al. Hot-deformation behaviour and hot-processing map of melt-hydrogenated Ti6Al4V/(TiB + TiC). Int. J. Hydrogen Energy 2019, 44, 8641–8649. [Google Scholar] [CrossRef]
  18. Liu, Q.; Hui, S.; Tong, K.; Yu, Y.; Ye, W.; Song, S.-Y. Investigation of high temperature behavior and processing map of Ti-6Al-4V-0.11Ru titanium alloy. J. Alloys Compd. 2019, 787, 527–536. [Google Scholar] [CrossRef]
  19. Long, S.; Xia, Y.-F.; Wang, P.; Zhou, Y.-T.; Gong-ye, F.-J.; Zhou, J.; Zhang, J.-S.; Cui, M.-L. Constitutive modelling, dynamic globularization behavior and processing map for Ti-6Cr-5Mo-5V-4Al alloy during hot deformation. J. Alloys Compd. 2019, 796, 65–76. [Google Scholar] [CrossRef]
  20. Ma, L.; Wan, M.; Li, W.; Shao, J.; Bai, X. Constitutive modeling and processing map for hot deformation of Ti–15Mo–3Al-2.7Nb-0.2Si. J. Alloys Compd. 2019, 808, 151759. [Google Scholar] [CrossRef]
  21. Wu, F.; Xu, W.; Jin, X.; Zhong, X.; Wan, X.; Shan, D.; Guo, B. Study on Hot Deformation Behavior and Microstructure Evolution of Ti55 High-Temperature Titanium Alloy. Metals 2017, 7, 319. [Google Scholar]
  22. Srinivasa, N.; Prasad, Y.V.R.K. Hot working characteristics of nimonic 75, 80A and 90 superalloys: A comparison using processing maps. J. Mater. Process. Technol. 1995, 51, 171–192. [Google Scholar] [CrossRef]
  23. Wu, Y.; Liu, Y.; Li, C.; Xia, X.; Huang, Y.; Li, H.; Wang, H. Deformation behavior and processing maps of Ni3Al-based superalloy during isothermal hot compression. J. Alloys Compd. 2017, 712, 687–695. [Google Scholar] [CrossRef]
  24. Zhang, B.; Liu, X.; Yang, H.; Ning, Y. The Deformation Behavior, Microstructural Mechanism, and Process Optimization of PM/Wrought Dual Superalloys for Manufacturing the Dual-Property Turbine Disc. Metals 2019, 9, 1127. [Google Scholar] [CrossRef] [Green Version]
  25. Cai, Z.; Ji, H.; Pei, W.; Tang, X.; Huang, X.; Liu, J. Hot workability, constitutive model and processing map of 3Cr23Ni8Mn3N heat resistant steel. Vacuum 2019, 165, 324–336. [Google Scholar] [CrossRef]
  26. Li, N.; Zhao, C.; Jiang, Z.; Zhang, H. Flow behavior and processing maps of high-strength low-alloy steel during hot compression. Mater. Charact. 2019, 153, 224–233. [Google Scholar] [CrossRef]
  27. Łukaszek-Sołek, A.; Krawczyk, J.; Śleboda, T.; Grelowski, J. Optimization of the hot forging parameters for 4340 steel by processing maps. J.Mater. Res. Technol. 2019, 8, 3281–3290. [Google Scholar] [CrossRef]
  28. Fu, X.-Y.; Bai, P.-C.; Yang, J.-C. Hot Deformation Characteristics of 18Cr-5Ni-4Cu-N Stainless Steel Using Constitutive Equation and Processing Map. Metals 2020, 10, 82. [Google Scholar] [CrossRef] [Green Version]
  29. Jeong, H.T.; Park, H.K.; Park, K.; Na, T.W.; Kim, W.J. High-temperature deformation mechanisms and processing maps of equiatomic CoCrFeMnNi high-entropy alloy. Mater. Sci. Eng. A 2019, 756, 528–537. [Google Scholar] [CrossRef]
  30. Kim, W.J.; Jeong, H.T.; Park, H.K.; Park, K.; Na, T.W.; Choi, E. The effect of Al to high-temperature deformation mechanisms and processing maps of Al0.5CoCrFeMnNi high entropy alloy. J. Alloys Compd. 2019, 802, 152–165. [Google Scholar] [CrossRef]
  31. Zhang, Y.; Liu, P.; Tian, B.; Liu, Y.; Li, R.; Xu, Q. Hot deformation behavior and processing map of Cu-Ni-Si-P alloy. Trans. Nonferrous Met. Soc. China 2013, 23, 2341–2347. [Google Scholar] [CrossRef]
  32. Lin, Y.C.; Nong, F.-Q.; Chen, X.-M.; Chen, D.-D.; Chen, M.-S. Microstructural evolution and constitutive models to predict hot deformation behaviors of a nickel-based superalloy. Vacuum 2017, 137, 104–114. [Google Scholar] [CrossRef]
  33. Quan, G.; Tong, Y.; Luo, G.; Zhou, J. A characterization for the flow behavior of 42CrMo steel. Comput. Mater. Sci. 2010, 50, 167–171. [Google Scholar] [CrossRef]
  34. Zener, C.; Hollomon, J.H. Effect of Strain Rate Upon Plastic Flow of Steel. J. Appl. Phys. 1944, 15, 22–32. [Google Scholar] [CrossRef]
  35. Lin, Y.C.; Chen, M.-S.; Zhang, J. Modeling of flow stress of 42CrMo steel under hot compression. Mater. Sci. Eng. A 2009, 499, 88–92. [Google Scholar] [CrossRef]
  36. Lin, Y.C.; Xia, Y.-C.; Chen, X.-M.; Chen, M.-S. Constitutive descriptions for hot compressed 2124-T851 aluminum alloy over a wide range of temperature and strain rate. Comput. Mater. Sci. 2010, 50, 227–233. [Google Scholar] [CrossRef]
  37. Prasad, Y.V.R.K.; Gegel, H.L.; Doraivelu, S.M.; Malas, J.C.; Morgan, J.T.; Lark, K.A.; Barker, D.R. Modeling of dynamic material behavior in hot deformation: Forging of Ti-6242. Metall. Trans. A 1984, 15, 1883–1892. [Google Scholar] [CrossRef]
  38. Prasad, Y.V.R.K.; Rao, K.P. Processing maps and rate controlling mechanisms of hot deformation of electrolytic tough pitch copper in the temperature range 300–950 °C. Mater. Sci. Eng. A 2005, 391, 141–150. [Google Scholar] [CrossRef]
  39. Murty, S.V.S.N.; Rao, B.N. On the development of instability criteria during hotworking with reference to IN 718. Mater. Sci. Eng. A 1998, 254, 76–82. [Google Scholar] [CrossRef]
  40. Long, S.; Xia, Y.-F.; Hu, J.-C.; Zhang, J.-S.; Zhou, J.; Zhang, P.; Cui, M.-L. Hot deformation behavior and microstructure evolution of Ti-6Cr-5Mo-5V-4Al alloy during hot compression. Vacuum 2019, 160, 171–180. [Google Scholar] [CrossRef]
Figure 1. (a) Cu-Ni-Al nickel brass cylinders. (b) The microstructure of Cu-Ni-Al nickel brass before hot compression tests.
Metals 10 00782 g001
Figure 2. True stress–strain curves of Cu-Ni-Al brass alloy under different strain rates, (a) 0.01 s−1, (b) 0.1 s−1, (c) 1 s−1, (d) 10 s−1.
Metals 10 00782 g002
Figure 3. The relationship plots between (a) ln ε ˙ ln σ p , (b) ln ε ˙ σ p , (c) ln [ sinh ( α σ p ) ] ln ε ˙ , (d) ln [ sinh ( α σ p ) ] 1000 T 1 .
Metals 10 00782 g003aMetals 10 00782 g003b
Figure 4. Eighth-order polynomial regression results between true strain and (a) α, (b) n, (c) Q, (d) lnA.
Metals 10 00782 g004
Figure 5. Comparison of experimental (black line) and predicted (dots) values under strain rates of (a) 0.01 s−1, (b) 0.1 s−1, (c) 1 s−1, (d) 10 s−1.
Metals 10 00782 g005
Figure 6. The relation between true stress and strain rate using ln scale, (a) ε = 0.3, (b) ε = 0.6, (c) ε = 0.9.
Metals 10 00782 g006
Figure 7. The 3D change maps of strain rate sensitivities at various strain levels: (a) strain at 0.3, (b) strain at 0.6, (c) strain at 0.9.
Metals 10 00782 g007aMetals 10 00782 g007b
Figure 8. The contour maps of power dissipation η at various strain levels: (a) strain at 0.3, (b) strain at 0.6, (c) strain at 0.9.
Metals 10 00782 g008aMetals 10 00782 g008b
Figure 9. The contour maps of the instability region at various strain levels: (a) strain at 0.3, (b) strain at 0.6, (c) strain at 0.9.
Metals 10 00782 g009
Figure 10. The processing maps consisting of strain rate sensitivity, power dissipation coefficient, and instability region (a) strain at 0.3, (b) strain at 0.6, (c) strain at 0.9.
Metals 10 00782 g010
Figure 11. OM images of Cu-Ni-Al brass at safe region after deformation. Abbreviations: OM, optical microscope.
Metals 10 00782 g011
Figure 12. OM images of Cu-Ni-Al brass in the instability region after deformation.
Metals 10 00782 g012
Table 1. Chemical composition of Cu-Ni-Al nickel brass alloy (mass fraction, %)
ElementsCuNiAlSiFeZn
Mass fraction (wt.%)54~566~7.33~4.32~2.50.5~1Rest
Table 2. The coefficients of the eighth-order polynomial functions.
αValuenValueQValuelnAValue
B00.03728C02.92090D0123.98543E013.94705
B10.07507C11.20573D1669.68819E175.97630
B2−1.48702C2−29.70380D2−9346.20325E2−1031.15598
B311.32611C3253.75623D362,537.37801E36797.12177
B4−43.91601C4−1012.34798D4−224,395.85636E4−24,157.72629
B595.56359C52187.15643D5459,440.69083E549,073.23415
B6−118.39965C6−2644.25515D6−539,568.91491E6−57,213.34877
B778.04056C71687.53405D7338,812.43677E735,676.65667
B8−21.24861C8−443.12339D8−88,246.43448E8−9230.40473