Article

SteBLife, a New Approach for the Accelerated Generation of Metallic Materials’ Fatigue Data

1
Department of Materials Science and Materials Testing (WWHK), University of Applied Sciences Kaiserslautern, Schoenstraße 11, D-67659 Kaiserslautern, Germany
2
Chair of Nondestructive Testing and Quality Assurance (LZfPQ), Saarland University, Am Markt 4., D-66125 Saarbrücken, Germany
3
Department of Materials Test Engineering (WPT), TU Dortmund University, Baroper Str. 303, D-44227 Dortmund, Germany
*
Author to whom correspondence should be addressed.
Metals 2020, 10(6), 798; https://doi.org/10.3390/met10060798
Submission received: 27 May 2020 / Revised: 9 June 2020 / Accepted: 10 June 2020 / Published: 16 June 2020
(This article belongs to the Special Issue Fatigue Life Calculation Approaches for Metallic Materials)

Abstract

:
The service life of materials and components exposed to repeated mechanical loads is limited, which is why the understanding of the damage evolution and estimating its fatigue life is of high importance for its technical application. This paper shows how temperature and magnetic field measurement methods can be used to describe the cyclic deformation behaviour of metallic materials and to derive parameters from this, which are used in short-term methods to calculate the fatigue life. Within the SteBLife (stepped-bar fatigue life) approach, only three to five fatigue tests with a stepped fatigue specimen are required to determine a complete S–N or Woehler curve with scatter bands for different failure probabilities. If only a trend S–N curve is required, the number of tests can be reduced to a single fatigue test only. In the framework of this paper, these approaches will be presented for normalised SAE 1045 (C45E) and quenched and tempered SAE 4140 (42CrMo4) steels.

1. Introduction

In most cases, component failure occurs due to a combination of static, quasistatic, dynamic and impact loads (forces, moments, temperature, etc.), which cause increasing stresses as well as strains, resulting in micro-, and in the following, macrocracks and, finally, in failure. Since fatigue can be a subject of large scatter, engineering is striving for enhancement in the precision of fatigue life estimation to the utmost possible [1,2,3,4]. The high effort for generating fatigue data of real engineering structures has led to a large number of simplifications in the past, such as using tensile strength, hardness or impact energy to characterise fatigue in lack of any better means. These approaches are still applied in some specific fields even today, leading to high safety factors and consequently high component weights and costs. In order to be able to reduce these safety factors, more appropriate means to generate fatigue data are required, such as considering fatigue-induced microstructural changes into the component design.
Only since the mid-1990s, the use of fatigue data for the design of cyclic or service loaded components became popular [1,5,6]. The specimen or component lifetime depends on fatigue-life-influencing parameters, such as load, material, manufacturing, structural geometry as well as ambient conditions, acting individually or in a combination. Therefore, it is of prime importance to determine these data quickly and cost-effective with respect to a component’s individual loading condition. Pawliczek and Rozumek, presented in [7] an algorithm for calculating the fatigue life of specimens taking into account the effect of the mean load, their model is based on a cycle asymmetry sensitivity factor, and can be used for tension and for torsion. The proposed model allows determining the equivalent stress amplitude in a symmetrical cycle (R = −1) for the given amplitude values and the average stress value of the asymmetrical cycle (R, −1).
Damage normally occurs in the areas of highest stress concentrations, so-called hotspots, so these areas are of main interest for the design process as well as for the selection of structural material. Structural durability related design requires defined criteria such as a service life goal, reliability and functional capability as well as operational safety for the use until reaching the specified lifetime for a required calculated probability of failure [1,2,5]. The fatigue behaviour is described in the case of constant amplitude loading by S–N curves and under variable amplitude loading by the fatigue life or Gassner curves. The position of a Gassner curve relative to the S–N curve depends on the load spectrum applied [1,8].
The fatigue life of a service loaded component can be predicted from the classical point of view by using a Palmgren-Miner damage accumulation rule [9,10]. Here, each of the cycles is assigned to partial damage summed up to the total damage amount indicating a possible failure when reaching a certain damage threshold value. Depending on how the damage parameter considered for accumulation develops over the fatigue life, it is classified as linear or not. However, this hypothesis, as well as various of its modifications which have gained practical relevance, still depend strongly on loads and their related levels, which cannot be found to be the only representative parameter with regard to damage [11,12,13].
A first step in enhancing such an understanding was achieved with the introduction of the so-called local strain approach [14,15]. This approach is based on the idea that a structural component’s material behaviour in a notch can be transferred onto a simple unnotched specimen of the same material. The main advantage of this approach is that only the material’s fatigue life curve has to be determined experimentally while the S-N curves of the different structural components can be determined on an analytic and numeric basis [14]. A further advantage of the local strain approach is that the stress-strain behaviour in a notch root can be expressed and hence understood from the stress-strain hysteresis loops generated through the transformation process using rules established by Neuber [11] and others [14,15]. This at least allows the influence of plastic strains occurring in a notch root to be understood and better appreciated, which are considered to be a much more relevant fatigue accumulation parameter than stresses. Plotting the evolution of the plastic strain amplitude as a function of the number of load cycles applied to a material or a component as a first indicator of a parameter accumulating on a nonlinear basis is, therefore, made available [16].
S–N curves expressed as a function of the stress amplitude versus the number of cycles to failure in a logarithmic or double logarithmic scale are a fact in structural design that is hard to remove nowadays. The S–N curve for stress-controlled fatigue tests is usually described through the Basquin [17] relationship. For strain-controlled fatigue tests, the Manson-Coffin [18] relationship can be used to describe the low cycle fatigue (LCF) range, whereas, for total strain-controlled fatigue tests in the high cycle fatigue (HCF) range, the elastic strain portion (εa,e) provided through Basquin and the plastic strain portion (εa,p) from Manson-Coffin are summed up as it is shown in Figure 1.
The failure criterion for those S–N curves, such as fracture, technical crack or reduction in stiffness, has to be defined with respect to the application. The relevant parameters characterising the S–N curve are based on the material, the stress concentration factor, the stress ratio, the load-time function, the environmental condition and the medium. The shape and position of the S–N curve also depend on the microstructure and possibly also on the prior history of the material in the case of ageing.
Depending on the material and manufacturing processes, S–N curves have to be determined with respect to the probability of failure. Especially in the LCF and HCF regime, scatter bands with defined failure probabilities are added into the logarithmic scale by the same slope and the exponent of the mathematical description according to Basquin [17]. Designing a component based on an S–N curve with a failure probability of 50% is critical from a safety point of view if no scatter bands can be provided. Therefore, it is necessary to define a calculated failure probability according to the individual potential risk depending on the application field and the potential of danger for life and system integrity [3,8]. The ASTM E 739 [19] gives useful technical criteria to conduct the statistical analysis of fatigue data, showing, for example, how to calculate confidence intervals for the parameters or for the entire median S–N curve.
Generating fatigue life curves of a material still requires a significant effort and may require performing around 15 to 25 experiments if the curve determined should be considered sufficiently proven, but this is only valid for homogeneous materials and material conditions. In the case of inhomogeneous materials, e.g., casted materials, 40 to 50 and even more specimens need to be tested for statistically verified information regarding the fatigue life [20,21].
In the 1980s, materials data for cyclic loading were collected and compiled in a database in a first approach, which was made available to the engineering designer [20]. In recent years, a couple of different short-time evaluation procedures (STEP) were developed in order to reduce the efforts in experimentation and financial costs for providing fatigue data. Examples for a useful application of STEPs include but are not limited to offshore facilities, bridges or buildings and towers as well as heavy machinery, transportation vehicles, energy generators.
All structural designs today are based on the weakest link model such that the lowest criterion of a design parameter has to be chosen [22]. This criterion is applied for any other component made of the same material although the fatigue lives for each of those different components will vary as a result of the difference in the materials’ parameter scatter. It is, therefore, the aim of research to develop methods determining the scattering behaviour of a material for each individual component and which can be applied with justifiable effort and costs. If this is successfully implemented, predictions about the remaining fatigue life of components can be made with considerably higher accuracy. In this study, the new fatigue life calculation method SteBLife (stepped-bar fatigue life) using temperature and magnetic-based measurements as input variables are presented.

2. Materials and Methods

2.1. Materials

Fatigue tests were carried out on AISI/SAE 1045 (1.1191, C45E) and AISI/SAE 4140 (1.7225, 42CrMo4) steel specimens, the materials in the delivered condition had the following characteristics.
  • SAE 1045 (C45E) Steel
The chemical composition of the normalised SAE 1045 steel in accordance with DIN EN 10083-1 is shown in Table 1.
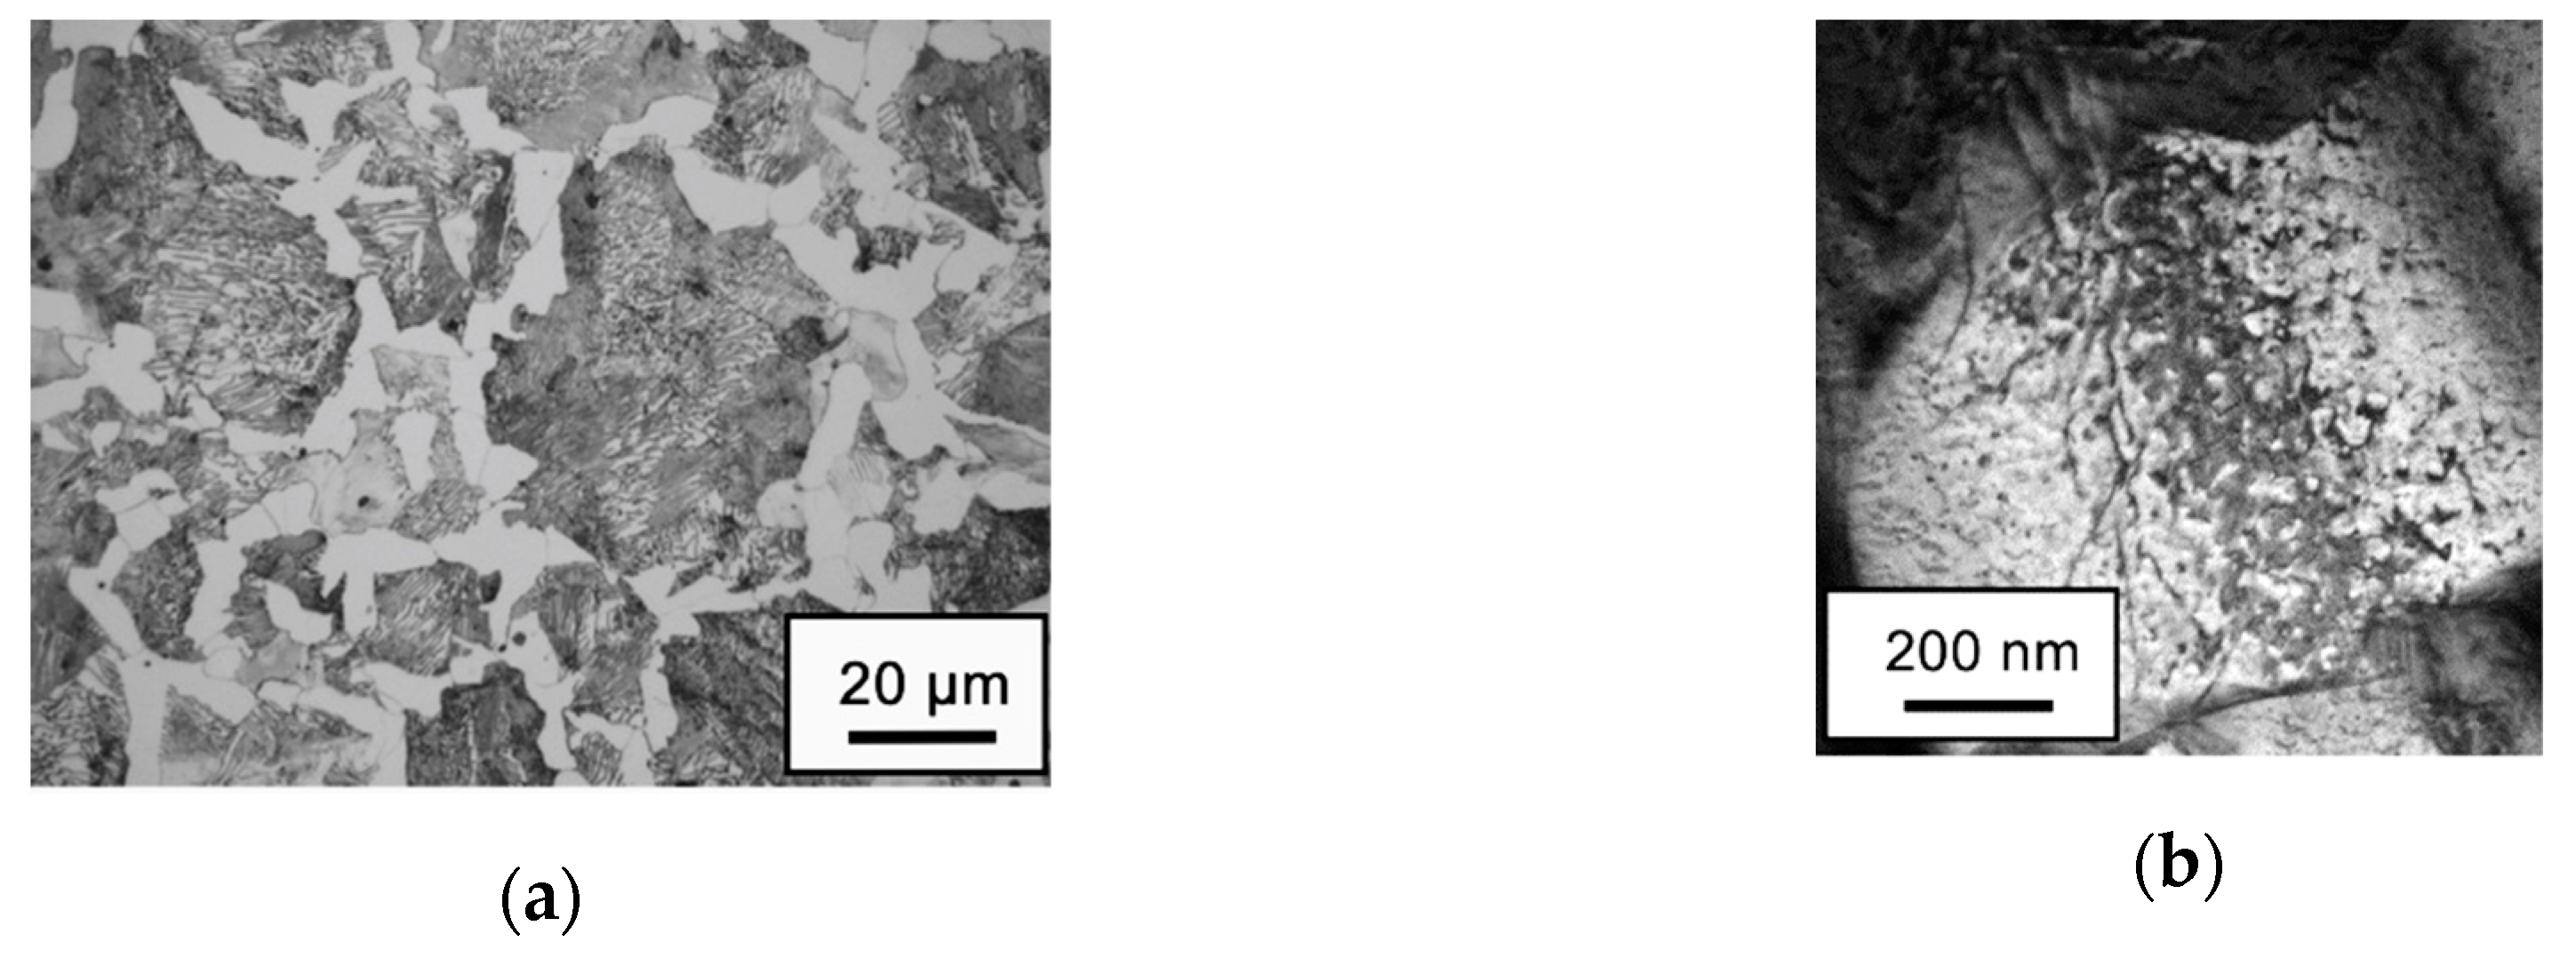
The material was delivered as round bars with a diameter of 20 mm and a scaly surface due to the heat treatment. The heat treatment by the manufacturer consists of austenitising at 850 °C, followed by a controlled slow cooling process to ambient temperature to receive a mostly ferritic-pearlitic microstructure with an average grain size of 16.3 µm (according to DIN EN ISO 643:2012), which is shown in a light micrograph in Figure 2a.
Within transmission electron microscopy investigations in Figure 2b, the dislocation density in the unloaded original state was evaluated to ρ = 1.2 × 109 cm−2, which is a typical value for this material condition [23].
The SAE 1045 steel in the normalisation condition has a Vickers hardness HV10 of 218, a 56 Jm cm−2 KCU (impact energy for Charpy U-notched specimens) and a mostly ductile behaviour under (quasi)static and cyclic loading. The material’s properties are summarised in Table 2, comparing [24,25,26,27].
  • SAE 4140 (42CrMo4) Steel
The investigated quenched and tempered SAE 4140 (42CrMo4) steel is in accordance with DIN EN 10083-3 and its chemical composition is given in Table 3.
The material was delivered as round bars with a diameter of 20 mm. The heat treatment by the manufacturer consists of an austenitisation process at 850 °C, followed by quenching in oil and thereafter tempering at 550 °C for 60 min resulting in a characteristic tempered martensitic microstructure with finely dispersed carbides located at the grain boundaries and inside the former austenite grains [28,29]. The microstructure of the low-alloyed steel in the quenched and tempered condition is shown in Figure 3a–c as light, scanning and transmission electron micrograph, respectively). The TEM image in Figure 3c shows the dislocation and carbide structure of the undeformed quenched and tempered material state with rod-shaped or lenticular carbides, which are in shape and size typical for the heat treatment condition of SAE 4140 steel.
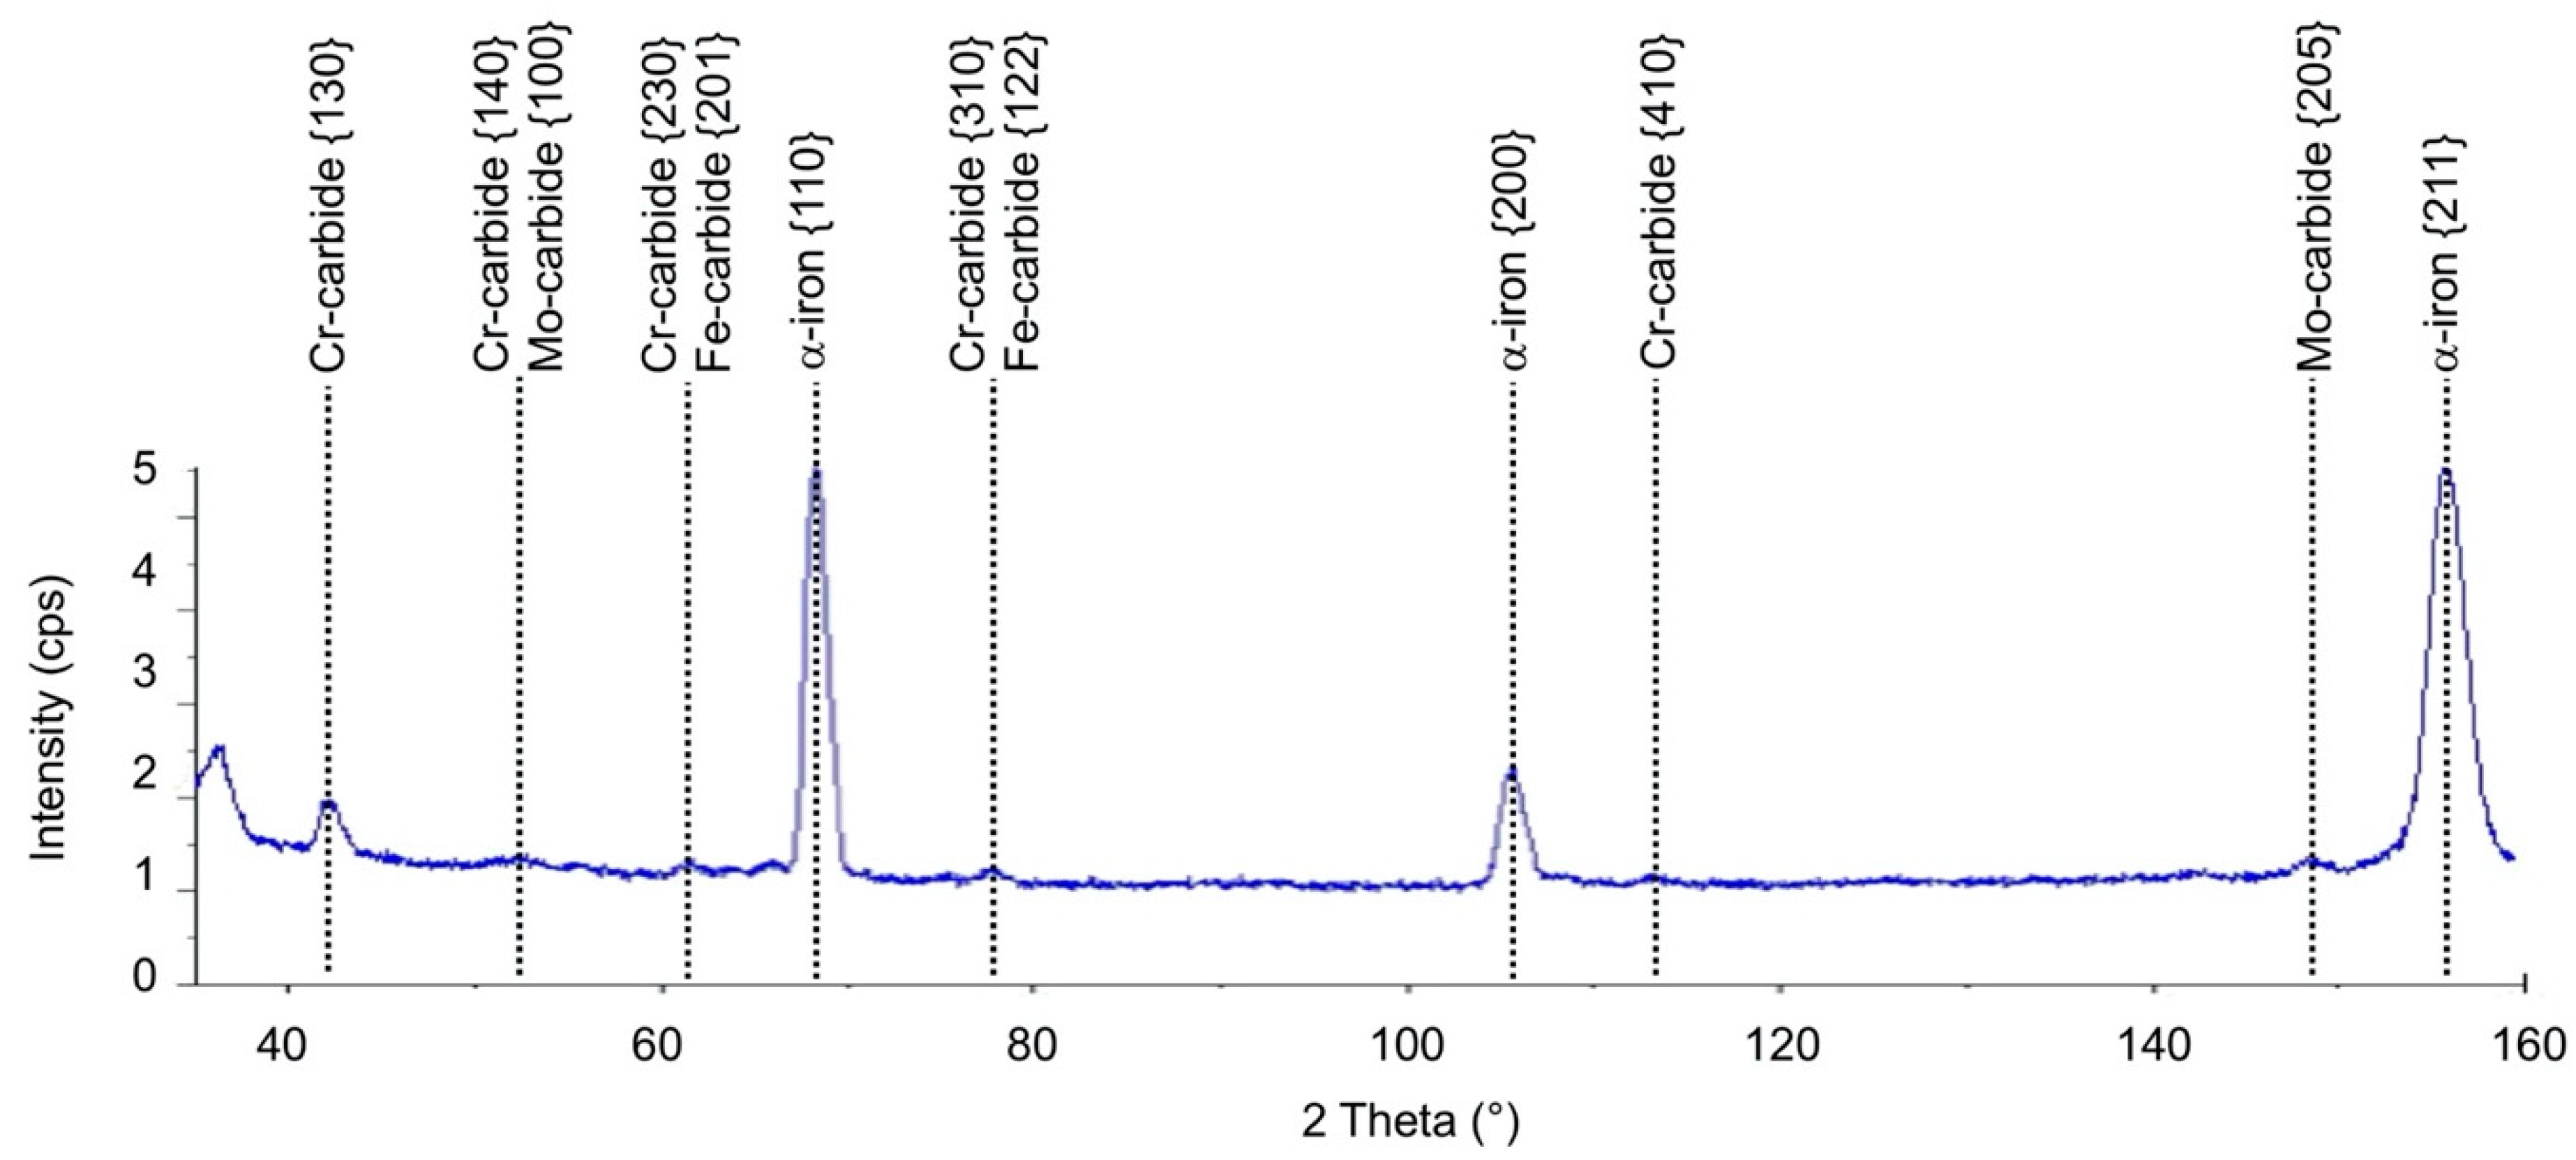
From phase analysis by using X-ray (Figure 4), interference lines for Fe-, Cr- and Mo-carbides were observed, which are typical for that material grade in the present heat treatment condition [29].
Mechanical properties derived from tensile and hardness tests for the SAE 4140 steel investigated can be seen in Table 4. The steel in a quenched and tempered condition shows a Vickers Hardness HV10 of 345 and relatively low ductile behaviour indicated by the values of the elongation at break A and reduction in area Z.

2.2. Fatigue Life Calculation Method SteBLife

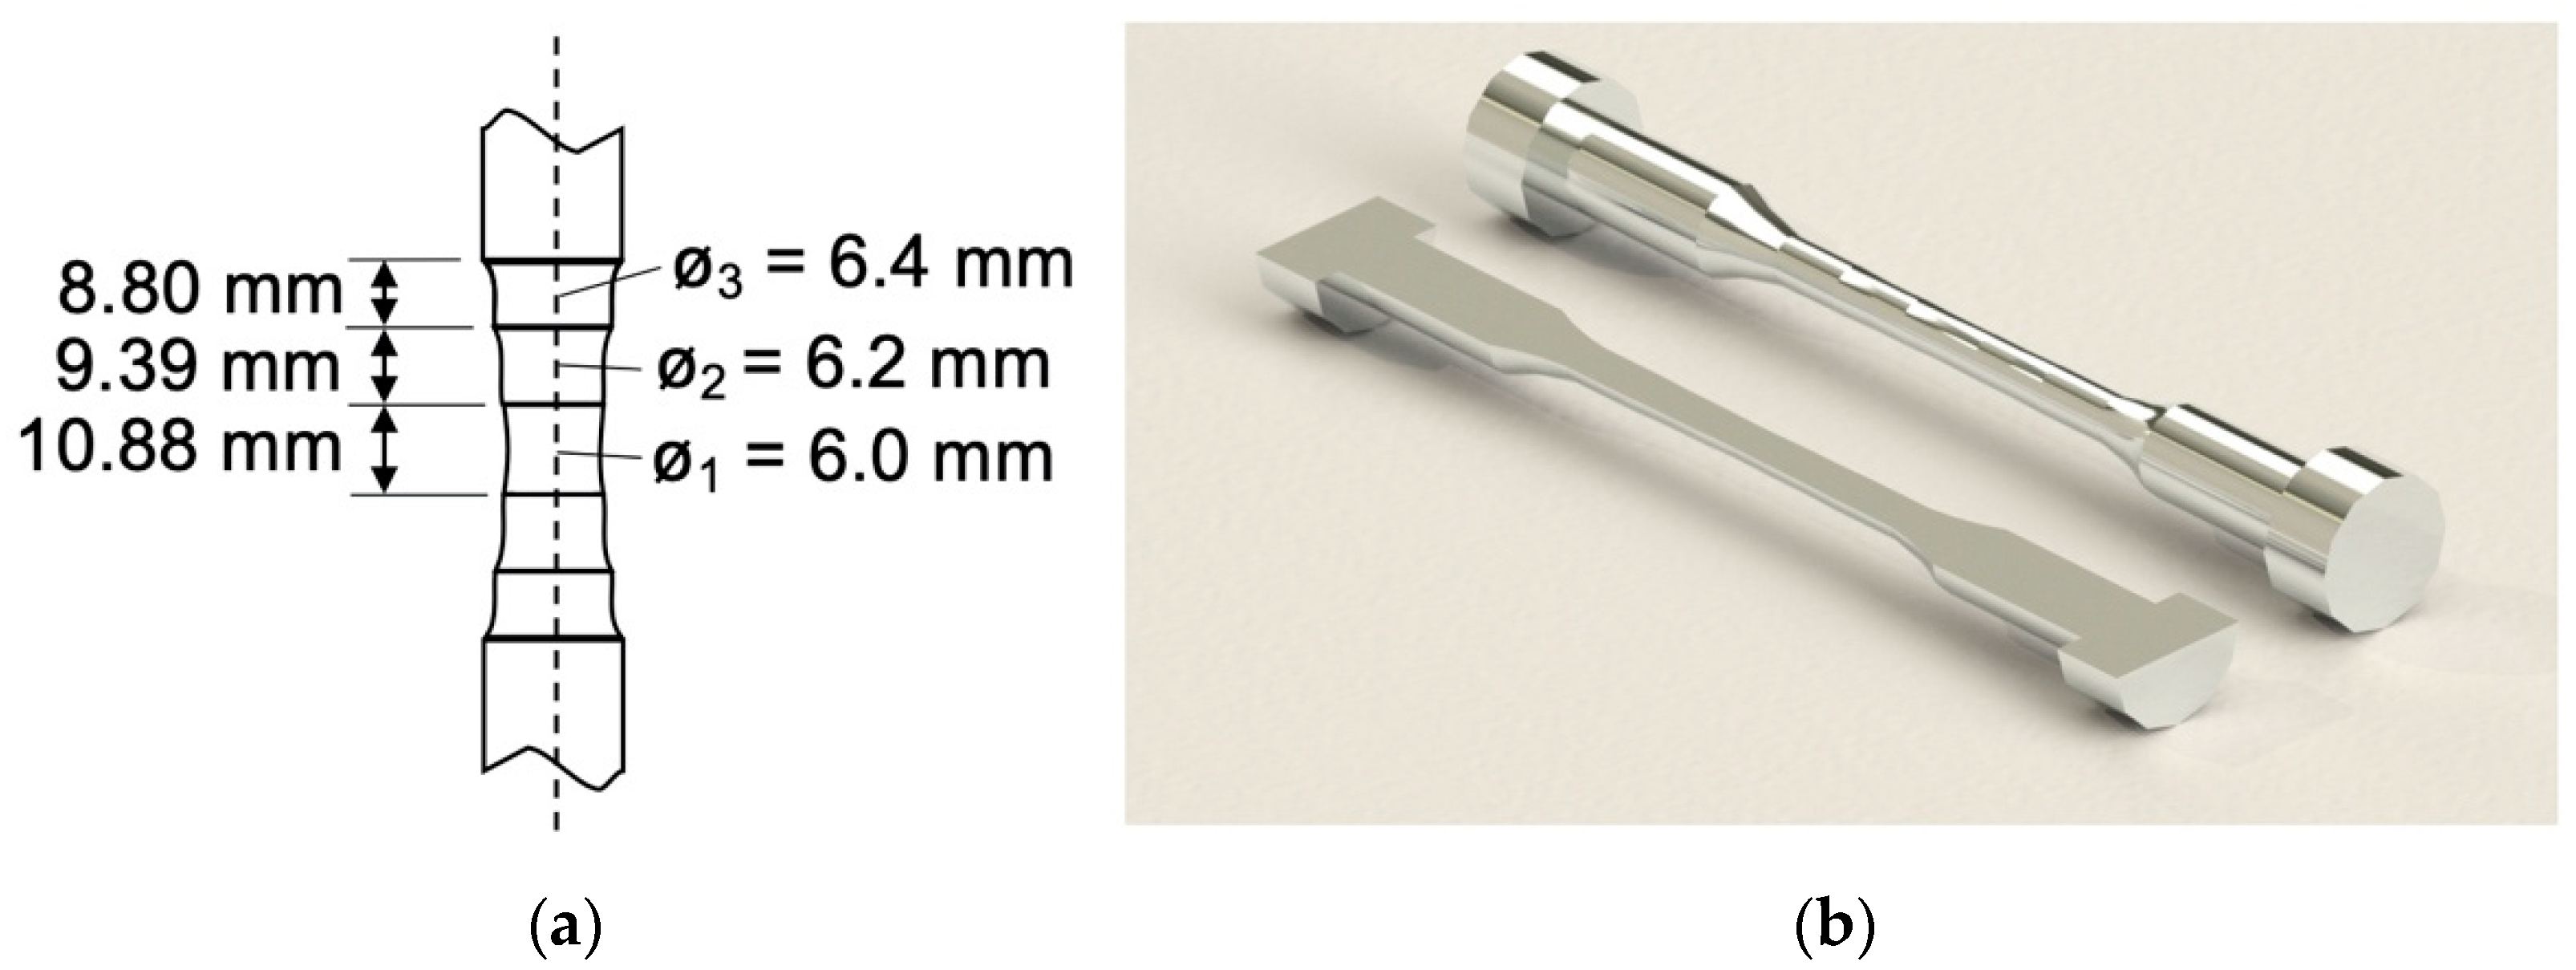
The SteBLife (stepped-bar fatigue life) approach gives comprehensive information regarding the load-function related deformation behaviour and thus the load-lifetime relation by means of an S–N curve of a material with only a few or even down to one single specimen. The specimen geometry is characterised by a stepped shape with different gauge length diameters (Figure 5) consequently resulting in different local stresses or stress amplitudes along the axial direction of the specimens during loading. The volumes of the individual gauge lengths are the same in order to prevent influences from volume-specific dissipation effects. Moreover, the transitions from one gauge length to another are tangential to reduce notch effects along the specimen to a minimum value. The fatigue tests are performed under constant amplitude loading, and the material response (M) is measured by NDT-related methods. Based on this idea and due to the symmetry of the specimen, it is possible to plot up to five cyclic deformation curves providing the database for cyclic stress material-response (σa–M) curves. In contrast to other STEPs such as PhyBaL [30], StressLife [26] or StrainLife [31], no pre-damage from load increase tests (LIT) and strain increase tests (SIT), respectively, due to the previous load steps as well as softening and/or hardening effects from the stepwise increased stress or strain amplitude has to be taken into consideration, whereby the as measured stress material-response relationship can be used, leading to a significant advantage.
For the calculation, generalised Morrow [32] and Basquin [17] equations are combined in order to calculate the fatigue life and an S–N dataset for the material investigated.
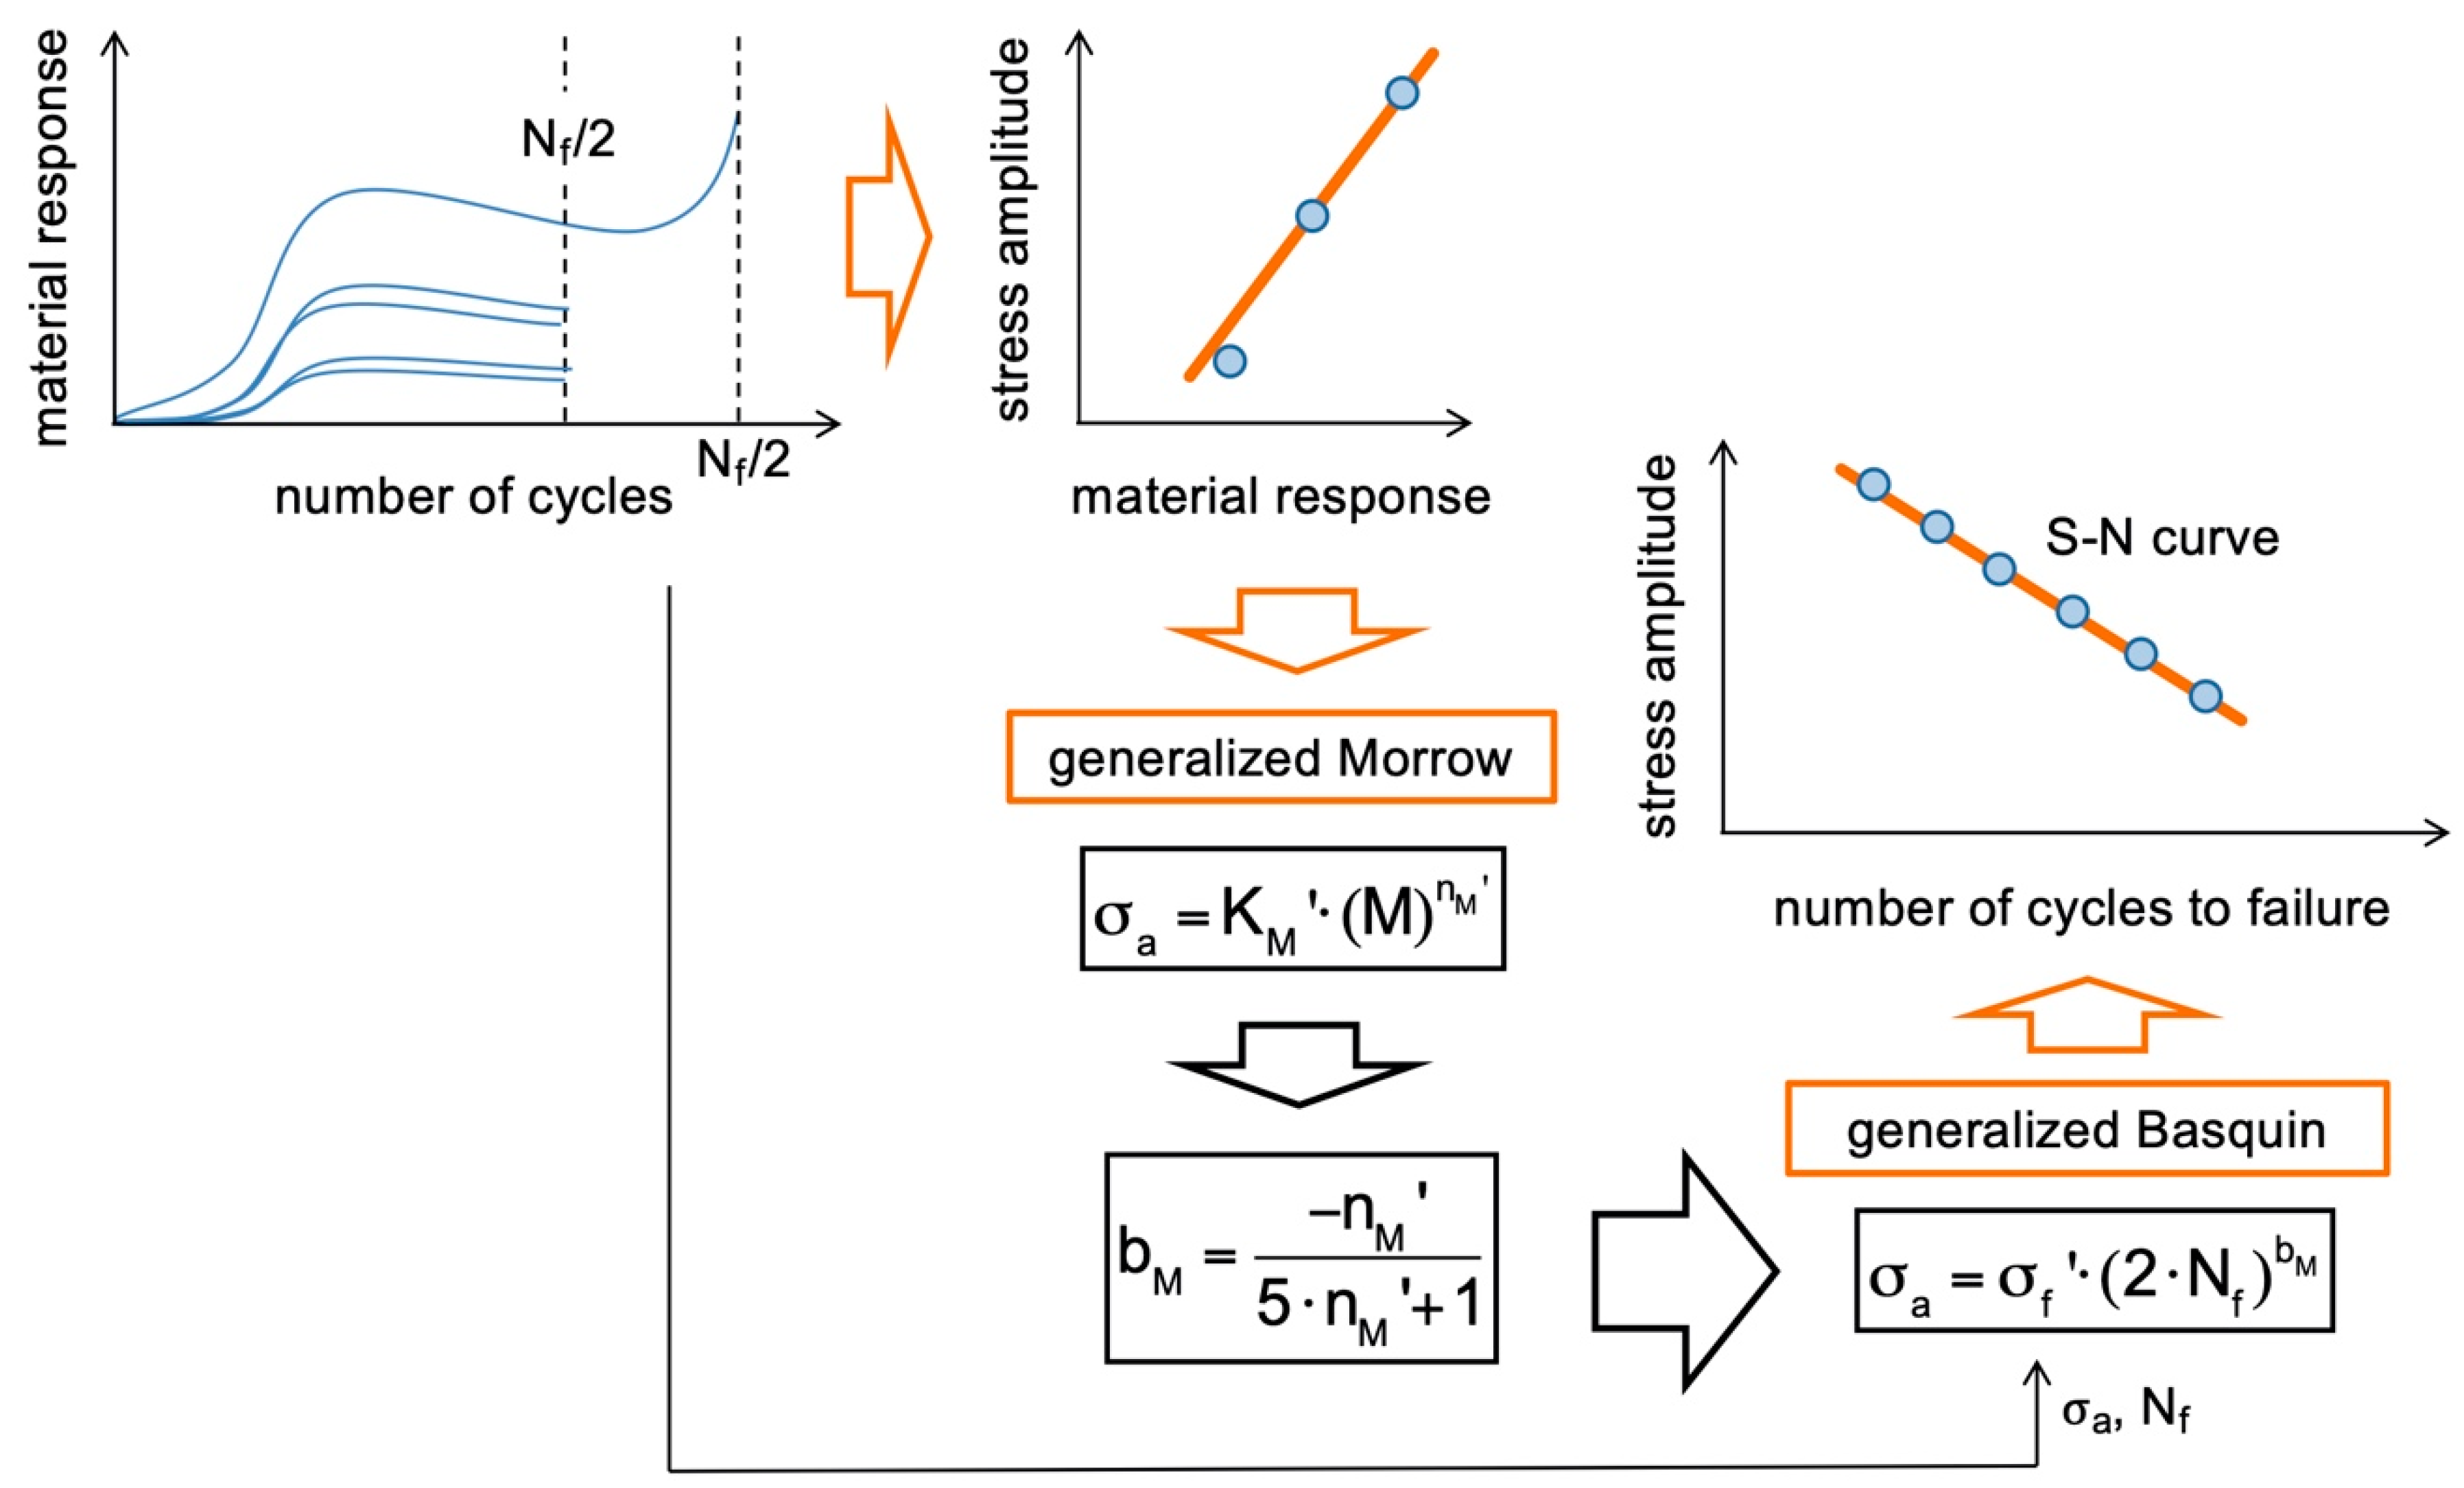
Following this strategy, three different SteBLife modules were developed up to this date. The first one is SteBLifestc (stc: single test, trend curve) allowing to calculate a trend S–N curve based on one single test with a duration of 2–3 h. The full procedure of the SteBLifestc approach can be seen in Figure 6 [24,27].
SteBLifemtc (mtc: multiple tests, trend curve) is based on 2–5 SteBLife tests at different stress amplitudes in order to improve the statistics of the provided dataset and to generate a representative mean S–N curve (50% failure probability), which also takes the material’s inhomogeneity into account.
The third module SteBLifemsb (msb: multiple tests, scatter bands) offers the possibility to calculate scatter bands for different failure probabilities, which is an important feature even in the case of more inhomogeneous materials like, e.g., cast irons., therefore, 4–5 SteBLife tests are performed at the same stress amplitude and the obtained lifetimes Nf can be interpreted by a Gaussian distribution allowing to determine the lifetimes for different failure probabilities, as, e.g., 5%, 50% and 95% (or others). The procedures of SteBLifemtc and SteBLifemsb are explained more in detail in [25,27,33] as well as based on the results discussed in Section 3.
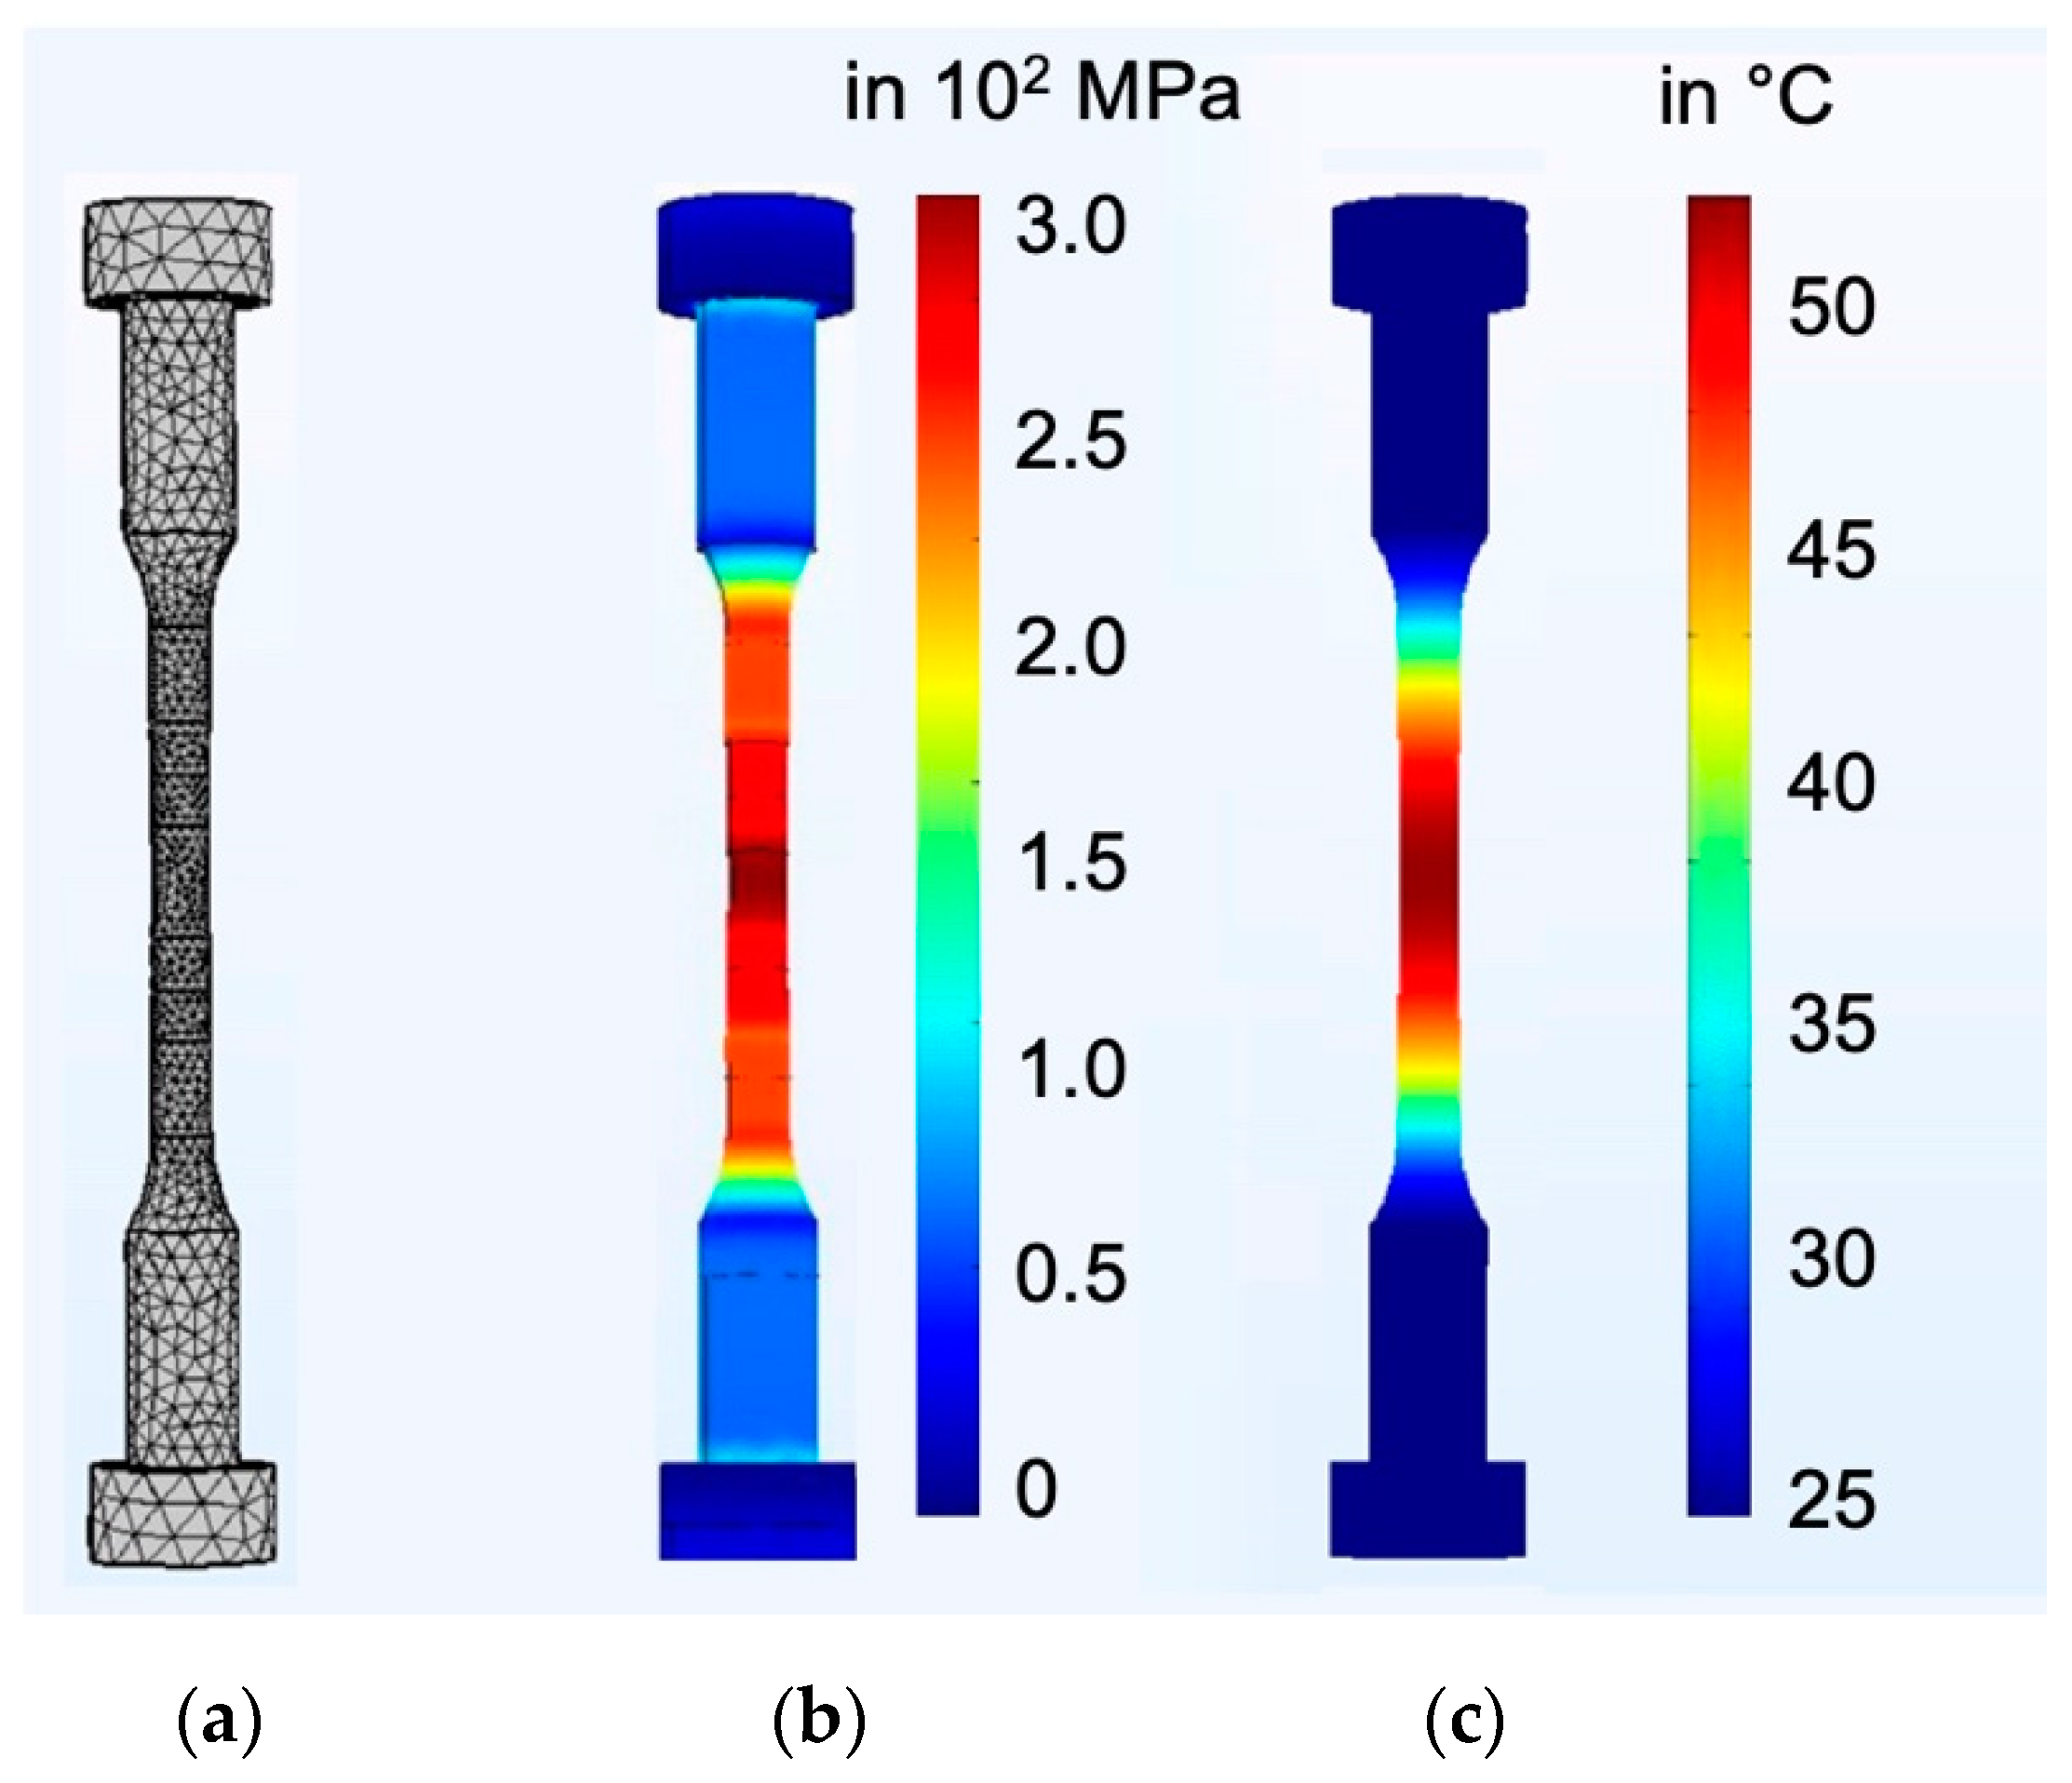
For the optimisation of the SteBLife specimen geometry, simulations with the COMSOL Multiphysics® software were carried out in parallel to the experimental investigations, whereby the dissipated heat of the individual cross-section areas and their heat conduction interaction were considered. This is particularly relevant for the determination of the reference value for the calculation of individual temperature changes ΔT1, ΔT2o/u, and ΔT3o/u, which represent the input variables for the subsequent service life calculation according to SteBLife, using temperature measurements as the material response. The thermomechanical modelling comprises the combination of structural mechanics and heat transfer modules that are included in the software library and was carried out for different development stages of the SteBLife specimen geometry.
The first step in the numerical modelling is to develop the mechanical stress fields of the SteBLife specimen for a given cyclic loading. For this purpose, the surface of the specimen geometry was meshed with a variable field network (Figure 7a). Based on this, the mechanical stresses on the surface were simulated for different stress amplitudes (Figure 7b, shown here for σa = 300 MPa in the smallest test cross-section). Since the specimens are cyclically loaded during the fatigue test, a time-dependent consideration was made for a previously defined number of cycles, in which mechanical stresses were modelled for all geometric coordinates in three dimensions as a function of time.
The Multiphysics® interface in COMSOL calculates the dissipated energy density from the locally present mechanical stresses as a function of time. Using the heat transfer module, temperature fields of the sample surface can be determined (Figure 7c). This approach allows the evaluation of the specimen geometry with respect to the temperature measurement and enables the evaluation/selection of heat conduction models and to determine optimal measuring points for the temperature evaluation. The tetrahedral elements were chosen for these simulations because they are good in the convergence of the numerical solution for curved geometries. The maximum and minimum element sizes were chosen as 1 mm and 0.5 mm respectively. The minimum element quality was chosen as 0.20. The finite element method works by discretising the modelling domains into smaller, simpler, domains called elements. The equations within each element are also known as shape functions and can be of different orders. Finally, the solution is computed by assembling and solving a set of equations over all of the elements of the model. The solution to these elemental equations approximates the actual solution to the partial differential equation. The user has an option to select the shape functions such as Lagrange and Serendipity to the given problem. In this case, the Quadratic Serendipity function was chosen to minimise the computation time.

2.3. Measurement Technology

2.3.1. Fatigue Testing System

Stress-controlled constant amplitude tests (CAT) using sinusoidal load-time functions at a stress ratio R = −1 and a frequency of f = 5 Hz were carried out at ambient temperature on a servohydraulic testing systems type EHF-U (load range ± 50 kN) by Shimadzu. For fatigue tests in the HCF regime, the maximum number of cycles Nmax was limited to 2 × 10⁶.
The material response was measured by means of the change in temperature ΔT measured by an infrared camera and magnetic-based measurands as the Hall voltage ΔUHall. These quantities are directly related to deformation-induced changes in the microstructure of the bulk material, represent the current fatigue state and provide input variables for the fatigue life calculation. ΔT, ΔUHall are highly temperature-sensitive, and since metallic materials are very good heat conductors, the microstructure related dissipated energy is superimposed by heat transfer processes requiring temperature stabilised grips (specimen clamping) for the fatigue testing systems. Therefore, a cooling system based on Peltier elements with water coolant was developed. This system is capable of reducing the temperature difference between upper and lower grip during the test to less than 0.5 K as well as the temperature drift during the test to less than 0.5 K.

2.3.2. Temperature Measurements

For the SteBLife approach as described before, the specimen geometry is characterised through a stepped shape with different diameters of the gauge lengths, consequently resulting in different local stress amplitudes σa along the rotary axis. For the ΔT evaluation, seven measurement fields were defined within the infrared camera software, one in each gauge length (T1, T 2o/u, T 3o/u, o: upper, u: lower), and two at each shaft (T4o/u). ΔT was calculated in accordance with Equations (1)–(3).
ΔT1 = T1 − 0.5 × (T4o + T4u)
ΔT2o/u = T2o/u − T4o/u
ΔT3o/u = T3o/u − T4o/u
The diameter of the shafts is larger than the diameter of any other gauge length, so that T4o/u can be considered as the elastic portion of the change in temperature, as well as ambient influences, and can be subtracted from T1, T2o/u and T3o/u leading to respective ΔT values, which can be seen as proportional to εa,p and are, therefore, related to the evolution of the plastic deformation in each volume of the specimen’s gauge lengths.
The theoretical background for the use of temperature measurements in order to characterise the fatigue behaviour can be derived from the consideration of the mechanical stress-strain hysteresis loop. The lines surrounding the hysteresis loop describe the energy that must be applied to plastically deform the specimen during fatigue loading. Since energy cannot simply be extinguished, it is transformed into the internal energy U and the heat energy Q [34]. The energy proportion U enables microstructural changes in the deformed specimen’s volume such as dislocation reactions, micro and macrocrack formation as well as their propagation processes. The predominant proportion Q of about 90% from the deformation energy dissipates as heat, which is inter alia related to the released energy from reversed dislocation movement processes and internal friction of new material surfaces due to crack formation and propagation [35]. That is why the temperature change can be correlated directly with the plastic deformation or the cumulative damage. For metallic materials, the change in temperature caused by the energy dissipation can be easily measured on the specimens’ surface as a consequence of the high heat conduction rate.
To enable the possibility for a reproducible and a high-precision measurement of ΔT by infrared cameras, the surface of the specimens were painted with high emissivity black paint, obtaining an emission factor of 0.97 and the change in the emissivity was neglected even if the effective temperature changes during the fatigue tests are relatively small (<10 K). For these investigations an infrared camera type thermoIMAGER TIM 450 by Micro-Epsilon was used. This system provides a spectral range of 7.5 to 13 µm, an optical resolution of 382 × 288 pixels and a thermal sensitivity of 40 mK. The data acquisition software was programmed according to the requirements of the fatigue tests on National Instruments LabVIEW. The software allows to extract thermographs and to measure point/line/field temperatures as numerical matrix information from the specimens’ surface under investigation.
For the sake of thermal stability as well as the accuracy during long test intervals, the infrared camera has been modified by an active cooling system.

2.3.3. Magnetic-Based Measurements

Magnetic-based measurements were carried out using Hall probes. According to Edwin Hall, this physical effect is referred to as the Hall effect, which he discovered during his doctoral thesis in 1879 [36].
Since electrons in a solid electrical conductor cannot be deflected completely as a result of the Lorentz force, but only within the conductive material, areas with an excess of electrons and areas with a lack of electrons are generated. This results in a charge separation which, due to the opposite negative and positive charge surpluses, leads to an electric field with a field strength exerting a force on the electrons which counteracts the Lorentz force FLorentz.
If both forces are in equilibrium, there is no further charge separation resulting in the Hall voltage UHall depending on the current I and the external magnetic field B. UHall indicates magnetic field changes at a constant current and rises linearly with the applied magnetic field and is thereby anti-proportional to the charge carrier density, since a smaller charge carrier density can only lead to an unchanged current intensity at a higher speed of the individual charges. Due to the fact that the charge carrier density in semiconductors is significantly lower than in metals, semiconductors are mainly used for Hall probes. UHall can be calculated using Equation (4), where AHall is the Hall coefficient and d is the thickness of the conductor [37].
U Hall = A Hall I · B d
The usual measuring range of Hall probes is between 0.5 μT and 5 T and depends on the sensor type. For the investigations within the scope of this work, Hall probes type Hal 1822 by Micronas and A1325 by Allegromicro Systems each with a range of −80 to 80 mT, were used. For amplification, a self-developed Hall probe amplifier was applied together with a VirtualBench System by National Instruments.

3. Results and Discussion

3.1. Temperature-Based Calculations

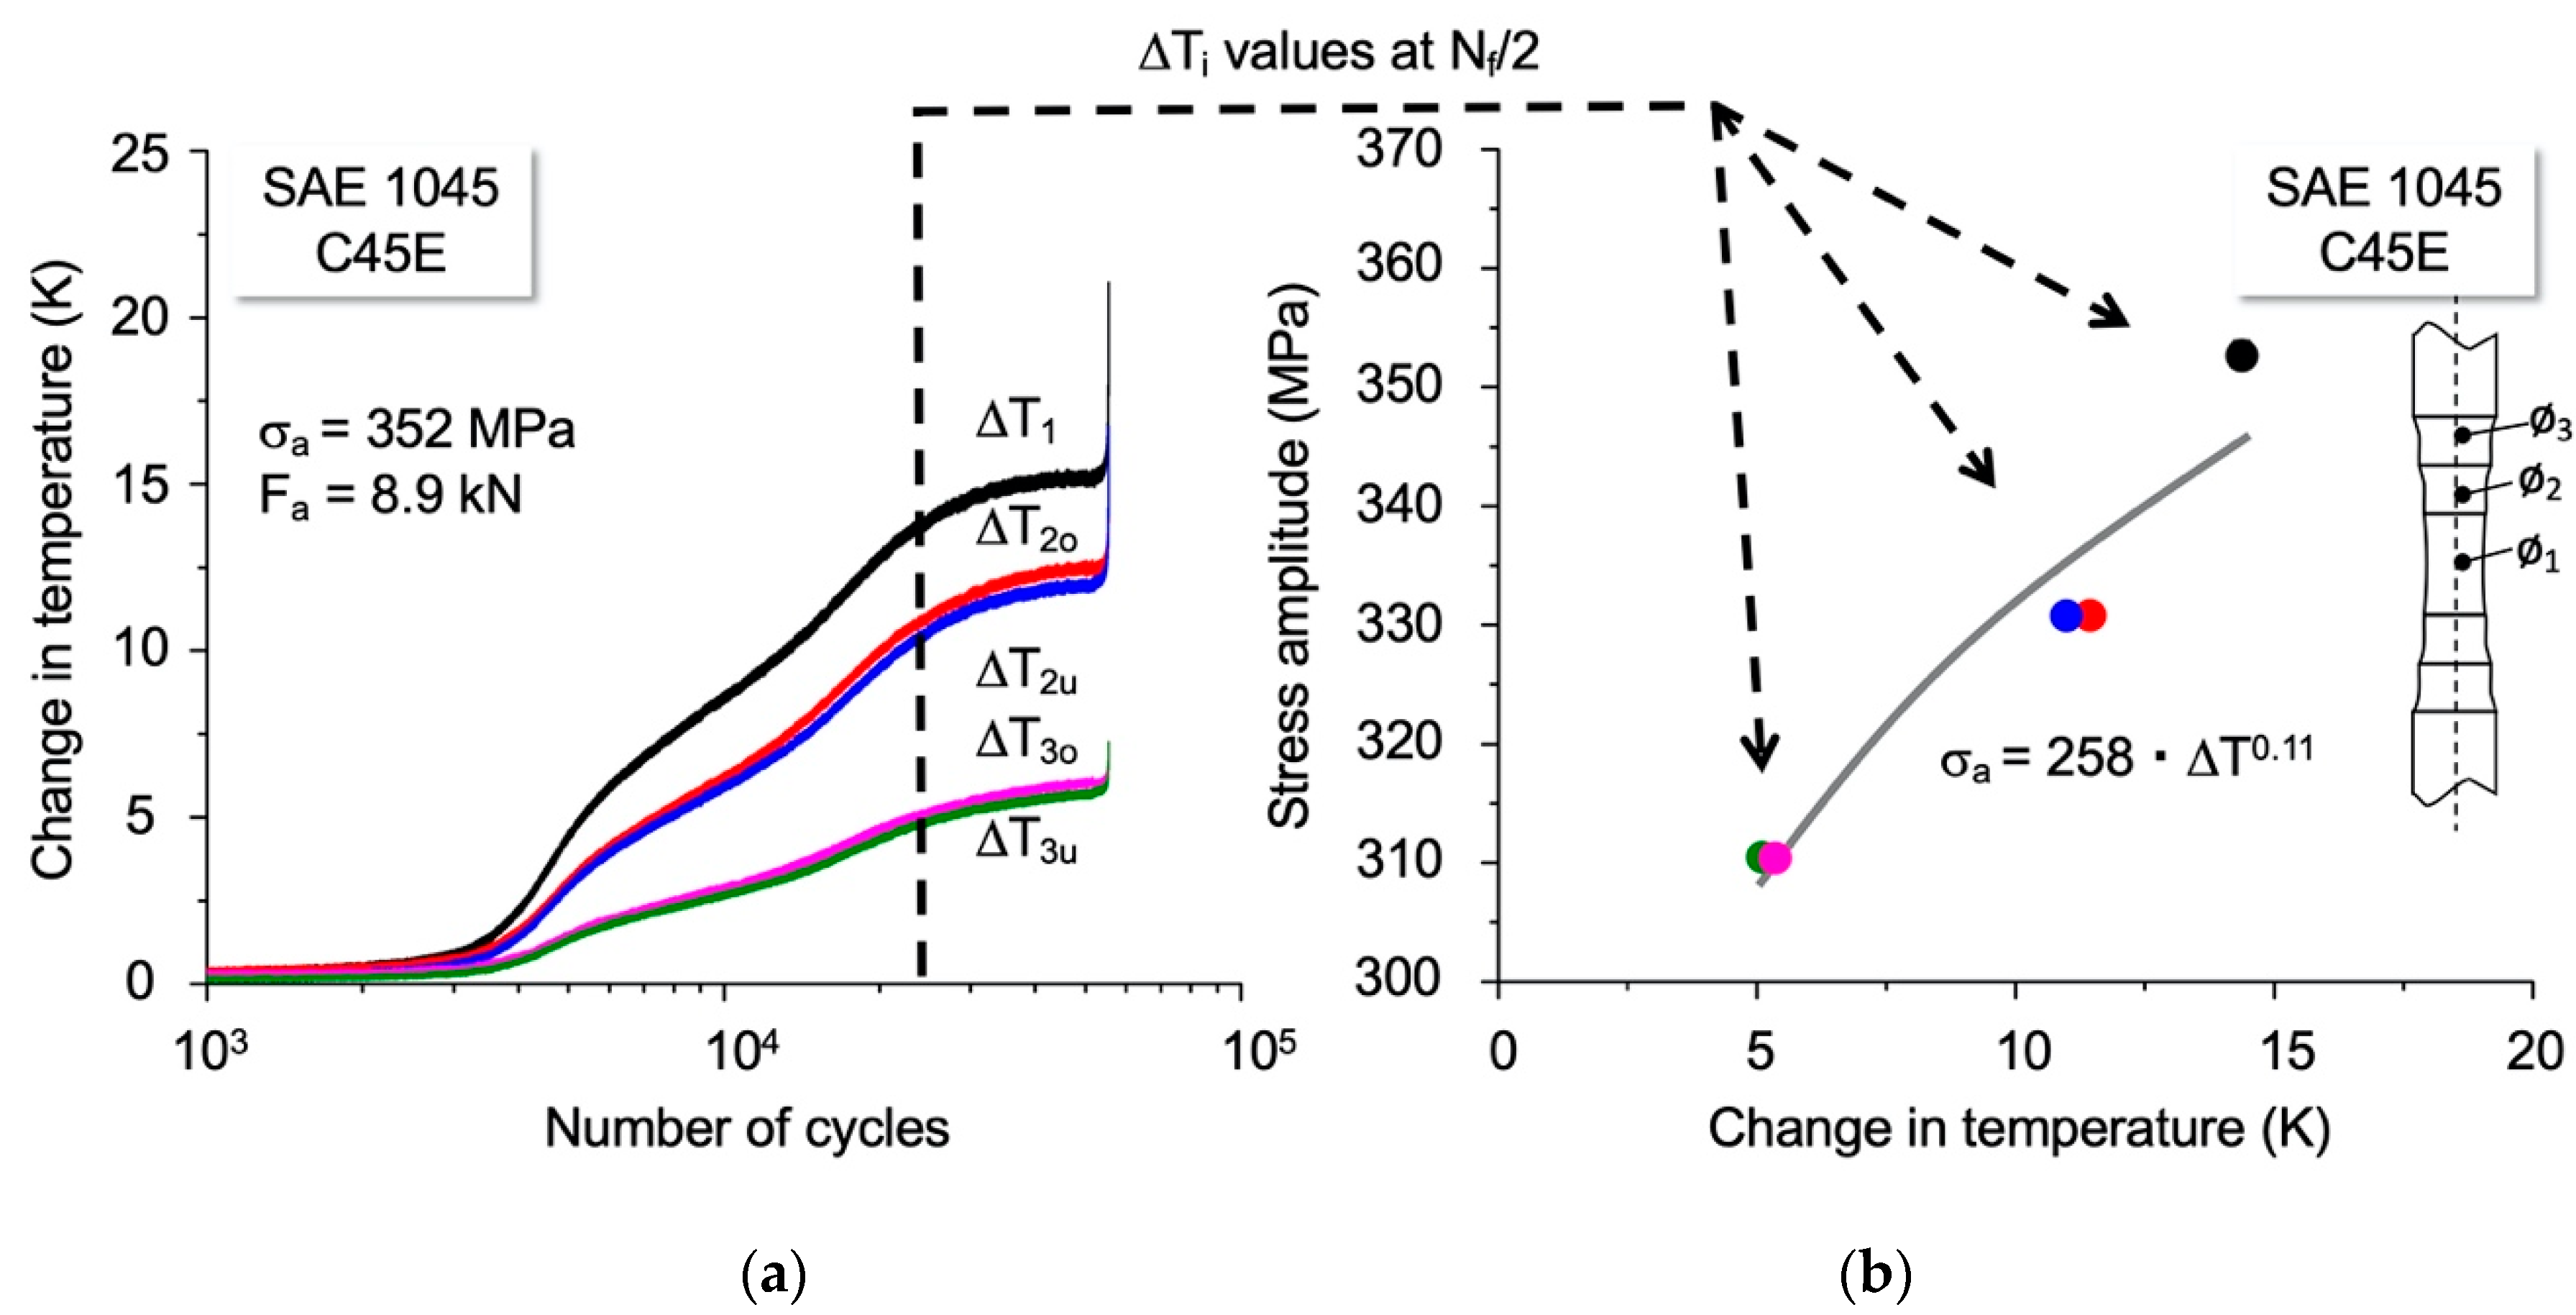
The material response was traced primarily by temperature measurements as described in 2.3.2. As mentioned before, the fatigue tests were performed under constant amplitude loading, whereby a sinusoidal alternating axial force function at a load ratio of R = −1 was used. In the case of the normalised SAE 1045 steel shown in Figure 8a, a force amplitude of Fa = 8.9 kN was applied. Based on the symmetry of the specimen’s geometry, one cyclic deformation curve for the diameter of 6.0 mm, and each two for the diameters of 6.2 and 6.4 mm are obtained, resulting in local stress amplitudes of 352 (ΔT1), 337 (ΔT2,o/u o: upper, u: lower) and 318 MPa (ΔT3,o/u). The change in temperature is calculated with respect to the pure elastic loaded shaft of the specimen in accordance with Equations (1)–(3).
Specimen failure occurred during the test at Nf = 52,320 (Figure 8a), corresponding to the determined lifetimes with conventional hourglass specimens. The cyclic deformation curves provide the database for cyclic stress material-response curves. For SteBLifestc, ΔT values are extracted at Nf/2 and plotted as a cyclic stress amplitude-temperature curve (CST) shown in Figure 8b. In the following, a combination of Morrow and Basquin equations is used for the calculation of the S–N curve (Figure 9) as explained in 2.2 in detail.
Figure 9 gives a first impression regarding the capability of the SteBLifestc approach enabling the calculation of the materials’ fatigue life based on one fatigue test only, which is in good accordance compared with the conventionally determined lifetimes from CATs with conventional hourglass specimens. The datapoints of the SteBLifestc curve were calculated for several stress amplitudes by using Basquin’s equation as it was shown in Figure 6.
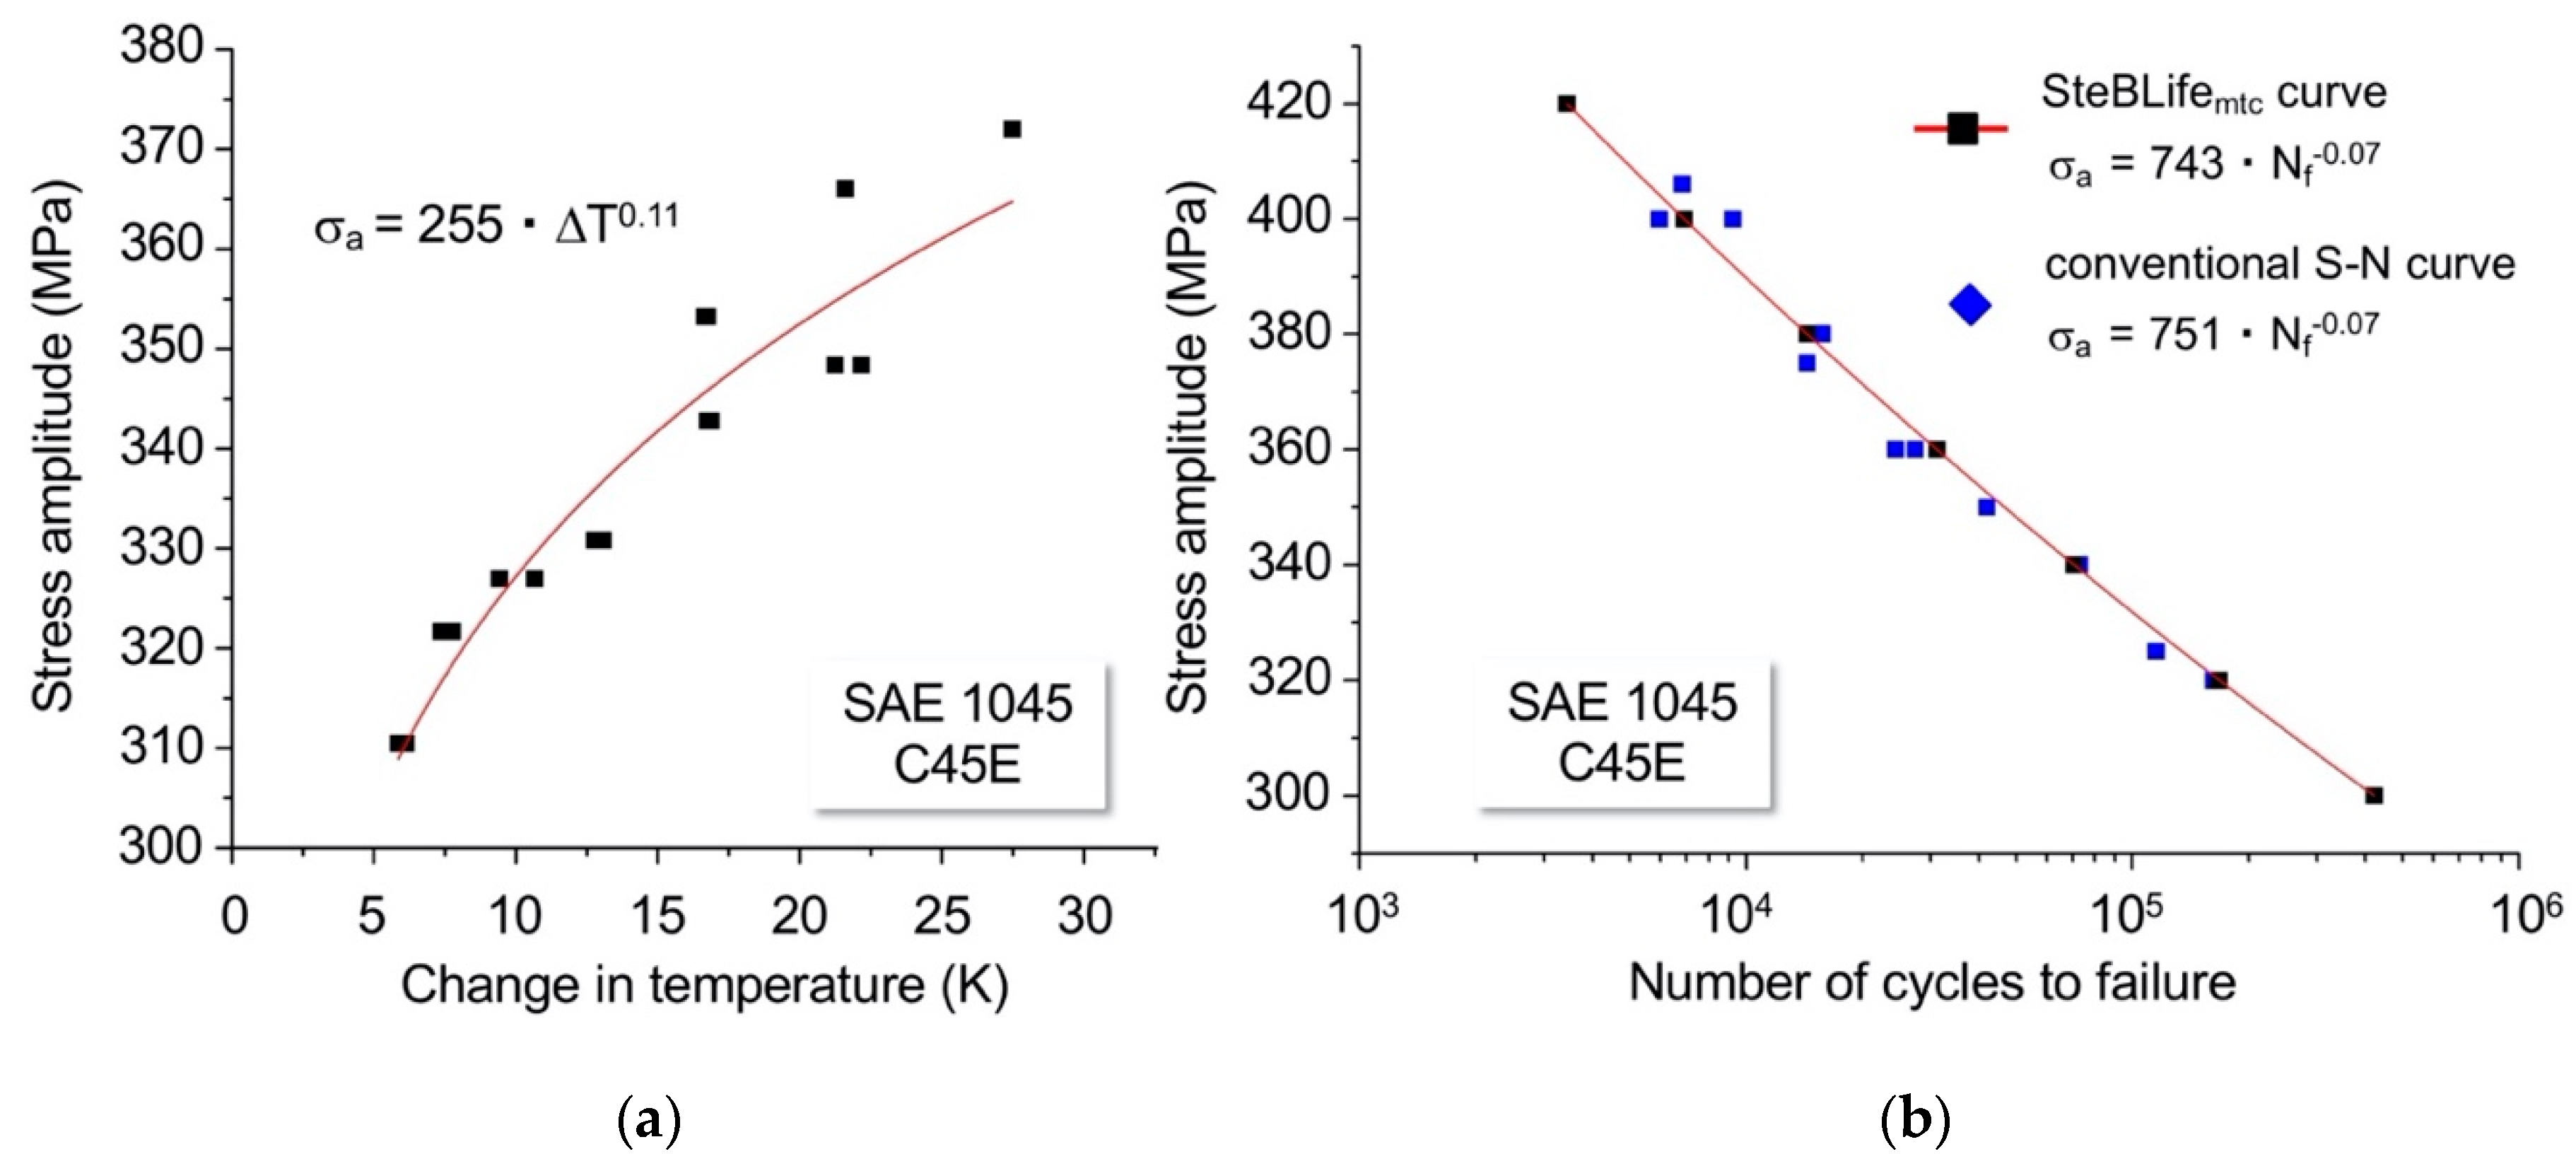
In order to improve the result of the approach and to give it a more statistical meaning, additional SteBLife tests were performed. The overall CST curve of four SteBLife tests is shown in Figure 10a providing the database for SteBLifemtc from which the further calculation is done equivalent to SteBLifestc. Comparing the SteBLifemtc calculation and conventional determined fatigue data, the values for the fatigue strength coefficients are found to be nearly the same (751 MPa for conventional CATs and 743 MPa for SteBLifemtc) and the fatigue strength exponents are −0.07 for both.
The result shown in Figure 10b has the character of an S–N curve for a 50% probability of failure or survival, respectively, and is, therefore, very well suited for materials with a larger scatter behaviour.
In the case of more inhomogeneous materials, scatter bands for different failure probabilities (Pf) may become of interest as additional information in an S–N dataset. Therefore, the SteBLifemsb module was designed and validated, combining 4 to 5 SteBLife tests performed at the same value of σa. The probability density (φ(Nf)) of Nf from performed SteBLife tests can be fitted to a Gaussian distribution, which is in the form of Equation (5). By integrating Equation (5) on an interval from −∞ to Nf, it is then possible to calculate the failure probability Pf (also cumulative distribution, Equation (6)). In this case is μ the mean, represents the Nf value at 50% failure probability; σ2 the variance, which is the expectation of the squared deviation of a random variable from its mean μ. μ and σ2 can be determined according to the conducted SteBLife tests as 40,456 and 4.25∙107, respectively. Within the method development, other distribution types as arcsin√P and Weibull were studied, however, the calculation using Gaussian distribution led to the best results for a general application.
φ ( N f ) = 1 2 π σ 2 · exp ( ( N f μ ) 2 2 σ 2 )
P f = 1 2 ( 1 + e r f ( N f μ 2 σ 2 ) )
From the Gaussian distribution, the lifetimes of different failure probabilities can be calculated (Figure 11a). In this example, 5%, 50% and 95% were chosen for plotting the scatter bands, but others can be calculated as well, e.g., 0.01% since this is an important value for the design of components such as in the automotive industry. Different fatigue strength exponents can be received from the five SteBLife tests and can be plotted as an exponent-lifetime relation. By using the calculated lifetimes for the failure probabilities of interest in an exponent-lifetime relation, fatigue strength exponents for a failure probability of 5%, 50% and 95% can be derived (Figure 11b).
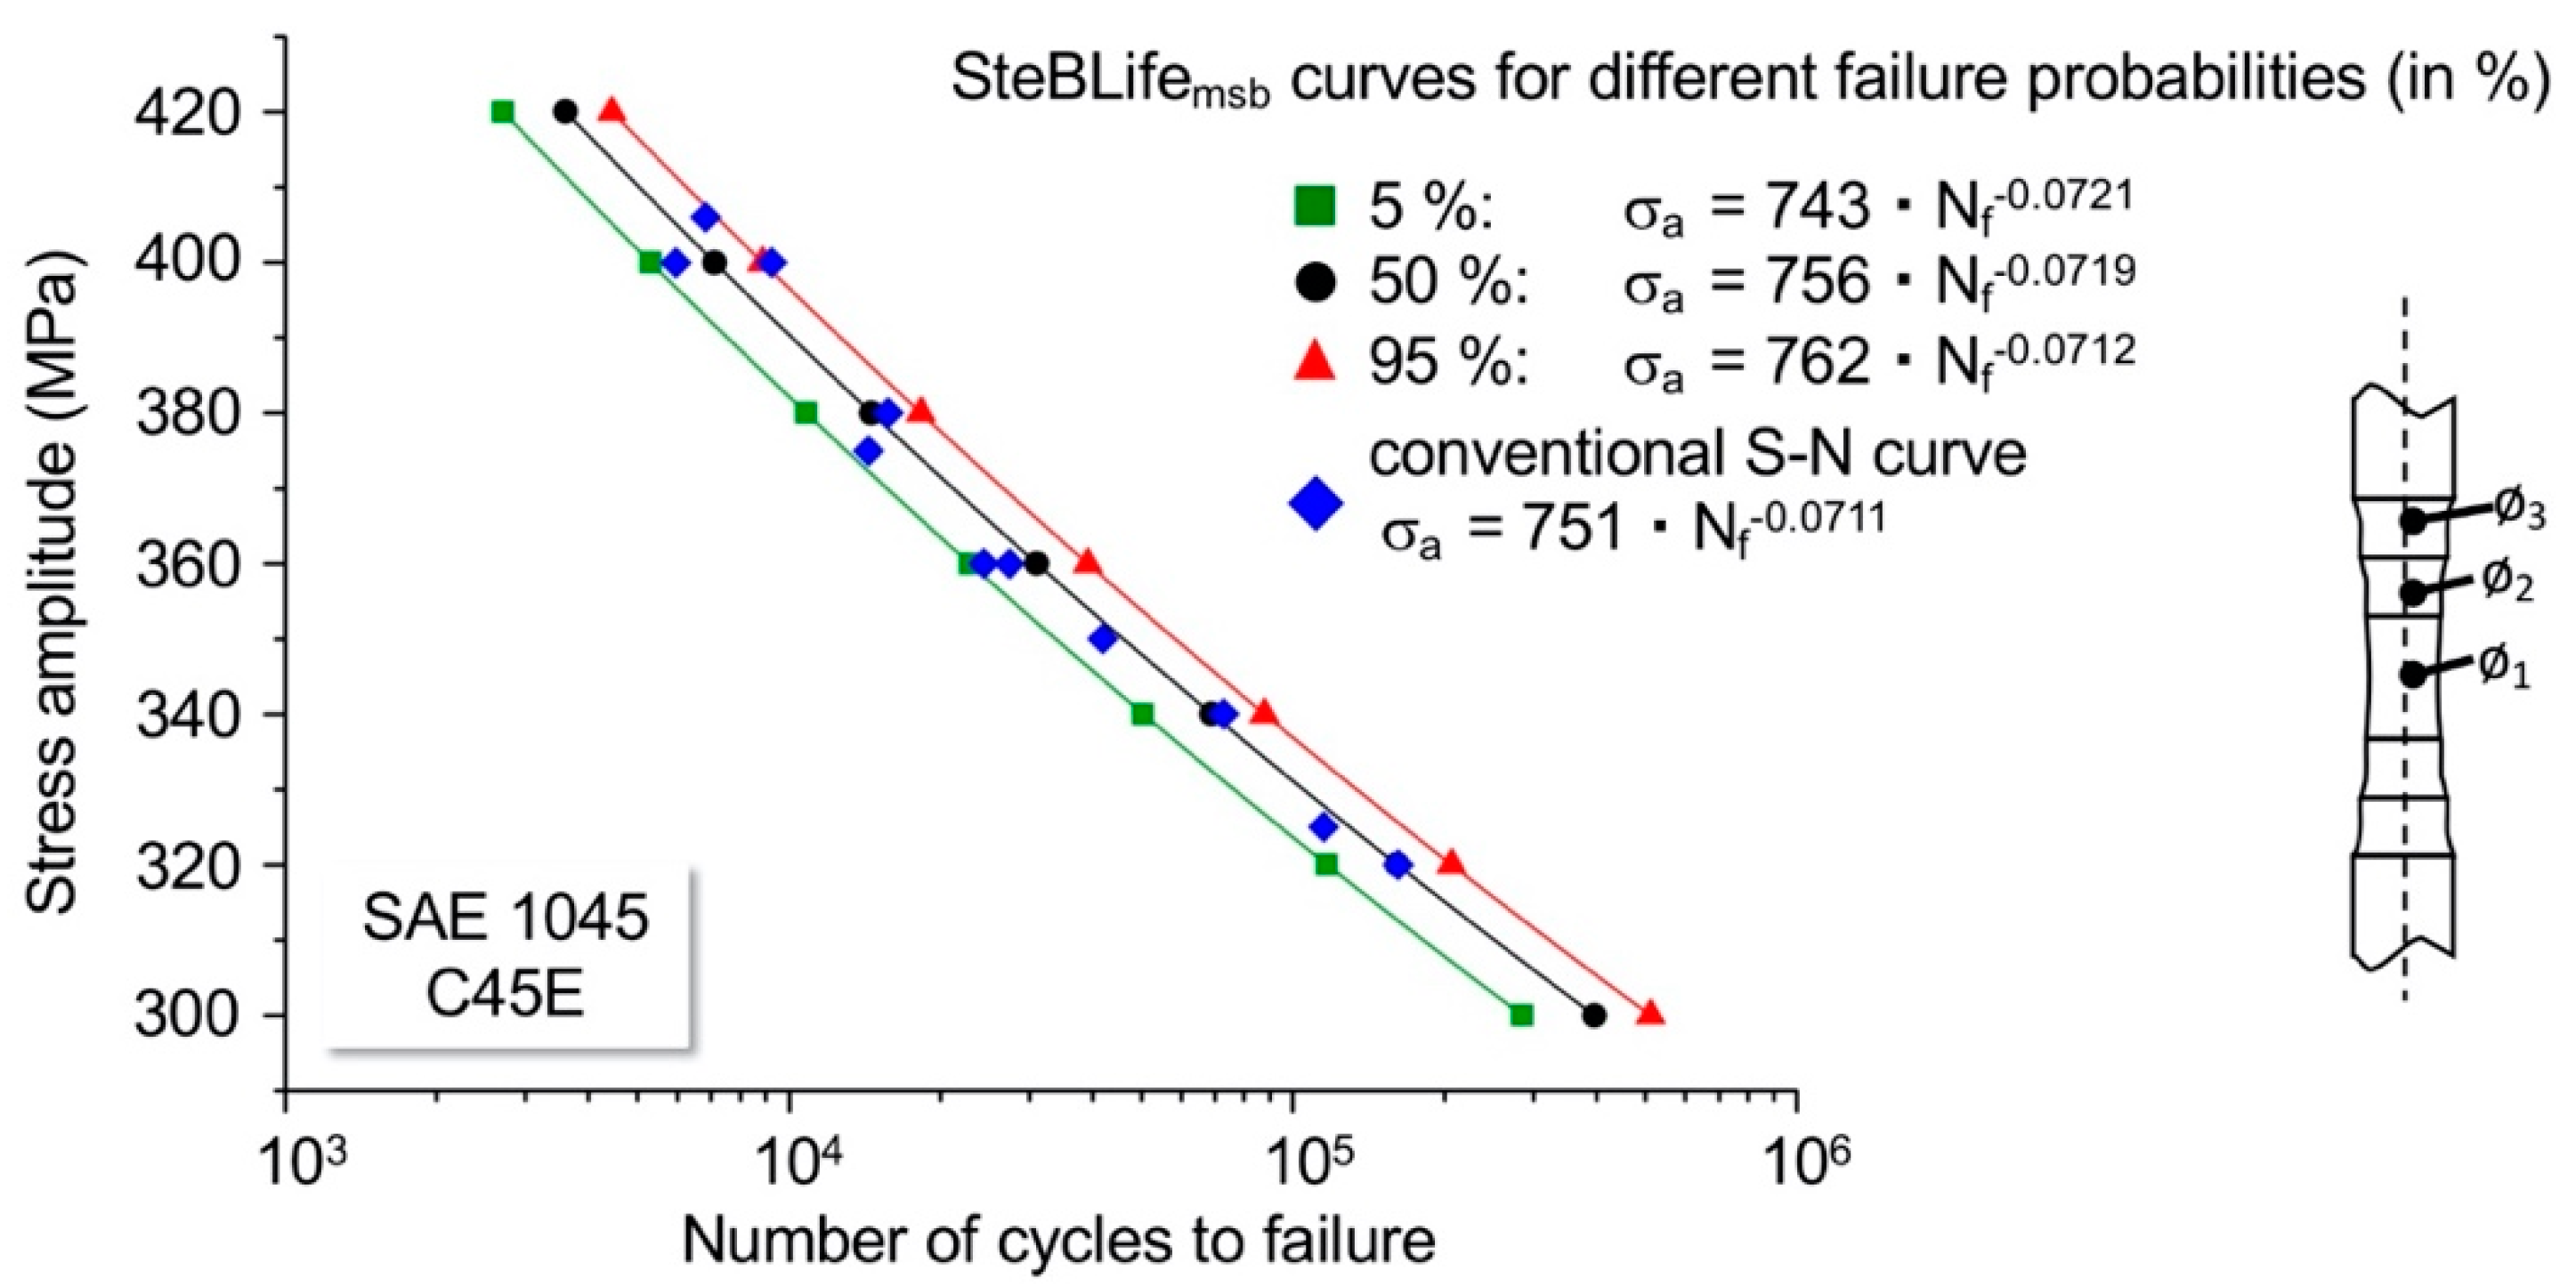
Based on the results of Figure 11, S–N curves for failure probabilities of 5, 50 and 95% can be calculated, which are shown in Figure 12 in comparison with S–N data from 11 CATs performed with conventional hourglass specimens used as reference values. Figure 12 underlines that the conventionally determined lifetimes can be described very reliably by scatter bands evaluated on the basis of SteBLifemsb. With a view to the mathematical description according to Basquin, the fatigue strength coefficients and exponents of calculated and conventionally determined S–N data are in the same range.
Within current research, the SteBLifemsb procedure has also been applied to other materials and material conditions such as normalised as well as quenched and tempered SAE 1015 (C15E) steel, quenched and tempered SAE 1045 (C45E) steel and normalised as well as quenched and tempered SAE 4140 (42CrMo4) steel in order to validate the general applicability of the method for this group of materials.
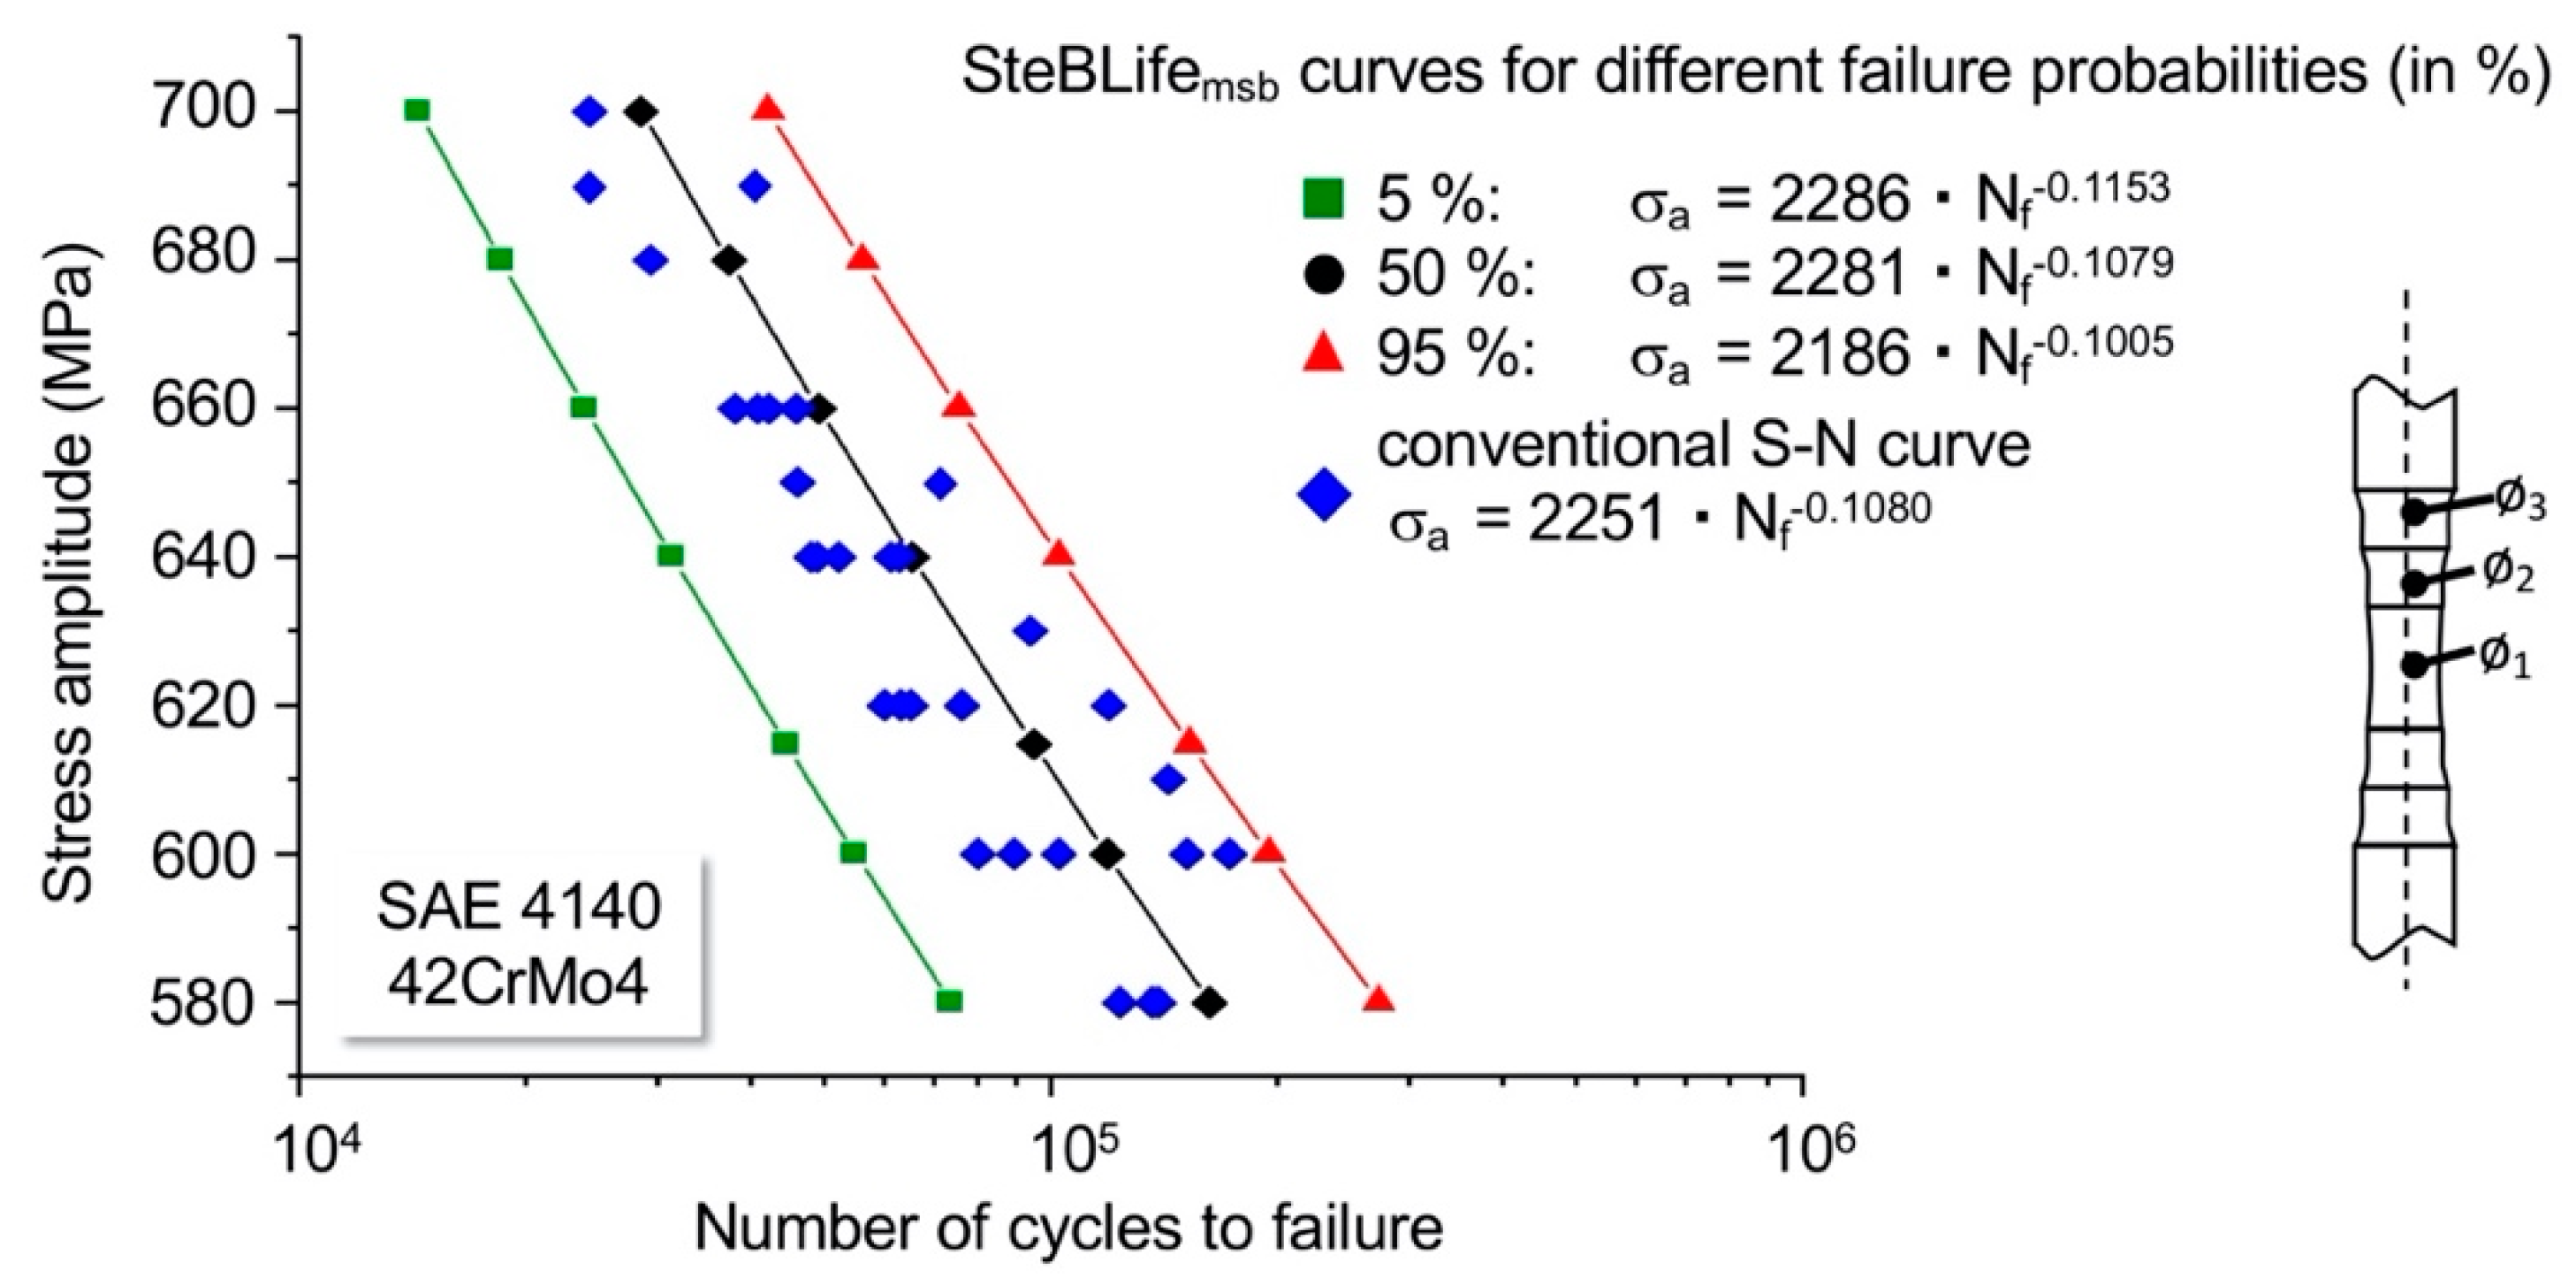
These research activities are still in progress and not yet fully completed, but Figure 13 gives a further outlook on more results of SteBLife calculations. Figure 13 shows a comparison of conventionally determined fatigue data with the S–N curves calculated by SteBLifemsb with related scatter bands for failure probabilities of 5%, 50% and 95% for quenched and tempered SAE 4140 steel.
Due to the material’s higher strength condition, the material responses are rather small, which means that their detection requires very stable boundary conditions and very high-resolution measurement techniques. During the fatigue tests, the ΔT slopes only show changes of a maximum of 0.5 K, which was challenging, but managed by the active cooling of the clamps and a further improvement of the infrared camera technique.
It is noteworthy that despite the very small temperature changes, the calculation using SteBLifemsb led to an excellent result. Considering that the 5 tests carried out for this purpose replace a number of tests of 30 to 40, the enormous potential with regard to the reduction of experimental time and costs can be deduced from the result obtained.

3.2. Magnetic-Based Calculations

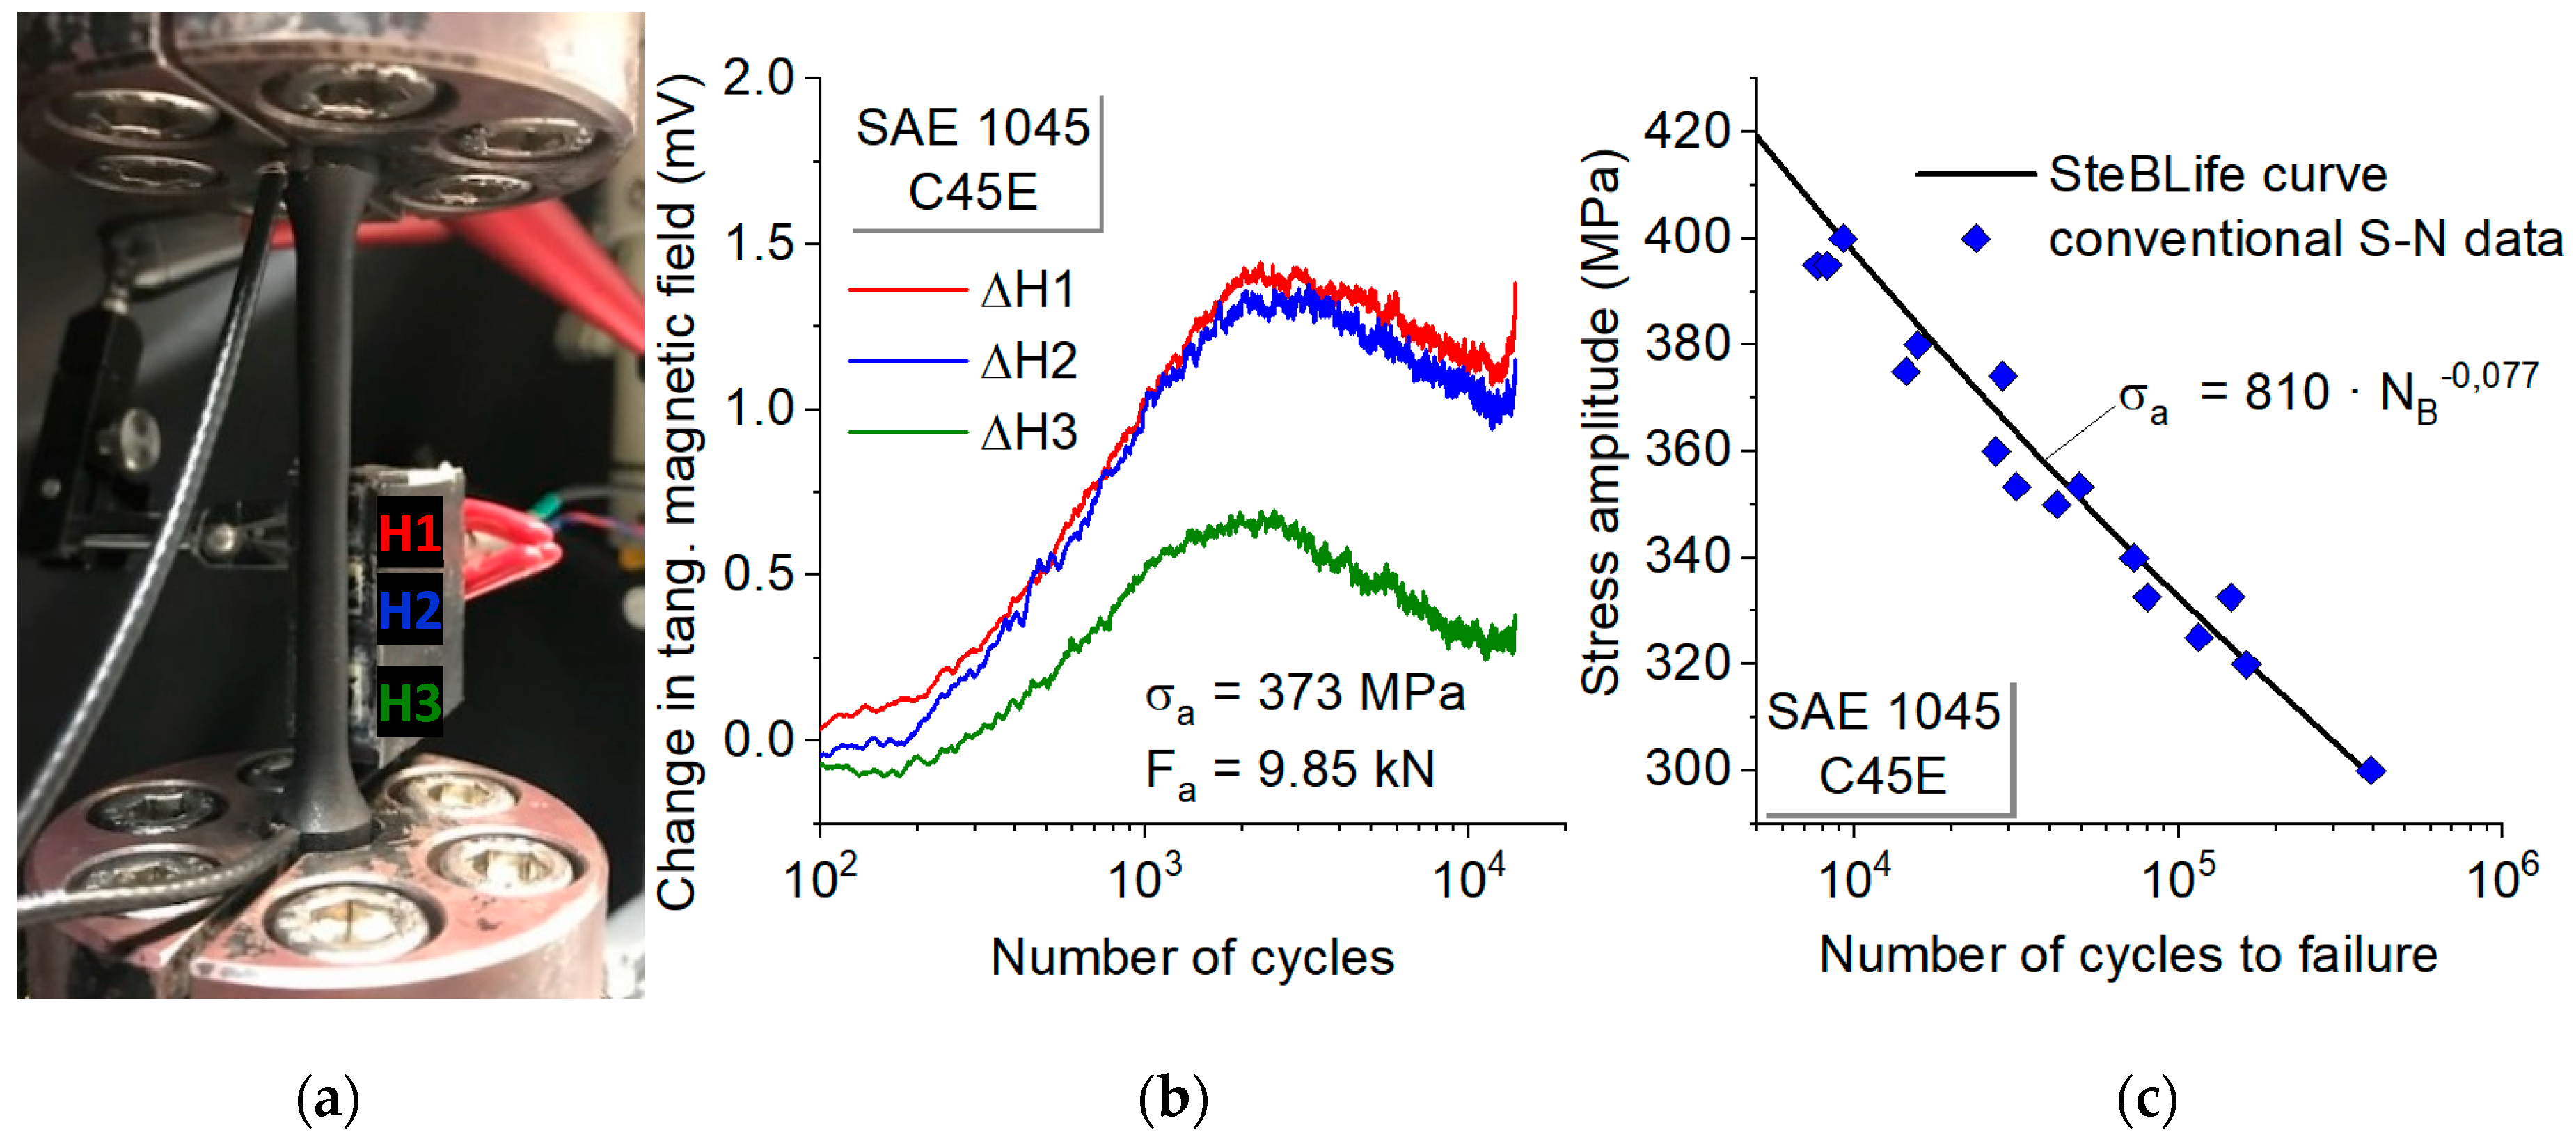
In addition to temperature measurements using infrared cameras, selected measurements were also carried out with a self-developed Hall sensor array. For magnetisation, a direct current of 3 A was applied to the specimen, which resulted in microstructure-dependent magnetic fields along the different gauge length diameters during the fatigue tests, which were recorded with the Hall sensor array. The sensor head and the positioning of the Hall elements were adapted to the SteBLife specimen geometry in such a way that identical distances to the specimen surface can be realised for the three cross-sectional diameters during measurement. By using a high-precision measuring card in combination with a LabVIEW data acquisition software, the change in the magnetic field was measured in terms of voltage values. The complete setup is shown in Figure 14a.
Figure 14b shows the changes in the tangential magnetic field during a SteBLife test for a specimen of the normalised SAE 1045 steel. The test was carried out with a constant force amplitude of Fa = 9.85 kN, resulting in a stress amplitude of σa = 373 MPa in the smallest cross-section (5.8 mm) and values of 337 MPa and 306 MPa in the cross-sections with 6.1 and 6.4 mm. In accordance with the results derived from temperature measurements, the cyclic deformation curves show locally different behaviour with varying incubation intervals as well as maximum values assigned to the respective local stress amplitude. Figure 14c shows the result of the fatigue life calculation according to SteBLifestc based on the change of the tangential magnetic field. As with the calculation based on temperature measurement, a very good agreement between the conventionally determined fatigue data and the calculation result was achieved. This result underlines the flexibility of the SteBLife fatigue life calculation method, which can be applied in a variety of ways, including the use of other measurement methods.

4. Conclusions

This paper shows how measurement techniques based on temperature and magnetic field can be included in the short-term evaluation procedure SteBLife (stepped-bar fatigue life) for the advanced evaluation of fatigue data in an appropriate way. The reduction in effort, time and cost achieved with such an approach can help the present material condition within an existing engineering structure to be evaluated, such as it is becoming increasingly necessary with ageing structures. Within the scope of this paper, the SteBLife approach is presented on the example of (i) normalised SAE 1045 (C45E) and (ii) quenched and tempered SAE 4140 (42CrMo4) steel in order to provide fatigue data in a fast and efficient manner. Therefore, the calculation is based on input parameters derived from temperature measurements through infrared cameras as well as through self-developed Hall probe arrays.
Through the application of the SteBLife approach, the duration and cost for determining a complete S–N dataset on an experimental basis is reduced by more than 90% when compared to state-of-the-art approaches. This results from the fact that principally only a low number of experiments in the high cycle fatigue range are required, which can be performed within a few hours each.
The advantage of combining the new experiment and calculation approach with the above-mentioned measurement techniques is that damage is not related to mechanical stress and strain only, but has rather been extended to a variety of other physical parameters, would those be of a thermal, electric, electromagnetic or acoustic nature. Those parameters, which may react much more sensitive to submicroscopic damage such as dislocation reactions, are a source to improve the understanding of a nonlinear damage accumulation process.
Furthermore, material properties determined by these techniques are principally independent of a material volume considered as long as the scale of this volume exceeds the size in which the inhomogeneous portions within a microstructure have an influence. As such it may, therefore, be applicable to complex geometries like notched specimens or even components as well as structures. The physical quantities monitored can be transferred from those localised and potentially critical spots within the structures to a reference database and can be directly related to microstructural changes in a bulk material of which the fatigue loading properties have been obtained with an approach such as SteBLife.

Author Contributions

Conceptualisation, P.S., H.W., R.A. and F.W.; methodology, P.S. and H.W.; software, H.W. and R.A.; validation, P.S., H.W., R.A. and J.T.; formal analysis, H.W., R.A. and R.S.V.; investigation, H.W., R.A. and F.We.; resources, P.S.; writing—original draft preparation, P.S., R.A.; writing—review and editing, R.A., F.W., J.T. and H.W.; visualisation, H.W., R.A. and R.S.V.; supervision, P.S.; project administration, H.W.; funding acquisition, P.S. All authors have read and agreed to the published version of the manuscript.

Funding

The authors gratefully acknowledge the financial support for this study from the German Research Foundation (Deutsche Forschungsgemeinschaft, DFG) under project STA 1133/6-1.

Acknowledgments

The authors would like to thank Shimadzu Europe and Micro-Epsilon for their support in technical equipment provision.

Conflicts of Interest

The authors declare no conflict of interest.

References

  1. Berger, C.; Eulitz, K.G.; Heuler, P.; Kotte, K.L.; Naundorf, H.; Schütz, W.; Sonsino, C.M.; Wimmer, A.; Zenner, H. Betriebsfestigkeit in Germany—An overview. Int. J. Fatigue 2002, 24, 603–625. [Google Scholar] [CrossRef]
  2. Seeger, T.; Heuler, P. Generalized application of Neuber’ s rule. J. Test. Eval. 1980, 8, 199–204. [Google Scholar]
  3. Haibach, E. Betriebsfestigkeit: Verfahren und Daten zur Bauteilberechnung (Structural integrity: Methods and Data for Component Calculation); Springer-Verlag: Berlin/Heidelberg, Germany, 2006; ISBN 9783540293637. (In German) [Google Scholar]
  4. Müller, A.; Grubisic, V. Simulation and measurement of complex, multi-axial, dynamic stress states on vehicle axle components. Rep. Appl. Meas. 1995, 9, 5–10. [Google Scholar]
  5. Radaj, D.; Sonsino, C.M.; Fricke, W. Fatigue Assessment of Welded Joints by Local Approaches, 2nd ed.; Woodhead Publishing: Sawston, UK, 2006. [Google Scholar]
  6. Grubisic, V.; Sonsino, C.M. Betriebsfeste Bemessung von Stahlkonstruktionen im Anlagenbau (Design against operational strength of steel constructions for plants). Materwiss. Werksttech. 1995, 26, 416–424. (In German) [Google Scholar] [CrossRef]
  7. Pawliczek, R.; Rozumek, D. The effect of mean load for S355J0 steel with increased strength. Metal (Basel) 2020, 10, 209. [Google Scholar] [CrossRef] [Green Version]
  8. Gassner, E.; Lowak, H. Bedeutung der Unregelmäßigkeit Gauß’scher Zufallsfolgen fur die Betriebsfestigkeit (Significance of irregularity of Gaussian random sequences on Fatigue). Materwiss. Werksttech. 1978, 9, 246–256. (In German) [Google Scholar] [CrossRef]
  9. Palmgren, A. Die Lebensdauer von Kugellagern. (The life of roller bearings). Z. Des. Ver. Dtsch. Ing. 1924, 68, 339–341. (In German) [Google Scholar]
  10. Miner, M. Cumulative damage in fatigue. J. Appl. Mech. 1945, 3, 159–164. [Google Scholar]
  11. Neuber, H. Theory of stress concentration for shear-strained prismatical bodies with arbitrary nonlinear stress-strain Law. J. Appl. Mech. 1961, 28, 544–550. [Google Scholar] [CrossRef]
  12. Schütz, W.; Zenner, H. Schadensakkumulationshypothesen zur Lebensdauervorhersage bei schwingender Beanspruchung. Teil 1—Ein kritischer Uberblick (Cumulative damage theories for the prediction of fatigue life—Part 1). Materwiss. Werksttech. 1973, 4, 25–33. (In German) [Google Scholar] [CrossRef]
  13. Schütz, W.; Zenner, H. Schadensakkumulationshypothesen zur Lebensdauervorhersage bei schwingender Beanspruchung. Teil 2—Ein kritischer Überblick (Cumulative damage theories for the prediction of fatigue life—Part 2). Materwiss. Werksttech. 1973, 4, 97–102. (In German) [Google Scholar] [CrossRef]
  14. Radaj, D.; Vormwald, M. Advanced Methods of Fatigue Assessment; Springer: Berlin/Heidelberg, Germany, 2013. [Google Scholar]
  15. Laue, S.; Bomas, H.; Mayr, P. Vergleichende untersuchungen zur anrisslebensdauervorhersage gekerbter proben mit dem örtlichen konzept und dem nennspannungskonzept am beispiel des stahls Cm15 (Comparative investigations on service life assessment of notched specimens based on the local). Materwiss. Werksttech. 2004, 35, 135–142. (In German) [Google Scholar] [CrossRef]
  16. Christ, H.-J. Ermüdungsverhalten Metallischer Werkstoffe (Fatigue Behaviour of Metallic Materials); Wiley-VCH: Weinheim, Germany, 1998. (In German) [Google Scholar]
  17. Basquin, O.H. The exponential law of endurance. Am. Soc. Test. Mater. 1910, 10, 625–630. [Google Scholar]
  18. Ricotta, M. Simple expressions to estimate the Manson-Coffin curves of ductile cast irons. Int. J. Fatigue 2015, 78, 38–45. [Google Scholar] [CrossRef]
  19. ASTM International. Standard Practice for Statistical Analysis of Linear or Linearized Stress-Life (S–N) and Strain-Life (ε–N) Fatigue Data: ASTM E739-91; ASTM International: West Conshohocken, PA, USA, 2004; Volume 3, pp. 658–664. [Google Scholar]
  20. Boller, C.; Seeger, T. Materials Data for Cyclic Loading; Elsevier: Amsterdam, The Netherlands, 1987. [Google Scholar]
  21. Goto, M. Scatter in small crack propagation and fatigue behaviour in carbon steels. Fatigue Fract. Eng. Mater. Struct. 1993, 16, 795–809. [Google Scholar] [CrossRef]
  22. Blacha, L.; Karolczuk, A.; Bański, R.; Stasiuk, P. Application of the weakest link analysis to the area of fatigue design of steel welded joints. Eng. Fail. Anal. 2013, 35, 665–677. [Google Scholar] [CrossRef]
  23. Wu, H.; Bill, T.; Teng, Z.J.; Pramanik, S.; Hoyer, K.P.; Schaper, M.; Starke, P. Characterization of the fatigue behaviour for SAE 1045 steel without and with load-free sequences based on non-destructive, X-ray diffraction and transmission electron microscopic investigations. Mater. Sci. Eng. A 2020. Accepted for publication. [Google Scholar] [CrossRef]
  24. Starke, P.; Bäumchen, A.; Wu, H. SteBLife—A new short-time procedure for the calculation of S-N curves and failure probabilities. Mater. Test. 2018, 60, 121–127. [Google Scholar] [CrossRef]
  25. Starke, P.; Wu, H. Use of non-destructive testing methods in a new one-specimen test strategy for the estimation of fatigue data. Int. J. Fatigue 2018, 111, 177–185. [Google Scholar] [CrossRef]
  26. Starke, P. StressLifetc—NDT-related assessment of the fatigue life of metallic materials. Mater. Test. 2019, 61, 297–303. [Google Scholar] [CrossRef]
  27. Wu, H.; Bäumchen, A.; Engel, A.; Acosta, R.; Boller, C.; Starke, P. SteBLife—A new short-time procedure for the evaluation of fatigue data. Int. J. Fatigue 2019, 124, 82–88. [Google Scholar] [CrossRef]
  28. Weber, F.; Acosta, R.; Eyrisch, T.; Hielscher, T.; Magin, M.; Starke, P. Influence of processing parameters on the fatigue life time of specimens made from quenched and tempered steel SAE 4140H. Mater. Test. 2019, 61, 842–850. [Google Scholar] [CrossRef]
  29. Starke, P.; Eifler, D.; Boller, C. Fatigue assessment of metallic materials beyond strain measurement. Int. J. Fatigue 2016, 82, 274–279. [Google Scholar] [CrossRef]
  30. Starke, P.; Walther, F.; Eifler, D. New fatigue life calculation method for quenched and tempered steel SAE 4140. Mater. Sci. Eng. A 2009, 523, 246–252. [Google Scholar] [CrossRef]
  31. Acosta, R.; Boller, C.; Starke, P.; Jamrozy, M.; Knyazeva, M.; Walther, F.; Heckmann, K.; Sievers, J.; Weihe, S.; Schopf, T. Non-destructive testing derived parameters for microstructure- based residual service life assessment of aging metallic materials in nuclear engineering. Mater. Test. 2019, 61, 1029–1038. [Google Scholar] [CrossRef]
  32. Morrow, J. Cyclic plastic strain energy and fatigue of metals. In Internal Friction, Damping, and Cyclic Plasticity; Lazan, B.J., Ed.; ASTM International: West Conshohocken, PA, USA, 1965; pp. 45–87. ISBN 978-0-8031-5995-2. [Google Scholar]
  33. Starke, P.; Wu, H.; Boller, C. SteBLife—The enhanced short-time evaluation procedure for materials fatigue data generation. Mater. Sci. Forum 2019, 941, 2395–2400. [Google Scholar] [CrossRef]
  34. Maletta, C.; Bruno, L.; Corigliano, P.; Crupi, V.; Guglielmino, E. Crack-tip thermal and mechanical hysteresis in shape memory alloys under fatigue loading. Mater. Sci. Eng. A 2014, 616, 281–287. [Google Scholar] [CrossRef]
  35. Sangid, M.D. The physics of fatigue crack initiation. Int. J. Fatigue 2013, 57, 58–72. [Google Scholar] [CrossRef]
  36. Hall, E.H. On a new action of the magnet on electric currents. Am. J. Math. 1879, 2, 287–292. [Google Scholar] [CrossRef]
  37. Karplus, R.; Luttinger, J.M. Hall effect in ferromagnetics. Phys. Rev. 1954, 95, 1154–1160. [Google Scholar] [CrossRef]
Figure 1. Description of an S–N curve in the low cycle (LCF) and high cycle fatigue (HCF) regime for total strain-controlled fatigue tests with differentiation into elastic and plastic strain amounts according to Basquin and Manson-Coffin (equations), based on [16].
Metals 10 00798 g001
Figure 2. (a) Light micrograph and (b) transmission electron micrograph of SAE 1045 (C45E) steel in the original state (reproduced from [23], with permission from Elsevier, 2020).
Metals 10 00798 g002
Figure 3. (a) Light micrograph, (b) scanning electron micrograph and (c) transmission electron micrograph of quenched and tempered SAE 4140 (42CrMo4) steel in the original state.
Metals 10 00798 g003
Figure 4. X-ray phase analysis for the quenched and tempered SAE 4140 (42CrMo4) steel.
Metals 10 00798 g004
Figure 5. Geometry of stepped-bar fatigue life (SteBLife) specimens presented as a (a) drawing and (b) model.
Metals 10 00798 g005
Figure 6. Schematic workflow for the fatigue life calculation method SteBLifestc.
Metals 10 00798 g006
Figure 7. Results of the simulation using COMSOL Multiphysics® with the (a) model of a SteBLife specimen with mesh network; (b) the simulated stress distribution in the specimen for σa = 300 MPa and (c) the simulated temperature distribution after a time interval of 10 s during cyclic loading.
Metals 10 00798 g007
Figure 8. (a) Temperature-based cyclic deformation curves for different diameters of the SteBLife specimen and (b) cyclic stress amplitude-temperature curve in a constant amplitude test with σa = 352 MPa (related to Ø = 6.0 mm) in accordance with the SteBLifestc approach for SAE 1045 (C45E) steel.
Metals 10 00798 g008
Figure 9. Conventional determined S–N data and SteBLifestc curve calculated on the basis of the change in temperature for SAE 1045 (C45E) steel.
Metals 10 00798 g009
Figure 10. (a) Cyclic stress amplitude-temperature curve from constant amplitude tests in accordance with the SteBLifemtc and (b) conventional S–N data and SteBLifemtc curve calculated on the basis of the change in temperature for SAE 1045 (C45E) steel.
Metals 10 00798 g010
Figure 11. (a) Gaussian distribution and (b) fatigue strength exponent-lifetime relation for five tests in accordance with the SteBLifemsb approach for SAE 1045 (C45E) steel.
Metals 10 00798 g011
Figure 12. Conventionally determined S–N data and SteBLifemsb curve with calculated scatter bands for different failure probabilities evaluated from five SteBLife tests for SAE 1045 (C45E) steel.
Metals 10 00798 g012
Figure 13. Conventionally determined S–N data and SteBLifemsb curve with calculated scatter bands for different failure probabilities from five SteBLife tests for SAE 4140 (42CrMo4).
Metals 10 00798 g013
Figure 14. (a) Test setup with Hall sensor array, (b) cyclic deformation curves based on the tangential magnetic field for a SteBLife test with Fa = 9.85 kN and (c) fatigue life calculation according to the SteBLifestc method based on the magnetic field measurement for the normalised SAE 1045 (C45E) steel.
Metals 10 00798 g014
Table 1. Chemical composition of SAE 1045 (C45E) steel and comparison with DIN EN 10083-1.
(wt %)CSiMnPSCrMoNi
DIN−standardMin0.42-0.50-----
Max.0.500.400.800.0300.0350.400.1000.40
Certificate0.470.230.720.0120.0130.670.0140.07
Table 2. Properties of normalised SAE 1045 (C45E) steel.
Rm (MPa)Rp0.2 (MPa)E (GPa)A (%)HV10KCU (Jm cm−2)
710413204.523.521856
Table 3. Chemical composition of SAE 4140 (42CrMo4) steel and comparison with DIN EN 10083-3.
(wt %)CSiMnPSCrMoNi
DIN-standardMin.0.38-0.60-0.0200.900.15-
Max.0.450.40.990.0250.0351.200.30-
Certificate0.400.260.740.020.021.070.180.09
Table 4. Properties of quenched and tempered SAE 4140 (42CrMo4) steel.
Rm (MPa)Rp0.2 (MPa)E (GPa)A (%)Z (%)HV10
10519602081655345