Abstract
Oxide growth and the induced stresses in the high-temperature oxidation of steel were studied by a multiphase field model. The model incorporates both chemical and elastic energy to capture the coupled oxide kinetics and generated stresses. Oxidation of a flat surface and a sharp corner are considered at two high temperatures of 850 °C and 1180 °C to investigate the effects of geometry and temperature elevation on the shape evolution of oxides and the induced stresses. Results show that the model is capable of capturing the oxide thickness and its outward growth, comparable to the experiments. In addition, it was shown that there is an interaction between the evolution of oxide and the generated stresses, and the oxide layer evolves to reduce stress concentrations by rounding the sharp corners in the geometry. Increasing the temperature may increase or decrease the stress levels depending on the contribution of eigen strain in the generated elastic strain energy during oxidation.
1. Introduction
Designs of advanced energy systems such as nuclear power plants, combustion boilers, and steam and gas turbines, require materials that reliably work in complex and harsh environments under various mechanical, chemical, and thermal loads and contaminations [1,2]. Steels are one of the main materials commonly used in these harsh environments due to their unique and exceptional mechanical properties. However, it is well-known that they suffer from oxidation, especially at high temperatures, during manufacturing and operation. Different oxide phases, either protective or non-protective, are formed during the oxidation process [3,4,5,6,7,8,9]. The evolution of oxide layers may result in the generation of stresses that can lead to several forms of failure in the oxide scale [10,11]. This may also affect the successful formation of protective layers as well as the surface structure of the final products. The large volume change due to metal/oxide phase transformation (Pilling–Bedworth ratio) accompanied by different thermal expansion of metal and oxide phases are two of the important sources of stress generation in oxides [12,13,14,15,16]. Many experimental works have investigated oxide scale failures due to induced stresses and tried to determine the stress states and strain regimes that lead to decohesion and failure of the various protective and non-protective oxide layers [17,18,19,20]. However, most of the experimental and numerical approaches are based on assuming equilibrium condition and have not considered the interaction between chemical and elastic energies.
Recently, the phase-field method (PFM), due to its ability to combine different physics, has emerged as a powerful computational method to study the interaction between microstructure evolution and the resulting stresses [21,22,23,24,25]. Oxidation of metals under dual oxidant and without elastic effects was studied in by Wen et al. [26]. Nijdam et al. [27,28] developed a coupled thermodynamic-kinetic oxidation model to predict the composition profiles of each developed oxidation phase. However, their model could not capture the strains and stresses generated during the oxidation. In studies by Krishnamurthy et al., a sharp-interface approach was used to study stress distribution in growing oxide films in very simple geometry of single and polycrystalline oxidation [29,30]. High temperature oxidation behavior and kinetics of steels have been studied by various studies [3,8,9,31,32,33,34,35,36,37]. However, investigating the high temperature oxidation of steels using the phase-field method has only been done by a few works in the literature. For example, coupling the mechanical and diffusion equations has been considered in the works of Zhou et al. [38,39] to study the stress—oxidation relation and oxidation induced metal depletion in metals and Fe-Cr alloys. However, due to a lack of non-conserved variables, the application of such a model is challenging, especially for multiphase (metal/oxide/fluid) cases. Yang et al. analyzed high-temperature oxidation of Fe-based alloys using PFM [40]. Even though their results showed good agreement with experimental results, their work did not consider the effect of geometry and temperature change on the stress generation, and their model did not also allow the capture of outward oxidation.
In this paper, a multiphase field model was developed to study the short-time oxidation of steel at high temperatures. Even though three types of iron oxides can be found in the high temperature oxidation of steel, several works have reported than during early stages of oxidation (less than 5 min) only wüstite (FeO) is formed [31,41]. Following the experimental observations by Chen and Yuen [31], where they observed only the formation of the FeO oxide phase in a short time period of the oxidation of steel, our model considered only one phase of oxide, but the model was developed in a way that can be later advanced to study the multiphase oxidation of steels. The model incorporates both chemical and elastic energies and is capable of capturing outward oxide growth, elemental concentration changes as well as the evolution of induced stresses. Due to the very short duration of the oxidation, creep is not considered in this work. Different temperatures and geometries are considered to investigate the effect of these parameters on the interaction between generated stresses and oxide layer evolution.
2. Multi-Phase Field Model
A diffusion controlled multiphase field model was developed for the oxidation of metals. To mimic the oxidation process, three non-conserved parameters () are considered to represent three phases of metal (steel), oxide (FeO), and the phase containing oxygen (air). Two conserved parameters () are also considered to track the concentration (amount of material/vol.) of the oxygen and iron as the elements contributing in the oxidation to form the FeO phase. Including the fluid phase will allow us to capture the outward oxidation, which is the dominant case in the formation of FeO [11,31].
The total free energy of the system, , is considered to consist of chemical and elastic free energies:
where is the total chemical free energy, and is the elastic free energy as follows:
where is the chemical free energy density of the bulk; and are the gradient coefficients contributing to the interface properties between the different phases; is the number of reacting elements, which was two in our case for iron (Fe) and oxygen (O); and is the number of phases which was three for the metal (m), oxide (ox), and the fluid phase (air). We refer to these phases and elements by their mentioned abbreviated forms, O, Fe, m, ox, and air. Following the approach used in the literature [42], has the following form:
where is an interpolation function that smoothly changes between 0 and 1 as changes from 0 to 1. The term represents the interface barrier, which along with the gradient coefficients control the interface properties. The last term in Equation (4) acts as a penalty term to enforce that the summation of non-conserved parameters is unity. The concentration dependent part of the free energy for each phase is represented by , which is assumed to be a quadratic function of concentrations. are concentration values chosen to be close to the equilibrium values, so the energy will be minimum close to those concentrations, and for numerical purposes, they have been scaled so that they range between 0 and 1. The concentrations of oxygen and iron in the oxide are , and the concentration of iron in the metal phase is . Parameters A and B are used to create common tangent lines with tangent points close to equilibrium concentrations.
is the difference of Gibbs energy of formation at the desired temperature and room temperature: . Temperature dependent relations to calculate are given in Equation (7), and parameters through can be found in the National Institute of Standards and Technology (NIST) database [43].
In the elastic free energy contribution, Equation (3), is the elasticity tensor; is the elastic strain; and represents the spatial coordinate. The total elasticity tensor or is defined by the smooth interpolation between the elasticity tensors of each phase as below:
The elastic strain itself is defined by
where denotes the eigen strain, which contains the contribution of both phase transformation and thermal expansion. is the stress-free phase transformation strain, which is applied in the direction of the oxidation front and is calculated based on the Pilling–Bedworth Ratio (PBR). Since the transverse component of phase transformation strains are much smaller in comparison with the thermal expansion strains, they have been neglected in the transverse direction. PBR is defined by the ratio between the “volume of the oxide produced” to the “volume of the metal consumed”. The relation between stress-free transformation strain and PBR is given by the following equation [16,44]:
where is a correction factor [16,44] and is the thermal expansion coefficient. Considering small displacements, Equation (9) can be rewritten as
where represents the displacements at each spatial coordinate. To be able to validate and compare the PFM results with the experimental data, the isothermal condition was assumed and oxidation temperatures similar to experiments in [31] were chosen.
The governing equations of the PFM consist of three sets of coupled partial differential equations (PDEs) for the evolution of the non-conserved field variables (Allen–Cahn equation), conserved variables for tracking concentrations c (Cahn-Hilliard equation), and the mechanical equilibrium equation to control the evolution of stresses and strains as summarized below:
where is the structural relaxation coefficient and is the mobility. Mobility is proportional to diffusion coefficients through , which requires fifth order differentiation. To consider the changes in the mobility in each phase, the mobility is interpolated between phases according to the following relation
where is the mobility of element k (O, Fe) in phase i (m, ox, air). Since the concentrations are scaled, the exact value of the diffusion coefficients cannot be used. However, the ratio between is determined based on the ratio of diffusion coefficients. Since the diffusion coefficients change with temperature [45] the values for are modified proportionally. In this way, as changes based on phase and temperature, is also capable of capturing the changes based on phase and temperature. To make sure that the main factor in the evolution of the oxide is the diffusion of elements (diffusion-controlled reaction), relaxation parameters were selected to be at least one order of magnitude larger than the slowest mobility in each phase.
Interface properties such as interface thickness and interface energy are determined through model parameters and . Analytical relations to calculate the interface properties based on the model parameters are not always available, and numerical approaches should be used to match the simulated interface energy to its actual value. The reported energy for the FeO/air interface is [20]. However, to the best of our knowledge, no value for the metal/FeO interface has previously been reported. Thus, the same interface energy as in FeO/air was used here. Following the approach by Bair et al. [42] to determine the interface properties, initial tuning of the model parameters resulted in an interface thickness of and interface energy of . However, as it will be explained in the next section, higher values of and were used for two-dimensional (2D) simulations. The material properties and model parameters used for simulations are shown in Table 1.

Table 1.
Material properties and model parameters. Elastic constants are from [20,46], thermal expansion coefficient is from [47], and is calculated based on PBR = 1.67 for FeO and [44].
3. Simulation Results and Discussions
To benchmark the model against experiments, we used the data that reported oxide scale growth versus time of oxidation by Chen and Yuen [31]. The reported oxide phase that formed in short-time oxidation is FeO with a rock slat crystal structure that formed on the surface of the steel substrate. Steel will undergo phase transformation from Body-Centered Cubic (BCC) to Face-Centered Cubic (FCC) above 900 °C. However, since the experiments were done at steady-state temperatures below 900 °C, there was no phase transformation during the oxidation, hence no phase transformation in the oxide was considered in the simulations. It should be noted that oxidation temperature and phase change affect the elastic constants, thermal expansion, and mobilities (diffusion). These effects are considered by changing the material properties and model parameters accordingly. The composition of the studied steel is given in Table 2. It is worth emphasizing that even though other elements are present, only the diffusion of the iron and oxygen were tracked in the simulations since other elements did not form oxides (or other phases) in the short-time oxidation experiment [31].
Table 2.
Steel composition (wt%) used in the experiment [31].
We first completed one-dimensional (1D) simulations using an interface energy of . A narrow layer of oxide with a thickness of was initially placed in the middle of a long simulation domain, where metal and air phases were placed on the left and right side of this initial oxide, respectively, and the growth of the oxide layer at each time (t) was calculated by the difference between the instantaneous and initial thicknesses of the oxide layer. Zero displacements () and zero flux for phase-field (PF) variables ( and ) were assumed as boundary conditions. Since in reality the concentration of oxygen in air is much less than in the solid phases (metal and oxide), a much larger volume of air is required to provide the amount of oxygen for the formation of oxide. However, simulating such a large volume of air would be computationally very expensive and is not feasible. In addition, assuming a larger volume of air will serve no purpose to predict the stress distribution, which was the main objective of this study. As a result, to address this problem, a high concentration of was considered as the initial condition of oxygen in the air phase. The coupled governing Equations (12)–(14) were solved in a finite element scheme using the Multiphysics Object Oriented Simulation Environment (MOOSE) framework. Adaptive meshing was utilized to create a finer mesh where it was required and to guarantee that there were at least four or five elements through the diffusive interface of PFM; also, adaptive time stepping was used to ensure convergence.
1D simulations were performed at various temperatures ranging from 850 °C to 1180 °C to be able to compare the results with the experimental data [31]. As illustrated in Figure 1a, the predicted oxide growth by the PF model was in good agreement with experimental data for temperatures of 850 °C and 1000 °C, where a nonlinear (parabolic like) growth rate can be observed. To emphasize the need for the inclusion of elasticity in predicting the oxide growth, for the cases of 850 °C, we plotted the results both with and without considering elasticity, and the results clearly indicate that elastic strain energy needs to be considered. When the elastic strain energy is not considered, the effects of transformation strain and the expansion due to the formation of oxide will be neglected. This makes the formation of the oxide phase easier, hence an overestimation of oxide thickness was observed. The PFM simulations for higher temperatures also predicted a nonlinear growth, but the experiments showed a quasilinear trend. This can be due to the fact that the considered model for the concentration dependent energy, , has a quadratic form. Thus, as the oxygen and Fe are consumed, the driving force for diffusion of the species, which is proportional to , decreases linearly and therefore a nonlinear (inverse quadratic like) evolution of oxide is observed. Nonetheless, the PFM simulations predicted the final thickness of the oxide layer with a −2.3% error for T = 1100 °C and −3.9% error for T = 1180 °C when compared to the experiments at the same time of oxidation.
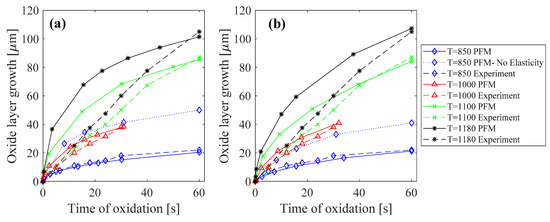
Figure 1.
Oxide layer growth at different temperatures (°C) for a diffusive interface thickness of (a) and (b) . Experimental results are obtained from [31].
The interface energy of corresponds to a very narrow interface thickness of about 40 nm, which requires a very fine mesh. Although this might not affect 1D simulations, it will make 2D simulations computationally very expensive, especially when the domain size is in the order of millimeters. Since mechanical equilibrium equations are not time dependent, only the thickness of the oxide layer will affect the generated stress. Thus, before running 2D simulations, we ran additional 1D simulations to see if we could increase the diffusive interface thickness without affecting the growth rate and thickness of the oxide layer. We increased the diffusive interface thickness from 40 nm to 800 nm (corresponding to ), and without the loss of generality, parameters and , which act as time constants, were scaled down to keep the oxide growth rate and the thickness of the oxide layer at each time, similar to the case with the actual interface energy. This scaling was done while the ratio between mobilities , which are related to diffusion coefficients, were preserved. Results of the oxide growth rate for this case are depicted in Figure 1b. As can be seen, the patterns were very similar to the cases in Figure 1a, especially for lower temperatures. For higher temperatures, the prediction of PFM simulation for the final oxide layer thickness only had a −3.5% error for oxidation at T = 1100 °C and +2.1% error for T = 1180 °C. This similarity between the oxide growth rates and the oxide thicknesses for thin and thick diffusive interfaces allowed us to use a thicker diffusive interface for the prediction of oxide induced stresses in 2D simulations.
Figure 2 shows the evolution of metal, oxide, air phases, and the corresponding concentrations with respect to their initial condition at the isothermal oxidation temperature of 850 °C. It is evident that the outward oxidation is dominant. Following the concentration evolution of Fe (Figure 2b), the concentration at metal/oxide interface dropped from at t = 0 s to the at t = 60 s, accounting for the migration of Fe atoms from the metal phase to oxide phase. Likewise, for the evolution of oxygen concentration, Figure 2c shows the reduction from to at the oxide/air interface due to the consumption of oxygen to form the oxide. This is one of the advantages of this model since the duration of oxidation can be controlled by adjusting the difference between the initial oxidant concentration and its equilibrium value.
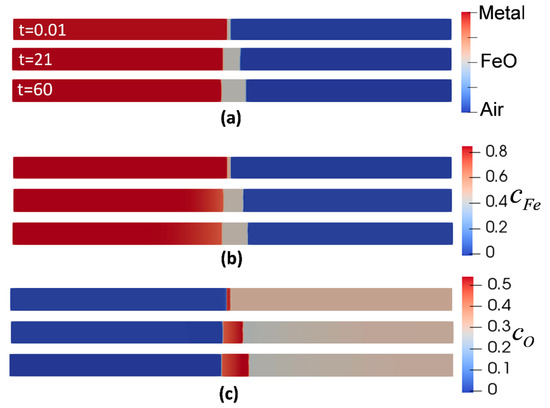
Figure 2.
Evolution of phase-field (PF) variables during oxidation at temperature of 850 °C. (a) phases (b) concentration of Iron (c) concentration of oxygen.
Even though 1D simulations can be used to study simple oxide growth, they are not sufficient for determining stresses, especially for different geometries. Simulations beyond 1D are required to account for thermal strains caused by mismatched thermal expansion coefficients of metal and oxide, stress-free transformation strains as well as mechanical constraints depending on geometries and boundary conditions. Since in our case the oxidation time was very short and creep did not happen, elastic 2D models can be used to study the oxide evolution and the induced stresses. Thus, to study the stresses generated by the oxidation, 2D simulations were performed. The effect of geometry was studied by considering oxidation in flat (planar) and corner-shape geometries. In addition, to investigate the effect of temperature, two extreme oxidation cases at 850 °C and 1180 °C were considered. Plane strain condition is imposed assuming the dimension in the z direction is much larger than the x- and y-directions. For the planar oxidation case, a narrow strip in the middle of a steel plate is considered with the x-direction representing the oxidation direction. No-flux boundary condition for PF variables were assumed and the mechanical boundary conditions are shown in Figure 3. It should be noted that due to the symmetry in the y-direction, only the top half was simulated to save the computational costs. Figure 3 summarizes the results for oxidation at 850 °C.
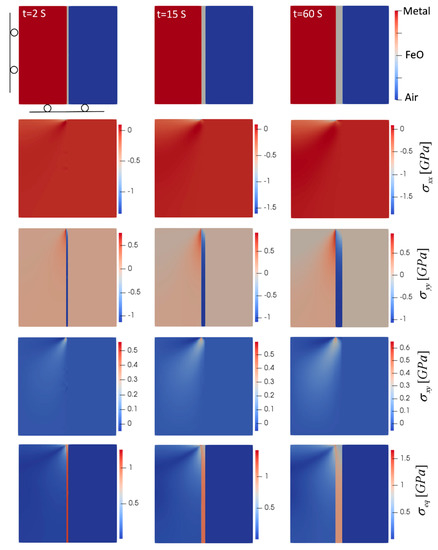
Figure 3.
Oxide layer growth and evolution of induced stresses in planar oxidation (T = 850 °C). Domain size is 0.5 mm × 0.5 mm. Top left snapshot also shows the mechanical boundary conditions.
As the oxide layer forms, it tends to expand due to the stress-free phase transformation and thermal strains, but the interaction with the metal phase prevents this expansion to be free of stress. In the case of planar oxidation, the expansion of oxide in the y-direction is constrained by the metal. Thus, the oxide goes under compression and the metal goes under tension. The compressive stress in the y-direction, , in the oxide phase, is the maximum at the bottom of the domain in Figure 3, which is the furthest away from the upper free edge and where the expansion in y-direction is prevented the most. This stress gradually decreases toward the upper free edge. On the other hand, since the stress generated in the metal is induced by oxide expansion, the maximum tensile stress in the y-direction in the metal increases toward the top edge. In the x-direction, since the oxide can expand freely, there generated stress, , is negligible (less than 10 MPa) in the oxide phase.
At the metal/oxide interface near the upper free edge in Figure 3, the expansion of oxide in the y-direction on one side and the prevention of movement in the x-direction by metal on the other side create a local counterclockwise bending of the metal/oxide interface. This causes the metal phase to experience a highly localized compressive stress in the x-direction. The trend of stress evolution shows that as the oxide layer evolves, the force it applies on the metal phase increases, hence the generated stresses increase. Looking at the stress maps in Figure 3, these incremental increases in stresses were more noticeable. According to the stress maps, two critical regions could be detected. The first is the metal/oxide interface at the top edge, which shows the maximum equivalent (von Mises) () and the maximum shear stress (). Additionally, maximum compressive () and tensile () normal stresses were observable at this region. In addition, the other criterion that makes this region critical is the transition between compression and tension in the normal stresses. Since the strength is usually lower at the interface of two phases, this region is susceptible to failure and delamination/separation of oxide from the metal substrate may occur. The other critical region that is at risk of failure is at the bottom edge of the oxide phase, which experiences the maximum compressive normal stress as well as high levels of von Mises stress. Since this compressive stress acts on a plane parallel to the oxide/metal interface and perpendicular to the oxide growth direction, any small surface irregularities can initiate spalling and buckling of the oxide scale [19].
To investigate the effect of geometry on the oxide growth and generated stress, oxidation at a sharp corner of a steel plate was considered. In this case, the oxide front is in both the x- and y-directions, and the z direction represents the long dimension along the edge of the steel plate. The results for this case are illustrated in Figure 4. In terms of stress state, the oxide and metal phase undergo compression and tension, respectively, which is similar to the planar case. However, as the oxide layer grows and becomes thicker, the stress levels decrease, which is different from the observed pattern in the planar case where the stress levels increase as the oxide grows. The reason for such behavior can be explained by the shape of oxide growth. Stress distribution at the initial stage of oxidation revealed high levels of stress at the metal/oxide interface right at the sharp corner, where expansion of the oxide in both the x- and y-directions, accompanied by the sharp corner geometry, led to stress intensity at this region. As oxidation continues, instead of keeping those sharp corners, the oxide evolves to round the sharp corners at both metal/oxide and oxide/air interfaces, which reduce the stress concentrations at those areas. This smoothing and rounding of the corners have also been observed in the oxidation of Si [48].
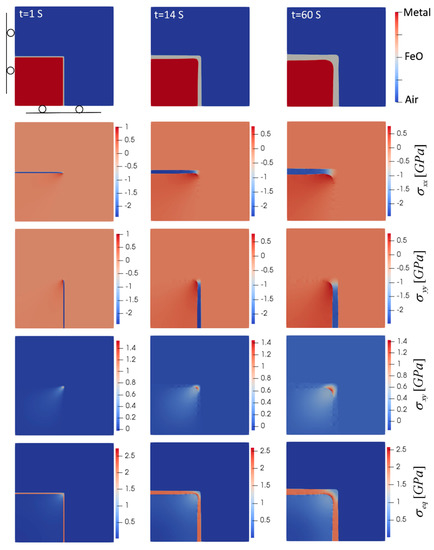
Figure 4.
Oxide layer growth and evolution of induced stresses for the oxidation of a sharp corner (T = 850 °C). Domain size is 0.5 mm × 0.5 mm.
In Figure 4, in terms of critical areas, the inner corner of the metal/oxide interface is one of the zones where the highest level of equivalent (von Mises), shear and normal stresses occurred in both the oxide and metal phase. This high level of stress with a sharp transition between compression and tension from one side to the other side of the interface makes this region prone to failure and makes it possible to separate the oxide from the base metal. A high level of compressive stress along the oxide layer and far from the corner was observed, which increased the chance of buckling, similar to the case of planar oxidation. It should be noted that in all of these cases, the highest level of stress was observed in the oxide layer, which did not show plastic behavior. Stress levels in the metal phase were also less than 1 GPa in this short-time oxidation, which was below the yield strength of several steels [49].
The effect of increasing the oxidation temperature on oxide growth and the induced stresses was considered by repeating the simulation for 1180 °C. It is expected that increasing the temperature increases the oxidation kinetics, thus thicker oxide layers form. The results showed that elevating the temperature did not change the pattern of stress distribution and stress states, and the maximum and minimum stresses occurred at the same regions as in the lower oxidation temperature of 850 °C. The trend of increasing or decreasing of stress versus time also remained unchanged for both planar and sharp corner oxidation. However, the stress values varied as the temperature increased. For the purpose of comparison, variations of the extremum values of stresses are presented in Figure 5, for both planar and sharp corner oxidation.
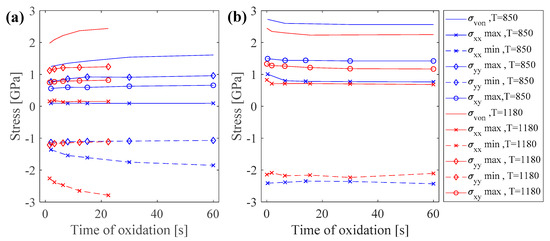
Figure 5.
Variations of stress levels for oxidation at 850 °C and 1180 °C for (a) planar oxidation, and (b) sharp corner oxidation.
Increasing the temperature resulted in increasing the stress levels in both the metal and oxide in the case of planar oxidation, while stress levels were decreased in the oxidation of a sharp corner. Increasing the temperature has effects on both elastic constants and thermal expansion strains. This increase in oxidation temperature from 850 °C to 1180 °C resulted in about a 30% reduction of the elastic constants. For the planar oxidation, the oxide could move freely in the x-direction, but it was constrained in the y-direction due to its interface with the base metal. Additionally, for planar oxidation in the y-direction, the main dominant component of the eigen strain was thermal expansion. Comparing the eigen strains of oxide in the y-direction () for planar oxidation showed a significance increase of 54% from 0.013 to 0.02 when the temperature increased from 850 °C to 1180 °C. Thus, the increase in eigen strain in the y-direction was more dominant than the decreases in elastic constants, which led to elevated stress levels. On the other hand, in the case of oxidation of a sharp corner, there were two oxidation fronts in both the x- and y-directions. Furthermore, the contribution of phase transformation strain (0.02) was added to the same thermal expansion strain in the case of planar oxidation, resulting in a change of eigen strain from 0.033 to 0.04 when the temperature increased from 850 °C to 1180 °C. This resulted in only a 21% increase in the eigen strain and makes the reduction in elastic constants more dominant, hence reducing the stress levels.
4. Conclusions
Stress evolution during the short-time oxidation of low alloy steels at high temperatures was studied utilizing a phase-field model. The phase-field model was capable of capturing the outward growth of the oxide layer (FeO) on the steel substrate in contact with air as well as variations in iron and oxygen concentrations during oxidation. By incorporating elastic strain energy in the model and coupling mechanical equilibrium equations to the phase-field equations, the evolution of stresses during the oxidation was investigated. The effect of geometry on the interaction between oxide evolution and induced stresses was studied by considering oxidation on a flat substrate (planar oxidation) and a sharp corner. Results revealed that in the case of planar oxidation, the growth of oxide increased the stress level in both the oxide and base metal. However, stress intensities in the sharp corners may change the shape of oxide evolution, and the oxide layer evolves so that it rounds the sharp corners in order to reduce the stress levels.
In addition, the effect of temperature elevation was investigated by considering two extreme temperatures of 850 °C and 1180 °C. Results showed that increasing the temperature changes the stress levels by altering the elastic constants and eigen strains, and depending on which one is dominant, the stress level may increase (planar oxidation) or decrease (sharp corner oxidation). Using the stress distribution map, critical zones that are prone to different modes of failure such as delamination and buckling can also be detected. The developed multiphase field model has the flexibility to be extended for the study of multiphase oxidation. Additionally, plasticity (especially for long-time oxidation) and crack propagation equations [50] can be incorporated to develop a more comprehensive model to study oxidation induced cracks and deformations.
Author Contributions
A.T.: Conceptualization, methodology, software, formal analysis, and writing—original draft preparation. M.A.Z.: Conceptualization, methodology, formal analysis, writing—review and editing, supervision, and funding acquisition. All authors have read and agreed to the published version of the manuscript.
Funding
Authors would like to acknowledge the funding support from the U.S. National Science Foundation (grant numbers: CMMI 1507436 and CMMI 1911280) and ACS Petroleum Research Funds (55941-DNI10).
Acknowledgments
Authors are grateful for the computer time allocation provided by the Extreme Science and Engineering Discovery Environment (XSEDE), award number TG-DMR140008.
Conflicts of Interest
The authors declare no conflict of interest.
References
- Allen, T.; Busby, J.; Meyer, M.; Petti, D. Materials challenges for nuclear systems. Mater. Today 2010, 13, 14–23. [Google Scholar] [CrossRef]
- Zinkle, S.J.; Was, G. Materials challenges in nuclear energy. Acta Mater. 2013, 61, 735–758. [Google Scholar] [CrossRef]
- Birks, N.; Meier, G.H.; Pettit, F.S. Introduction to the High Temperature Oxidation of Metals; Cambridge University Press: Cambridge, UK, 2006. [Google Scholar]
- Jha, R.; Haworth, C.W.; Argent, B.B. The formation of diffusion coatings on some low-alloy steels and their high temperature oxidation behaviour: Part 1 diffusion coatings. Calphad 2001, 25, 651–665. [Google Scholar] [CrossRef]
- Aslam, I.; Li, B.; Martens, R.L.; Goodwin, J.; Rhee, H.; Horstemeyer, M.F.; Goodwin, F.E. Site-Specific Studies on the Interfacial Structures of Galvanized Dual Phase Steels. In Characterization of Minerals, Metals, and Materials 2016; Springer International Publishers: Cham, Switzerland, 2016; pp. 183–192. [Google Scholar]
- Marder, A. The metallurgy of zinc-coated steel. Prog. Mater. Sci. 2000, 45, 191–271. [Google Scholar] [CrossRef]
- Chang, Y.N.; Wei, F.I. High temperature oxidation of low alloy steels. J. Mater. Sci. 1989, 24, 14–22. [Google Scholar] [CrossRef]
- Chen, R.; Yuen, W. Oxidation of low-carbon, low-silicon mild steel at 450–900 C under conditions relevant to hot-strip processing. Oxid. Met. 2002, 57, 53–79. [Google Scholar] [CrossRef]
- Chen, R.; Yeun, W. Review of the high-temperature oxidation of iron and carbon steels in air or oxygen. Oxid. Met. 2003, 59, 433–468. [Google Scholar] [CrossRef]
- Hsueh, C.-H.; Evans, A.G. Oxidation induced stresses and some effects on the behavior of oxide films. J. Appl. Phys. 1983, 54, 6672–6686. [Google Scholar] [CrossRef]
- Asle Zaeem, M.; El Kadiri, H. An elastic phase field model for thermal oxidation of metals: Application to zirconia. Comput. Mater. Sci. 2014, 89, 122–129. [Google Scholar] [CrossRef]
- Evans, H. Stress effects in high temperature oxidation of metals. Int. Mater. Rev. 1995, 40, 1–40. [Google Scholar] [CrossRef]
- Huntz, A. Scale growth and stress development. Mater. Sci. Technol. 1988, 4, 1079–1088. [Google Scholar] [CrossRef]
- Tolpygo, V.; Clarke, D. Competition between stress generation and relaxation during oxidation of an Fe-Cr-Al-Y alloy. Oxid. Met. 1998, 49, 187–212. [Google Scholar] [CrossRef]
- Juricic, C.; Pinto, H.; Cardinali, D.; Klaus, M.; Genzel, C.; Pyzalla, A. Evolution of microstructure and internal stresses in multi-phase oxide scales grown on (110) surfaces of iron single crystals at 650 °C. Oxid. Met. 2010, 73, 115–138. [Google Scholar] [CrossRef]
- Dong, X.; Feng, X.; Hwang, K.-C. Stress–diffusion interaction during oxidation at high temperature. Chem. Phys. Lett. 2014, 614, 95–98. [Google Scholar] [CrossRef]
- Echsler, H.; Ito, S.; Schütze, M. Mechanical Properties of Oxide Scales on Mild Steel at 800 to 1000 °C. Oxid. Met. 2003, 60, 241–269. [Google Scholar] [CrossRef]
- Schütze, M. Stresses and decohesion of oxide scales. Mater. Sci. Technol. 1988, 4, 407–414. [Google Scholar] [CrossRef]
- Schütze, M. Mechanical properties of oxide scales. Oxid. Met. 1995, 44, 29–61. [Google Scholar] [CrossRef]
- Robertson, J.; Manning, M. Limits to adherence of oxide scales. Mater. Sci. Technol. 1990, 6, 81–92. [Google Scholar] [CrossRef]
- Moelans, N.; Blanpain, B.; Wollants, P. An introduction to phase-field modeling of microstructure evolution. Calphad 2008, 32, 268–294. [Google Scholar] [CrossRef]
- Provatas, N.; Elder, K. Phase-Field Methods in Materials Science and Engineering; John Wiley & Sons: Hoboken, NJ, USA, 2011. [Google Scholar]
- Steinbach, I. Phase-field models in materials science. Model. Simul. Mater. Sci. Eng. 2009, 17, 73001. [Google Scholar] [CrossRef]
- Durga, A.; Wollants, P.; Moelans, N. Aquantitative phase-field model for two-phase elastically inhomogeneous systems. Comput. Mater. Sci. 2015, 99, 81–95. [Google Scholar] [CrossRef]
- Asle Zaeem, M.; Mesarovic, S.D. Finite element method for conserved phase fields: Stress-mediated diffusional phase transformation. J. Comput. Phys. 2010, 229, 9135–9149. [Google Scholar] [CrossRef]
- Wen, Y.-H.; Chen, L.-Q.; Hawk, J.A. Phase-field modeling of corrosion kinetics under dual-oxidants. Model. Simul. Mater. Sci. Eng. 2012, 20, 35013. [Google Scholar] [CrossRef]
- Nijdam, T.; Jeurgens, L.; Sloof, W. Modelling the thermal oxidation of ternary alloys—Compositional changes in the alloy and the development of oxide phases. Acta Mater. 2003, 51, 5295–5307. [Google Scholar] [CrossRef]
- Nijdam, T.; Sloof, W. Modelling of composition and phase changes in multiphase alloys due to growth of an oxide layer. Acta Mater. 2008, 56, 4972–4983. [Google Scholar] [CrossRef]
- Krishnamurthy, R.; Srolovitz, D. Stress distributions in growing oxide films. Acta Mater. 2003, 51, 2171–2190. [Google Scholar] [CrossRef]
- Krishnamurthy, R.; Srolovitz, D. Stress distributions in growing polycrystalline oxide films. Acta Mater. 2004, 52, 3761–3780. [Google Scholar] [CrossRef]
- Chen, R.Y.; Yuen, W. Short-time Oxidation Behavior of Low-carbon, Low-silicon Steel in Air at 850–1180 °C—I: Oxidation Kinetics. Oxid. Met. 2008, 70, 39–68. [Google Scholar] [CrossRef]
- Abuluwefa, H. Kinetics of High Temperature Oxidation of High Carbon Steels in Multi-Component Gases Approximating Industrial Steel Reheat Furnace Atmospheres. In Proceedings of the International MultiConference of Engineering and Computer Science, Hong Kong, China, 14–16 March 2012. [Google Scholar]
- Chandra-ambhorn, S.; Hayashi, S.; Latu-Romain, L.; Wongpromrat, P. High Temperature Oxidation of Stainless Steels, in Solid State Phenomena. Trans. Tech. Publ. 2020, 300, 81–106. [Google Scholar]
- Choi, Y.; Park, K.-S.; Jeong, T.-K.; Lee, J.; Suh, D.-W. Oxidation behavior in Si-containing low-carbon steels. Mater. Sci. Technol. 2017, 33, 991–997. [Google Scholar] [CrossRef]
- Wei, L.; Zheng, J.; Chen, L.; Misra, R.D.K. High temperature oxidation behavior of ferritic stainless steel containing W and Ce. Corros. Sci. 2018, 142, 79–92. [Google Scholar] [CrossRef]
- Chandra-ambhorn, S.; Jutilarptavorn, A.; Rojhirunsakool, T. High temperature oxidation of irons without and with 0.06 wt.% Sn in dry and humidified oxygen. Corros. Sci. 2019, 148, 355–365. [Google Scholar] [CrossRef]
- Hao, M.; Sun, B.; Wang, H. High-Temperature Oxidation Behavior of Fe–1Cr–0.2 Si Steel. Materials 2010, 13, 842–847. [Google Scholar]
- Zhou, H.; Qu, J.; Cherkaoui, M. Finite element analysis of oxidation induced metal depletion at oxide–metal interface. Comput. Mater. Sci. 2010, 48, 842–847. [Google Scholar] [CrossRef]
- Zhou, H.; Qu, J.; Cherkaoui, M. Stress–oxidation interaction in selective oxidation of Cr–Fe alloys. Mech. Mater. 2010, 42, 63–71. [Google Scholar] [CrossRef]
- Yang, F.; Liu, B.; Fang, D.-N. Analysis on high-temperature oxidation and growth stress of iron-based alloy using phase field method. Appl. Math. Mech. 2011, 32, 757–764. [Google Scholar] [CrossRef]
- Bolt, P.H. Understanding the properties of oxide scales on hot rolled steel strip. Steel Res. Int. 2004, 75, 399–404. [Google Scholar] [CrossRef]
- Bair, J.; Asle Zaeem, M.; Schwen, D. Formation path of δ hydrides in zirconium by multiphase field modeling. Acta Mater. 2017, 123, 235–244. [Google Scholar] [CrossRef]
- Chase, M.W., Jr. NIST-JANAF Thermochemical Tables. J. Phys. Chem. Ref. Data 1998, 9, 1–1961. [Google Scholar]
- Touati, A.; Roelandt, J.; Armanet, F.; Beranger, G. Simulation of the Behaviour of High Temperature Oxidized Structures (Application to Coatings). In International Conference on Advanced Materials; Compos. Mater: Amsterdam, The Netherlands, 1992; pp. 233–238. [Google Scholar]
- Amami, B.; Addou, M.; Monty, C.J. Selfdiffusion and point defects in iron oxides: FeO, Fe3O4, α-Fe2O3, in Defect and Diffusion Forum. Trans. Tech. Publ. 2001, 194, 1051–1056. [Google Scholar]
- Fukuhara, M.; Sanpei, A. Elastic moduli and internal friction of low carbon and stainless steels as a function of temperature. ISIJ Int. 1993, 33, 508–512. [Google Scholar] [CrossRef]
- Parkinson, G.S. Iron oxide surfaces. Surf. Sci. Rep. 2016, 71, 272–365. [Google Scholar] [CrossRef]
- Mescheder, U.; Khazi, I. Corner rounding of sharp silicon punching tool edges by local oxidation of silicon. Microelectron. Eng. 2015, 141, 178–183. [Google Scholar] [CrossRef]
- Garrison, W. Ultrahigh-strength steels for aerospace applications. JOM 1990, 42, 20–24. [Google Scholar] [CrossRef]
- Emdadi, A.; Fahrenholtz, W.G.; Hilmas, G.E.; Asle Zaeem, M. A modified phase-field model for quantitative simulation of crack propagation in single-phase and multi-phase materials. Eng. Fract. Mech. 2018, 200, 339–354. [Google Scholar] [CrossRef]


© 2020 by the authors. Licensee MDPI, Basel, Switzerland. This article is an open access article distributed under the terms and conditions of the Creative Commons Attribution (CC BY) license (http://creativecommons.org/licenses/by/4.0/).