Article

Precipitation Versus Partitioning Kinetics during the Quenching of Low-Carbon Martensitic Steels

1
Materials and Mechanical Engineering, Centre for Advanced Steels Research, University of Oulu, 90014 Oulu, Finland
2
Kerttu Saalasti Institute, University of Oulu, Pajatie 5, FI-85500 Nivala, Finland
3
Department of Materials, University of Oxford, Parks Road, Oxford OX1 3PH, UK
*
Author to whom correspondence should be addressed.
Metals 2020, 10(7), 850; https://doi.org/10.3390/met10070850
Submission received: 28 May 2020 / Revised: 22 June 2020 / Accepted: 25 June 2020 / Published: 27 June 2020

Abstract

:
Low-carbon, low-alloy steels undergo auto-tempering and carbon partitioning to austenite during quenching to martensite. The microstructures of two such steels quenched at two cooling rates have been evaluated using electron microscopy to characterise lath and carbide precipitate morphologies, and the results have been compared with theoretical predictions based on the Thermo-Calc modules DICTRA and TC-Prisma. The modelling tools predicted the carbon depletion rates due to diffusion from the bcc martensite laths into austenite and the precipitation of cementite in the ferrite matrix. The predictions showed a satisfactory agreement with the metallographic results, indicating that the Thermo-Calc based software can aid in the design of new low-carbon martensitic steels.

1. Introduction

Low-carbon martensitic steels have become important structural materials as they provide economical solutions in weight-critical applications by maximising their performance-to-weight ratio and thereby reducing their carbon footprint [1]. Such low-carbon martensitic steels are normally produced by fast cooling techniques to achieve the desired displacive martensitic transformation [2]. The morphology of martensite in low-carbon steels is lath-like [2,3]. The matrix becomes supersaturated with carbon during the rapid transformation from austenite to martensite at a relatively high martensitic start temperature (Ms). Due to the supersaturation of carbon in the martensite, there is a large driving force for the carbon to precipitate as a carbide [4,5]. This phenomenon is called auto-tempering [2]. The precipitation of carbides occurs at high-energy sites such as dislocations and grain boundaries [6]. Auto-tempering can also involve the partitioning of carbon from the martensite laths into inter-lath austenite partially stabilising some austenite to room temperature [7]. Auto-tempering has been shown to improve the formability of high strength steels [8]. A better understanding of the kinetics and thermodynamics that drive the auto-tempering process could lead to optimization of cooling strategies, and better online prediction of steel properties. There has been an attempt to quantitatively describe auto-tempering by Takaki et al. in 2017 [9] where, on the basis of carbon diffusion kinetics, they suggested that auto-tempering occurs within the temperature range of 500–350 °C and that rapid cooling above 40 °C/s should suppress the phenomenon [9]. However, auto-tempering has been observed in low-carbon steels quenched at rates exceeding 100 °C/s [5,10,11]. Therefore, a better understanding is required to predict the kinetics of precipitation during the quenching of low-carbon steels.
The current paper investigates auto-tempering and partitioning experimentally and theoretically. Low-carbon steels were quenched under controlled conditions and the samples characterized using electron microscopy. The observations were then compared with approximate calculations for partitioning using Thermo-Calc DICTRA (version 2019b, Thermo-Calc Software AB, Solna, Sweden) [12] and auto-tempering using TC-Prisma (version 2019b, Thermo-Calc Software AB, Solna, Sweden) [13].

2. Materials and Methods

Two low-carbon martensitic steels, coded 0.12C and 0.23C, were supplied as 12 mm thick hot-rolled plates with the compositions, as determined using glow discharge optical emission spectroscopy (GDOES Spectruma GDA 750 Analyser) (Spectruma Analytik GmbH, Hof, Germany), given in Table 1. Cylindrical specimens of dimensions 6 mm diameter and 9 mm length were machined from the hot-rolled plates with their long axes parallel to the main rolling direction. One set of specimens were then heated in a Gleeble 3800 thermomechanical simulator (Dynamic Systems Inc., Poestenkill, NY, USA) from 23 to 950 °C at 10 °C/s, held for 2 min to ensure complete austenitization, and quenched into a beaker of water to achieve a cooling rate of 1000 °C/s [10]. Another set of specimens was treated similarly but allowed to cool by heat conduction into the water-cooled aluminium jaw-carriers of the Gleeble at a rate of 120 °C/s. Using the methodology described by Ramesh Babu et al. [14], the martensite evolution curves were constructed as seen in Figure 1. The martensite start temperature (Ms) of the 0.12C and 0.23C steels were determined from dilatometry curves as 435 and 388 °C, respectively.
The heat-treated cylinders were cut in half transverse to their long axes at the position of the thermocouples used to control and record the thermal cycles. Before the grinding and polishing stage, the samples were cold mounted into an epoxy resin and then cured for 24 h. This was to prevent any additional tempering which would have been caused by the faster hot-mounting procedure, as highlighted by Ramesh Babu et al. [10]. The samples were then polished to a mirror finish using 0.04 µm colloidal silica and etched with a 2% Nital solution. The microstructure was examined with a Zeiss Sigma (Carl Zeiss AG, Oberkochen, Germany) scanning electron microscope (SEM) equipped with an InLens secondary electron detector using an accelerating voltage of 5 kV.
A JEOL 2200FS transmission electron microscopy (TEM) (JEOL Ltd., Akishima, Kantō, Japan) was used to analyse the auto-tempered precipitates. Thin-foil samples were prepared using the FEI Helios DualBeam Focused Ion Beam SEM (FIB-SEM) (FEI Company, Hillsboro, OR, United States) by milling lamellae with a Ga beam at 90 pA to 9 nA and 30 kV acceleration voltage. The lamellae were then lifted onto copper grids and thinned and polished with the FIB using 90 pA at 30 kV beam conditions. A final polishing stage was applied to minimise FIB damage using 44 pA at 5 kV. The auto-tempered precipitates were identified using selected area diffraction (SAD). The scanning transmission electron mode (STEM) on the JEOL 2200FS was used to characterise surface features. SAD patterns were indexed, and their corresponding zone axes determined using the open source MATLAB-based software Crystbox (version 1.10, Institute of Physics of the Czech Academy of Sciences, Prague, Czech Republic) [15]. The patterns were identified using the orthorhombic cementite lattice parameters a = 5.09 Å, b = 6.74 Å, c = 4.53 Å and the bcc martensite parameter a = b = c = 2.860 Å.
The diffusion of carbon and the growth of the precipitates were modelled using the DICTRA and TC-Prisma software packages of Thermo-Calc together with the thermodynamic database TCFE9 and the mobility database MOBFE2 [16].
DICTRA is a software which simulates diffusion controlled transformation in multicomponent alloys assuming a local equilibrium at interphase interfaces [12]. The software generates simple geometries such as planar, spherical, and cylindrical. The accuracy of the results is dependent on the thermodynamic and kinetic data and assumptions such as the choice of geometry [12]. DICTRA is based on a multi-component diffusion theory that describes the fluxes of species driven by a concentration gradient [12,17]. Mathematically, this was described as:
J k = j = 1 n 1 D k j n c j z ,
where J k is the flux of species k in the z-axis direction and c j z is the concentration gradient of species j. The diffusion coefficient D k j n is a product of two matrices where one consists of pure thermodynamic information and the other consists of mobilities [17]. Mathematically, when i is an interstitial, D k j n can be described as:
D k j n = i ( δ i k x k ) x i M i ( μ i x j ) ,
where δ i k is the Kroneker delta ( δ i k = 1 when j = k and δ i k = 0 otherwise) [12], x k is the mole fraction of element k, x i is the mole fraction of element i, μ i is the chemical potential of component i, and μ i x j is a thermodynamic factor [12], which can be related to a thermodynamic database [17]. M i is the mobility term for i when i is an interstitial and M i is related to the kinetic database. By the absolute-reaction theory argumentation, M i can be mathematically expressed as:
M i = M i 0 R T exp ( Q i R T ) ,
where R is the gas constant and T is the absolute temperature. The terms M i 0 and Q i depend on composition, temperature, and pressure.
Rather than the diffusivities, the parameters for atomic mobilities in a particular phase are stored in the kinetic databases used by DICTRA. This is due to the (n-1)2 interdiffusion coefficients and n mobilities. Therefore, fewer mobilities need to be stored than diffusivities for systems with more than two components [12].
TC-Prisma primarily uses the Langer-Schwartz theory and the Kampmann-Wagner numerical approach to simulate diffusion controlled nucleation, growth, and dissolution of precipitates [13]. TC-Prisma is integrated with the CALPHAD databases in Thermo-Calc and uses the diffusion calculations in DICTRA [13]. TC Prisma extends the classical nucleation theory (CNT) [18,19] to multi-component alloy systems [20]. The time dependent nucleation rate J ( t ) is given as:
J ( t ) = J s   e x p ( τ t ) ,
where J s is the steady state nucleation rate, τ is the incubation time for establishing steady state nucleation conditions, and t is the isothermal reaction time. The temperature dependency of parameters such as nucleation driving force, diffusivities, etc. are automatically updated during the simulation for non-isothermal conditions [20]. For non-isothermal conditions, the incubation time is calculated from:
0 τ β * ( t ) d t = 1 θ Z 2 ( τ ) ,
where β * is the impingement rate for solute atoms to the critical cluster and Z is the Zeldovich factor.
The steady state nucleation rate J s is given by:
J s = Z β * N e x p ( Δ G * k T ) ,
where N is the density of nucleation sites per unit volume, k is Boltzmann’s constant, T is the absolute temperature, and Δ G * is the activation energy for the formation of a critical nucleus and given by:
Δ G * = 16 π σ 3 3 ( Δ G m α β / V m β ) ,
where σ is the interfacial energy, Δ G m α β is the molar driving force for the formation of a precipitate phase β from the matrix phase α , and V m β is the molar volume of the precipitate phase β .
In a crystalline material, nucleation on dislocations gives the nucleation site density as:
N d = ρ d ( N A V m α ) ,
where ρ d is the dislocation density, N A is Avogadro’s number, and V m α is the molar volume of the matrix phase α .
The TC-Prisma growth model approximates precipitates as spheres with a stoichiometric composition and assumes a local equilibrium at the interface of the precipitate and the matrix. The growth model can be expressed as:
v = K r [ Δ G m 2 σ V m β r ]   = 2 σ V m β K r [ 1 r * 1 r ]
where Δ G m is the driving force for nucleation, r * is the radius of the critical nucleus, and K is a kinetic parameter related to solute concentration and mobility. An advanced growth model based on the work of Chen et al. [21] was implemented as it treats fast diffusing interstitial elements such as C and high supersaturation conditions [20].
The limitations of the modelling arise from the assumptions needed to run the simulations such as the choice of dislocation density and interfacial energy [22]. Therefore, reasonable assumptions as stated in the following section are required to obtain results that best represent the experimental results. The major limitation in this paper was that the TC-Prisma calculations assume that there is no loss of carbon by diffusion from martensite into the surrounding austenite during quenching. Such a loss would lead to a reduction in the driving force for nucleation and growth of the precipitates. Therefore, the calculations for the paper are approximate. However, as will be seen in the following section, the ball-park approximations correspond well with experimental observations.

3. Results and Discussion

3.1. Material Characterization

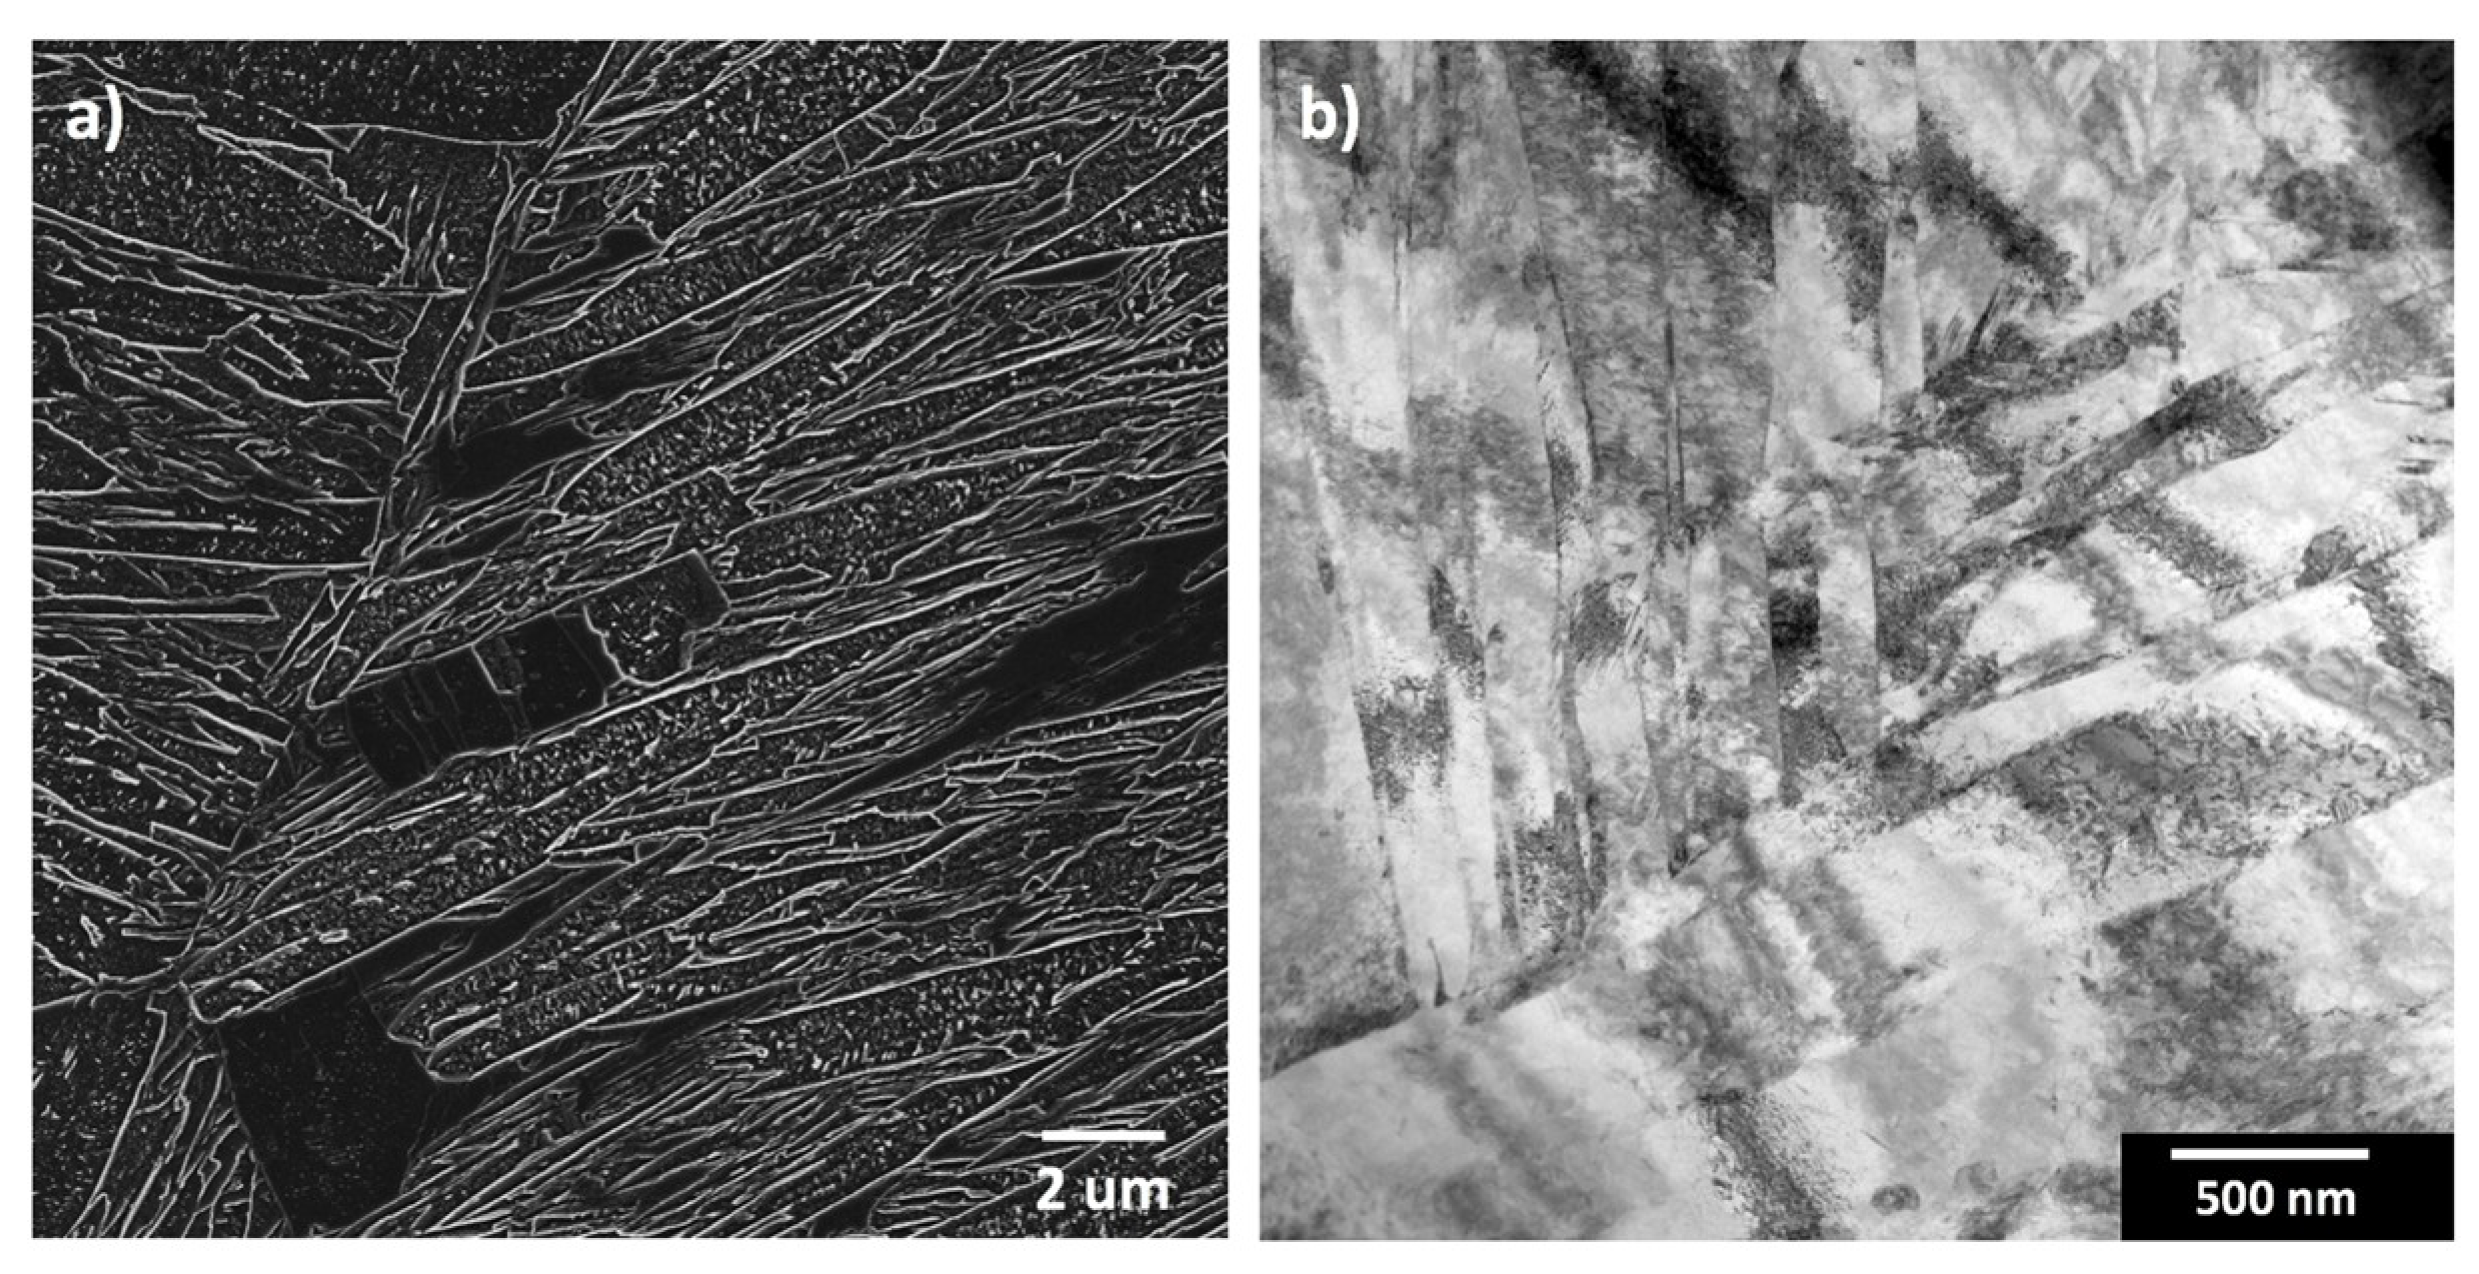
The 0.12C steel quenched at 1000 °C/s shows an auto-tempered lath martensite, as witnessed by the precipitates seen in Figure 2a. These precipitates were previously identified as cementite [10]. The lath morphology, which is typical of low-carbon steels, can be seen more clearly in the STEM image of Figure 2b. The microstructure comprises of coarse martensitic laths with a high degree of auto-tempered cementite, thin martensitic ridge-like regions, without visible carbides, and dark islands with minimal or no precipitates [4,5]. The coarse regions are the first to form just under the Ms temperature, while the relatively dark regions are the last to form [5,23]. The widths of the coarse martensitic laths as seen on the random cross-sections are typically 1 to 5 um and the smaller laths are about 100 nm wide. These mixtures of coarse and thin laths are typical for as-quenched low-carbon steels [23,24].
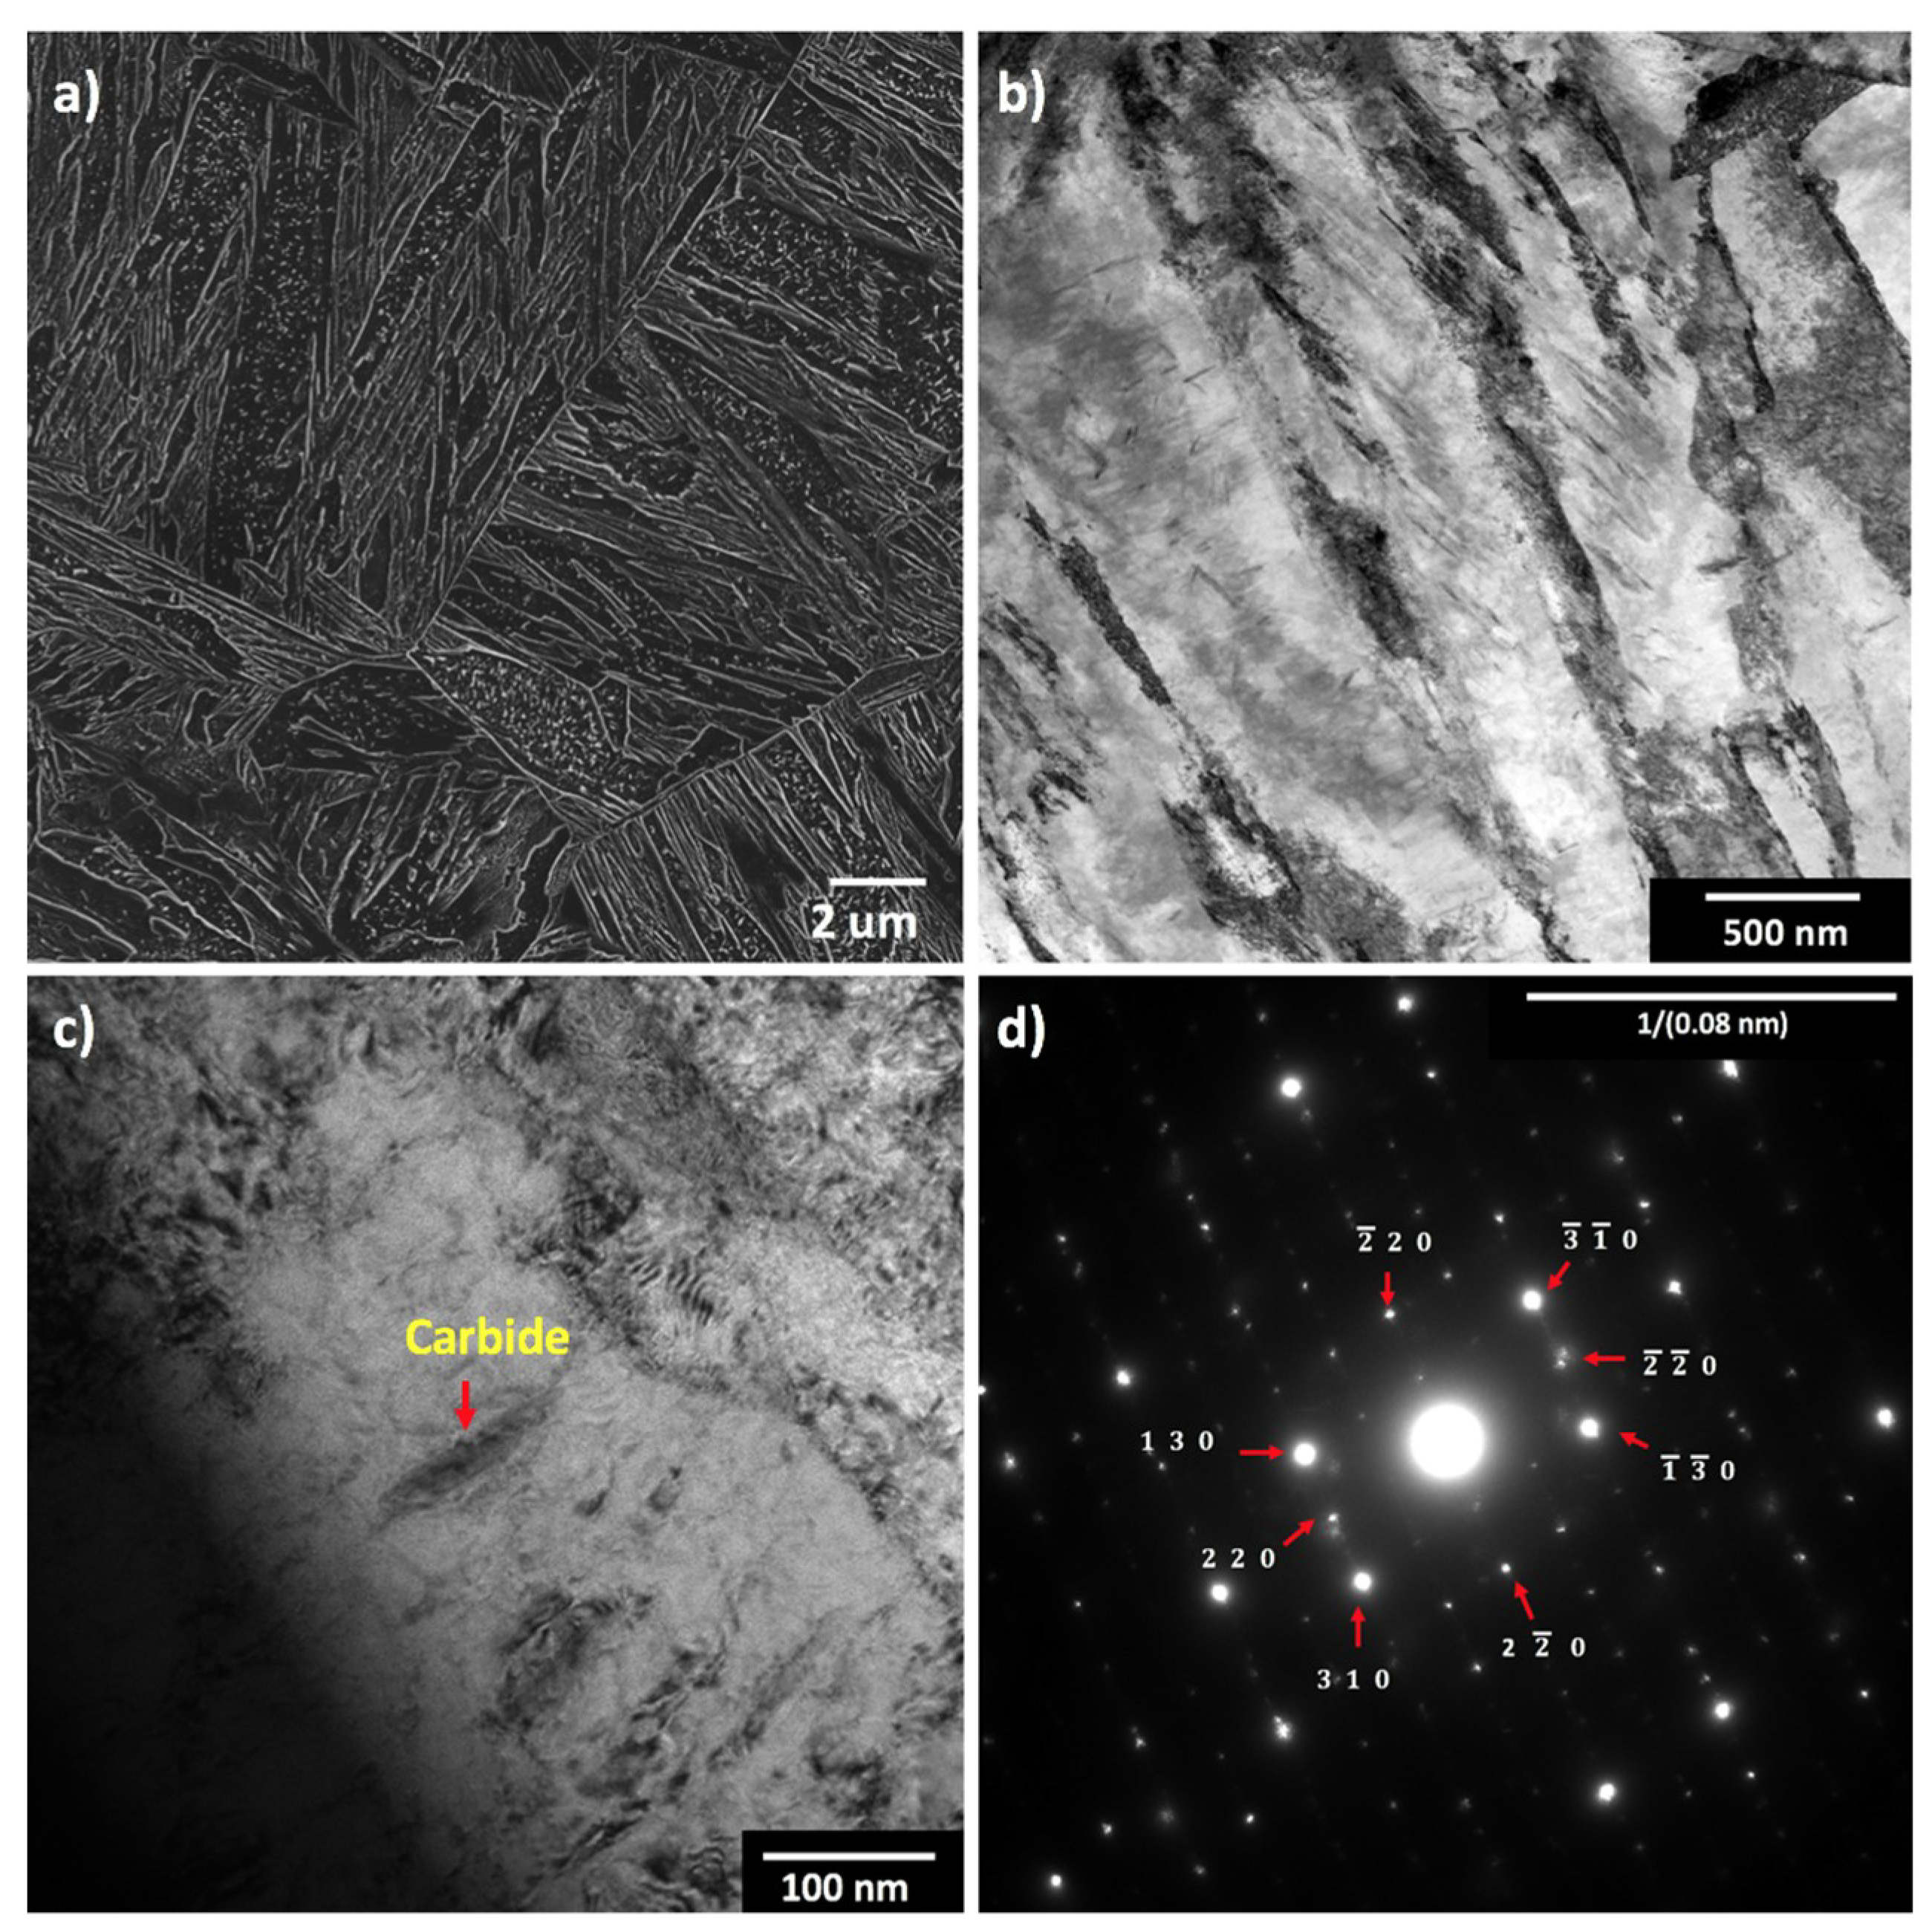
Figure 3 shows that the 0.12C steel quenched at 120 °C/s had a similar microstructure to that of the specimen quenched at 1000 °C/s (Figure 2a). Here too, the precipitates were identified as cementite on the basis of SAD, as shown in Figure 3d. No evidence of other carbides was apparent.
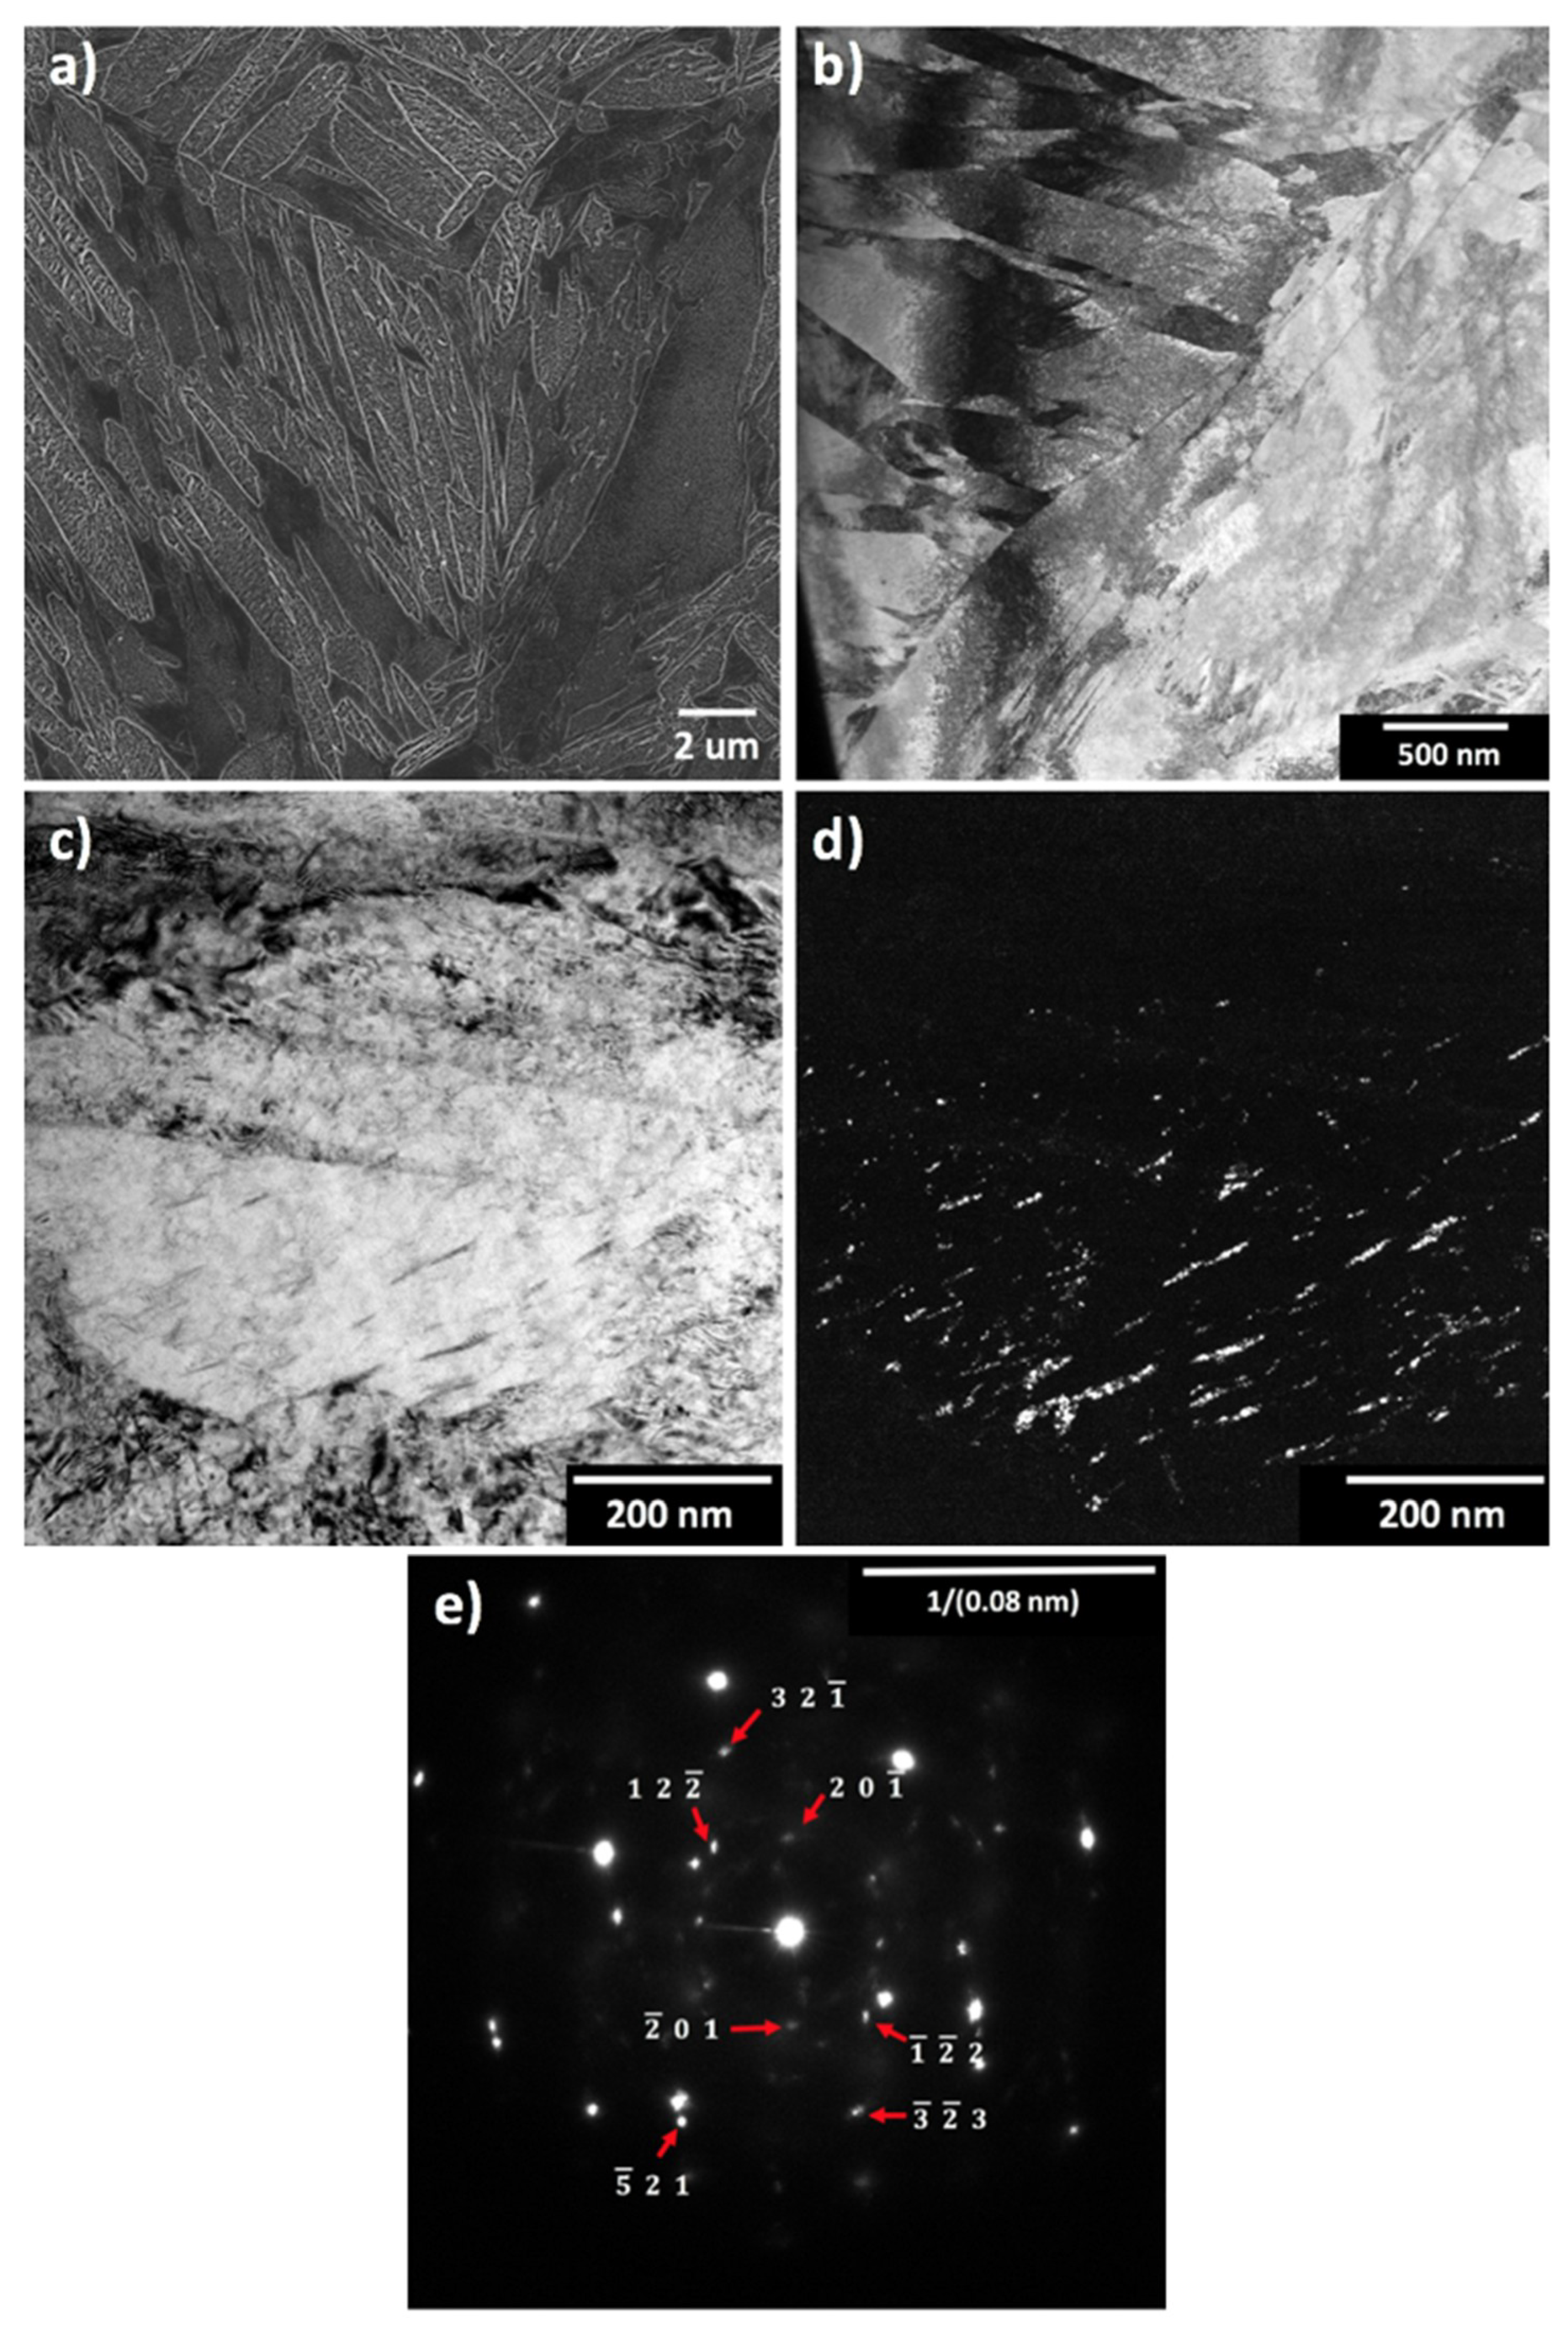
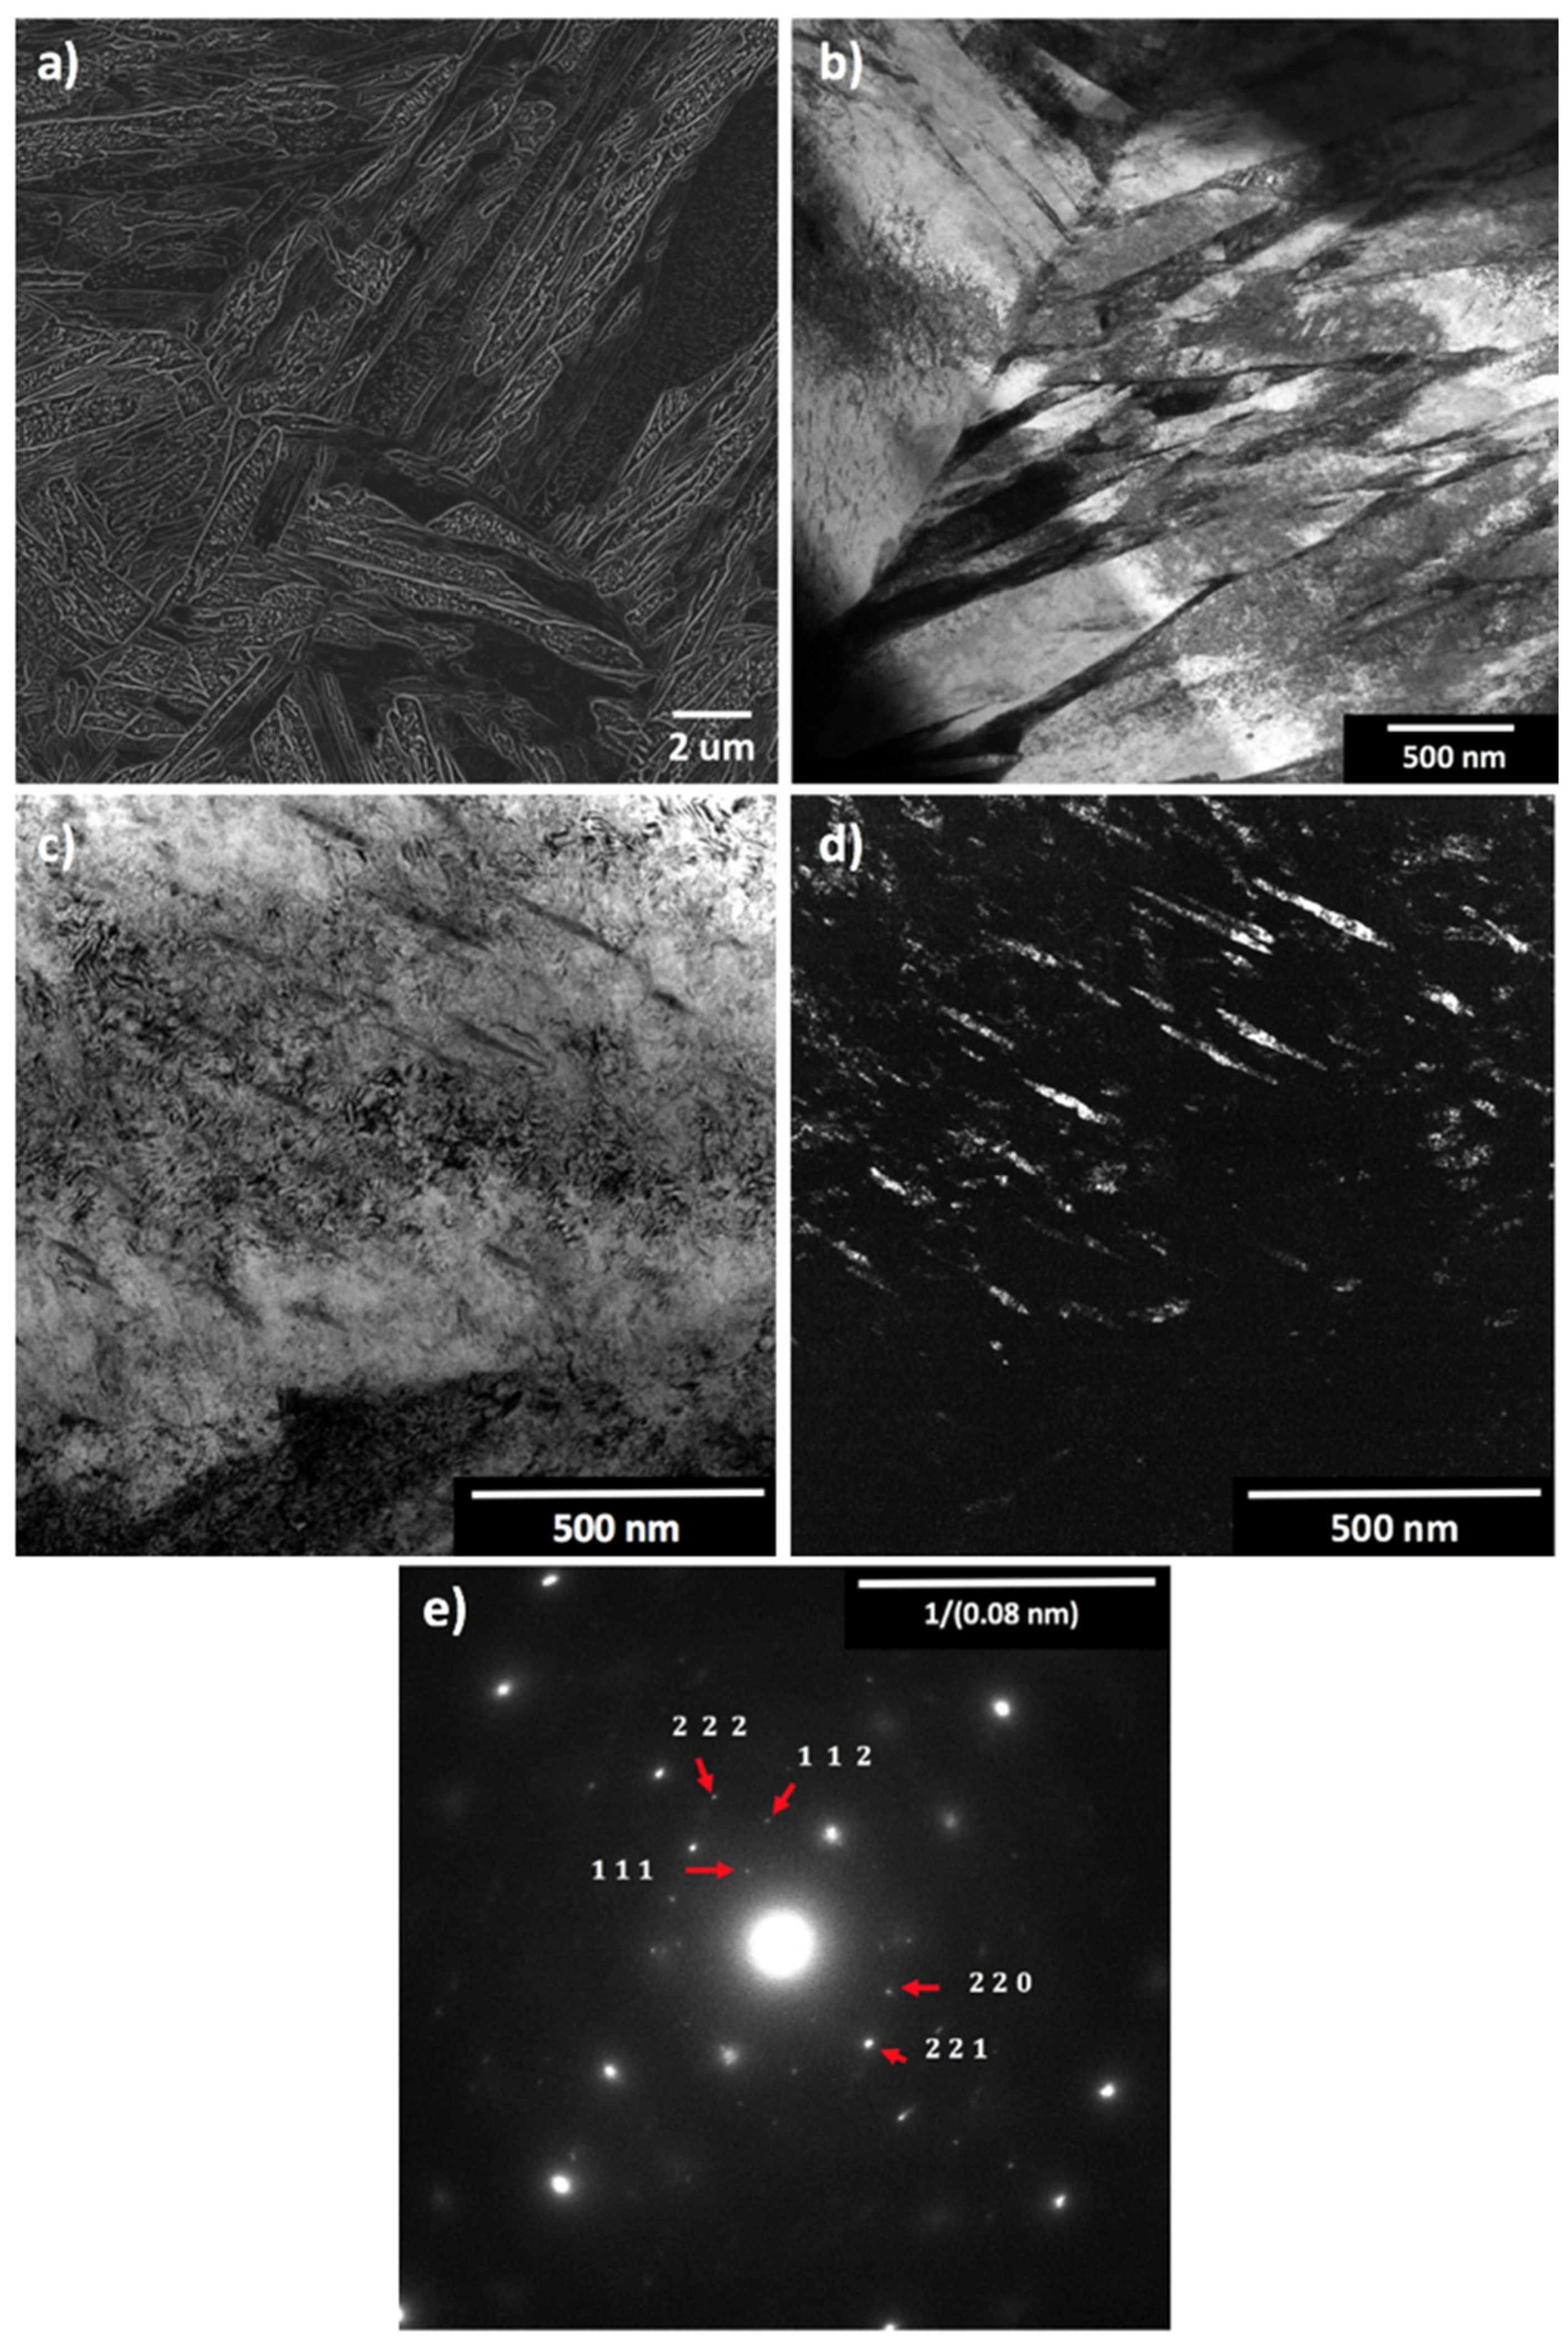
The microstructures of the 0.23C steel quenched at 1000 and 120 °C/s are shown in Figure 4 and Figure 5, respectively. This steel also exhibited lath martensite with a high degree of auto-tempering. There are more well-defined coarse auto-tempered regions in the 0.23C steel when compared to the 0.12C steel (~20 coarse regions were detected within the 0.23C steel when compared to 11 in a 100 um2 area for the 0.12C steel). In addition, ridge-like martensitic regions cannot be seen in the quenched 0.23C steel unlike in the quenched 0.12C steel. The relatively dark regions showed some signs of auto-tempering, unlike the generally untempered darker regions in the quenched 0.12C steel. The STEM images in Figure 4b and Figure 5b show that the narrow laths of the 0.23C steel had similar thicknesses when compared to the laths in the quenched 0.12C steel. Again, the precipitates shown in the TEM micrographs in Figure 4c,d and Figure 5c,d were identified as cementite, as shown in Figure 4e and Figure 5e, respectively. No evidence of other types of carbides was found in the analysis.

3.2. Carbon Kinetics Simulations

The carbon supersaturation in the martensitic ferrite matrix can be reduced by the competing processes of carbon diffusion into austenite and carbide precipitation; these mechanisms were simulated using DICTRA and TC-Prisma, respectively.
The martensite displacive transformation in steels occurs without the diffusion of carbon into austenite [25], producing a carbon super-saturated martensite lath or plate. Therefore, the martensite laths that were formed inherit the carbon content from the austenite. Upon subsequent cooling, the carbon can subsequently partition from the laths into interlath films [26]. It was shown by Santofimia et al. [27] that the assumed interface mobility affects the predicted partitioning of carbon from martensite to austenite during isothermal holding. However, it was also observed that immobile and mobile interfaces have a similar behaviour for short isothermal times. Considering the high cooling rates used in our calculations, the assumption of an immobile interface should not lead to significant errors. To simulate this, the DICTRA geometry shown in Figure 6 was setup such that initially, immediately after lath formation, the carbon content was uniformly distributed. The simple one-dimensional geometry best approximates the geometry of the martensite lath and the neighbouring austenite. The phases were considered as two cells that were coupled to keep the same carbon activity at their immobile interface [12,28]. A binary Fe-C system was used to avoid convergence errors when running the calculations at fast cooling rates. Due to limitations of the DICTRA software, it was necessary to model martensite as a highly dislocated ferrite. It has been shown that the tetragonality that often exists in martensite due to carbon supersaturation increases the equilibrium solubility of carbon in a body-centered tetragonal (bct) ferrite-austenite system [29]. Such an effect cannot be modelled with DICTRA; however, according to the Zener model [30], supersaturated martensite at low carbon concentrations should be a disordered bcc rather than bct especially at temperatures close to Ms, where diffusion is fastest. Therefore, the assumption of bcc ferrite in DICTRA may be reasonable.
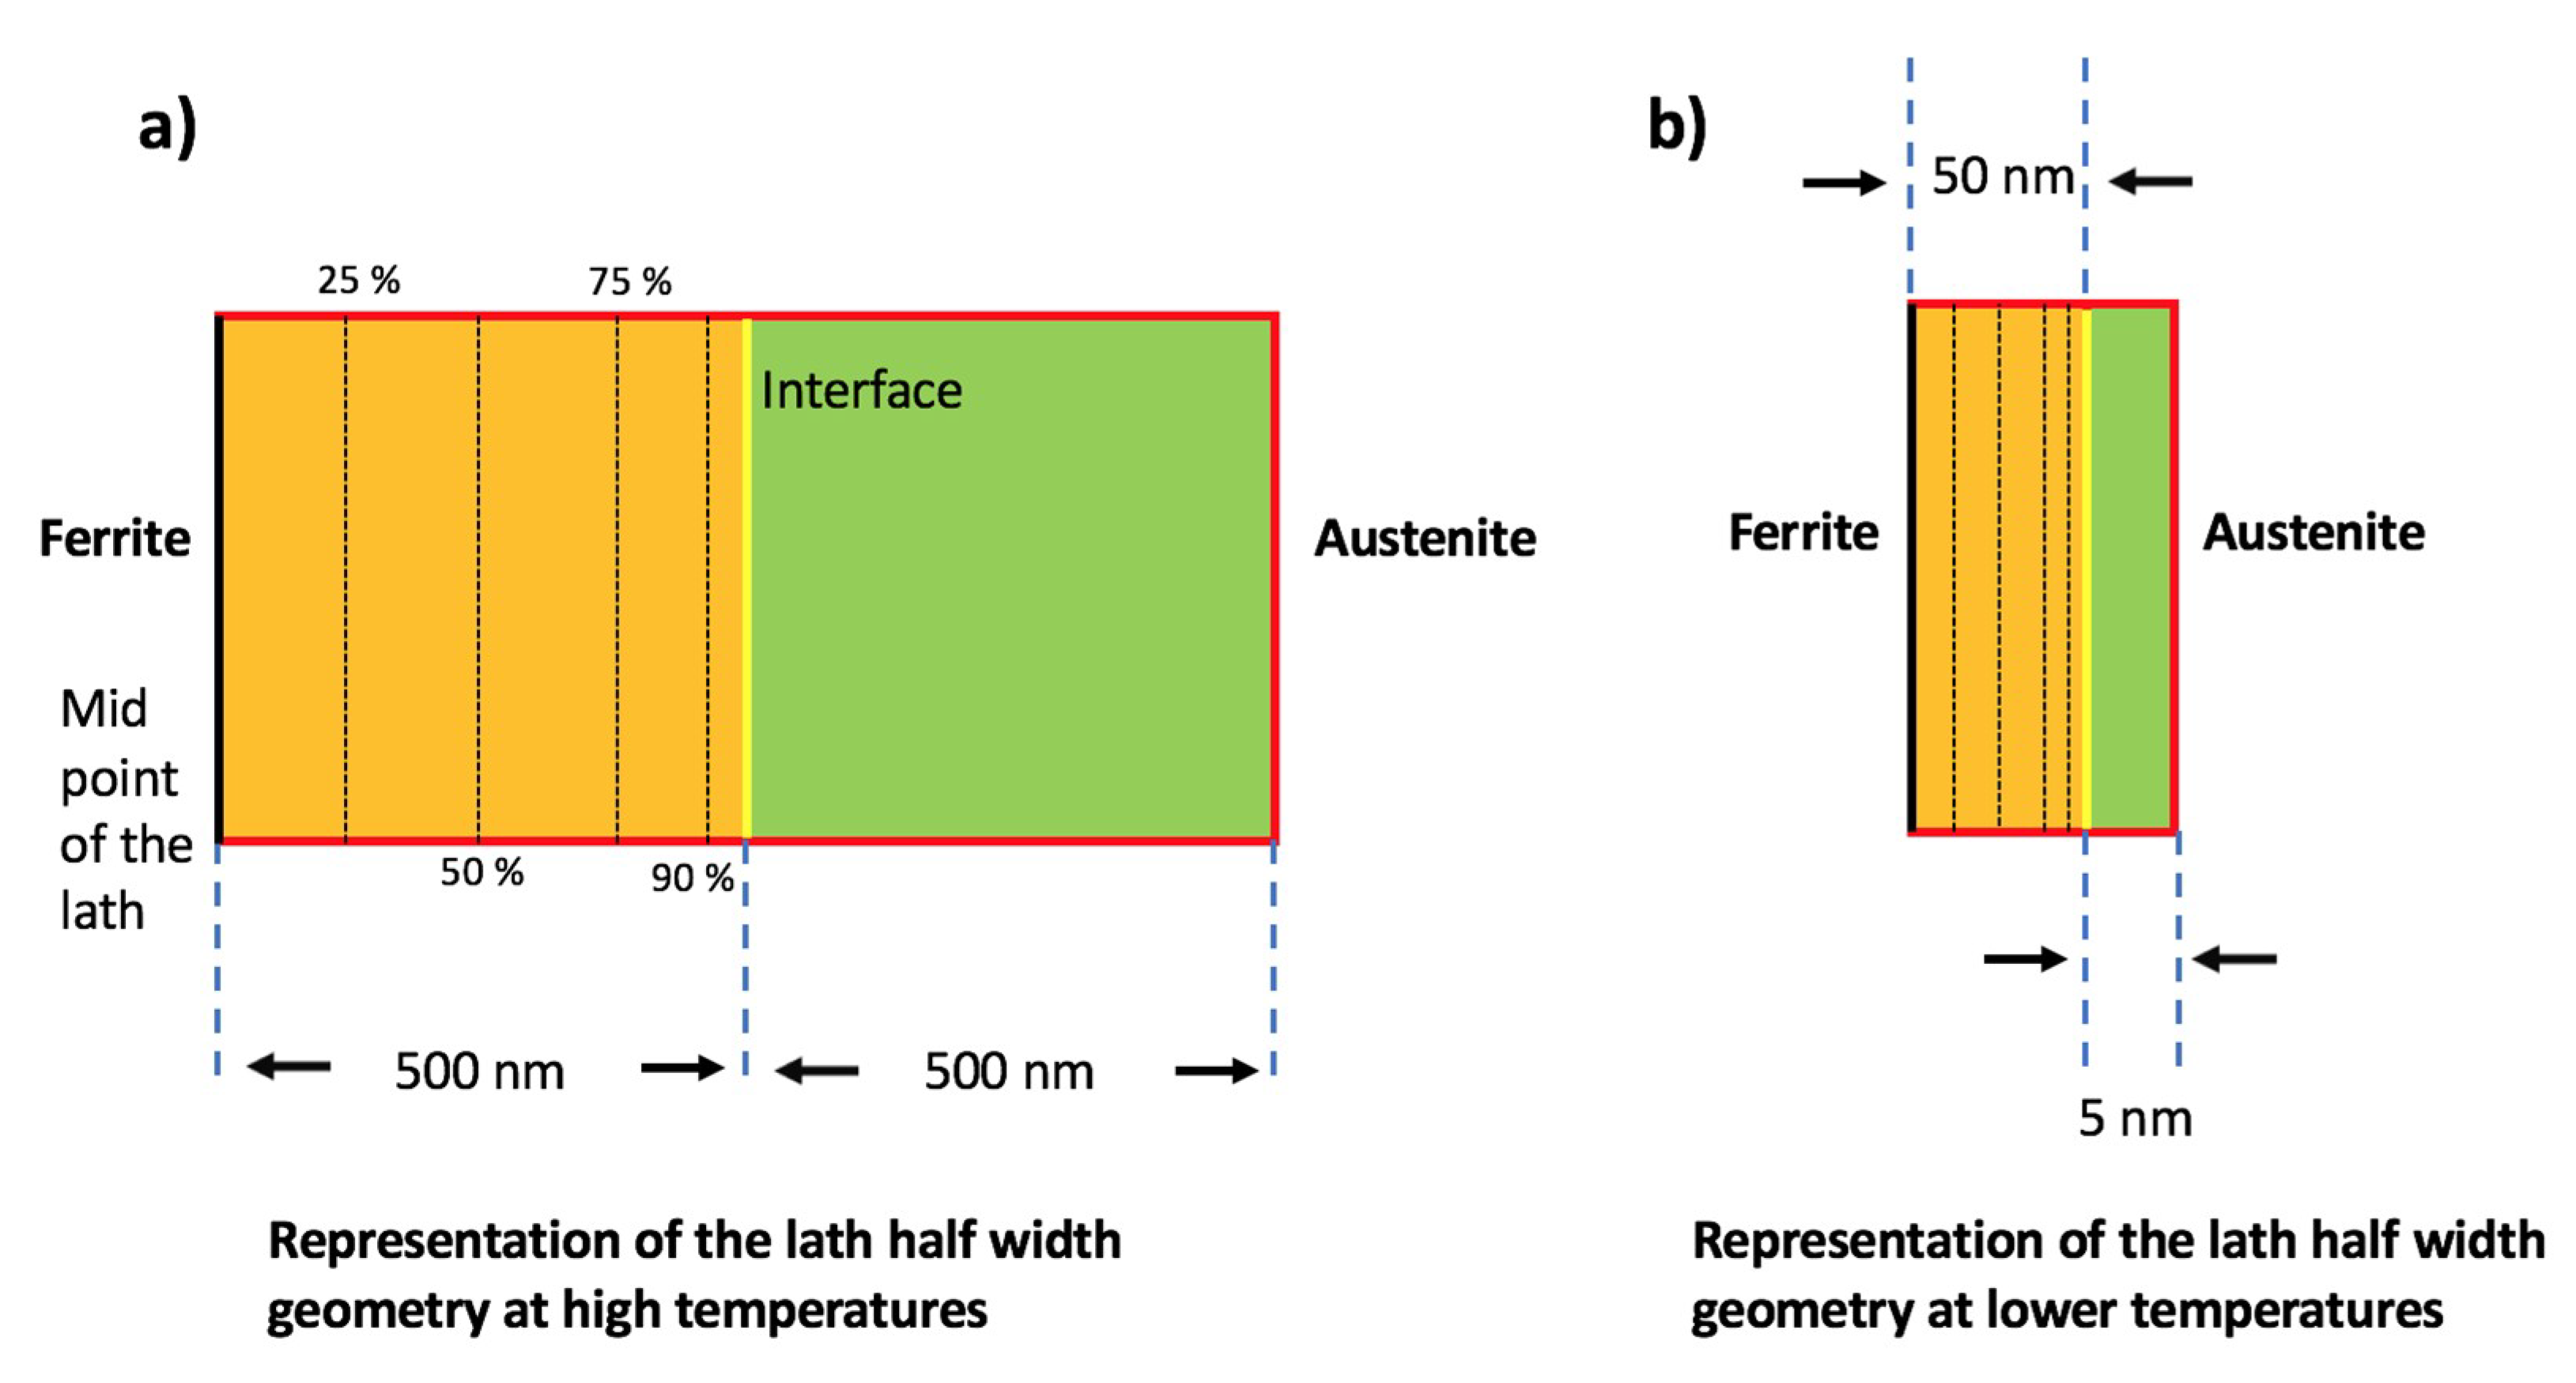
The STEM observations, as shown in Figure 2, Figure 3, Figure 4 and Figure 5, revealed that the coarse martensitic regions had thicknesses greater than 1000 nm while the smallest lath thickness was about ~100 nm. The 3D sectioning observations by Morsdorf et al. [23] also showed that coarse regions were thicker than the surrounding thinner laths. Therefore, the thickness observations made using STEM seem reasonable for implementing into the geometry setup for DICTRA. For the modelling purposes, it was therefore assumed that the half-thickness of the first laths forming close to Ms was 500 nm representing the larger coarse regions which grow just under the Ms [5,23], while the laths forming after 90% martensite have a half-thickness of 50 nm representing the smaller size martensitic regions which form during the last stages of the quench [5,23]. As the first formed coarse regions were surrounded by austenite, the carbon from ferrite would initially diffuse into a large austenite domain. Consequently, the austenite adjacent to the coarse lath was given a half-thickness of 500 nm, as shown in Figure 6a. On the other hand, the martensite laths forming after 90% of the austenite has transformed will tend to be surrounded by narrow austenite regions; therefore, the half-thickness in that case was taken as 5 nm, as shown in Figure 6b. Actually, according to the DICTRA simulations, the carbon diffusion kinetics was not affected by the austenite dimensions as shown later in the paper. Diffusion profiles were calculated for six locations: At 0%, 25%, 50%, 75%, 90%, and 100% of the half-thickness. Table 2 provides the DICTRA calculation setup for 1000 and 120 °C/s cooling rates. The 500 nm ferrite half-thickness planar geometry was used for calculating carbon diffusion in laths formed at the Ms temperature. The 50 nm ferrite half thickness planar geometry was used for calculating carbon diffusion from laths formed after 90% of the martensite has formed and the corresponding temperatures were obtained from the martensite evolution curves in Figure 1.
TC-Prisma was used to model the precipitation of cementite in a supersaturated bcc martensite matrix under the condition that diffusion effects on the local total carbon content are negligible. Similar to the DICTRA simulations, a binary Fe-C system was considered so as to avoid convergence errors. Carbide nucleation was assumed to occur on dislocations having a density of 1015 m−2, as suggested by Morito et al. [31]. Due to the limitations of the TC-Prisma, the morphology of the precipitates is restricted to a sphere. As with any precipitation modelling, the results are very sensitive to the value taken as the precipitate-matrix interfacial energy. Becker’s model, as implemented into the Thermo-Calc software [20], predicts the cementite-ferrite interfacial energy to be 0.15–0.16 J/m2 for the two steel compositions. Precipitation calculations based on these values showed that the carbon depletion rate due to precipitation was higher than that due to diffusion into austenite for both cooling rates, and both the coarse laths and the fine laths formed at the lowest temperatures. This was inconsistent with the experimental observations, which showed that there were untempered regions in the 0.12C steel. In the present case, the best agreement between the predictions and experimental observations was obtained by manually setting the ferrite—cementite interfacial energy to 0.27 J/m2.
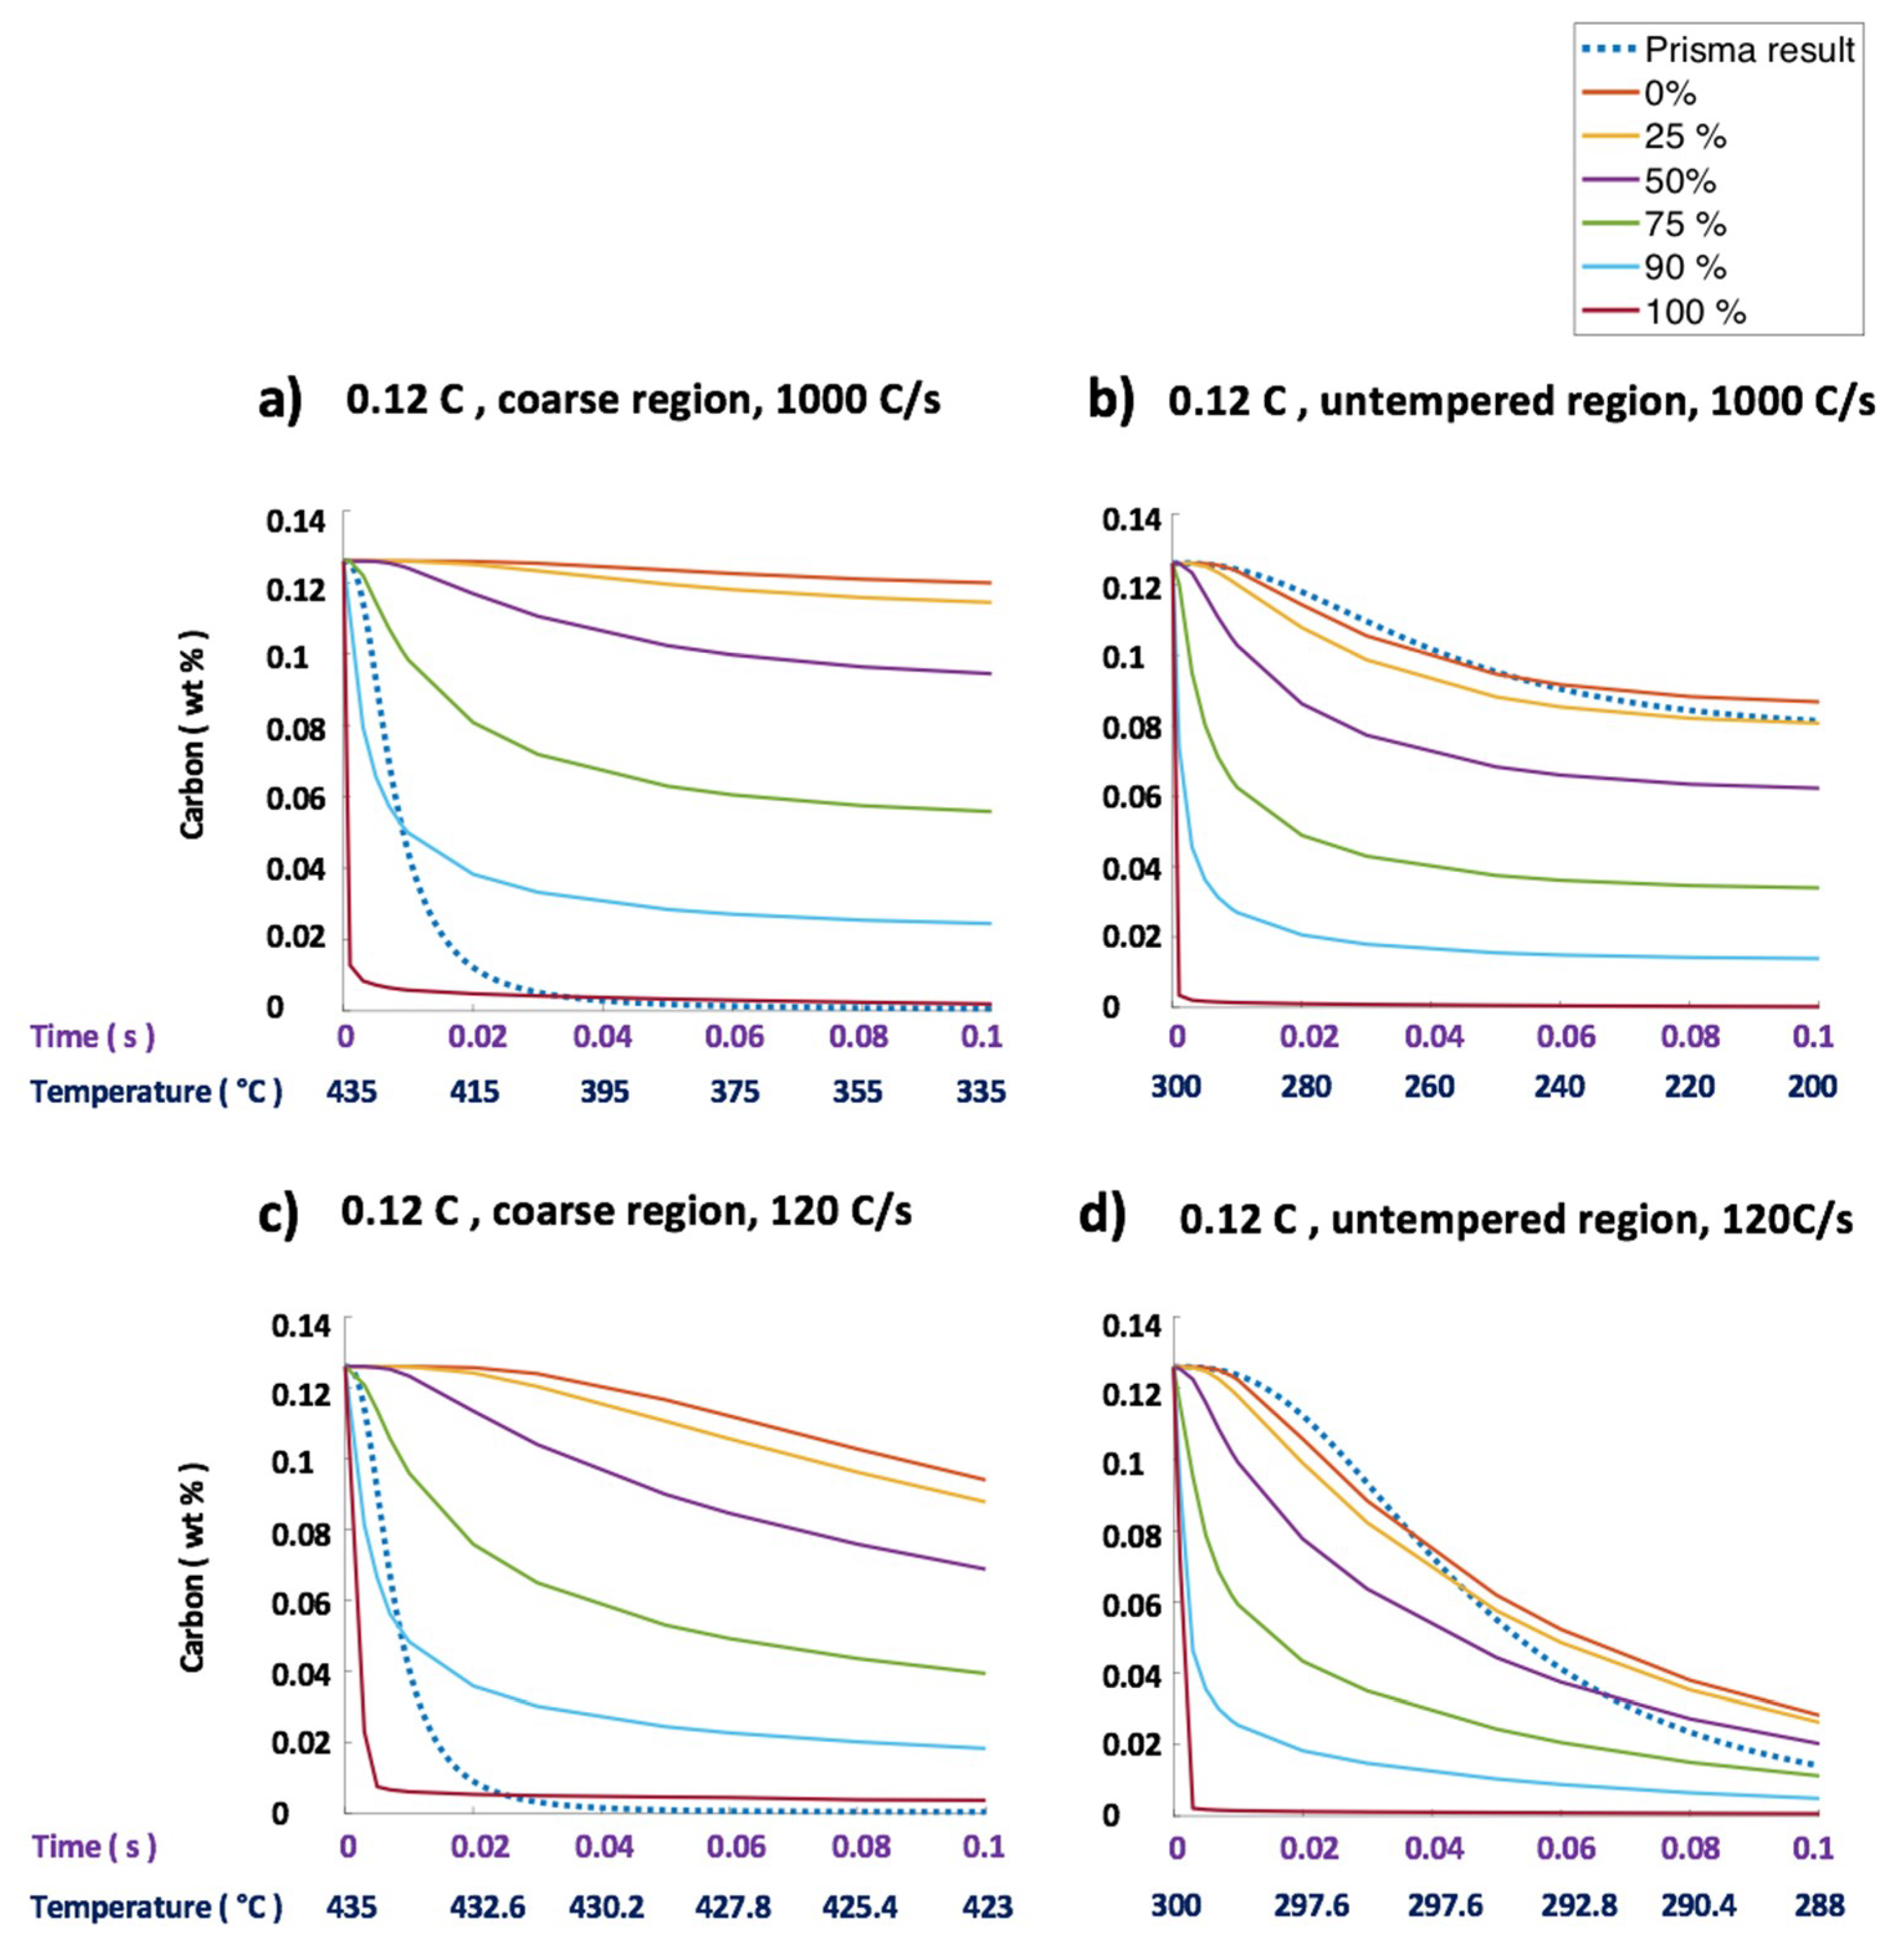
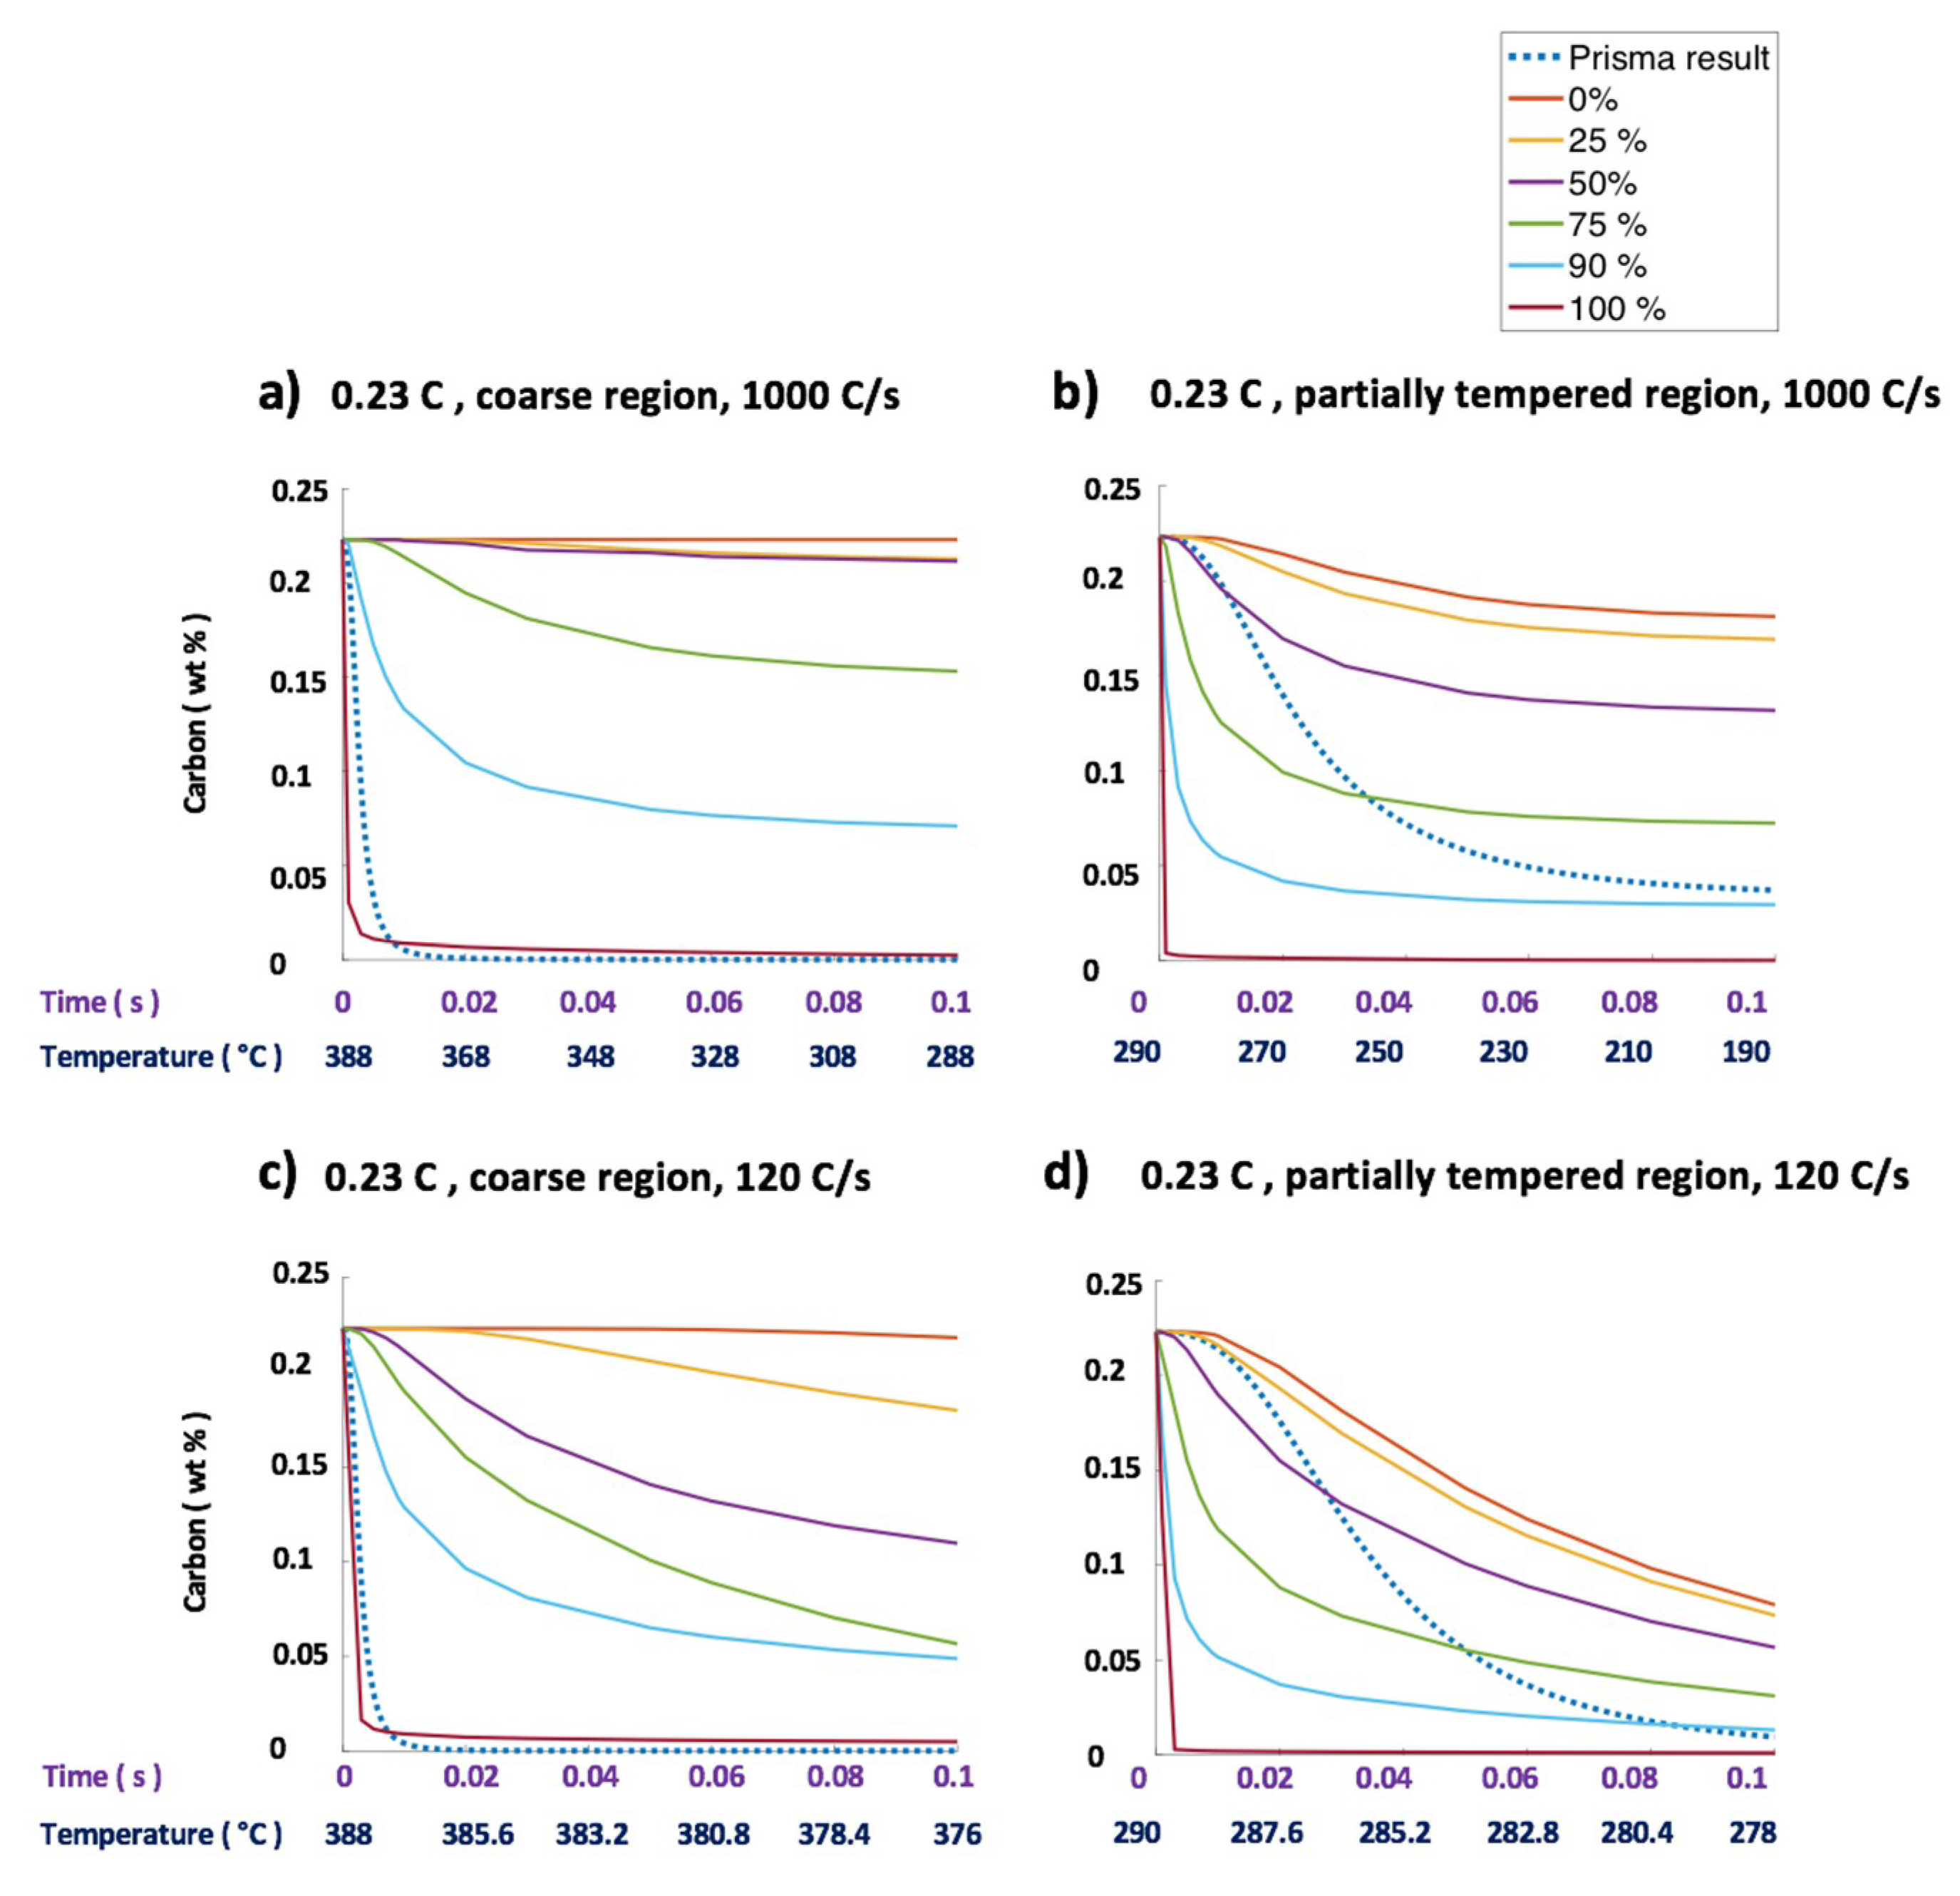
The precipitation simulations were run using the same lath formation temperatures listed in Table 2 for cooling rates of 1000 and 120 °C/s. The comparisons from the diffusion of carbon and the precipitation of cementite for the two steels can be seen in Figure 7 and Figure 8. Zero time is the time when the lath forms.
The carbon diffusion from ferrite to austenitic for the 0.12C steel quenched at 1000 °C/s is shown in Figure 7a,b. For the coarse ferrite laths (Figure 7a) except for the carbon content near the interface (at 90% and 100% half-thickness), the results suggest that the rate of carbon depletion from the matrix due to precipitation should be much faster than the carbon depletion rate due to diffusion. In contrast, as shown in Figure 7b, the rate of carbon depletion from the matrix by diffusion from martensite laths formed after 90% transformation is predicted to be relatively fast, even when compared with precipitation occurring under the high driving force that would exist in the absence of carbon diffusion to austenite. If the precipitation modelling were to consider the continually decreasing concentration of carbon, even in the middle of the laths, the precipitation kinetics would be even slower than that shown in Figure 7b.
As expected, reducing the quench rate from 1000 to 120 °C/s is predicted to increase the loss of carbon via diffusion to the austenite and make only a little difference to the predictions regarding precipitation in the coarse laths as seen in Figure 7c. Carbon loss due to diffusion is more dominant when compared to loss due to precipitation in the 50 nm half-thickness regions, as seen in Figure 7d.
The carbon diffusion from ferrite to austenitic for the 0.23C steel quenched at 1000 °C/s is shown in Figure 8a,b. Similar to the observations seen in the coarse regions in the quenched 0.12C steel, the carbon depletion rate due to precipitation is higher than by the carbon diffusion to austenite from the ferrite laths with a half-thickness of 500 nm (Figure 8a). The exception is that the carbon depletion at the interface by diffusion (100% half-thickness) is slightly higher than the precipitation process for the quenched 0.23C steel. This is in contrast to the situation near the interface (90% half-thickness) in the quenched 0.12C steels, where the carbon depletion rate due to diffusion is significantly higher than that by precipitation. At the lath formation temperature of 290 °C, precipitation depletes carbon faster than the diffusion of carbon at the 0% and 25% half-thickness ferrite positions, as seen in Figure 8b. However, diffusion of carbon from ferrite at the 50%, 75%, 90%, and 100% positions is predicted to be greater than by precipitation. Other than the increase in the loss of carbon via diffusion to austenite, the above results are similar to those occurring in the 0.23C steel quenched at 120 °C/s, as seen in Figure 7c,d.
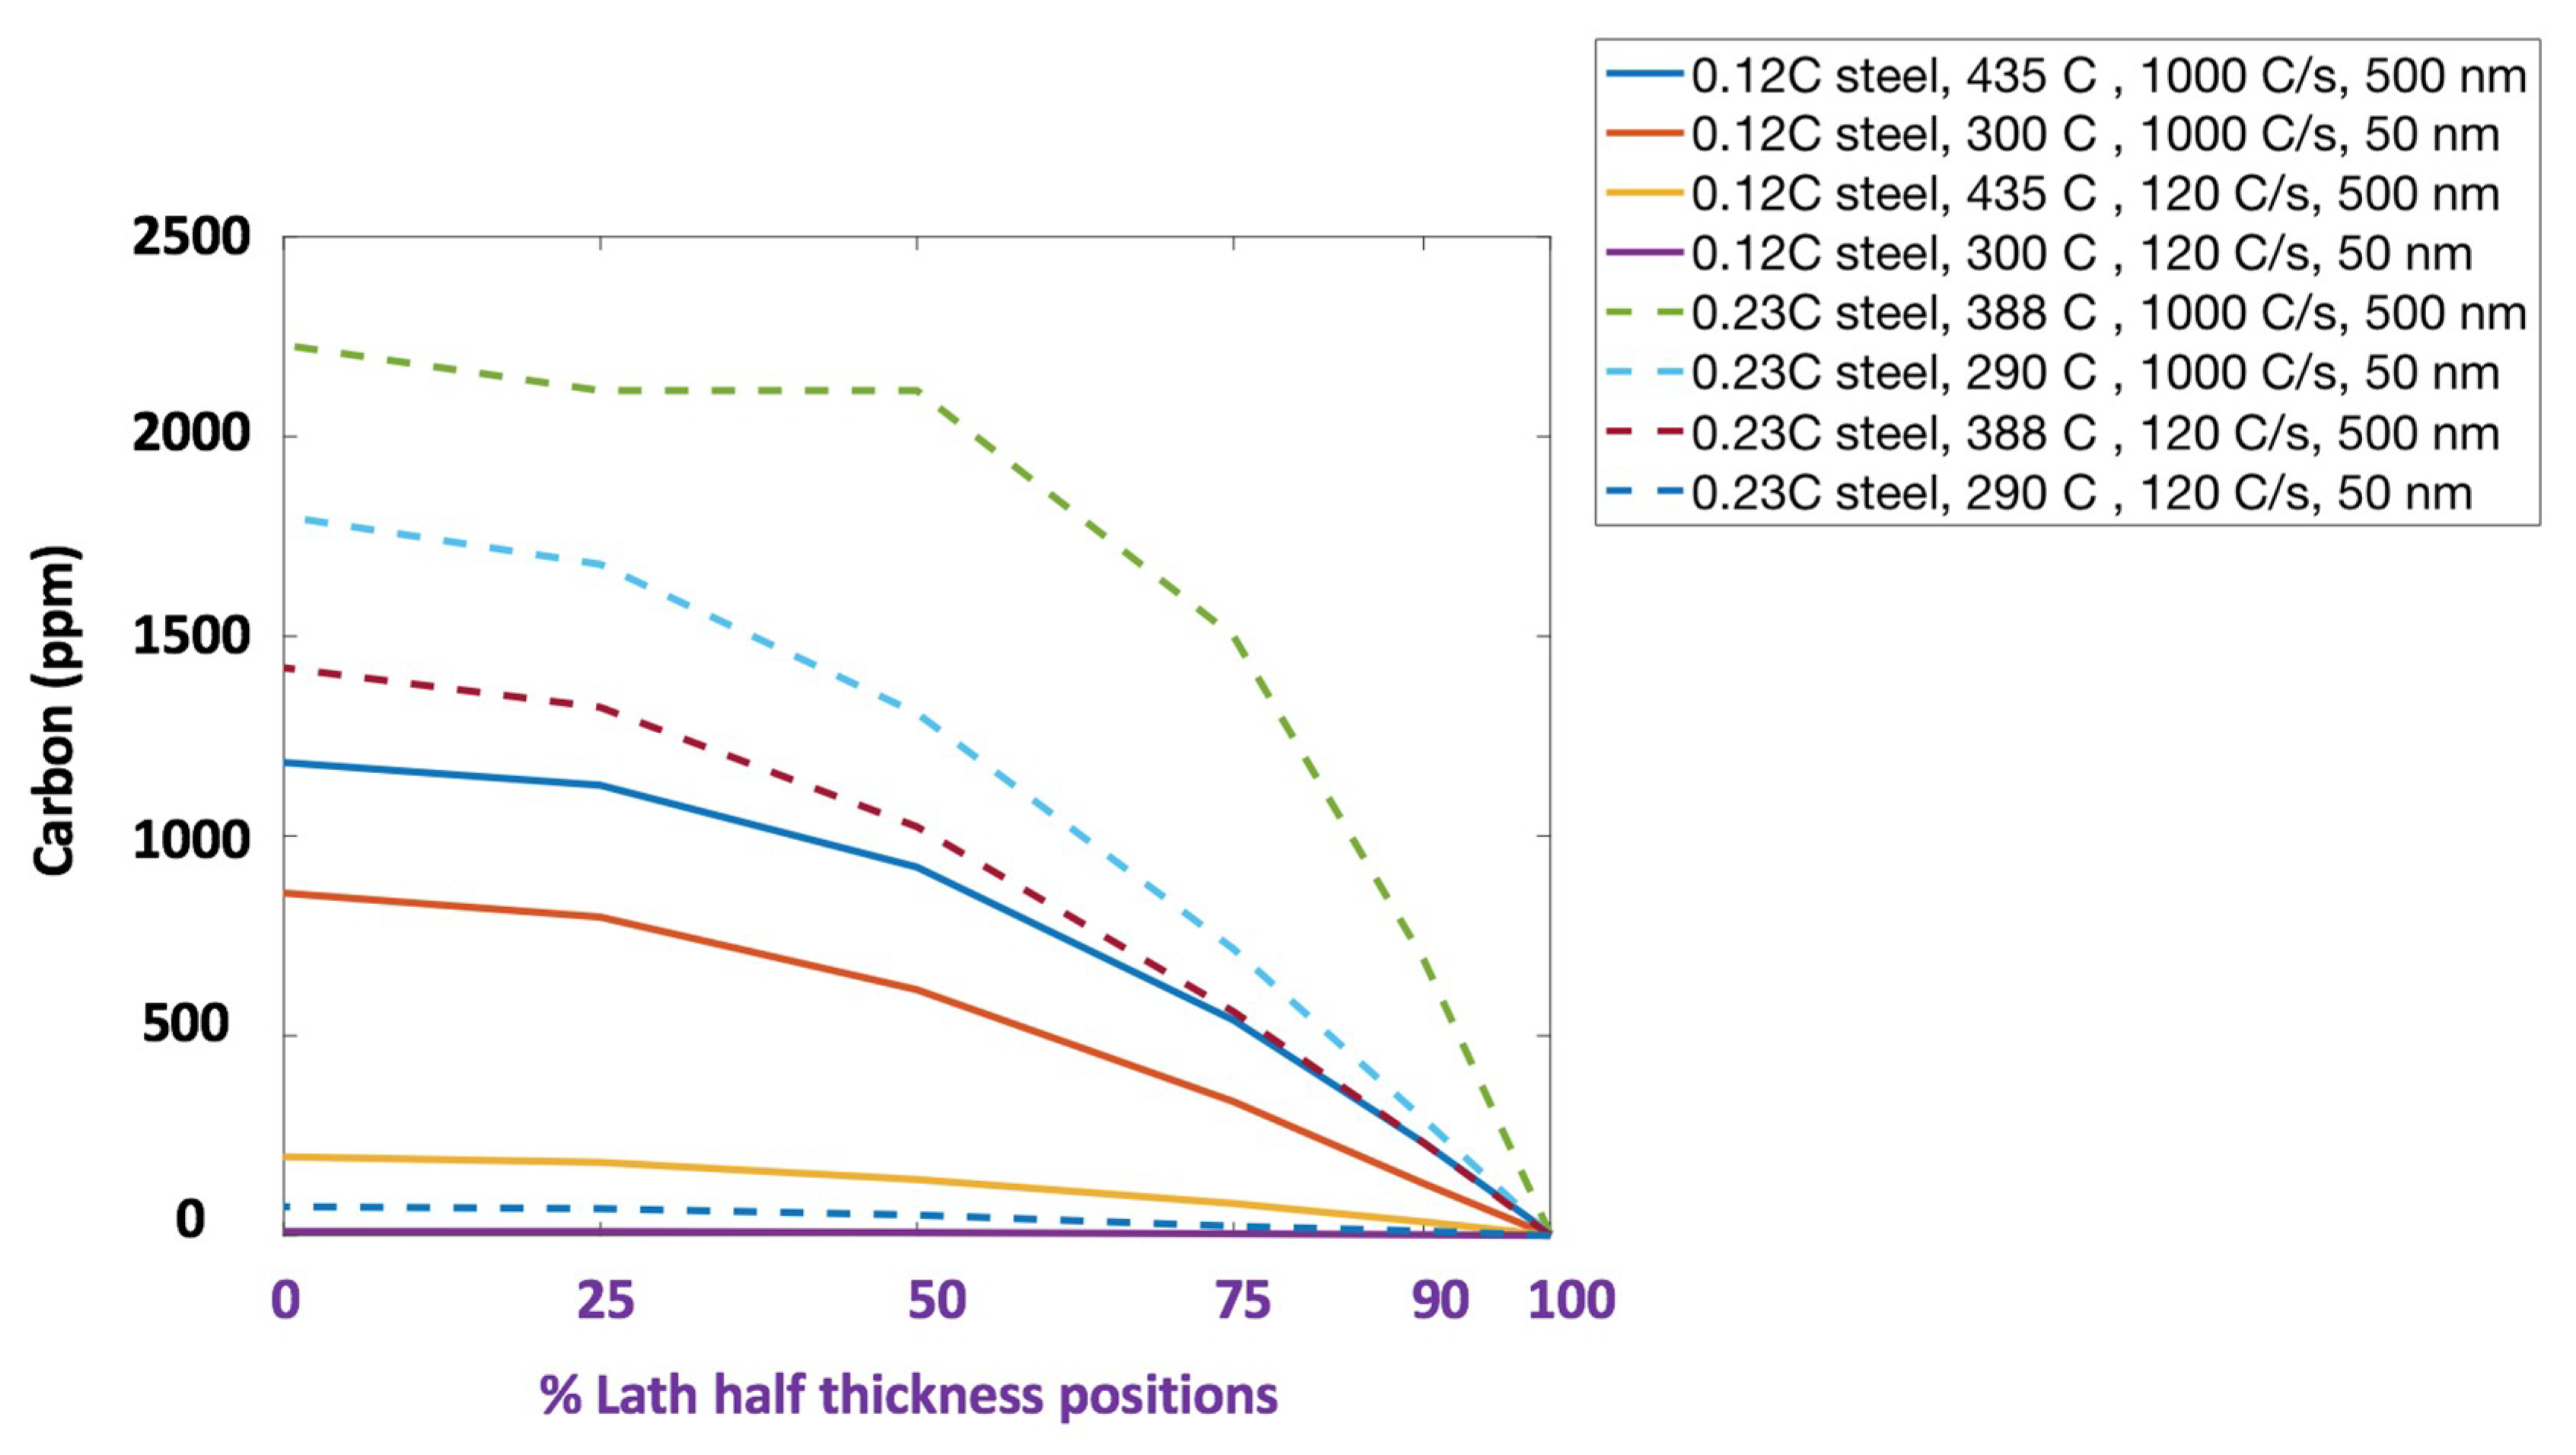
Figure 7 and Figure 8 only show the situation during the first 0.1 s of cooling, the carbon contents in the ferrite matrix after cooling to room temperature are given in Table 3 and Figure 9.
Figure 10 shows a comparison of predicted carbon concentration profiles when assuming two different austenite thicknesses (5 and 50 nm) adjacent to a lath with a half-thickness of 50 nm formed at 290 °C in the 0.23C steel. For a cooling rate of 1000 °C/s, the room temperature carbon profiles in ferrite and austenite (Figure 10a,b) are identical irrespective of whether the austenite thickness is taken as 5 or 50 nm. This is due to the fact that the carbon concentration profile only deviates from the bulk content to a depth of ~ 3 nm. As seen in Figure 10c, also when the cooling rate was 120 °C/s, there was almost no difference in the ferrite carbon concentration profiles. This was despite the fact that the far-side carbon concentration in the 5 nm thick austenite cell rose to about 2 wt%, as seen in Figure 10d. Martensite has been reported to nucleate and grow at the speeds close to that of sound in steel [2]. Therefore, the assumption in our model that the martensite has formed instantaneously would seem reasonable. It is also assumed that the laths have remained surrounded by austenite during cooling despite the formation of other laths as the martensite volume fraction increases. Evidence that this is so can be seen in Figure 11, which shows an interlath austenite film after cooling to room temperature. Therefore, ignoring the changing environment around the lath by keeping a constant assumed austenite half-thickness is a reasonable approximation provided the actual austenite half-thickness adjacent to the laths is great enough to contain the carbon concentration profile resulting from any diffusion of carbon out of the lath. The required half-thickness can be obtained from the calculated DICTRA profiles and are given in Table 4.
For consistency with the Prisma calculations, the DICTRA calculations were made for binary Fe-C alloys. This is justified as a comparison between the binary Fe-C and quaternary Fe-C-Mn-Si systems showing that predicted carbon depletion rates are very similar in the two: In the quaternary system, the carbon depletion rates due to diffusion were at most 10% lower at the 0% half-thickness position for the 0.12C steel and 7% lower for the 0.23C steel when compared to the binary Fe-C system. The differences elsewhere across the lath thickness were smaller diminishing to zero at the interface. Therefore, the inclusion of substitutional elements did not significantly influence the calculations, nor the conclusions drawn.
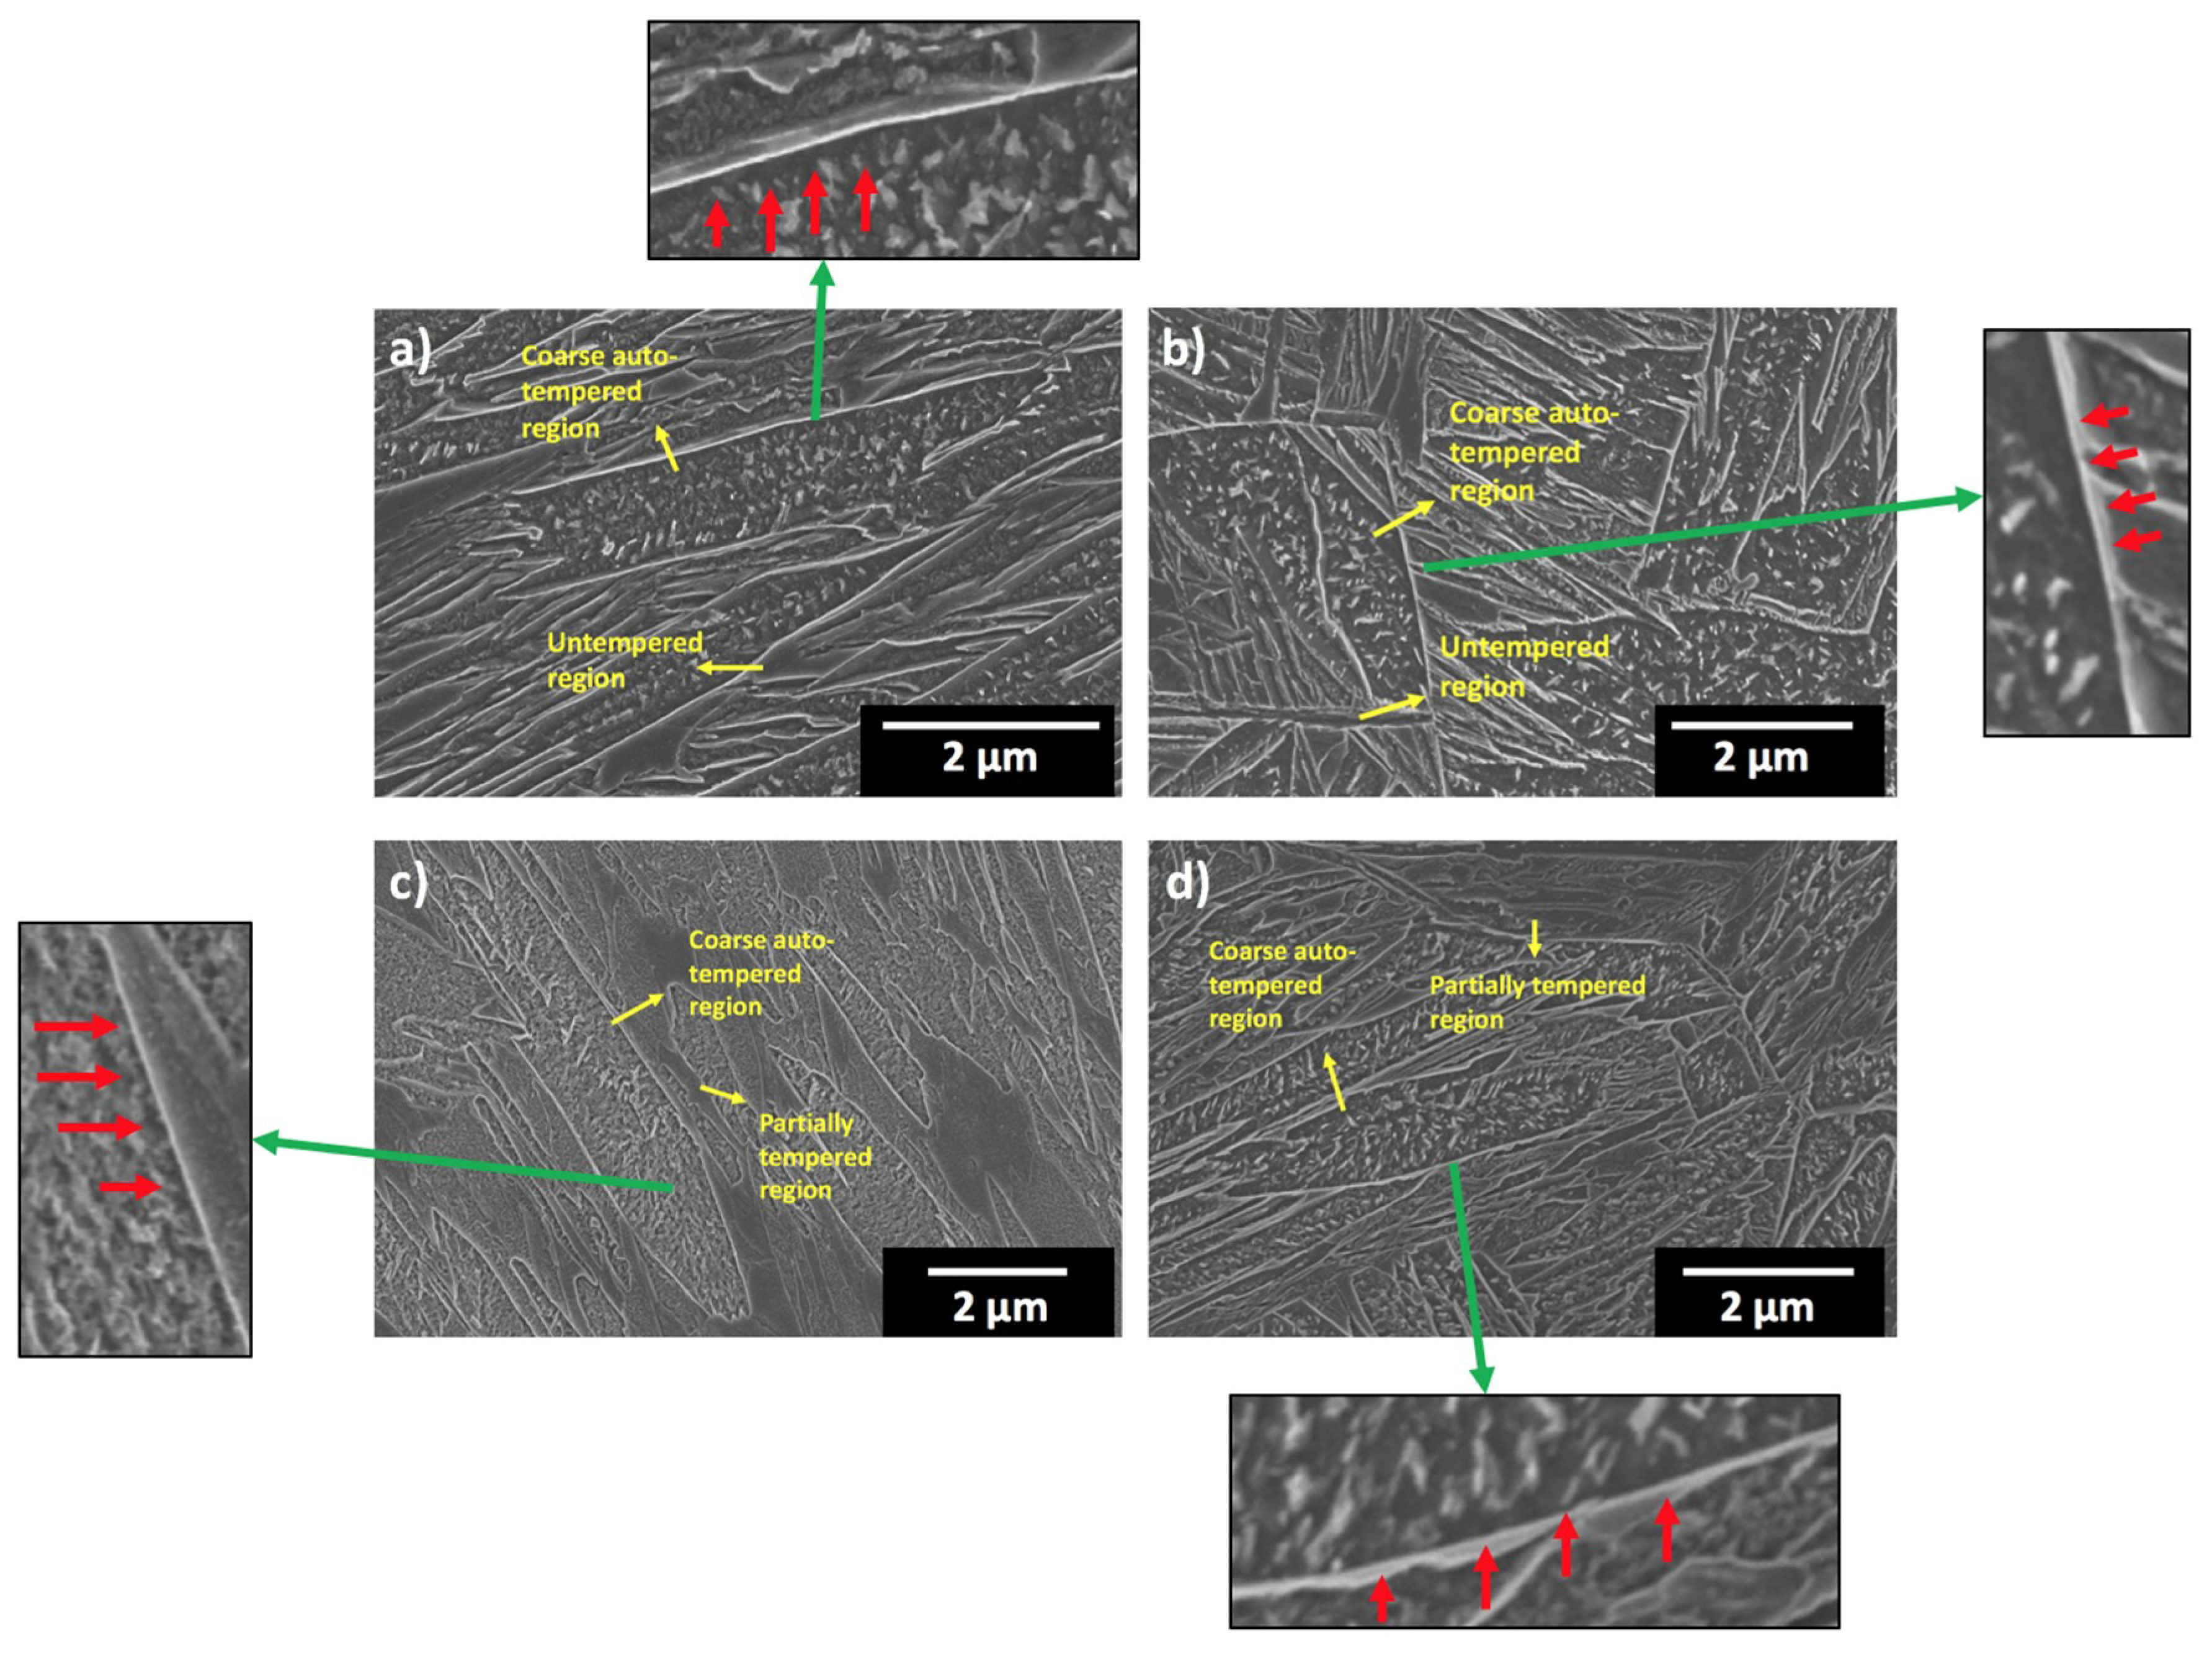
It is interesting to compare the simulation results with SEM micrographs of the coarse auto-tempered laths and the less tempered laths. Figure 12a shows a high density of precipitates in a coarse lath region of the 0.12C steel quenched at 1000 °C/s. This corresponds well with the predictions based on in Figure 7a. As expected on the basis of the predicted fast carbon depletion by diffusion into austenite at the ferrite—austenite interface, there is even a narrow precipitate-free zone adjacent to the lath boundary (which corresponds to about 90% width of the coarse region), as indicated by the red arrows in Figure 12a. Narrow precipitate-free laths can also be seen in Figure 12a, in agreement with the predictions in Figure 7b, i.e., for the thin laths formed at low temperatures carbon depletion by diffusion of carbon from ferrite into austenite is predicted to be faster than by precipitation. Both these findings provide confidence in the model predictions. Similar observations can be made when comparing the SEM micrograph in Figure 12b and the simulation results seen in Figure 7c,d for the cooling rate of 120 °C/s.
For the 0.23C steel quenched at 1000 °C/s, Figure 12c shows that the precipitates are uniformly distributed throughout the coarse region. However, unlike the quenched 0.12C steel, no distinct precipitate-free zone is apparent near the boundaries. This finding corresponds well with the simulations shown in Figure 8a, i.e., that the carbon depletion rate due to precipitation is faster than the depletion rate due to diffusion throughout the thickness of the coarse laths, even beyond the 90% half-thickness region. The relatively dark regions of the martensite that have transformed at low temperatures are seen to contain very small precipitates throughout. This is at odds with Figure 8b, i.e., the fact that the rate of carbon depletion due to precipitation is predicted to be faster than that through diffusion only near the centres of the narrow laths (up to the 25% lath thickness position) and not throughout.
For the 0.23C steel quenched at 120 °C/s, Figure 12d shows that the microstructure of the coarse auto-tempered regions can be predicted by the simulations in Figure 8c. In this case, the loss of carbon by diffusion into austenite is expected to affect precipitation to a greater depth than at 1000 °C/s. There are some signs that this is the case in the way that narrow precipitate-free zones are seen at the boundaries of some coarse laths but not at others.
The narrow laths in Figure 12d appear to be precipitate free except for a low density of small precipitates in the middle of the laths. This matches the prediction provided by the simulation shown in Figure 8d, which predicts that precipitation should deplete carbon from the matrix at a much faster rate in the middle of the lath while the diffusion process was faster initially above the 50% of the half-thickness in the ferrite regions.
From the above results, it can be seen that the approximate calculations in DICTRA and TC-Prisma can sufficiently predict the phase transformation mechanisms in quenched low-carbon steels.

4. Conclusions

Two low-alloy steels containing 0.12C and 0.23C wt% showed an auto-tempered lath martensite containing cementite precipitates after quenching at both 1000 and 120 °C/s. The effect of carbon content, the lath thickness, and cooling rate on the incidence of cementite could be rationalised using the Thermo-Calc Prisma and DICTRA software to predict the rate at which carbon is depleted from the laths during quenching via either cementite precipitation or diffusion to the surrounding austenite. Based on the observed microstructures, the DICTRA calculations were based on a one-dimensional geometry with two lath half-thicknesses: 500 nm to represent the coarse martensite laths formed just under the Ms temperature, and 50 nm to represent the thin laths formed after 90% transformation.
With one exception, model predictions were in good agreement with experimental observations of cementite distributions. The predicted carbon depletion rates showed that carbide precipitation is expected to dominate over the diffusion of carbon into austenite in the coarse laths formed close to the Ms temperature in both the 0.12C and 0.23C steels for both cooling rates. In addition, a narrow precipitate-free zone adjacent to the lath boundary was predicted in the coarse region of the 0.12C steel, but not for the 0.23C steel. In the thin laths of the 0.12C steel forming towards the end of the martensite transformation, however, carbon depletion by diffusion to austenite is predicted to be much faster than precipitation at both 1000 and 120 °C/s. In the 0.23C steel, precipitation is predicted to dominate carbon depletion at the centres of the thin laths for both cooling rates. The experimentally observed microstructures showed that this was only true at a cooling rate of 120 °C/s but not for 1000 °C/s where very thin carbides were observed to precipitate throughout the last formed laths.

Author Contributions

Conceptualization, S.R.B. and D.P.; methodology, S.R.B.; software, S.R.B.; validation, S.R.B.; formal analysis, S.R.B.; investigation, S.R.B. and M.J.; resources, S.R.B.; data curation, S.R.B.; writing—original draft preparation, S.R.B.; writing—review and editing, S.R.B., A.J, T.P.D., and D.P.; visualization, S.R.B.; supervision, D.P.; project administration, D.P.; funding acquisition, J.K. All authors have read and agreed to the published version of the manuscript.

Funding

The authors are grateful for the financial support from the European Commission under grant number 675715-MIMESIS-H2020-MSCA-ITN-2015, which is a part of the Marie Sklodowska-Curie Innovative Training Networks European Industrial Doctorate Programme. T.P. Davis is funded by the Clarendon Scholarship from the University of Oxford and United Kingdom’s Engineering and Physical Sciences Research Council Fusion Centre for Doctorial Training (EP/L01663X/1).

Acknowledgments

The authors would also like to thank Pasi Suikkanen from SSAB Europe Oy for his support. The support of SSAB Europe Oy in providing the steel studied is acknowledged.

Conflicts of Interest

The authors declare no conflict of interest.

References

  1. Kömi, J.; Karjalainen, P.; Porter, D. Direct-Quenched Structural Steels. Encycl. Iron Steel Alloy 2016, 1109–1125. [Google Scholar]
  2. Bhadeshia, H.K.D.H.; Honeycombe, R.W.K. Steels: Microstructure and Properties, 4th ed.; Butterworth-Heinemann: Oxford, UK, 2017. [Google Scholar]
  3. Krauss, G. Martensite in steel: Strength and structure. Mater. Sci. Eng. A 2002, 273–275, 40–57. [Google Scholar] [CrossRef]
  4. Pereloma, E.; Edmonds, D. Phase Transformations in Steels; Elsevier Science & Technology: London, UK, 2012; ISBN 9781845699710. [Google Scholar]
  5. Babu, S.R.; Nyyssönen, T.; Jaskari, M.; Järvenpää, A.; Davis, T.P.; Pallaspuro, S.; Kömi, J.; Porter, D. Observations on the relationship between crystal orientation and the level of auto-tempering in an as-quenched martensitic steel. Metals 2019, 9, 1255. [Google Scholar] [CrossRef] [Green Version]
  6. Hutchinson, B.; Hagström, J.; Karlsson, O.; Lindell, D.; Tornberg, M.; Lindberg, F.; Thuvander, M. Microstructures and hardness of as-quenched martensites (0.1–0.5%C). Acta Mater. 2011, 59, 5845–5858. [Google Scholar] [CrossRef]
  7. Speer, J.; Matlock, D.K.; De Cooman, B.C.; Schroth, J.G. Carbon partitioning into austenite after martensite transformation. Acta Mater. 2003, 51, 2611–2622. [Google Scholar] [CrossRef]
  8. Matsuda, H.; Mizuno, R.; Funakawa, Y.; Seto, K.; Matsuoka, S.; Tanaka, Y. Effects of auto-tempering behaviour of martensite on mechanical properties of ultra high strength steel sheets. J. Alloy. Compd. 2013, 577, S661–S667. [Google Scholar] [CrossRef]
  9. Takaki, S.; Akama, D.; Tsuchiyama, T. Quantitative Evaluation of Auto-Tempering During Quenching. NETSUSHORI 2017, 56, 340–344. [Google Scholar]
  10. Babu, S.R.; Jaskari, M.; Järvenpää, A.; Porter, D. The effect of hot-mounting on the microstructure of an As-Quenched auto-tempered low-carbon martensitic steel. Metals 2019, 9, 550. [Google Scholar] [CrossRef] [Green Version]
  11. Babu, S.R.; Davis, T.P.; Haas, T.; Jarvenpää, A.; Kömi, J.; Porter, D. Image Processing Tool Quantifying Auto-Tempered Carbides in As-Quenched Low Carbon Martensitic Steels. Metals 2020, 10, 171. [Google Scholar] [CrossRef] [Green Version]
  12. Borgenstam, A.; Höglund, L.; Ågren, J.; Engström, A. DICTRA, a tool for simulation of diffusional transformations in alloys. J. Phase Equilibria 2000, 21, 269–280. [Google Scholar] [CrossRef]
  13. Chen, Q.; Wu, K.; Sterner, G.; Mason, P. Modeling Precipitation Kinetics During Heat Treatment with Calphad-Based Tools. J. Mater. Eng. Perform. 2014, 23, 4193–4196. [Google Scholar] [CrossRef]
  14. Ramesh Babu, S.; Ivanov, D.; Porter, D. Influence of Microsegregation on the Onset of the Martensitic Transformation. ISIJ Int. 2018, 59, 169–175. [Google Scholar] [CrossRef]
  15. Klinger, M.; Jäger, A. Crystallographic Tool Box (CrysTBox): Automated tools for transmission electron microscopists and crystallographers. J. Appl. Cryst. 2015, 48, 2012–2018. [Google Scholar] [CrossRef] [PubMed] [Green Version]
  16. Andersson, J.O.; Helander, T.; Höglund, L.; Shi, P.; Sundman, B. Thermo-Calc & DICTRA, computational tools for materials science. Calphad Comput. Coupling Phase Diagr. 2002, 26, 273–312. [Google Scholar]
  17. Garcia, J.; Lindwall, G.; Prat, O.; Frisk, K. Kinetics of formation of graded layers on cemented carbides: Experimental investigations and DICTRA simulations. Int. J. Refract. Met. Hard Mater. 2011, 29, 256–259. [Google Scholar] [CrossRef]
  18. Kashchiev, D. Nucleation: Basic Theory with Applications; Butterworth-Heinemann: Oxford, UK, 2000. [Google Scholar]
  19. Russell, K.C. Nucleation in solids: The induction and steady state effects. Adv. Colloid Interface Sci. 1980, 13, 205–318. [Google Scholar] [CrossRef]
  20. Thermo-Calc, Version 2019b. In Precipitation Module (TC-PRISMA) User Guide; Thermo-Calc Software AB: Solna, Sweden, 2019.
  21. Chen, Q.; Jeppsson, J.; Ågren, J. Analytical treatment of diffusion during precipitate growth in multicomponent systems. Acta Mater. 2008, 56, 1890–1896. [Google Scholar] [CrossRef]
  22. Prat, O.; García, J.; Rojas, D.; Sanhueza, J.P.; Camurri, C. Study of nucleation, growth and coarsening of precipitates in a novel 9%Cr heat resistant steel: Experimental and modeling. Mater. Chem. Phys. 2014, 143, 754–764. [Google Scholar] [CrossRef]
  23. Morsdorf, L.; Tasan, C.C.; Ponge, D.; Raabe, D. Acta Materialia 3D structural and atomic-scale analysis of lath martensite: Effect of the transformation sequence. Acta Mater. 2015, 95, 366–377. [Google Scholar] [CrossRef]
  24. Morsdorf, L.; Jeannin, O.; Barbier, D.; Mitsuhara, M.; Raabe, D.; Tasan, C.C. Acta Materialia Multiple mechanisms of lath martensite plasticity. Acta Mater. 2016, 121, 202–214. [Google Scholar] [CrossRef]
  25. Bhadeshia, H.K.D.H. Carbon content of retained austenite in quenched steels. Met. Sci. 1983, 17, 151–152. [Google Scholar] [CrossRef]
  26. Sarikaya, M.; Thomas, G.; Steeds, J.W.; Barnard, S.J.; Smith, G.D.W. Solute Element Partitioning and Austenite Stabilization in Steels. In Proceedings of the International Conference on Solid to Solid Phase Transformations, H.I Aaronson, TMS, Warrendale, PA, USA, 1982; pp. 1421–1425. [Google Scholar]
  27. Santofimia, M.J.; Speer, J.G.; Clarke, A.J.; Zhao, L.; Sietsma, J. Influence of interface mobility on the evolution of austenite–martensite grain assemblies during annealing. Acta Mater. 2009, 57, 4548–4557. [Google Scholar] [CrossRef] [Green Version]
  28. Hillert, M.; Höglund, L.; Ågren, J. Escape of carbon from ferrite plates in austenite. Acta Met. Mater. 1993, 41, 1951–1957. [Google Scholar] [CrossRef]
  29. Jang, J.H.; Bhadeshia, H.K.D.H.; Suh, D.-W. Solubility of carbon in tetragonal ferrite in equilibrium with austenite. Scr. Mater. 2013, 68, 195–198. [Google Scholar] [CrossRef]
  30. Zener, C. Kinetics of the decomposition of austenite. Trans. Met. Soc. Aime 1946, 167, 550–595. [Google Scholar]
  31. Morito, S.; Nishikawa, J.; Maki, T. Dislocation Density within Lath Martensite in Fe-C and Fe-Ni Alloys. ISIJ Int. 2003, 43, 1475–1477. [Google Scholar] [CrossRef] [Green Version]
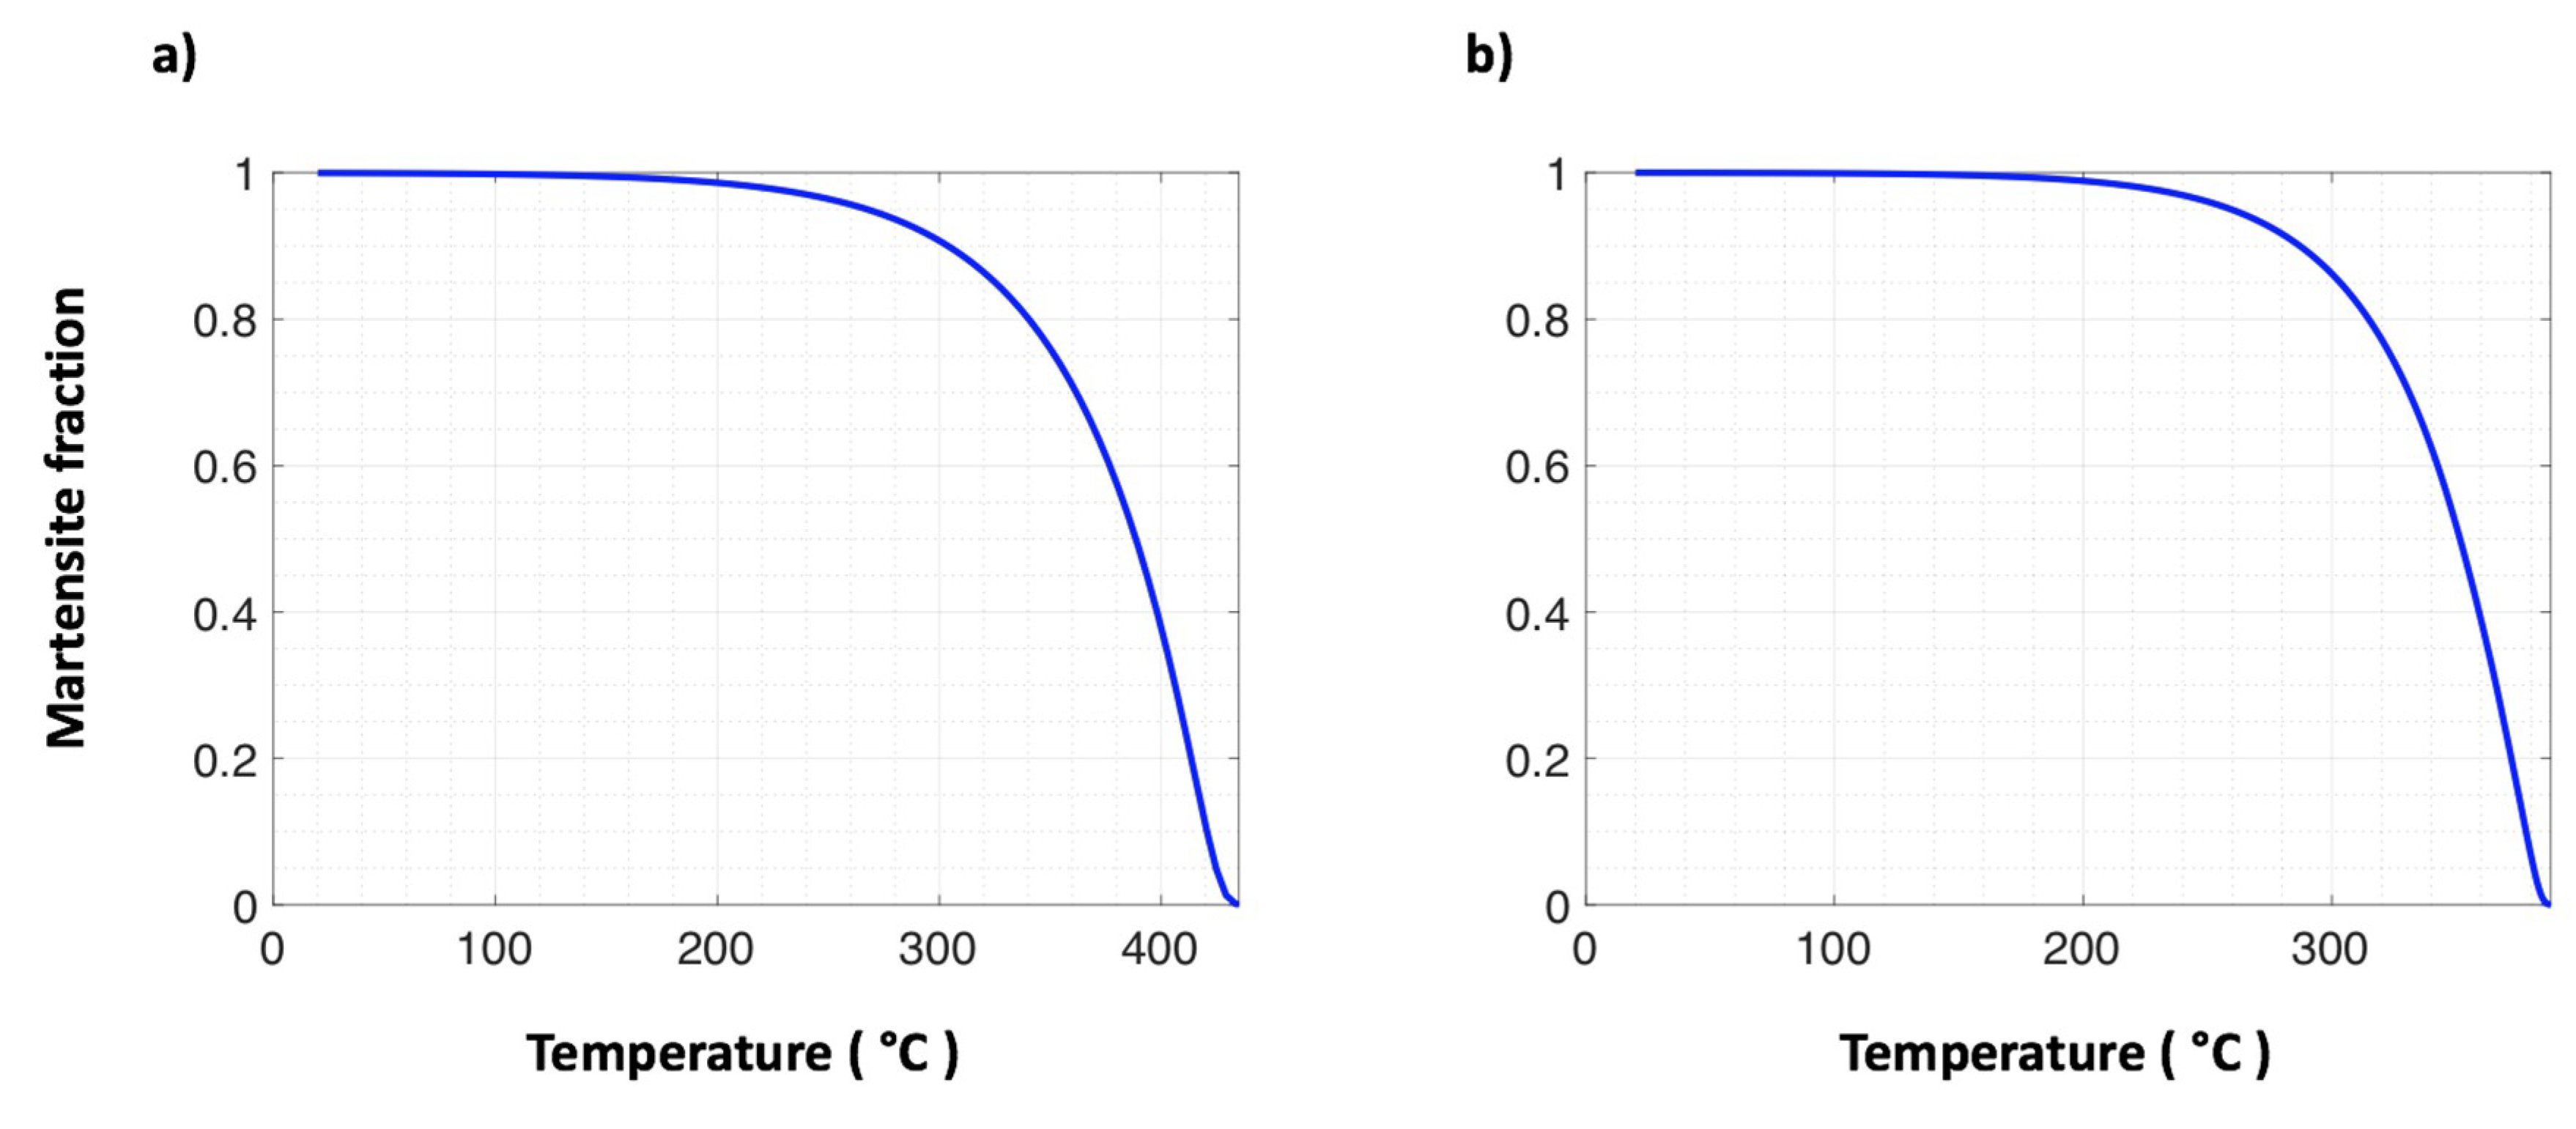
Figure 1. Martensite fraction vs. temperature constructed using a modified Koistinen-Marburger equation that includes the effects of microsegregation as described in Ramesh Babu et al. [14]. (a) The 0.12C and (b) the 0.23C steel.
Metals 10 00850 g001
Figure 2. Microstructure of the 0.12C steel austenitized and quenched at 1000 °C/s. (a) SEM InLens secondary electron image. (b) Scanning transmission electron microscopy (STEM) image from a thin foil specimen.
Metals 10 00850 g002
Figure 3. Microstructure of the 0.12C steel austenitized and quenched at 120 °C/s. (a) SEM InLens secondary electron image. (b) STEM image. (c) TEM image of cementite precipitates as pointed by the red arrow. (d) Selected area diffraction (SAD) pattern showing indexed cementite spots. Cementite zone axis: [001].
Metals 10 00850 g003
Figure 4. Microstructure of the 0.23C steel austenitized and quenched at 1000 °C/s. (a) SEM InLens secondary electron image. (b) STEM image. (c) Bright-field TEM image of cementite precipitates. (d) Corresponding dark-field image of cementite precipitates. (e) SAD pattern showing indexed cementite spots. Cementite zone axis: [234].
Metals 10 00850 g004
Figure 5. Microstructure of the 0.23C steel austenitized and quenched at 120 °C/s. (a) SEM InLens secondary electron image. (b) STEM image. (c) Bright-field TEM image of cementite precipitates. (d) Corresponding dark-field image of cementite precipitates. (e) SAD pattern showing indexed cementite spots. Cementite zone axis: [110].
Metals 10 00850 g005
Figure 6. Schematic of the 2D geometry used in the DICTRA simulations showing assumed ferrite and austenite half-thicknesses where (a) represents the situation just under the Ms temperature, and (b) represents the situation when approximately 90% of the austenite has transformed to martensite. The black, yellow, and the dotted lines within the geometry are the locations where the change in carbon concentration was calculated.
Metals 10 00850 g006
Figure 7. Comparison of the rate of carbon depletion from the lath matrix by diffusion into austenite or by precipitation of cementite in a time span of 0.1 s from the instant of lath formation for the 0.12C steel. (a) 1000 nm thick lath formed at 435 °C, cooling rate is 1000 °C/s. (b) 100 nm thick lath formed at 300 °C, cooling rate is 1000 °C/s. (c) 1000 nm thick lath formed at 435 °C, cooling rate is 120 °C/s. (d) 100 nm thick lath formed at 300 °C, cooling rate is 120 °C/s. Abscissa shows the time after lath formation and corresponding temperatures.
Metals 10 00850 g007
Figure 8. Comparison of the rate of carbon depletion from the lath matrix by diffusion into austenite or by precipitation of cementite in a time span of 0.1 s from the instant of lath formation for the 0.23C steel. (a) 1000 nm thick lath formed at 388 °C, cooling rate is 1000 °C/s. (b) 100 nm thick lath formed at 290 °C, cooling rate is 1000 °C/s. (c) 1000 nm thick lath formed at 388 °C, cooling rate is 120 °C/s. (d) 100 nm thick lath formed at 290 °C, cooling rate is 120 °C/s. Abscissa shows the time after lath formation and corresponding temperatures.
Metals 10 00850 g008
Figure 9. Carbon content (ppm) remaining at room temperature (23 °C) in ferrite after diffusion of carbon into austenite assuming no carbide precipitation. The 0% position indicates the centre of the lath and the 100% position indicates the interface between ferrite and austenite. The key gives the steel codes, lath formation temperatures, subsequent cooling rates, and lath half-thickness.
Metals 10 00850 g009
Figure 10. Comparison of predicted as-quenched carbon concentration profiles in laths formed at 290 °C in the 0.23C steel for two thicknesses of austenite in the one-dimensional DICTRA model. Lath half-thickness of 50 nm and austenite thickness of 5 and 50 nm. (a) Ferrite, 1000 °C/s; (b) austenite, 1000 °C/s; (c) ferrite, 120 °C/s; (d) austenite, 120 °C/s. The dashed line in (b) and (d) represents the 5 nm austenite thickness.
Metals 10 00850 g010
Figure 11. Microstructure of the 0.12C steel austenitized and quenched at 1000 °C/s. (a) Bright-field TEM image showing the martensitic laths. (b) Corresponding dark-field image with the bright regions indicating retained austenite. (c) SAD pattern showing the indexed austenite spot.
Metals 10 00850 g011
Figure 12. SEM images of the coarse auto-tempered laths and relatively less tempered laths. (a) 0.12C steel, 1000 °C/s, (b) 0.12C steel, 120 °C/s, (c) 0.23C steel, 1000 °C/s, (d) 0.23C steel, 120 °C/s. The green arrows point to close-ups showing the boundary region of the coarse region (indicated by red arrows). In the quenched 0.12C steel, a distinct precipitate-free zone is present at the boundaries of the coarse laths. Such is either not present or is very thin in the quenched 0.23C steel.
Metals 10 00850 g012
Table 1. Chemical compositions in wt%.
Steel CodeCMnSiCrNiTiVAlFe
0.12C0.1261.660.720.270.0380.0270.0470.054Bal.
0.23C0.2231.260.420.250.0440.0190.0430.058Bal.
Table 2. Start temperatures for the simulations.
Alloy500 nm Ferrite Half-Thickness 50 nm Ferrite Half-Thickness
Lath Formation Temperature (°C)Lath Formation Temperature (°C)
0.12C steel435300
0.23C steel388290
Table 3. Carbon content (ppm) remaining at room temperature (23 °C) in the ferrite matrix after the precipitation of carbides.
Steel Code0.12C0.23C
Lath Formation Temperature, °C434 °C300 °C388 °C290 °C
1000 °C/s4.3n.a.0343.5
120 °C/s0n.a.00
n.a.: Not applicable.
Table 4. Minimum austenite half-thickness values needed to accommodate carbon concentration profiles.
Steel Code0.12C0.23C
Cooling rate (C/s)12010001201000
Lath formation temperature (°C)435300435300388290388290
Minimum austenite half-width (nm)705355555 205