Abstract
This work is devoted to studying the accumulation of hydrogen in titanium coatings to use a completely new concept of hydrogen accumulators based on a system of easily replaceable cartridges. Modern hydrogen accumulators based on magnesium powder have several problems associated with uneven heating during hydrogen desorption. Increasing the efficiency of hydrogen accumulators and the possibility of their reuse and/or repair remains a topical problem. For the analysis of the microstructure of the received titanium coatings, scanning electron microscopy (SEM) was used, the structural-phase state was studied using x-ray diffraction (XRD) analysis. The coatings were hydrogenation by gas-phase saturation at 450–550 °C. Increased film thickness reduced the storage capacity of coatings. Besides hydrogenation at 450 °C, 20 µm of titanium coatings accumulated 3.96 wt.%, while 80 µm of coatings accumulated 3.98 wt.%. The chemical composition of the coatings before and after the hydrogenation was controlled using glow-discharge optical emission spectroscopy.
1. Introduction
Hydrogen atoms, having a uniquely small mass and size, can be effectively accumulated in the crystal lattice of metals. Thus, in some metal hydrides, the packing density of hydrogen atoms may exceed the density of liquid hydrogen. In this regard, metal hydrides are often considered as materials for hydrogen storage [1,2,3]. The storage of hydrogen in metal hydrides is the safest method and allows us to reach high values of volume and gravimetric density of hydrogen storage. Among the metal hydride materials, a promising material for the storage and transportation of hydrogen is magnesium hydride due to the high gravimetric content of hydrogen in the hydride material, which is about 7.6% by weight [4,5,6,7,8,9,10,11,12,13,14,15,16,17,18,19,20,21,22,23,24]. Nevertheless, the use of magnesium as a reversible absorber of hydrogen is problematic because of the high temperature (more than 300 °C) [25,26,27,28] required for the desorption of hydrogen from magnesium hydride at an acceptable rate. There are some problems when using magnesium powder as a storage material in hydrogen accumulators. Tanks with magnesium powder used as the main fuel for the accumulator do not have uniform heating for hydrogen sorption/desorption, as a consequence, magnesium powder was sintering near the heating element. Therefore, the powder, which was far away from the heating element, could not be fully heated for thermal desorption, which resulted in a low efficiency of hydrogen accumulation (35%). Thus, the practical use of magnesium-based hydrogen storage materials can be difficult because it requires careful temperature control during thermal desorption to avoid overheating [29,30]. Bulk Mg has low hydrogen sorption/desorption activity and usually requires temperatures of up to 350 °C to produce hydrogen.
At present, metal film coatings as hydrogen accumulators for disposable (battery) or reusable (accumulator) action are of great interest for research [31,32,33]. Mg film consists of nanocrystals and amorphous crystals in which the rate of hydrogen diffusion is fast, which speeds up the rate of hydrogen sorption/desorption. These films are well studied, but there is a problem of the oxidation of Mg applied by the magnetron sputtering method [34,35]. Titanium alloys are widely used as structural and functional materials in medicine, automobile, aerospace, and chemical industry due to their high strength, corrosion resistance, biocompatibility, and low weight. Spherical pure titanium powder is characterized by very low resistance to hydrogen sorption. During hydrogenation, the titanium powder accumulates up to 4.01 wt.% hydrogen, which makes it an excellent candidate for use as a storage material.
The design of the film hydrogen accumulator is based on the concept of modular performance of the hydrogen accumulator in the form of a system of easily replaceable in the course of operation cartridges containing hydrogen in a bound state in the hydrogen-saturated film coating applied to a metal foil tape, which can then be rolled up in a spiral or other form with a geometry that provides a high degree of compaction [33]. To fix the cartridges, a system of heat-exchange elements with bee honeycomb geometry is used; metals or alloys with high ohmic resistance are chosen as foil materials, which are determined by the effective use of low inertia hydrogen thermodesorption modes. The hydrogen desorption from the metal-hydride film, when a current passes through the foil, is much more uniform and has significantly less inertia when compared with the desorption from volumetric powder metal hydrides as the result of heating of the outer or inner cartridge surface.
Important requirements for hydrogen storage materials are high hydrogen capacity, good cyclic stability, low hydrogenation, and dehydrogenation temperatures and pressures. However, there is currently no clear understanding of the priority of hydrogen storage mechanisms in metal films. Possible hydrogen binding mechanisms in metal films are hydrides, pseudohydrides, inter-grain binding, and adsorption in the pores. Furthermore, the thickness and porosity of metal films can affect sorption characteristics due to the various mechanisms of hydrogen diffusion. Therefore, it is of practical and scientific interest to determine the peculiarities of hydrogen accumulation and distribution in metallic coatings depending on the application and hydrogenation conditions.
2. Materials and Research Methods
Samples of stainless steel 0.12% carbon, 18% chromium, nickel 10% were used as substrates; the analog of this stainless steel is S32109. Sample sizes of 20 × 20 × 1 mm3 were used as substrates. The surface of the substrates was prepared as follows: (1) Sanding and polishing of samples using silicon carbide sanding paper with ISO marks from 160 to 4000; (2) Rinsing in an ultrasonic bath with acetone for 20 min; and (3) Additional rinsing in acetone immediately before placing the samples in the chamber for coating deposition.
The deposition of titanium (Ti) coatings was performed using a non-commercial Raduga Spectr unit designed at Tomsk Polytechnic University [36]. Coating deposition was carried out by the cathodic-arc deposition (CAD) method (physical vapor deposition). The principle of the CAD method consists of the condensation of the coating material on the substrate from the plasma flow generated from the cathode spots of the vacuum arc of high-current low voltage discharge. To generate the plasma flow, a vacuum arc evaporator with a commercially pure titanium (CP-Ti, 99.95% purity) cathode was used. The use of the arc discharge provides the formation of metallic plasma with a high degree of ionization (over 90%). The average charge state of titanium ions was ~2.
The deposition parameters of the Ti coatings on steel substrates are presented in Table 1. The coating thickness was determined by scanning electron microscopy (SEM).

Table 1.
Deposition parameters.
The microstructure of the as-received coatings was analyzed using a scanning electron microscope TM-2800 (Hitachi, Chiyoda, Japan). For microstructure characterization, the following preparation steps were performed: (1) Electro spark cutting of samples; (2) Grinding and polishing using SiC papers graded from 600 to 4000; and (3) Rinsing in an ultrasonic bath with acetone. The density of deposited coatings was estimated based on mass gain data (the difference between the mass of the coated and uncoated sample), the surface area of the sample, and average coating thickness. The mass gain of the samples was measured using an analytical balance machine (Sartorius CP124 S, Sartorius AG, Göttingen, Germany) with an accuracy of 10−4 g.
Hydrogenation of titanium coatings was carried out from the hydrogen medium on the automated complex gas reaction controller. Samples were placed in a reaction chamber, and the chamber was vacuumed and heated to a specified temperature at a rate of 6 °C/min. The hydrogenation temperature varied from 450 °C to 550 °C in 50 °C increments. After heating, hydrogen was injected into the chamber with the sample, and the hydrogen pressure in the chamber was 2 atmospheres and kept constant. The hydrogenation was carried out until the equilibrium hydrogen concentration in the sample was reached. After the completion of the hydrogenation, the chamber was evacuated and slowly cooled at a rate of 2 °C/min [37].
Evaluation of the phase composition and structure of titanium coatings in the initial and hydrogenated states was carried out by x-ray structure analysis on a Shimadzu XRD 7000S (Shimadzu Corporation, Kyoto, Japan) diffractometer equipped with a One Sight high-speed wide-angle detector. Diffraction patterns were recorded at the following parameters: Angle range by 2θ: 30–90°; scanning speed −10°/min; scanning step −0.0143°; exposure time at the point −21.49 s; voltage −40 kV; current strength −30 mA. Diffractogram analysis and phase identification were performed using the PDF4 + 2019 database and Powder Cell 2.4 software (Federal Institute for Materials Research and Testing, Berlin, Germany).
The determination of hydrogen content in titanium coatings was performed by melting in an inert gas environment using a LECO RHEN 602 hydrogen analyzer (LECO, St. Joseph, MI, USA).
The study of hydrogen distribution in titanium coatings in the initial and hydrogenated states was performed by optical emission spectrometry of high-frequency glow discharge on GD-Profiler 2 (Horiba, Kyoto, Japan). Distribution of chemical elements by depth was studied at the following sputtering parameters: Power 35 W, pressure 650 Pa, frequency 13.56 MHz. Atomization was carried out on an anode with a diameter of 4 mm; the working gas of the plasma was argon. Hommel Tester T1000 profiler (Hommelwerke GmbH, Schwenningen, Germany) was used in the analysis of the coating thickness.
3. Results and Discussion
3.1. Coating Microstructure
It was assumed that the increase in the coating thickness should reduce the hydrogen sorption ability due to the growth of the hydride layer, which inhibits the diffusion of hydrogen. Thus, to increase hydrogen diffusivity in thick coatings, it was proposed to increase their porosity. For this purpose, the formation of thick (80 μm) coatings was carried out at higher arc current and smaller distance to the substrate (Table 1), which provided an increase in the droplet fraction and deposition rate. Figure 1 demonstrates the typical microstructures of the Ti coatings deposited on Si substrates under the conditions presented in Table 1 (for lower deposition time). It can be clearly seen that during the deposition in mode 1, the formation of a denser titanium coating with lower microdroplet fraction occurred. This occurred both due to the decrease in the arc current and enhanced adatom mobility on the surface under substrate biasing [38,39]. In the case of deposition in mode 2, the coating had more defects, formed mainly by the incorporation of a large number of microdroplets into the coating structure.
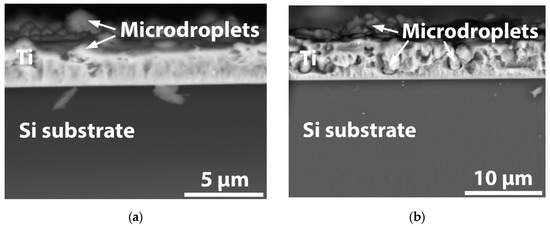
Figure 1.
Typical scanning electron microscopy (SEM) images of the Ti coatings deposited on Si substrates during test deposition: Mode 1 (a) and mode 2 (b).
Figure 2 shows the cross-section SEM images of the as-received Ti coatings deposited on stainless steel substrates. Some polishing traces and pores were visible on the polished surfaces. Since no etching of samples was done, most pores in the coating could be filled during the polishing process. There was some variation in the coating thickness, which was due to uneven growth when the droplet fraction was deposited. The coatings had good adhesion to steel substrates as the interface had no defects or coating delamination. The density of the coatings estimated by weight measurements was (4.1 ± 0.4) g/cm3 for the 20 μm (mode 1) and (3.60 ± 0.22) g/cm3 for the 80 μm (mode 2) Ti coatings.
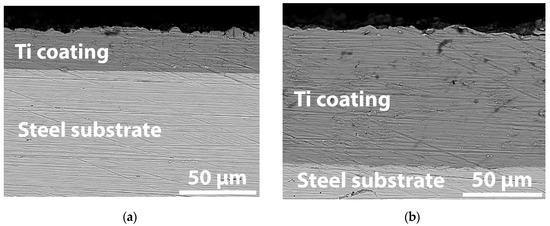
Figure 2.
Cross-section SEM images of the samples with Ti coatings: 20 μm (a); 80 μm (b).
Figure 3 shows the graph of the distribution of chemical elements by depth, where it can be seen that in the initial state in the samples, the content of impurities including hydrogen was very low, and the transition of the coating is clearly expressed.
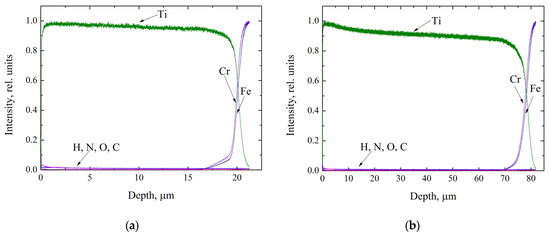
Figure 3.
Depth distribution profile of chemical elements for 20 µm (a) and 80 µm (b) titanium coatings.
3.2. Hydrogenation of Titanium Coatings at the Gas Reaction Controller Automated System
Figure 4 shows the curves of hydrogen sorption in the samples with titanium coatings of each thickness. The linear sections of the sorption curves were used to determine the hydrogen sorption rate for each sample for each hydrogenation temperature. In addition, the maximum hydrogen concentration accumulated in the sample was determined. This hydrogen concentration value was determined volumetrically using special software of the gas reaction controller automated complex. Measurement of the hydrogen content in two ways generally improves the accuracy of the hydrogen concentration determination.
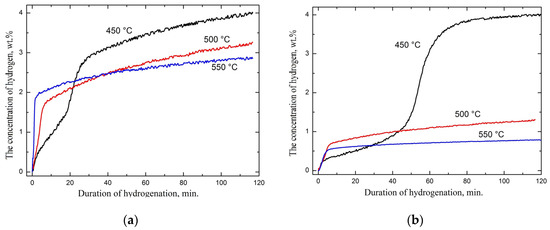
Figure 4.
Hydrogen sorption curves at different hydrogen sorption temperatures for the sample with coatings of 20 (a) and 80 (b) µm, respectively.
Table 2 shows the values of hydrogen sorption rate and maximum hydrogen concentration that were achieved during the hydrogenation of each sample. The absorption rate was calculated in the initial sections of the sorption curve by approximation.
Table 2.
Sorption rate and maximum hydrogen concentration depending on the hydrogenation temperature for each sample.
By analyzing the curves of hydrogen sorption by the titanium coating samples and the values of the hydrogen sorption rate and maximum hydrogen concentration in the samples, we can see that increasing the temperature of hydrogen sorption led to an increase in the rate of hydrogen sorption. The maximum hydrogen concentration in the samples decreased with the increase in the hydrogen sorption temperature. It is important to note that the coatings with the titanium thickness of 20 µm compared to coatings with the titanium coating thickness of 80 µm were characterized by higher values in both the rate of hydrogen sorption and the maximum hydrogen content. The difference in the kinetics of hydrogenation and capacity of titanium coatings with different thicknesses could have be caused by the following factors. The first factor is the difference in coating structure due to thermal influence during cathodic-arc deposition. Coatings with greater thicknesses are subjected to more intense and prolonged heating due to the shorter distance from the cathode to the substrate and higher values of arc discharge current. Such influence can affect both the coating growth and its crystal structure, which can be expressed in a reduction of the concentration of lattice defects and, accordingly, in an increase in the diffusion mobility of hydrogen atoms through an intracrystalline diffusion mechanism. The second factor can be caused by the difference in the effective surface area of coatings at the interaction with hydrogen. Thus, a titanium coating with a thickness of 80 μm has a bigger effective surface area in comparison with the coating with a thickness of 20 μm due to more developed surface and additional side area (contribution of the latter is not more than 1.2%).
3.3. X-Ray Diffraction of Titanium Coatings
The results of the x-ray diffraction analysis shows that the as-received coatings consist of an α-Ti phase with a hexagonal close packaged lattice (Figure 5). There were no phases related to the substrate on the diffraction patterns due to the large thickness of the deposited coatings.
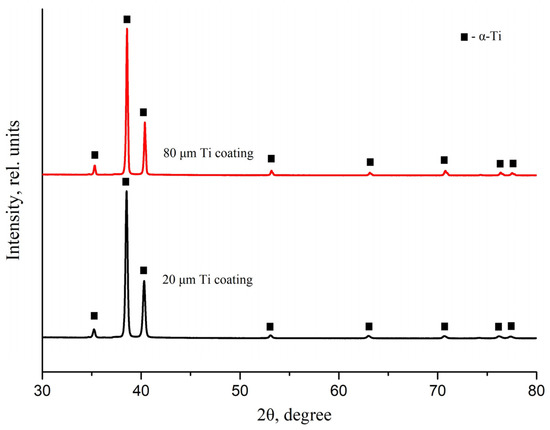
Figure 5.
Diffraction patterns of the as-received Ti coatings.
Diffraction patterns of the Ti coatings with a 20 µm thickness after hydrogenation at various temperatures are shown in Figure 6. The structural parameters of the coatings are presented in Table 3.
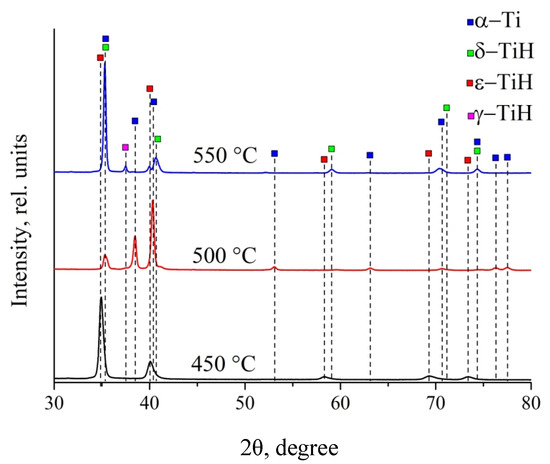
Figure 6.
Diffraction patterns of the 20 μm Ti coating after hydrogenation at various temperatures.
Table 3.
Structural parameters of the 20 μm Ti coating after hydrogenation.
The analysis of diffraction patterns shows the formation of ε titanium hydride with a face-centered tetragonal lattice close to the TiH2 stoichiometric hydride in samples hydrogenated at 450 °C. An increase in temperature to 500 °C leads to the formation of δ titanium hydride and α titanium phases. The temperature increase up to 550 °C is accompanied by the formation of metastable γ hydride, along with δ hydride and α titanium phase.
Figure 7 shows the diffraction patterns of the Ti coating with 80 µm thickness after hydrogenation at various temperatures. The structural parameters of the 80 µm Ti coating are presented in Table 4.
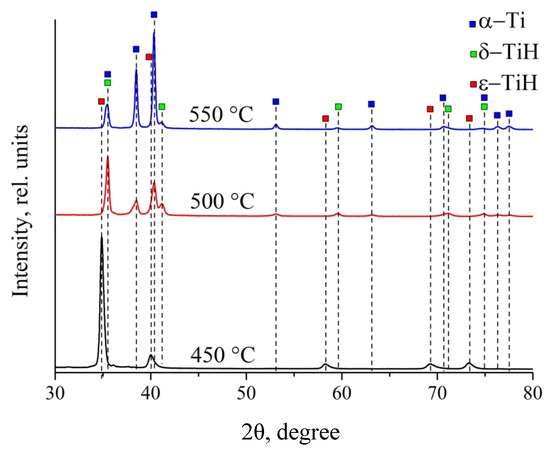
Figure 7.
Diffraction patterns of the 80 µm Ti coating after hydrogenation at various temperatures.
Table 4.
Structural parameters of the 80 µm Ti coating after hydrogenation.
Hydrogenation at 450 °C is accompanied by the formation of ε titanium hydride with a face-centered tetragonal lattice close to the stoichiometric TiH2 hydride. The phase composition of the coatings significantly changes with increasing temperature up to 500 °C. The α titanium and δ titanium hydride phases with the volume content of 52.5% and 47.5%, respectively, form as a result of hydrogenation at 500 °C. Further temperature increase up to 550 °C does not change the phase composition, but redistributes content between two phases. In this case, the volume content of the δ hydride decreased to 19.1%. Such regularity was observed in the 20 µm Ti coating at the same temperatures. Thus, it can be concluded that the tendency to decrease the fraction of hydrides and, consequently, to increase the content of α-phase in titanium coatings remains, regardless of the thickness.
3.4. Determination of Hydrogen Content in Coatings by Melting in an Inert Gas Medium Using a RHEN 602 Hydrogen Analyzer
According to the results of measuring the hydrogen content in the initial samples, it did not exceed 13 ppm; therefore, it can be concluded that no hydrogen accumulation in the material occurred during coating deposition. Table 5 presents the concentration of hydrogen in the samples of each sample after hydrogenation at different temperatures.
Table 5.
Hydrogen content depending on the hydrogenation temperature for each sample.
An analysis of the hydrogen content for each sample after hydrogenation at different temperatures confirmed the main conclusions made in the previous sections. As can be seen from Table 5, a high hydrogen content was detected in the titanium coating with a thickness of 20 and 80 μm at a temperature of 450 °C.
3.5. Glow-Discharge Optical Emission Spectroscopy Study of the Distribution of Hydrogen in Titanium Coating
The thickness of the obtained coatings was measured by the contact profilometry method after coating sputtering. As can be seen from Figure 8 and Figure 9, the coating was applied evenly, and the thicknesses of the resulting coatings coincided with those specified in Table 1. The distribution of hydrogen in the 20 µm Ti coating by depth after hydrogenation is shown in Figure 8.
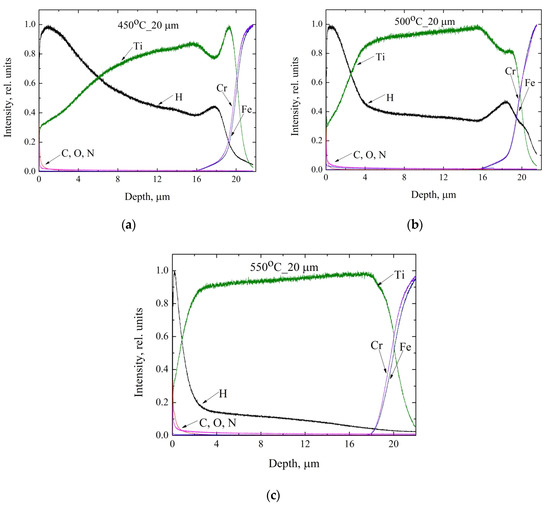
Figure 8.
Distribution of elements in the 20 µm Ti coating during hydrogenation at different temperatures: 450 °C (a), 500 °C (b), and 550 °C (c).
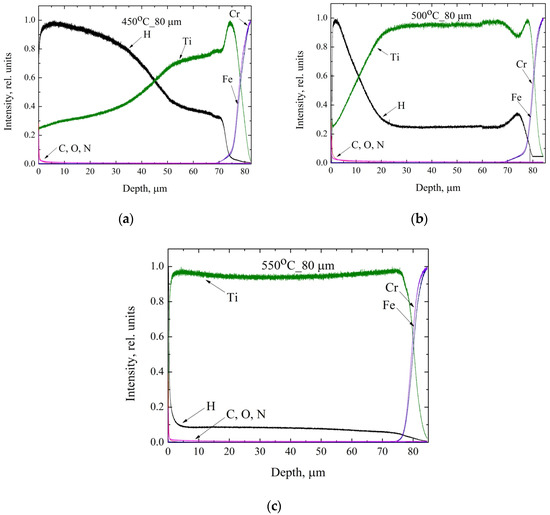
Figure 9.
Distribution of elements in the 80 µm Ti coating during hydrogenation at different temperatures: 450 °C (a), 500 °C (b), and 550 °C (c).
Figure 8 shows that the titanium coating with a thickness of 20 μm after hydrogenation at a temperature of 450 °C and 500 °C was characterized by a high intensity of the hydrogen signal in the coating. Basically, hydrogen accumulated at the surface, and a decrease in hydrogen concentration was observed at depth. At a temperature of 550 °C, the hydrogen concentration was low, mainly through hydrogen accumulation occurring on the surface of the coating.
In Figure 8a,b, there was a hydrogen peak at a depth of 18 μm. This was caused by the diffusion movement of hydrogen to the substrate. It is known that the interface between the coating and the substrate is the place with the greatest structural incoherence. In such places, hydrogen is energetically beneficially distributed. The appearance of the hydrogen peak with a width of about 5 µm near the substrate was apparently due to two reasons. The first reason is that the substrate was not a hydride forming material and the hydrogen diffusion rate in steel is several orders of magnitude lower than in titanium under experimental conditions. This led to hydrogen accumulation near the substrate-coating interface. The second reason for the appearance of the wide hydrogen peak near the substrate-coating interface was due to the different sputtering rates of materials such as titanium hydride and steel.
The distribution of hydrogen and the 80 μm Ti coating in depth after hydrogenation are shown in Figure 9.
Figure 9 shows that a titanium coating with a thickness of 80 μm after hydrogenation at 450 °C was characterized by a high intensity of the hydrogen signal in the coating; at depth, a decrease in the hydrogen concentration relative to the surface was observed. During hydrogenation at a temperature of 500 °C, the diffusion of hydrogen to the substrate occurred due to the higher hydrogenation temperature, but the hydrogen concentration decreased at 500 °C. At depth, a uniform distribution of hydrogen was observed. At a temperature of 550 °C, the hydrogen concentration was low, and hydrogen accumulation mainly occurred on the surface of the coating.
In Figure 9b, the same was observed as in Figure 8a,b. In Figure 9a, a different picture can be observed because of the greater thickness of the coating, where a thicker layer of ε titanium hydride formed with a face-centered tetragonal lattice close to the stoichiometric hydride TiH2. This hydride is an obstacle to hydrogen penetration. Therefore, in Figure 8a,b, we can observe the hydrogen peak at the boundary of the titanium coating and substrate. In Figure 9a, no hydrogen peak was observed at the boundary of the titanium coating and substrate due to the formed thick layer of ε titanium hydride.
4. Summary
The deposition of titanium by the cathode-arc method on stainless steel samples at various parameters allowed for the formation of porous and dense coverings with thicknesses of 20 and 80 microns. Precipitated coatings contained 100% α-phase of titanium with a hexagonal tightly packed lattice. In the deposited titanium coatings, the hydrogen content did not exceed 0.0013 wt.%, the coating was uniform, and the transition of the coating-substrate was marked. The 20 µm Ti coatings accumulated 3.96 wt.% of hydrogen during hydrogenation at 450 °C. Increasing the hydrogenation temperature to 500 °C led to a reduction of the capacity to 3.24 wt.%. Further increase of the temperature up to 550 °C led to a further reduction of the capacity to 2.84 wt.%. The 80 µm Ti coatings accumulated 3.98 wt.% hydrogen during hydrogenation at 450 °C. The increase of the hydrogenation temperature up to 500 °C led to the reduction of the capacity to 1.29 wt.%. Further increase of the temperature up to 550 °C led to a further decrease of the capacity to 0.78 wt.%. The structural-phase features of titanium coatings after hydrogenation correlated with the regularities of the hydrogenation process. For all samples, the phase composition depended on the hydrogen concentration where the higher the hydrogen concentration, the higher the volume fraction of hydrides in the coating. The distribution of elements investigated by GD-OES including hydrogen showed that there were no impurities in the initial samples before the hydrogenation. After hydrogenation, the data were fully correlated with other methods. It is important to note that depending on the thickness of the coating during hydrogenation, the distribution of hydrogen differs. The difference was observed in the 80 µm of titanium coating at the hydrogenation temperature of 450 °C and the thick layer of the resulting titanium hydride prevented the penetration of hydrogen into the substrate.
Author Contributions
A.L. (Andrey Lider) and D.K. made the organization of the workflow and preparation of the article, E.K. and M.S. performed the XRD tests, A.L. (Anton Lomygin) and I.S. conducted experiments on hydrogenation, V.K., T.M., and A.I. undertook the analysis of the results. All authors have read and agreed to the published version of the manuscript.
Funding
This research received no external funding.
Acknowledgments
This work was carried out within the framework of the Competitiveness Enhancement Program of National Research Tomsk Polytechnic University (VIU-OEF-177/2020).
Conflicts of Interest
The authors declare no conflict of interest.
References
- Lai, Q.; Paskevicius, M.; Sheppard, D.A.; Buckley, C.E.; Thornton, A.W.; Hill, M.R.; Gu, Q.; Mao, J.; Huang, Z.; Liu, H.K.; et al. Hydrogen Storage Materials for Mobile and Stationary Applications: Current State of the Art. ChemSusChem 2015, 8, 2789–2825. [Google Scholar] [CrossRef]
- Luo, X.; Zhang, J.; Jing, X.; Hu, B. The research status and development of hydrogen storage materials. Mater. Rev. 2007, 21, 118–120. [Google Scholar]
- Karpov, D. Film metal-hydride hydrogen accumulators: Potentials, production methods, prospects for application. In Proceedings of the International Conference on Innovative Applied Energy, Oxford, UK, 14–15 March 2019. Article 257 (ID:738), 38. [Google Scholar]
- Liu, W.; Aguey-Zinsou, K.F. Hydrogen storage properties of in-situ stabilised magnesium nanoparticles generated by electroless reduction with alkali metals. Int. J. Hydrog. Energy 2015, 40, 16948–16960. [Google Scholar] [CrossRef]
- Pukazhselvan, D.; Kumar, V.; Singh, S.K. High capacity hydrogen storage: Basic aspects, new developments and milestones. Nano Energy 2012, 1, 566–589. [Google Scholar] [CrossRef]
- Wang, Y.; Wang, Y. Recent advances in additive-enhanced magnesium hydride for hydrogen storage. Prog. Nat. Sci. Mater. Int. 2017, 27, 41–49. [Google Scholar] [CrossRef]
- Bliznakov, S.; Drenchev, N.; Drenchev, B.; Delchev, P.; Solsona, P.; Spassov, T. Electrochemical properties of nanocrystalline Mg2Ni-type alloys prepared by mechanical alloying. J. Alloys Compd. 2005, 404–406, 682–686. [Google Scholar] [CrossRef]
- Anik, M. Improvement of the electrochemical hydrogen storage performance of magnesium based alloys by various additive elements. Int. J. Hydrog. Energy 2012, 37, 1905–1911. [Google Scholar] [CrossRef]
- Ju, J.; Fu, H.; Lei, Y. Effect of Al addition on microstructure and properties of an Fe-B-Al alloy. Mater. Test. 2016, 58, 753–762. [Google Scholar] [CrossRef]
- Luo, Q.; An, X.H.; Pan, Y.B.; Zhang, X.; Zhang, J.Y.; Li, Q. The hydriding kinetics of Mg-Ni based hydrogen storage alloys: A comparative study on Chou model and Jander model. Int. J. Hydrog. Energy 2010, 35, 7842–7849. [Google Scholar] [CrossRef]
- Goo, N.H.; Lee, K.S. The electrochemical hydriding properties of Mg-Ni-Zr amorphous alloy. Int. J. Hydrog. Energy 2002, 27, 433–438. [Google Scholar] [CrossRef]
- Zhang, Y.H.; Li, B.W.; Ma, Z.H.; Guo, S.H.; Qi, Y.; Wang, X.L. Improved hydrogen storage behaviours of nanocrystalline and amorphous Mg2Ni-type alloy by Mn substitution for Ni. Int. J. Hydrog. Energy 2010, 35, 11966–11974. [Google Scholar] [CrossRef]
- Zhang, Y.; Zhang, H.; Ding, X.; Liu, D.; Zhang, Q.; Si, T. Microstructure characterization and hydrogen storage properties study of Mg2Ni0.92M0.08 (M = Ti, V, Fe or Si) alloys. Prog. Nat. Sci. Mater. Int. 2018, 28, 464–469. [Google Scholar] [CrossRef]
- Sun, H.; Feng, D.; Zhang, Y.; Ren, H. Gas hydrogen absorption and electrochemical properties of Mg 24 Ni 10 Cu 2 alloys improved by Y substitution, ball milling and Ni addition. Int. J. Hydrog. Energy 2019, 44, 5382–5388. [Google Scholar] [CrossRef]
- Grigorova, E.; Khristov, M.; Khrussanova, M.; Bobet, J.L.; Peshev, P. Effect of additives on the hydrogen sorption properties of mechanically alloyed composites based on Mg and Mg2Ni. Int. J. Hydrog. Energy 2005, 30, 1099–1105. [Google Scholar] [CrossRef]
- Nielsen, T.K.; Besenbacher, F.; Jensen, T.R. Nanoconfined hydrides for energy storage. Nanoscale 2011, 3, 2086–2098. [Google Scholar] [CrossRef] [PubMed]
- Korablov, D.; Besenbacher, F.; Jensen, T.R. Kinetics and thermodynamics of hydrogenation-dehydrogenation for Mg-25%TM (TM = Ti, Nb or V) composites synthesized by reactive ball milling in hydrogen. Int. J. Hydrog. Energy 2018, 43, 16804–16814. [Google Scholar] [CrossRef]
- Tarasov, B.P.; Arbuzov, A.A.; Mozhzhuhin, S.A.; Volodin, A.A.; Fursikov, P.V.; Lototskyy, M.V.; Yartys, V.A. Hydrogen storage behavior of magnesium catalyzed by nickel-graphene nanocomposites. Int. J. Hydrog. Energy 2019, 44, 29212–29223. [Google Scholar] [CrossRef]
- Lyu, J.; Lider, A.; Kudiiarov, V. Using ball milling for modification of the hydrogenation/dehydrogenation process in magnesium-based hydrogen storage materials: An overview. Metals 2019, 9, 768. [Google Scholar] [CrossRef]
- Cortez, J.J.; Castro, F.J.; Troiani, H.E.; Pighin, S.A.; Urretavizcaya, G. Kinetic improvement of H2 absorption and desorption properties in Mg/MgH2 by using niobium ethoxide as additive. Int. J. Hydrog. Energy 2019, 44, 11961–11969. [Google Scholar] [CrossRef]
- Crivello, J.C.; Dam, B.; Denys, R.V.; Dornheim, M.; Grant, D.M.; Huot, J.; Jensen, T.R.; de Jongh, P.; Latroche, M.; Milanese, C.; et al. Review of magnesium hydride-based materials: Development and optimisation. Appl. Phys. A Mater. Sci. Process. 2016, 122, 1–20. [Google Scholar] [CrossRef]
- Aguey-Zinsou, K.F.; Ares-Fernández, J.R. Hydrogen in magnesium: New perspectives toward functional stores. Energy Environ. Sci. 2010, 3, 526–543. [Google Scholar] [CrossRef]
- Suárez-Alcántara, K.; Palacios-Lazcano, A.F.; Funatsu, T.; Cabañas-Moreno, J.G. Hydriding and dehydriding in air-exposed MgFe powder mixtures. Int. J. Hydrog. Energy 2016, 41, 23380–23387. [Google Scholar] [CrossRef]
- Chen, X.; Zou, J.; Zeng, X.; Ding, W. Hydrogen storage properties of a Mg-La-Fe-H nano-composite prepared through reactive ball milling. J. Alloys Compd. 2017, 701, 208–214. [Google Scholar] [CrossRef]
- Shao, H.; Xin, G.; Zheng, J.; Li, X.; Akiba, E. Nanotechnology in Mg-based materials for hydrogen storage. Nano Energy 2012, 1, 590–601. [Google Scholar] [CrossRef]
- Lotoskyy, M.; Denys, R.; Yartys, V.A.; Eriksen, J.; Goh, J.; Nyamsi, S.N.; Sita, C.; Cummings, F. An outstanding effect of graphite in nano-MgH2-TiH2 on hydrogen storage performance. J. Mater. Chem. A 2018, 6, 10740–10754. [Google Scholar] [CrossRef]
- Lee, S.M.; Lee, J.Y. Structural relaxation and hydrogen solubility in an amorphous Pd80Si20 alloy. J. Appl. Phys. 1988, 63, 4758–4760. [Google Scholar] [CrossRef]
- Choo, W.Y.; Lee, J.Y. Hydrogen trapping phenomena in carbon steel. J. Mater. Sci. 1982, 17, 1930–1938. [Google Scholar] [CrossRef]
- Izumi, T.; Itoh, G. Thermal desorption spectroscopy study on the hydrogen trapping states in a pure aluminum. Mater. Trans. 2011, 52, 130–134. [Google Scholar] [CrossRef]
- Pressouyre, G.M.; Bernstein, I.M. Example of the Effect of Hydrogen Trapping on Hydrogen Embrittlement. Metall. Trans. A Phys. Metall. Mater. Sci. 1981, 12, 835–844. [Google Scholar] [CrossRef]
- Tal-Gutelmacher, E.; Eliezer, D.; Abramov, E. Thermal desorption spectroscopy (TDS)-Application in quantitative study of hydrogen evolution and trapping in crystalline and non-crystalline materials. Mater. Sci. Eng. A 2007, 445–446, 625–631. [Google Scholar] [CrossRef]
- Karpov, D.A.; Litunovsky, V.N. A Battery for Storing Hydrogen in a Bound State and a Cartridge for the Battery. Patent RU 2606301, 1 October 2017. bul. #1. [Google Scholar]
- Karpov, D.A.; Litunovsky, V.N. Film hydrogen accumulator: Production method and application prospects. In Proceedings of the 13th International Conference “Films and Coatings—2017”, St. Petersburg, Russia, 18–20 April 2017; St. Petersburg, Polytechnic University Press: St. Petersburg, Russia, 2017; pp. 507–510. (In Russian). [Google Scholar]
- Léon, A.; Knystautas, E.J.; Huot, J.; Schulz, R. Hydrogenation characteristics of air-exposed magnesium films. J. Alloys Compd. 2002, 345, 158–166. [Google Scholar] [CrossRef]
- Ross, D.K. Hydrogen storage: The major technological barrier to the development of hydrogen fuel cell cars. Vacuum 2006, 10, 1084–1089. [Google Scholar] [CrossRef]
- Kashkarov, E.B.; Nikitenkov, N.N.; Syrtanov, M.S.; Sutygina, A.N.; Shulepov, I.A.; Lider, A.M. Influence of plasma immersion titanium implantation on hydrogenation and mechanical properties of Zr-2.5Nb. Appl. Surf. Sci. 2016, 370, 142–148. [Google Scholar] [CrossRef]
- Kudiiarov, V.N.; Syrtanov, M.S.; Bordulev, Y.S.; Babikhina, M.N.; Lider, A.M.; Gubin, V.E.; Murashkina, T.L. The hydrogen sorption and desorption behavior in spherical powder of pure titanium used for additive manufacturing. Int. J. Hydrog. Energy 2017, 42, 15283–15289. [Google Scholar] [CrossRef]
- Messier, R.; Giri, A.P.; Roy, R.A. Revised structure zone model for thin film physical structure. J. Vac. Sci. Technol. A Vac. Surf. Films 1984, 2, 500–503. [Google Scholar] [CrossRef]
- Kashkarov, E.B.; Obrosov, A.; Sutygina, A.N.; Uludintceva, E.; Mitrofanov, A.; Weiß, S. Hydrogen permeation, and mechanical and tribological behavior, of CrNx coatings deposited at various bias voltages on IN718 by direct current reactive sputtering. Coatings 2018, 8, 66. [Google Scholar] [CrossRef]


© 2020 by the authors. Licensee MDPI, Basel, Switzerland. This article is an open access article distributed under the terms and conditions of the Creative Commons Attribution (CC BY) license (http://creativecommons.org/licenses/by/4.0/).