Article

Continuous Cooling Transformation Diagrams of 2.25Cr-1Mo-0.25V Submerged-Arc Weld Metal and Base Metal

1
Department of Materials Science, Montanuniversität Leoben, Franz-Josef-Straße 18, 8700 Leoben, Austria
2
voestalpine Böhler Welding Germany GmbH, Hafenstraße 21, 59067 Hamm, Germany
*
Author to whom correspondence should be addressed.
Metals 2020, 10(8), 1055; https://doi.org/10.3390/met10081055
Submission received: 25 June 2020 / Revised: 29 July 2020 / Accepted: 4 August 2020 / Published: 5 August 2020

Abstract

:
The transformation behavior and microstructural evolution during continuous cooling within the heat affected zone between the weld beads of a 2.25Cr-1Mo-0.25V all-weld metal and the corresponding 2.25Cr-1Mo-0.25V base metal were investigated by means of dilatometer measurements, optical and scanning electron microscopy. Furthermore, macro-hardness measurements were conducted and the ferrite phase fraction was analyzed from optical microscopic images using an imaging processing program. Thereupon a continuous cooling transformation (CCT) diagram for the 2.25Cr-1Mo-0.25V base metal and three welding CCT diagrams with different peak temperatures were constructed to realistically simulate the temperature profile of the different regions within the heat affected zones between the weld beads of the multi-layer weld metal. The microstructural constituents which were observed depending on the peak temperature and cooling parameters are low quantities of martensite, high quantities of bainite and in particular lower bainite, coalesced bainite and upper bainite as well as ferrite for the welding CCT diagrams. Regarding the base metal CCT diagram, all dilatometer specimens exhibited a fully bainitic microstructure consisting of lower bainite, coalesced bainite and upper bainite. Only the slowest cooling rate with a cooling parameter of 50 s caused a ferritic transformation. Nevertheless, it has to be emphasized that the distinction between martensite and bainite and the various kinds of bainite was only possible at higher magnification using scanning electron microscopy.

1. Introduction

The creep-resistant alloy 2.25Cr-1Mo-0.25V was developed following the conventional low-alloyed CrMo steels in the early 1990s [1,2]. In comparison to the basic alloy 2.25Cr-1Mo, the V-modified alloy shows several advantages such as an increased resistance to hydrogen embrittlement, a better resistance to overlay disbonding and a good toughness in combination with high levels of mechanical properties at elevated temperatures [3,4,5]. Since 1995, when the Italian company Nuovo Pignone was the first to fabricate a reactor from this V-modified alloy in Europe, it has often been used for heavy wall pressure vessels in power stations or in petroleum and chemical plants, for example in hydrocracking reactors [1,5,6]. For this purpose, the 2.25Cr-1Mo-0.25V steels are commonly joined with submerged-arc welding (SAW). There, the V-modified grade entails some disadvantages compared to the conventional alloy 2.25Cr-1Mo. These are low levels of weld metal toughness directly after welding and a higher sensitivity to reheat cracking in the weld metal or in the heat affected zone (HAZ) of the base metal during the subsequent heat treatment [6,7].
To improve these disadvantages, it is of great importance to know how the numerous welding parameters during SAW affect the microstructure of the resulting weld metal and the HAZ in between the individual weld beads. One of the most important parameters during welding is the heat input, as it directly influences the cooling rate and in further consequence the microstructure and mechanical properties of the multi-layer weld metal and its multiple HAZs. A higher heat input during welding results in a larger weld pool and a longer cooling time, which in further consequence also changes the cooling conditions and the microstructure of the HAZs between the weld beads. Continuous cooling transformation (CCT) diagrams are an important tool for predicting microstructural transformations during heat treatment in steels, but are not applicable for the different areas of the HAZs of a multi-layer weld metal. During welding, usually very high cooling rates occur and each zone in the weld metal experiences different peak temperatures depending on its distance from the weld pool. Therefore, common CCT diagrams are not applicable for predicting the different phases occurring within the HAZ between the weld beads of a complex multi-layer weld metal. Compared to common heat treatments, the HAZs within the all-weld metal only experience very short austenitizing times of just a few seconds, which are too short to homogenize the microstructure leading to an irregular distribution of alloying elements. After this insufficient homogenization, the weld bead and the adjacent HAZ to the subjacent weld bead experience extremely high cooling rates of many hundreds of °C/s, depending on the welding procedure and the distance to the molten weld pool [8]. Furthermore, weld metal commonly consists of numerous non-metallic inclusions which are formed in the liquid face and, in further consequence, influence the phase transformations during cooling [8,9]. For estimating the optimum welding conditions to adjust a certain microstructure in the multi-layer weld metal’s HAZs, the application of welding CCT diagrams is indispensable. Welding CCT diagram created by conducting dilatometer measurements on all-weld metal specimens, give an insight to the microstructural changes within the multiple HAZs in-between the weld beads of a multi-layer weld metal. This is of particular interest for the SAW process, which is often applied for thick walled vessels, where multi-layer welding is the preferred technique.
The literature only provides classical CCT diagrams for the base alloy 2.25Cr-1Mo [10,11,12,13,14] and classical CCT diagrams for other Cr-Mo alloys with various chemical compositions or peak temperatures and cooling rates [12,14,15,16], as well as classical CCT diagrams for the V containing alloys T22 and T24 which differ from the alloy 2.25Cr-1Mo-0.25V in terms of their B, Ti and N content [17]. Unfortunately, these CCT diagrams do not display the transformations taking place in the HAZs of SAW V-modified alloy 2.25Cr-1Mo-0.25V as elements like Cr, Mo and V strongly influence the transformation times and temperatures and the HAZs between the weld beads in a multi-layer weld metal experience a significantly different temperature profile than the temperature profiles used for classical heat treatments [8,9]. No welding CCT diagrams applicable to low Cr creep resistant all-weld metal which display the different HAZs between the individual weld beads are available to the authors’ best knowledge.
The microstructure which develops within the HAZ between the individual weld beads during SAW of a 2.25Cr-1Mo-0.25V multi-layer weld metal is of significant importance for the application under creep load. Yang et al. [18,19,20] investigated the creep behavior of different sub-zones in a low alloyed CrMoV multi-pass weld metal and experienced a remarkable different creep behavior depending on the grain size and morphology of the tested region. According to their studies, the anisotropic creep behavior of the multi-pass weld metal is related to the coupling effect of an inhomogeneous microstructure due to the layered structure and the different HAZs in-between these layers and the loading direction during the creep tests [18,19,20].
Concerning the 2.25Cr-1Mo-0.25V steels chemical composition, it has to be taken into account that higher levels of Cr and Mo have a transformation delaying effect and therefore lead to a shift of the bainite transformation curves to longer cooling times. Beside this effect, Cr, Mo and V cause a reduction in the martensite start temperature and consequently favor the bainitic microstructure. In addition, higher levels of Cr, Mo and V lead to a separation of the pearlite and bainite stage [8,9].
This paper intends to improve the understanding for the phase transformations in the V-modified 2.25Cr-1Mo-0.25V alloy during various heat treatments by providing a classic CCT diagram with a peak temperature of 1200 °C for the base alloy as well as welding CCT-diagrams suitable for the different HAZs between the weld beads in a SAW multi-layer weld metal. For this purpose, three different welding CCT diagrams with varying peak temperatures have been created:
  • 850 °C peak temperature for the intercritically heated zone (ICHAZ)
  • 1000 °C peak temperature for the fine grained heat affected zone (FGHAZ)
  • 1400 °C peak temperature for the coarse grained heat affected zone (CGHAZ)
By creating welding CCT diagrams from weld metal specimens which correspond to the different regions in the HAZ between the individual weld beads, the authors provide a tool for the target-oriented adaption of the SAW parameters. The variation of welding voltage, welding current and travel speed, which strongly influence the cooling rate of the deposited weld bead, offers the possibility to purposefully adjust the microstructure of the HAZs within the multi-layer weld metals. Hereby, the amount of undesired microstructural constituents such as large quantities of martensite and ferrite which can have a negative effect on the weld metals mechanical properties and its behavior under creep conditions can be reduced.

2. Materials and Methods

The dilatometer specimens for the CCT diagrams of the weld metal were taken from a 2.25Cr-1Mo-0.25V multi-layer submerged arc all-weld metal which was built up with two weld beads per layer and 9 layers in total. The weld seam was prepared using two 24 mm thick 2.25Cr-1Mo-0.25V steel plates and a 2.25Cr-1Mo packing strip. The root gap was 22 mm and the bevel angle was 0°. Table 1 shows the used welding parameters.
Table 2 represents the weld metals chemical composition.
Beside the listed elements in Table 2 the weld metal also contains Phosphorus and Sulphur in small amounts (<110 ppm). No post weld heat treatment was applied.
Figure 1 shows a schematic drawing of the weld metals cross section displaying the layered structure consisting of two weld beads per layer. To ensure comparability by avoiding variations in the chemical composition, all dilatometer specimens were taken from the last two weld beads which were not thermally influenced by further weld beads. In addition, the dilatometer specimens were taken from the middle of the last two weld beads with adequate distance to the heat affected zone between the last two weld beads and to the HAZ to the base metal. The positions in the last weld beads where the dilatometer specimens were taken from are marked with dashed circles in Figure 1.
The dilatometer samples for the CCT diagram of the 2.25Cr-1Mo-0.25V base metal were taken from a 24 mm thick steel plate with the chemical composition given in Table 3.
Beside the listed elements in Table 3, the base metal also contains Phosphorus and Sulphur in small amounts (≤60 ppm).
The cylindrical dilatometer specimens had a diameter of 5 mm and a length of 10 mm. The base areas were manually grinded plane parallel and perpendicular to the cylinder axis to ensure a good contact with the measurement device.
The continuous cooling curves were recorded using a quenching dilatometer DIL805 from TA Instruments (New Castle, DE, USA). During the dilatometry experiments the samples where heated up with 20 °C/s and cooled with varying cooling rates to simulate different t8/5-times (= time for cooling the dilatometer specimen from 800 to 500 °C) during welding and heat treatment, respectively. The gas used for cooling was He, as in contrast to N2, it enables fast cooling rates even at low temperatures. In the course of the dilatometer measurements, the relative length change of the cylindrical dilatometer specimens was detected.
For the welding CCT diagrams, the all-weld metal dilatometer specimens were cooled with ten to eleven different t8/5-times of 1/2/5/10/25/50/100/250/500/1000/(2500) s, respectively. The 15 t8/5-times applied for the base metal CCT diagram were 2/5/10/50/80/120/150/200/250/300/500/600/800/2000/5000 s.
To correctly portray the different HAZs between the individual weld beads of the multi-layer weld metal, three different CCT diagrams for the coarse grained HAZ (CGHAZ), the fine grained HAZ (FGHAZ) and the intercritical HAZ (ICHAZ) were generated. The three welding CCT diagrams exhibit the same cooling rates and only differ in terms of their peak temperatures. For the CCT diagram of the CGHAZ the peak temperature was 1400 °C and for the CCT diagram of the FGHAZ it was 1000 °C leading to an austenitic initial state. For the CCT diagram of the ICHAZ, a peak temperature of 850 °C within the intercritical region was chosen leading to an austenitic-ferritic initial microstructure before cooling. Figure 2 shows a modified schematic drawing of a weld bead within a multi-layer weld metal and its adjacent HAZ to the subjacent weld bead as well as the corresponding peak temperatures according to G. Schulze [8]. The peak temperatures chosen for the welding CCT diagrams shown in this study are highlighted in green, blue and red, respectively. It has to be noted that the Fe-Fe3C diagram only gives an indication which phase transformations might take place, as it describes the thermodynamic equilibrium which is only reached at very low cooling rates and is therefore not suitable for the process of welding were usually rapid cooling takes place. Furthermore, it has to be taken into account that the investigated alloy contains a certain amount of alloying elements beside carbon which again influences the phase diagram.
For all three welding CCT diagrams, the dilatometer samples were heated to the peak temperature and then cooled without any dwell time in order to realistically represent the welding process. For the base metal CCT diagram, the dilatometer samples were heated with 20 °C/s to a peak temperature of 1200 °C and then cooled with various cooling rates after a dwell time of 5 min. The continuous cooling curves for the different CCT diagrams of the weld metal and the base metal CCT diagram were evaluated with the dilatometer TA-Instruments WIN TA-Software DIL 805 (New Castle, DE, USA).
After the dilatometer experiments all the samples were embedded in Polyfast parallel to the cylinder axis before they were automatically ground and polished with 3 µm and 1 µm diamond suspension using the polishing automat Struers Tegramin-30. The polished samples were treated with Nital etching solution (3% HNO3 in ethanol) for optical microscopic (OM) investigation with the optical microscope Zeiss Axio Imager M1m and scanning electron microscopy (SEM) using a Versa 3D DualBeam workstation from Thermo Fisher Scientific (former FEI) (Waltham, MA, USA).
To estimate the amount of ferrite in the dilatometer samples which experienced lower cooling rates, the OM pictures were analysed with Stream Motion image processing software from Olympus (Tokyo, Japan).
For each dilatometer specimen the hardness was tested using a Vickers hardness tester from EMCO-TEST Prüfmaschinen GmbH (Kuchl, Austria). Every specimen was tested three times with HV10 using a testing force of 98.10 N and a testing time of 15 s. The three Vickers hardness indents were made along the longitudinal axis of the dilatometer specimens cross sections. For the welding and base metal CCT diagrams the hardness mean value was taken.
The Ac1 and Ac3 temperatures of the all-weld metal and the base metal were determined experimentally by means of dilatometer measurements. For this purpose, the samples were heated up to 600 °C with a heating rate of 10 °C/s and then further heated up to 1000 °C with a very low heating rate of 0.008 °C/s according to ASTM A 1033-04 [21]. No dwell time was applied and the cooling was performed with a cooling rate of 30 °C/s. The dilatometer measurement was repeated three times and the heating curves were evaluated by means of the dilatometer WIN TA-Software DIL 805DIL 805.

3. Results and Discussion

3.1. Ac1 and Ac3 Temperature of the 2.25Cr-1Mo-0.25V Weld Metal and Base Metal

Table 4 shows the mean values for the Ac1 and Ac3 temperatures of the 2.25Cr-1Mo-0.25V all-weld metal and base metal determined by dilatometer measurements. Despite the small difference between the Ac1 and Ac3 temperature of the 2.25Cr-1Mo-0.25 base and weld metal, the lower Ac3 temperature of the base metal might be a consequence of the significantly higher C content of 0.14 wt.% compared to the C content of the weld metal which is 0.08 wt.%, see Table 2 and Table 3. The weld metal exhibits a broader intercritical phase field than the base metal which manifests in a larger difference between the weld metals Ac3 and Ac1 temperature compared to the base metal.

3.2. 25Cr-1Mo-0.25V Weld Metal

3.2.1. Coarse Grain Heat Affected Zone (CGHAZ) CCT Diagram

Figure 3 shows the CCT diagram for the CGHAZ between the weld beads in a multi-layer SAW weld metal. For this purpose, the dilatometer samples were heated to a peak temperature of 1400 °C, which is in the upper range of the austenite phase field and instantly cooled with different cooling parameters. In all of the CCT diagrams shown within this study, the larger circles present the Vickers hardness HV10 of the dilatometer samples cooled with different cooling times and the numbers beside the ferrite phase region stand for the amount of ferrite in the microstructure.
From the CGHAZ CCT diagram, it can be seen that for t8/5-times between 2 s to 250 s, the microstructure is fully bainitic. For t8/5-times greater than 250 s, ferrite starts to form, and the microstructure is bainitic-ferritic.
Figure 4 shows OM images of the dilatometer specimens microstructures obtained from cooling with different t8/5-times. For very low t8/5-times of 1 s (Figure 4a) and 10 s (Figure 4b), the microstructure is fine and needle like which is typical for rapidly cooled samples with a non-equilibrium microstructure. Nonetheless, a more distinct differentiation between the microstructural constituents is only possible at higher magnification which allows to resolve the fine needles. In comparison to the fast cooled specimens, the microstructures of the slower cooled samples with the t8/5-times of 250 s (Figure 4c) and 1000 s (Figure 4d) appear to be coarser. By only considering the OM images (Figure 4a,b), it is difficult to determine whether the microstructures are fully bainitic or whether they contain some martensite too. Nonetheless, the SEM pictures display that for a t8/5-time of 1 s (Figure 5a) there are regions with no precipitations in between the fine laths, leading to the assumption that the microstructure also consists of some areas of lath-like martensite. Beside the lath-like martensitic and bainitic regions some regions appear more plate like and less fine exhibiting a high density of carbide segregations. Microstructures of this kind are often declared as coalesced bainite [22,23,24,25]. The microstructure of the dilatometer sample cooled with a t8/5-time of 10 s (Figure 5b) is clearly coarser than the microstructure of the sample with a t8/5-time of 1 s (Figure 5a). Moreover, it contains more plate-like coalesced bainitic regions in between. The SEM picture of the slower cooled sample with the t8/5-time 10 s (Figure 5b) shows that fine carbide segregations have formed within the laths which is an indication that the martensitic regions changed from martensite to lower bainite leading to a fully bainitic microstructure. The large plate-like areas which appear bright in the OM image (Figure 4b) correspond to coalesced bainite, which exhibits a high density of fine needle-like precipitates which can be seen in the SEM image (Figure 5b). The microstructure of the sample with the higher t8/5-times of 250 s (Figure 4c) looks less fine and more plate- than needle-like. The SEM image (Figure 5c) reveals that there are no carbide segregations within the plates leading to the assumption that the microstructure is fully upper bainitic. For an even higher t8/5-time of 1000 s (Figure 4d), the microstructure consists of upper bainite with some regions of newly transformed ferrite which appears bright in the OM image. The SEM image (Figure 5d) shows that these ferritic areas are flat exceeding no precipitations.
The SEM investigation of all dilatometer specimens of the all-weld metal CGHAZ CCT diagram revealed that the specimen with the lowest t8/5-time of 1 s exhibits a martensitic microstructure with regions of lower bainite and coalesced bainite in-between whereas the specimens with t8/5-times of 2/5/10/25 s consist of mainly lower bainite with additional areas of coalesced bainite. The specimens with t8/5-times of 50/100/250 s have an upper bainitic microstructure and the specimens with the highest t8/5-times of 500 s and 1000 s consist of upper bainite with regions of newly transformed ferrite.

3.2.2. Fine Grain Heat Affected Zone (FGHAZ) CCT Diagram

Figure 6 shows the CCT diagram for the FGHAZ between weld beads in a multi-layer SAW weld metal. Here, the dilatometer specimens were heated to a peak temperature of 1000 °C, which lies in the lower region of the austenite phase field and subsequently cooled with different cooling parameters.
The FGHAZ CCT diagram reveals that for t8/5-times between 2 s and 100 s the microstructure is fully bainitic. For t8/5-times higher than 100 s ferrite formation takes place and the microstructure changes from fully bainitic to bainitic-ferritic. Compared to the CGHAZ CCT diagram (Figure 3) with a peak temperature of 1400 °C, the ferrite formation is shifted to higher cooling rates (lower t8/5-times) for the FGHAZ CC diagram (Figure 6) with a peak temperature of 1000 °C.
To ensure comparability with the CCT diagrams of the other regions in the all-weld metal’s HAZs, Figure 7 shows OM images of the dilatometer specimens microstructures with the same t8/5-times like in Figure 4 and Figure 5 (1/10/250/1000 s). The dilatometer samples with low t8/5-times of 1 s and 10 s exhibit a very fine and needle like microstructure as can be seen in the OM images in Figure 7a,b. The SEM images reveal, that both t8/5-times, 1 s (Figure 8a) and 10 s (Figure 8b) lead to a fully bainitic microstructure consisting of lower bainite and large plates of coalesced bainite. In contrast to the CGHAZ CCT diagram, no martensitic regions have been found in the dilatometer specimens of the FGHAZ CCT diagram. The OM images of the slower cooled dilatometer specimens (Figure 7c,d) show a bainitic-ferritic microstructure whereas the higher t8/5-times entail higher amounts of light appearing ferrite. The corresponding SEM images in Figure 8c,d reveal that the bainitic part of the microstructure is fully upper bainitic.
The SEM analysis of all dilatometer specimens of the FGHAZ CCT diagram revealed that for low t8/5-times of 1/2/5/10 s the microstructure is a mixture of lower bainite and coalesced bainite. In contrast, the dilatometer specimens with intermediate t8/5-times of 25 s and 50 s exhibit a microstructure which consists of lower and upper bainite. The slower cooled specimens with t8/5-times greater than 100 s have an upper bainitic microstructure with different amounts of ferrite depending on the applied cooling rate. The shift of the ferrite phase field to lower cooling parameters is a consequence of the lower peak temperature compared to the CGHAZ CCT diagram which leads to a smaller austenite grain size and therefore an enhancement of ferrite nucleation.

3.2.3. Intercritical Heat Affected Zone (ICHAZ) CCT Diagram

Figure 9 shows the CCT diagram for the ICHAZ between the weld beads in a multi-layer SAW weld metal. To simulate this region of the all-weld metals HAZ, the dilatometer specimens were heated to a peak temperature of 850 °C which is located within the intercritical phase field. This means that the initial microstructure before cooling was austenitic with some amounts of ferrite. The numbers beside the ferrite phase region denote for the overall amount of ferrite which also contains amounts of initial ferrite.
As can be seen from the ICHAZ CCT diagram in Figure 9, the formation of new ferrite was already observed at a t8/5-time of 100 s which is low compared to the CGHAZ (Figure 3) and the FGHAZ (Figure 6) CCT diagrams. This effect can be traced to the larger austenite grain size caused by the higher maximum temperature of the CCHAZ and FGHAZ CCT diagrams. The larger austenite grain size leads to the retardation of diffusion controlled transformation processes and a shift of the ferrite phase field to higher t8/5-times in the CGHAZ and FGHAZ CCT diagram. The effect also shows in the earlier formation of upper bainite at a t8/5-time of 25 s in the FGHAZ CCT diagram (Figure 6) with 1000 °C peak temperature compared to the first formation of upper bainite at a t8/5-time of 50 s in the CGHAZ CCT diagram (Figure 3) with 1400 °C peak temperature.
For t8/5-times lower than 100 s, the microstructure of the ICHAZ dilatometer specimens consists of bainite with small amounts of initial ferrite, see Figure 9.
Figure 10 shows OM images of the dilatometer specimens’ microstructures cooled with t8/5-times of 1/10/250/1000 s. In comparison to the microstructures of the dilatometer specimens of the other welding CCT diagrams shown in Figure 4, Figure 5, Figure 7 and Figure 8 the microstructures visible in the OM images in Figure 10 appear less homogeneous, exhibiting different phases within the prior austenite grains and at the prior austenite grain boundaries. This difference of the microstructures is particularly strong for the specimens with the low t8/5-times of 1 s (Figure 10a) and 10 s (Figure 10b). While the bright phase within the prior austenite grains appears to be bainitic-ferritic in the OM images, the darker phase at the austenite grain boundaries is too fine to be resolved properly with the OM. However, the SEM images of these dilatometer specimens (Figure 11a,b) uncover that the darker phase in the OM images is a mixture of fine lower bainite and regions of coarse plates of coalesced bainite. The phase within the prior austenite grains is mainly upper bainite. Concerning the microstructural differences between the prior austenite grain boundaries and the regions within the prior austenite grains it is believed that the crucial factor is the lower peak temperature compared to the all-weld metal CGHAZ and FGHAZ CCT diagram. The lower peak temperature of 850 °C leads to a slowdown of diffusion processes which results in an insufficient homogenization of segregations of trace elements at austenite grain boundaries. These segregations, in further consequence, might lead to a delayed transformation at the prior austenite grain boundaries, which means that in these regions, higher undercooling rates are reached, leading to the less diffusion controlled microstructure of lower bainite. The microstructure of the dilatometer specimen cooled with a t8/5-time of 250 s also seems to exhibit different phases within and at the boundaries of the prior austenite grains when looking at the OM image (Figure 10c). Nevertheless, the SEM image (Figure 11c) shows that the lower bainite and the coalesced bainite which was present at the boundaries when cooling faster is now replaced by upper bainite. The regions within the prior austenite grains remain upper bainitic with the only difference that newly transformed ferrite has formed in-between. The microstructure of the dilatometer sample with a high t8/5-time of 1000 s looks quite similar, but exhibits larger regions of newly transformed ferrite within the prior austenite grains, and a broad ferrite seam along the upper bainite formed at the prior austenite grain boundaries, see the OM image in Figure 10 d and SEM image in Figure 11d.
To sum up, the investigation of all dilatometer specimens of the ICHAZ CCT diagram for the HAZ between the weld beads of the multi-layer weld metal showed that the microstructure is inhomogeneous for all t8/5-times. The microstructure of the specimens with t8/5-times of 1/2/5/10/25/50 s consists of lower bainite and coalesced bainite at the prior austenite grain boundaries and upper bainite within the prior austenite grains. A t8/5-time of 100 s leads to a microstructure consisting of lower bainite and coalesced bainite at the prior austenite grain boundaries and upper bainite paired with small amounts of newly transformed ferrite within the prior austenite grains. In contrast, a higher t8/5-time of 250 s leads to upper bainite at the prior austenite grain boundaries and a mixture of upper bainite and newly transformed ferrite within the prior austenite grains. For slow cooling with t8/5-times of 500/1000/2500 s, the microstructure is similar to the microstructure obtained with a t8/5-time of 250 s but the upper bainitic regions at the prior austenite grain boundaries are additionally surrounded with a seam of newly transformed ferrite which becomes broader with increasing cooling time. Despite the relatively low peak temperature which lies in the intercritical phase field, no initial ferrite was found in the course of SEM analysis. It is assumed that the initial ferrite is finely distributed within the upper bainitic microstructure in the middle of the prior austenite grains.
For the process of submerged-arc welding with the in Section 2 described welding parameters, t8/5-times of approximately 19 s to 21 s are common according to in-situ measurements using Pt thermocouples which were directly placed within the solidifying weld bead. Therefore, the authors assume that the HAZ between the individual weld beads of 2.25Cr-1Mo-0.25V multi-layer SAW weld metal produced with common welding parameters consists of the following microstructure constituents:
  • CGHAZ: Fully lower bainitic microstructure.
  • FGHAZ: Mixed microstructure of lower bainite, upper bainite and coalesced bainite, depending on the local peak temperature. A higher peak temperature is assumed to cause higher quantities of lower bainite and coalesced bainite whereas a lower peak temperature in contrast is assumed to increase the amount of upper bainite.
  • CGHAZ: Inhomogeneous microstructure with lower bainite and coalesced bainite along the prior austenite grain boundaries and upper bainite with small amounts of initial ferrite within the prior austenite grains.
Via measurement or calculation of the t8/5-time and application of the welding CCT diagrams presented within this study, the microstructure constituents within the different zones of the HAZ of SAW multi-layer weld metal can be estimated in advance. By adapting the welding parameters, undesired phases such as hard and brittle martensite which is known to increase the weld metals susceptibility to cold cracking or large amounts of ferrite which reduce the overall strength and hardness of the weld metal and might have a negative impact on the weld metals creep behavior, can be avoided.

3.2.4. Hardness and Ferrite Phase Fraction

Hardness measurements of each all-weld metal CCT diagram’s dilatometer specimens were conducted. Furthermore, for the dilatometer specimens which showed a ferrite transformation during continuous cooling, the ferrite phase fraction was determined. Figure 12 shows the Vickers hardness and the ferrite phase fraction as a function of the t8/5-time. It can be seen, that for all three zones in the HAZ between the weld beads of the SAW multi-layer weld metal (CGHAZ, FGHAZ and ICHAZ), the hardness decreases with increasing cooling time, whereas the ferrite content increases.
It should be noted that the hardness of the dilatometer specimens of the FGHAZ and the CGHAZ CCT diagrams are comparatively similar for t8/5-times between 2 s and 250 s when the microstructure consisted of lower and upper bainite. For the lowest t8/5-time of 1 s, the dilatometer specimen heated to 1400 °C peak temperature (CGHAZ) shows a higher mean hardness than the dilatometer specimen heated to a peak temperature of 1000 °C (FGHAZ), which can be attributed to the differences of their microstructures. The dilatometer specimen heated to 1400 °C peak temperature shows some amount of martensite beside lower and coalesced bainite which leads to an increase in hardness. For t8/5-times higher than 250 s, the hardness values of the dilatometer specimens of the FGHAZ CCT diagram decrease stronger than the ones of the CGHAZ which can be attributed to the start of ferrite formation in the FGHAZ dilatometer specimens. For the specimens of the CGHAZ CCT diagram this decrease in hardness is retarded to higher t8/5-times of 1000 s when extensive ferrite formation was detected in the course of dilatometer measurements and microstructural investigation. In addition, the dilatometer specimens of the CGHAZ CCT diagram exhibit lower amounts of ferrite than those of the FGHAZ CCT diagram, which is due to the larger austenite grains which provide fewer nucleation sites for ferrite during cooling.
The shape of the hardness profile of the ICHAZ CCT diagram is similar to those of the CGHAZ and the FGHAZ CCT diagrams, but without a sharp decrease at low and high t8/5-times. Furthermore, the ICHAZ hardness profile curve is shifted to lower hardness values which can be attributed to the inhomogeneous microstructure with the smaller amount of lower bainite which was only found at the prior austenite grain boundaries and the relatively high amount of upper bainite within the prior austenite grains even for the lowest t8/5-times. Moreover, the peak temperature of the ICHAZ CCT diagram lies in the intercritical phase field leading to some amounts of initial ferrite for all t8/5-times and newly transformed ferrite at lower t8/5-times compared to the other welding CCT diagrams.

3.3. 25Cr-1Mo-0.25V Base Metal

3.3.1. 25Cr-1Mo-0.25V base Metal CCT Diagram

Figure 13 shows the CCT diagram for the 2.25Cr-1Mo-0.25V base metal. Here, the dilatometer specimens were heated to a peak temperature of 1200 °C and held for 5 min to ensure homogenization of the microstructure but prevent severe grain growth. Similar to the weld metal CCT diagrams, the samples were cooled with various cooling rates after the dwell step at the peak temperature. The numbers within the larger circles present the Vickers hardness HV10 of the dilatometer samples cooled with different cooling times.
The base metal CCT diagram in Figure 13 reveals that for all t8/5-times between 2 s and 2000 s the microstructure is fully bainitic. Only very slow cooling with a t8/5-time of 5000 s leads to small amounts of ferrite within the bainitic matrix.
In Figure 14, the OM images of the microstructure of a selection of dilatometer specimens with different t8/5-times of 5/120/500/5000 s is presented. When comparing the OM images of the dilatometer specimens corresponding to the base metal CCT diagram in Figure 14 with the OM images of the dilatometer specimens of the all-weld metal welding CCT diagrams (Figure 4, Figure 7 and Figure 10), it is clear that the microstructures appear coarser which makes them easier to investigate by means of OM. This can be attributed to the 5 min dwell time at a high peak temperature of 1200 °C leading to an increase of the austenite grain size. Another consequence of the larger austenite grains is the retardation of the ferrite phase transformation to very slow cooling rates which manifests as a shift of the ferrite phase field to higher t8/5-times in the base metal CCT diagram, see Figure 13.
The microstructure of the fast cooled dilatometer specimens with t8/5-times of 5 s and 120 s of the base metal CCT diagram consists of packets of fine parallel arranged needle-like plates, see Figure 14a,b. Depending on the packets angular arrangement they appear lighter or darker in the OM. Due to the limited resolution of the OM, an unambiguous distinction between martensite and lower bainite is not possible. However, the SEM images in Figure 15a,b reveal a lower bainitic microstructure, with many larger areas of coalesced bainite. In comparison, a moderate t8/5-time of 500 s leads to a change from a lower baintic to a fully upper bainitic microstructure, see Figure 15c. The highest applied t8/5-time of 5000 s also caused an upper bainitic microstructure which appears quite coarse (Figure 15d). Although the continuous cooling curve clearly shows a ferrite transformation, no ferrite was found using SEM, leading to the assumption that the ferrite is finely distributed within the microstructure, unable to be clearly differentiated from the relatively coarse upper bainitic matrix.
The investigation of all dilatometer specimens of the base metal CCT diagram by means of SEM showed that the microstructures are fully bainitic for all t8/5-times except for the highest t8/5-time of 5000 s. The microstructures of the fast cooled specimens with low t8/5-times of 2/5/10/50/80/120/150 s consist of lower bainite with different amounts of coalesced bainite whereas the specimen with the lowest t8/5-time of 2 s exhibits the highest amount of coalesced bainite. A t8/5-time of 250 s leads to a fully lower bainitic microstructure without any coalesced bainite, and a t8/5-time of 300 s causes a mixed microstructure of lower and upper bainite. All higher t8/5-times of 500/600/800/2000 s result in an upper bainitic microstructure. The dilatometer specimen with the highest t8/5-time of 5000 s exhibits a coarse upper bainitic microstructure which is assumed to contain finely distributed ferrite; as for this cooling rate, a ferrite transformation was detected throughout the dilatometer measurements.
Compared to the weld metal CCT diagrams, the ferrite phase field is shifted to very high t8/5-times which can be attributed to the larger austenite grain size due to the 5 min dwell time at 1200 °C.
The CCT diagram of the 2.25Cr-1Mo-0.25V base metal shows that for the broad range of cooling times investigated within this study, the alloy remains nearly fully bainitic. This is the desired microstructure for the main application in large pressure vessels where the combination of high temperatures and pressures demands excellent creep resistance over a long period of time.

3.3.2. Hardness

Figure 16 shows the Vickers hardness HV10 as a function of the t8/5-time and the corresponding microstructure constituents observed via OM an SEM. With increasing t8/5-time, the hardness of the dilatometer specimens decreases. For the highest cooling rates corresponding to t8/5-times of 2 s to 10 s the hardness curve shows a plateau. This region of nearly constant hardness is assumed to be linked to the relatively high amount of coalesced bainite which forms at large undercoolings when the bainite formation temperature is relatively close to the martensite-start temperature, which is the case for very high cooling rates [23,24,25,26].

4. Conclusions

In this study the effect of the peak temperature and the cooling rate on the resulting microstructure in the different regions of the HAZ in-between the weld beads of 2.25Cr-1Mo-0.25V SAW multi-layer weld metal and the microstructure of the corresponding base metal was evaluated leading to the following findings:
  • With increasing peak temperatures, the ferrite phase field in the all-weld metal CCT diagrams is shifted towards higher t8/5-times.
  • In the base metal CCT diagram, a ferrite transformation was only found for the highest t8/5-time of 5000 s.
  • For all three welding CCT diagrams and the base metal CCT diagram, the hardness of the dilatometer specimens decreases with increasing t8/5-time.
  • The microstructures of the dilatometer specimens of the all-weld metal CCT diagrams consist of lower bainite, coalesced bainite, upper bainite and ferrite. Martensite was only found in the microstructure of the fastest cooled specimen of the CGHAZ CCT diagram. The dilatometer specimens of the ICHAZ CCT diagram showed an inhomogeneous microstructure at the prior austenite grain boundaries and within the prior austenite grains for all t8/5-times.
  • The microstructures of the base metal CCT diagram dilatometer specimens consist of lower bainite, coalesced bainite and upper bainite. No ferrite was found by means of SEM.
Finally, it has to be emphasized that the application of OM as a primary tool for phase identification is not sufficient, as the fine microstructure of martensite and bainite cannot be resolved due to the limited resolution leading to potentially misleading assumptions.

Author Contributions

Conceptualization: H.S. and R.S.; Investigation: H.S., B.L. and T.F.; Methodology: H.S., F.G., R.K., M.S.-N. and R.S.; Project administration: H.S. and R.S.; Supervision: F.G., R.K., M.S.-N. and R.S.; Visualization: H.S. and B.L.; Writing—original draft: H.S.; Writing—review and editing: B.L., T.F., F.G., R.K., M.S.-N. and R.S. All authors have read and agreed to the published version of the manuscript.

Funding

Funding of the Austrian BMK (846933) in the framework of the program “Production of the future” and the “BMK Professorship for Industry” is gratefully acknowledged.

Conflicts of Interest

The authors declare no conflict of interest.

References

  1. Hucińska, J. Advanced vanadium modified steels for high pressure hydrogen reactors. Adv. Mater. Sci. 2003, 4, 21–27. [Google Scholar]
  2. Detemple, I.; Hanus, F.; Luxenburger, G. Advanced steels for hydrogen reactors. Hydrocarb. Eng. 1999, 4, 1–8. [Google Scholar]
  3. Pereira, P.A.S.; Franco, C.S.G.; Guerra Filho, J.L.M.; dos Santos, D.S. Hydrogen effects on the microstructure of a 2.25Cr–1Mo–0.25 V steel welded joint. Int. J. Hydrog. Energy 2015, 40, 17136–17143. [Google Scholar] [CrossRef]
  4. Chauvy, C.; Pillot, S. Prevention of weld metal reheat cracking during CrMoV heavy reactors fabrication. In Proceedings of the ASME Pressure Vessels and Piping Conference, Prague, Czech Republic, 26–30 July 2009; pp. 243–251. [Google Scholar]
  5. Ichikawa, K.; Horii, Y.; Sueda, A.; Kobayashi, J. Thoughness and creep strength of modified 2.25Cr-1Mo steel weld metal. Weld. J.-Incl. Weld. Res. Suppl. 1995, 74, 230–238. [Google Scholar]
  6. Chovet, C.; Schmitt, J.-P. Additional recommendations for welding Cr-Mo-V steels for petrochemical applications. Weld. World 2011, 55, 31–38. [Google Scholar] [CrossRef]
  7. Dhooge, A.; Vinckier, A. Reheat cracking—A review of recent studies. Int. J. Press. Vessel. Pip. 1987, 27, 239–269. [Google Scholar] [CrossRef]
  8. Schulze, G. Die Metallurgie des Schweissens. Eisenwerkstoffe - nichteisenmetallische Werkstoffe, 4th ed.; Springer: Heidelberg, Germany; New York, NY, USA, 2010; ISBN 9783642031823. [Google Scholar]
  9. Bargel, H.-J.; Schulze, G. Werkstoffkunde, 12th ed.; Springer: Berlin/Heidelberg, Germany, 2018; ISBN 978-3-662-48629-0. [Google Scholar]
  10. Depinoy, S. Microstructural Evolution of a 2.25Cr - 1 Mo Steel During Austenitization and Temper: Austenite Grain Growth, Carbide Precipitation Sequence and Effects on Mechanical Properties. Ph.D. Thesis, Ecole Nationale Supérieure des Mines de Paris, Paris, France, 2015. [Google Scholar]
  11. Deng, D.; Tong, Y.; Ma, N.; Murakawa, H. Prediction of the residual welding stress in 2.25Cr-1Mo steel by taking into account the effect of the solid-state phase transformations. Acta Metall. Sin. (Engl. Lett.) 2013, 26, 333–339. [Google Scholar] [CrossRef] [Green Version]
  12. Na, H.S.; Kim, B.H.; Lee, S.H.; Kang, C.H. Thermodynamic alloy design of high strength and toughness in 300 mm thick pressure vessel wall of 1.25Cr-0.5Mo steel. Metals 2018, 8, 70. [Google Scholar] [CrossRef] [Green Version]
  13. Badu, S.S.; Badeshia, H.K.D.H. Mechanism of the Transition from Bainite to Acicular Ferrite. Mater. Trans. JIM 1991, 32, 679–688. [Google Scholar]
  14. Tassa, O.; Bourges, P.; Pillot, S.; Mendes Rodrigues, M.; De Cesaris, A.; van Wortel, H. Development of Cr-Mo-V Ferritic Steels for High Temperature Hydroprocessing Rectors with Enhanced Behavior. EUR 2005, 21419, 1–100. [Google Scholar]
  15. Tartaglia, J.M.; Kuelz, A.N.; Thelander, V.H. The effects of alloying elements on the continuous cooling transformation behavior of 2¼Cr-1Mo steels. J. Mater. Eng. Perform. 2018, 27, 6349–6364. [Google Scholar] [CrossRef]
  16. Mayr, P.; Schlacher, C.; Siefert, J.A.; Parker, J.D. Microstructural features, mechanical properties and high temperature failures of ferritic to ferritic dissimilar welds. Int. Mater. Rev. 2019, 64, 1–26. [Google Scholar] [CrossRef] [Green Version]
  17. Paddea, S.; Masuyama, F.; Shibli, A. T23 and T24 — New generation low alloyed steels. In Coal Power Plant Materials and Life Assessment; Woodhead Publishing: Cambridge, UK, 2014; pp. 87–106. [Google Scholar]
  18. Yang, B.; Xuan, F.-Z. Nonhomogeneous microstructure related creep damage of the CrMoV multi-pass weld metal. Mater. Sci. Eng. A 2019, 763, 138122. [Google Scholar] [CrossRef]
  19. Yang, B.; Xuan, F.-Z. Creep behavior of subzones in a CrMoV weldment characterized by the in-situ creep test with miniature specimens. Mater. Sci. Eng. A 2018, 723, 148–156. [Google Scholar] [CrossRef]
  20. Yang, B.; Xuan, F.-Z.; Liu, X.-P. Heterogeneous creep behavior of a CrMoV multi-pass weld metal. Mater. Sci. Eng. A 2017, 690, 6–15. [Google Scholar] [CrossRef]
  21. ASTM, A. 1033-04, Standard Practice for Quantitative Measurement and Reporting of Hypoeutectoid Carbon and Low-Alloy Steel Phase Transformations; ASTM International: West Conshohocken, PA, USA, 2004; pp. 1–14. [Google Scholar]
  22. Keehan, E.; Karlsson, L.; Andrén, H.-O.; Bhadeshia, H.K.D.H. Influence of carbon, manganese and nickel on microstructure and properties of strong steel weld metals: Part 3Increased strength resulting from carbon additions. Sci. Technol. Weld. Join. 2006, 11, 19–24. [Google Scholar] [CrossRef]
  23. Keehan, E.; Karlsson, L.; Bhadeshia, H.K.D.H.; Thuvander, M. Three-dimensional analysis of coalesced bainite using focused ion beam tomography. Mater. Charact. 2008, 59, 877–882. [Google Scholar] [CrossRef]
  24. Pak, J.H.; Bhadeshia, H.K.D.H.; Karlsson, L.; Keehan, E. Coalesced bainite by isothermal transformation of reheated weld metal. Sci. Technol. Weld. Join. 2008, 13, 593–597. [Google Scholar] [CrossRef]
  25. Chang, L.C.; Bhadeshia, H.K.D.H. Microstructure of lower bainite formed at large undercoolings below bainite start temperature. Mater. Sci. Technol. 1996, 12, 233–236. [Google Scholar] [CrossRef]
  26. Bhadeshia, H.K.D.H.; Keehan, E.; Karlsson, L.; Andrén, H.-O. Coalesced Bainite. Trans. Indian Inst. Met. 2006, 59, 689–694. [Google Scholar]
Figure 1. Schematic drawing of the upper part of the cross section of the investigated 2.25Cr-1Mo-0.25V SAW (submerged-arc welding) all-weld metal. The positions in the last two weld beads where the dilatometer-specimens were taken from are highlighted with dashed circles.
Metals 10 01055 g001
Figure 2. Schematic drawing of the different areas within the HAZ between the weld beads in a multi-layer weld metal and the corresponding peak temperatures for low alloyed weld metal with low C-contents according to G. Schulze [8]. The peak temperatures chosen for the CGHAZ, the FGHAZ and the ICHAZ welding CCT diagram are highlighted with green, blue and red lines.
Metals 10 01055 g002
Figure 3. CCT diagram for the CGHAZ between the weld beads of a 2.25Cr-1Mo-0.25V multi-layer SAW all-weld metal with a peak temperature of 1400 °C.
Metals 10 01055 g003
Figure 4. OM images of the microstructure of the dilatometer specimens heated to 1400 °C peak temperature and cooled with different t8/5-times of (a) 1 s; (b) 10 s; (c) 250 s; and (d) 1000 s at lower and higher magnification.
Metals 10 01055 g004
Figure 5. SEM images of the microstructure of the dilatometer specimens heated to 1400 °C peak temperature and cooled with different t8/5-times of (a) 1 s; (b) 10 s; (c) 250 s; and (d) 1000 s showing martensite (M), lower bainite (BL), coalesced bainite (BC), upper bainite (BU) and ferrite (F).
Metals 10 01055 g005
Figure 6. CCT diagram for the FGHAZ between the weld beads of a 2.25Cr-1Mo-0.25V multi-layer SAW all-weld metal with a peak temperature of 1000 °C.
Metals 10 01055 g006
Figure 7. OM images of the microstructure of the dilatometer specimens heated to 1000 °C peak temperature and cooled with different t8/5-times of (a) 1 s; (b) 10 s; (c) 250 s; and (d) 1000 s at lower and higher magnification.
Metals 10 01055 g007
Figure 8. SEM images of the microstructure of the dilatometer specimens heated to 1000 °C peak temperature and cooled with different t8/5-times of (a) 1 s; (b) 10 s; (c) 250 s and (d) 1000 s showing lower bainite (BL), coalesced bainite (BC), upper bainite (BU) and ferrite (F).
Metals 10 01055 g008
Figure 9. CCT diagram for the ICHAZ between the weld beads of a 2.25Cr-1Mo-0.25V multi-layer SAW all-weld metal with a peak temperature of 850 °C.
Metals 10 01055 g009
Figure 10. OM images of the microstructure of the dilatometer specimens heated to 850 °C peak temperature and cooled with different t8/5-times of (a) 1 s; (b) 10 s; (c) 250 s; and (d) 1000 s at lower and higher magnification.
Metals 10 01055 g010
Figure 11. SEM images of the microstructure of the dilatometer specimens heated to 850 °C peak temperature and cooled with different t8/5-times of (a) 1 s; (b) 10 s; (c) 250 s; and (d) 1000 s showing lower bainite (BL), coalesced bainite (BC), upper bainite (BU) and ferrite (F).
Metals 10 01055 g011
Figure 12. Vickers hardness and ferrite phase fraction as a function of the t8/5-times for the dilatometers specimens of the all-weld metal’s CGHAZ, FGHAZ and ICHAZ CCT diagram.
Metals 10 01055 g012
Figure 13. CCT diagram for the base metal with a peak temperature of 1200 °C and a dwell time of 5 min.
Metals 10 01055 g013
Figure 14. OM images of the microstructure of the dilatometer specimens from the base metal CCT diagram which were heated to 1200 °C for 5 min and cooled with different cooling t8/5-times of (a) 5 s; (b) 120 s; (c) 500 s; and (d) 5000 s at lower and higher magnifications, respectively.
Metals 10 01055 g014
Figure 15. SEM images of the microstructure of the dilatometer specimens heated to 1200 °C for 5 min and cooled with different t8/5-times of (a) 5 s; (b) 120 s; (c) 500 s; and (d) 5000 s showing lower bainite (BL), coalesced bainite (BC) and upper bainite (BU).
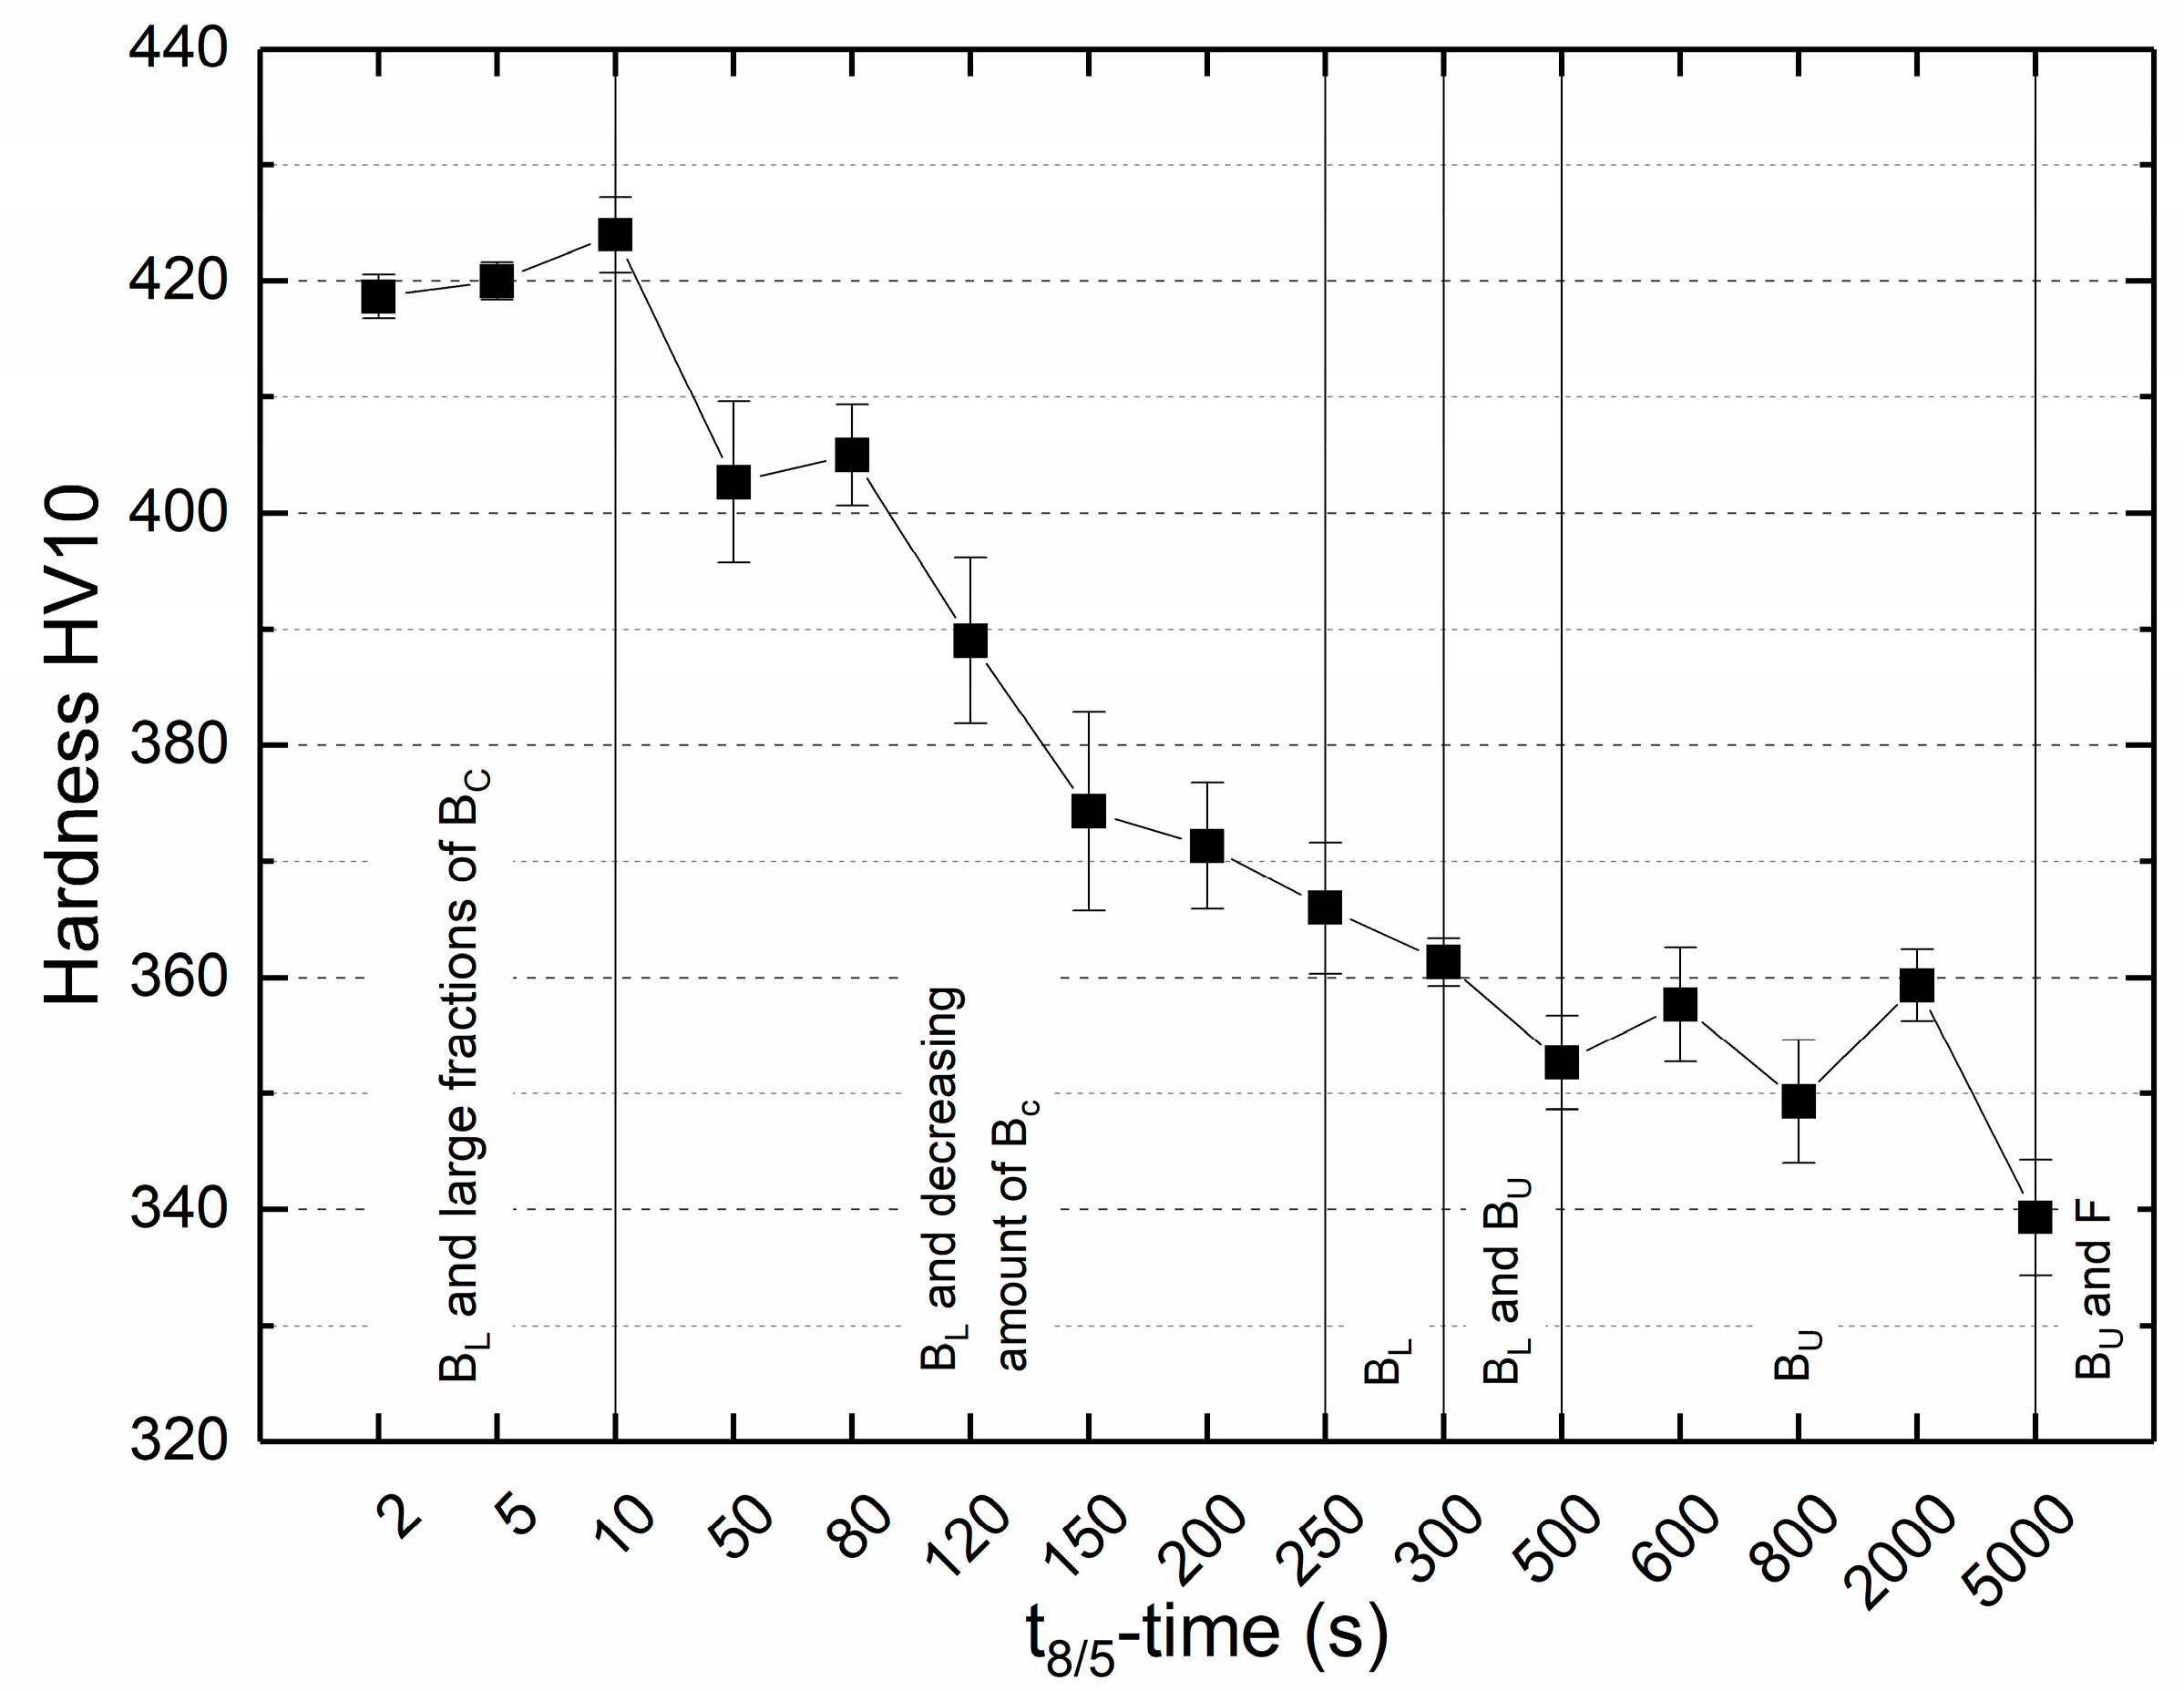
Metals 10 01055 g015
Figure 16. Vickers hardness as a function of the t8/5-time and the observed corresponding microstructure constituents lower bainite (BL), coalesced bainite (BC), upper bainite (BU) and ferrite (F).
Metals 10 01055 g016
Table 1. Overview of the Tandem-SAW (submerged-arc welding) conditions.
PolarityHeat InputCurrentVoltageInterpass TemperaturePreheat TemperatureWelding SequenceWelding Position
AC/AC20 kJ/cm550 A30 V230 °C200 °Cleft ↔ right
alternating
PA
Table 2. Chemical composition in wt.% of the investigated 2.25Cr-1Mo-0.25V SAW weld metal.
FeCrMnMoVSiCN
Balance 2.21.01.00.30.10.080.02
Table 3. Chemical composition in wt.% of the investigated 2.25Cr-1Mo-0.25V base metal steel plate.
FeCrMnMoVSiC
Balance2.30.61.10.30.080.14
Table 4. Mean values for the Ac1 and Ac3 temperature of the 2.25Cr-1Mo-0.25V all-weld metal and the corresponding base metal determined by means of dilatometer measurements. All temperatures are given in °C.
Base MetalWeld Metal
Ac1Ac3Ac1Ac3
793 ± 2910 ± 3779 ± 3926 ± 4

