3.1. Al0.5CoCrCuFeNi HEA
Chen et al. performed multiple investigations on the serrated-flow behavior in an Al
0.5CoCrCuFeNi HEA [
152,
154,
155,
157]. In Reference [
152], they examined the effects of temperature on the serrated flow of the above alloy during compression tests. Here, tests were performed at temperatures of 400, 500, and 600 °C, using a strain rate of 5 × 10
−5∙s
−1. Synchrotron X-ray diffraction (XRD) (Advanced Photon Source (APS), Argonne National Laboratory, Chicago, IL, USA) revealed that the alloy contained only an FCC phase after testing at 400 and 500 °C, whereas both FCC and body-centered-cubic (BCC) phases were present in the sample tested at 600 °C. Furthermore, it was reported that, with an increase in the test temperature, the critical strain for the onset of serrations decreased, whereas the Young’s modulus increased. The increase in the Young’s modulus with temperature was attributed to the presence of the BCC phase in the sample. It was thought that the decrease in the critical strain with increasing temperature was due to the increased mobility of solute atoms that can catch and pin dislocations, reducing the amount of strains that can occur before the onset of serrations.
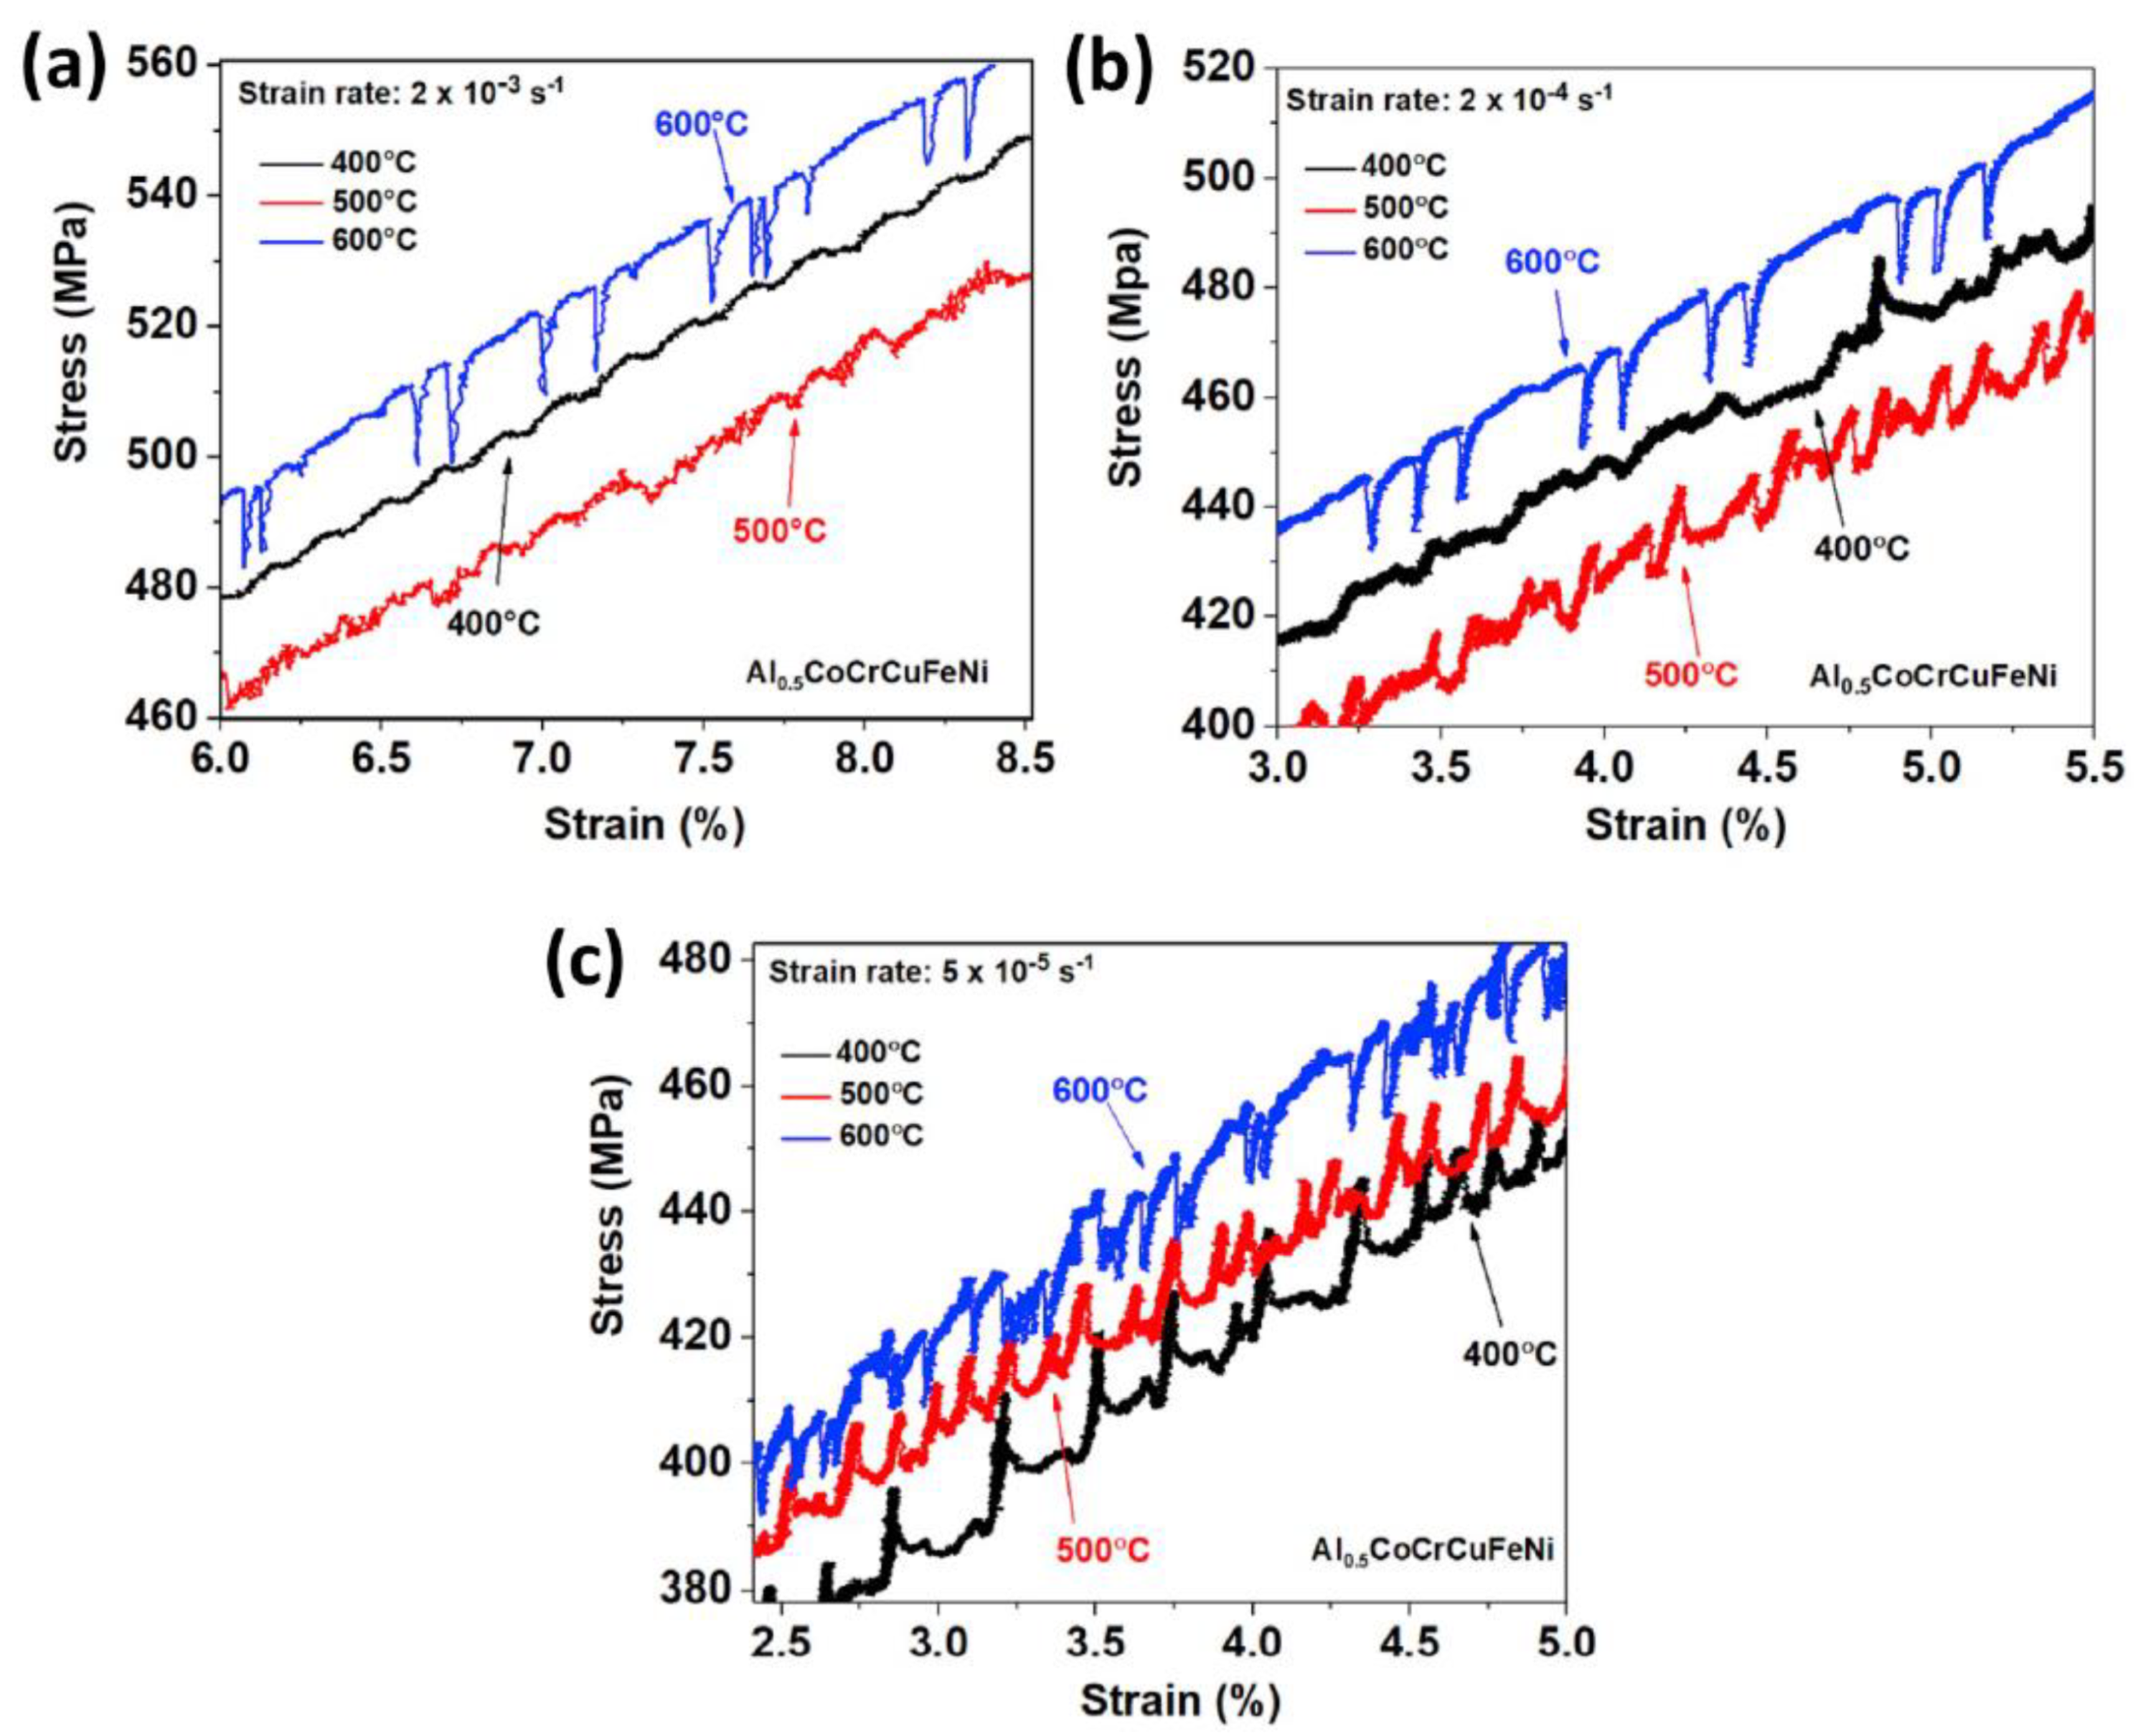
In a subsequent study, the serration behavior of the above alloy was examined after being compressed at strain rates of 5 × 10
−5 s
−1, 2 × 10
−4 s
−1, and 2 × 10
−3 s
−1 and temperatures of 400, 500, and 600 °C [
180].
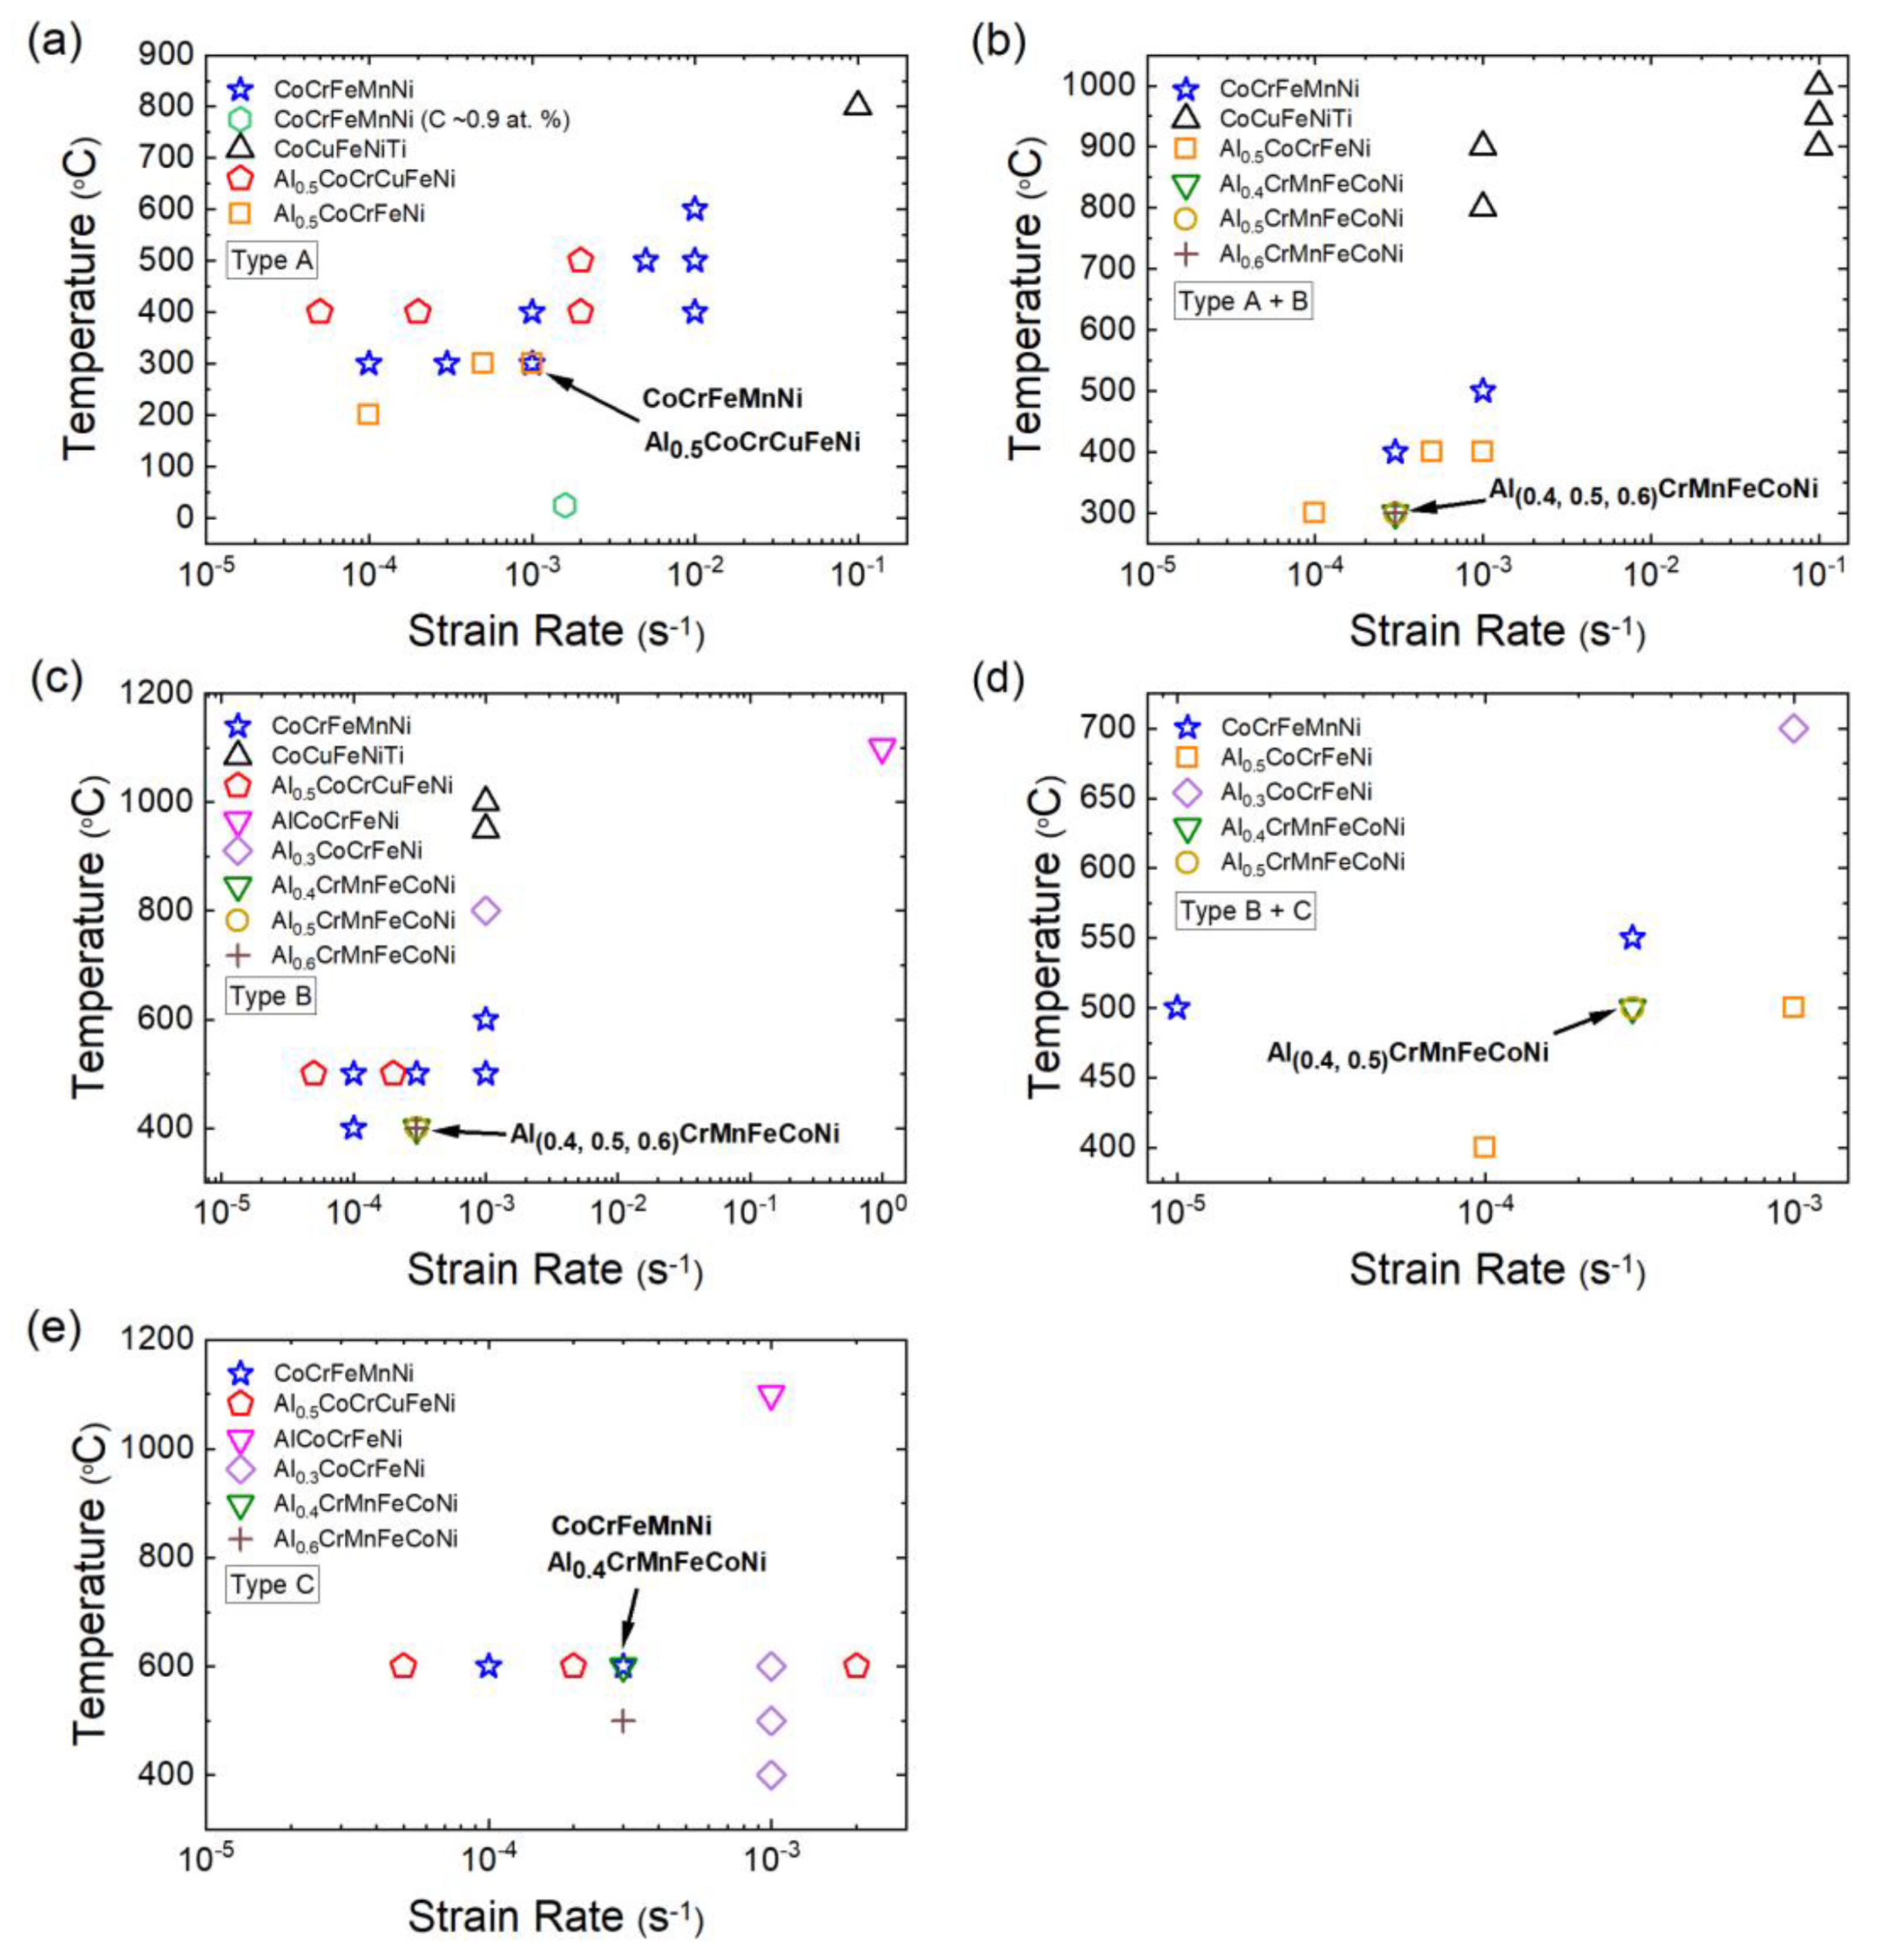
Figure 14 displays the stress vs. strain curves of the experiments.
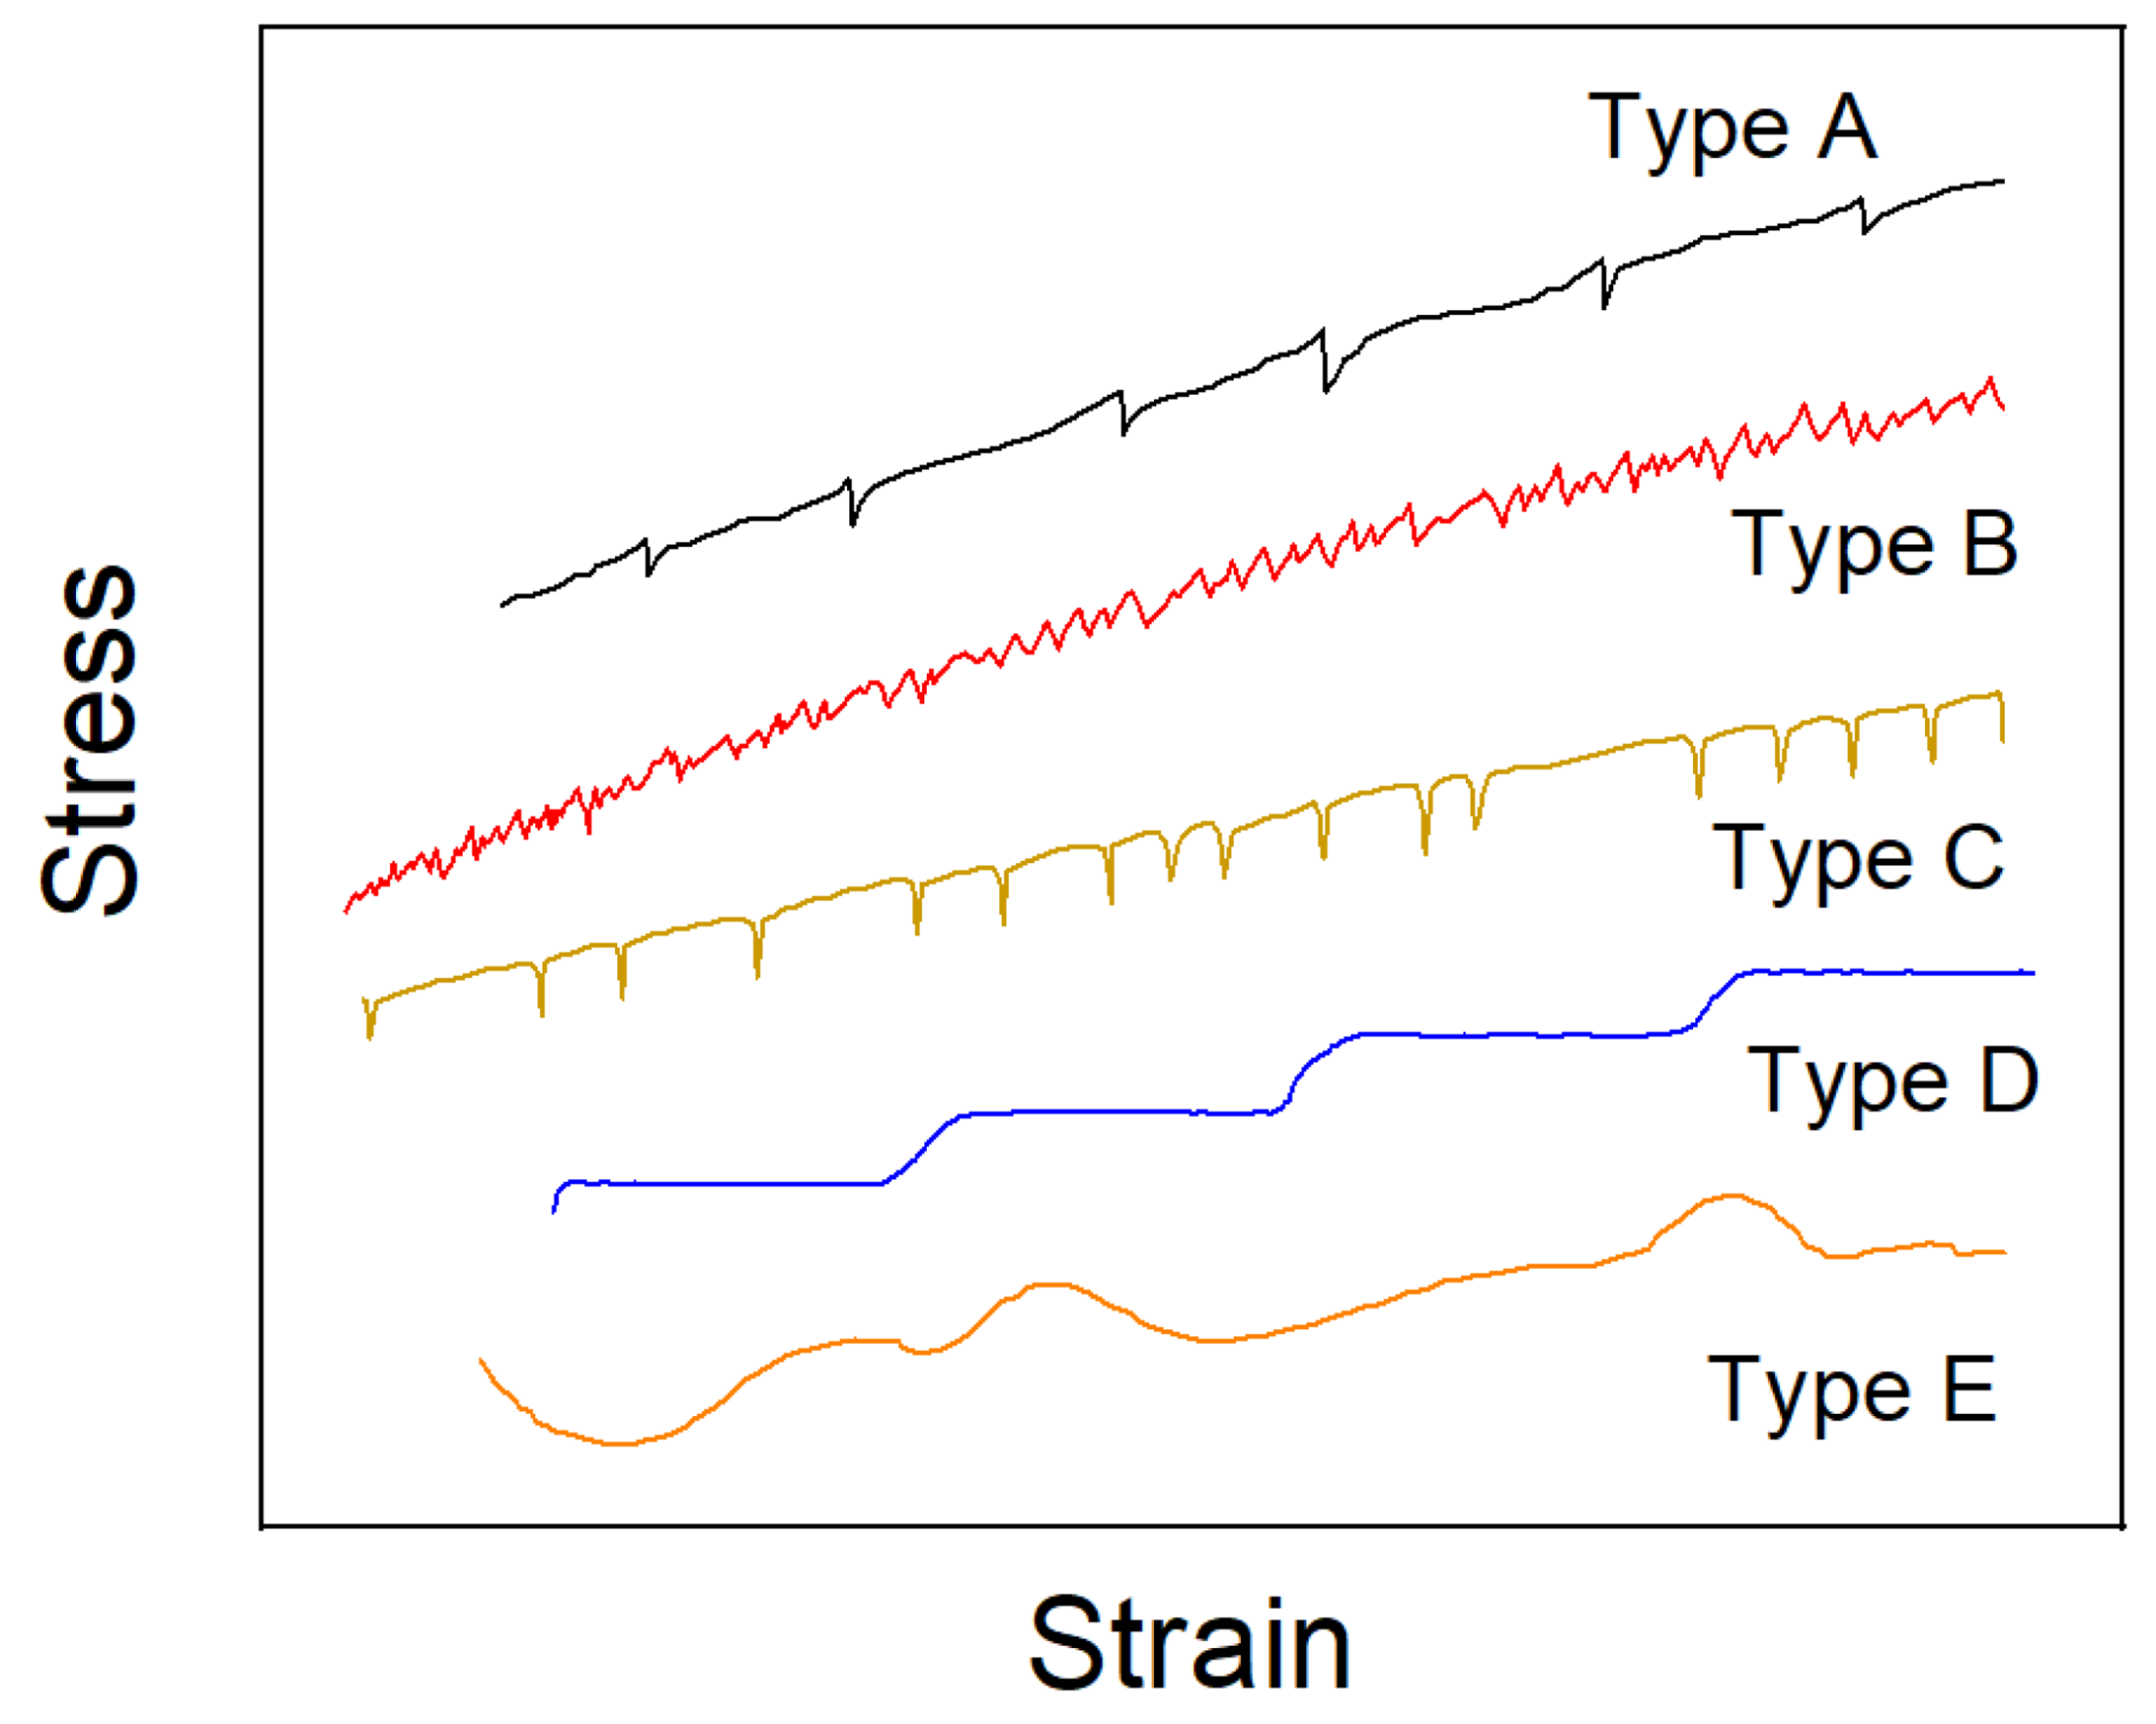
Table 2 presents a list of the serration type for each of the experimental parameters, as defined above. The serration type was dependent on the test temperature, and to a smaller extent, the strain rate. For instance, Type-A serrations were primarily observed at 400 °C, Types A and B were seen at 500 °C, and Type-C serrations occurred at 600 °C.
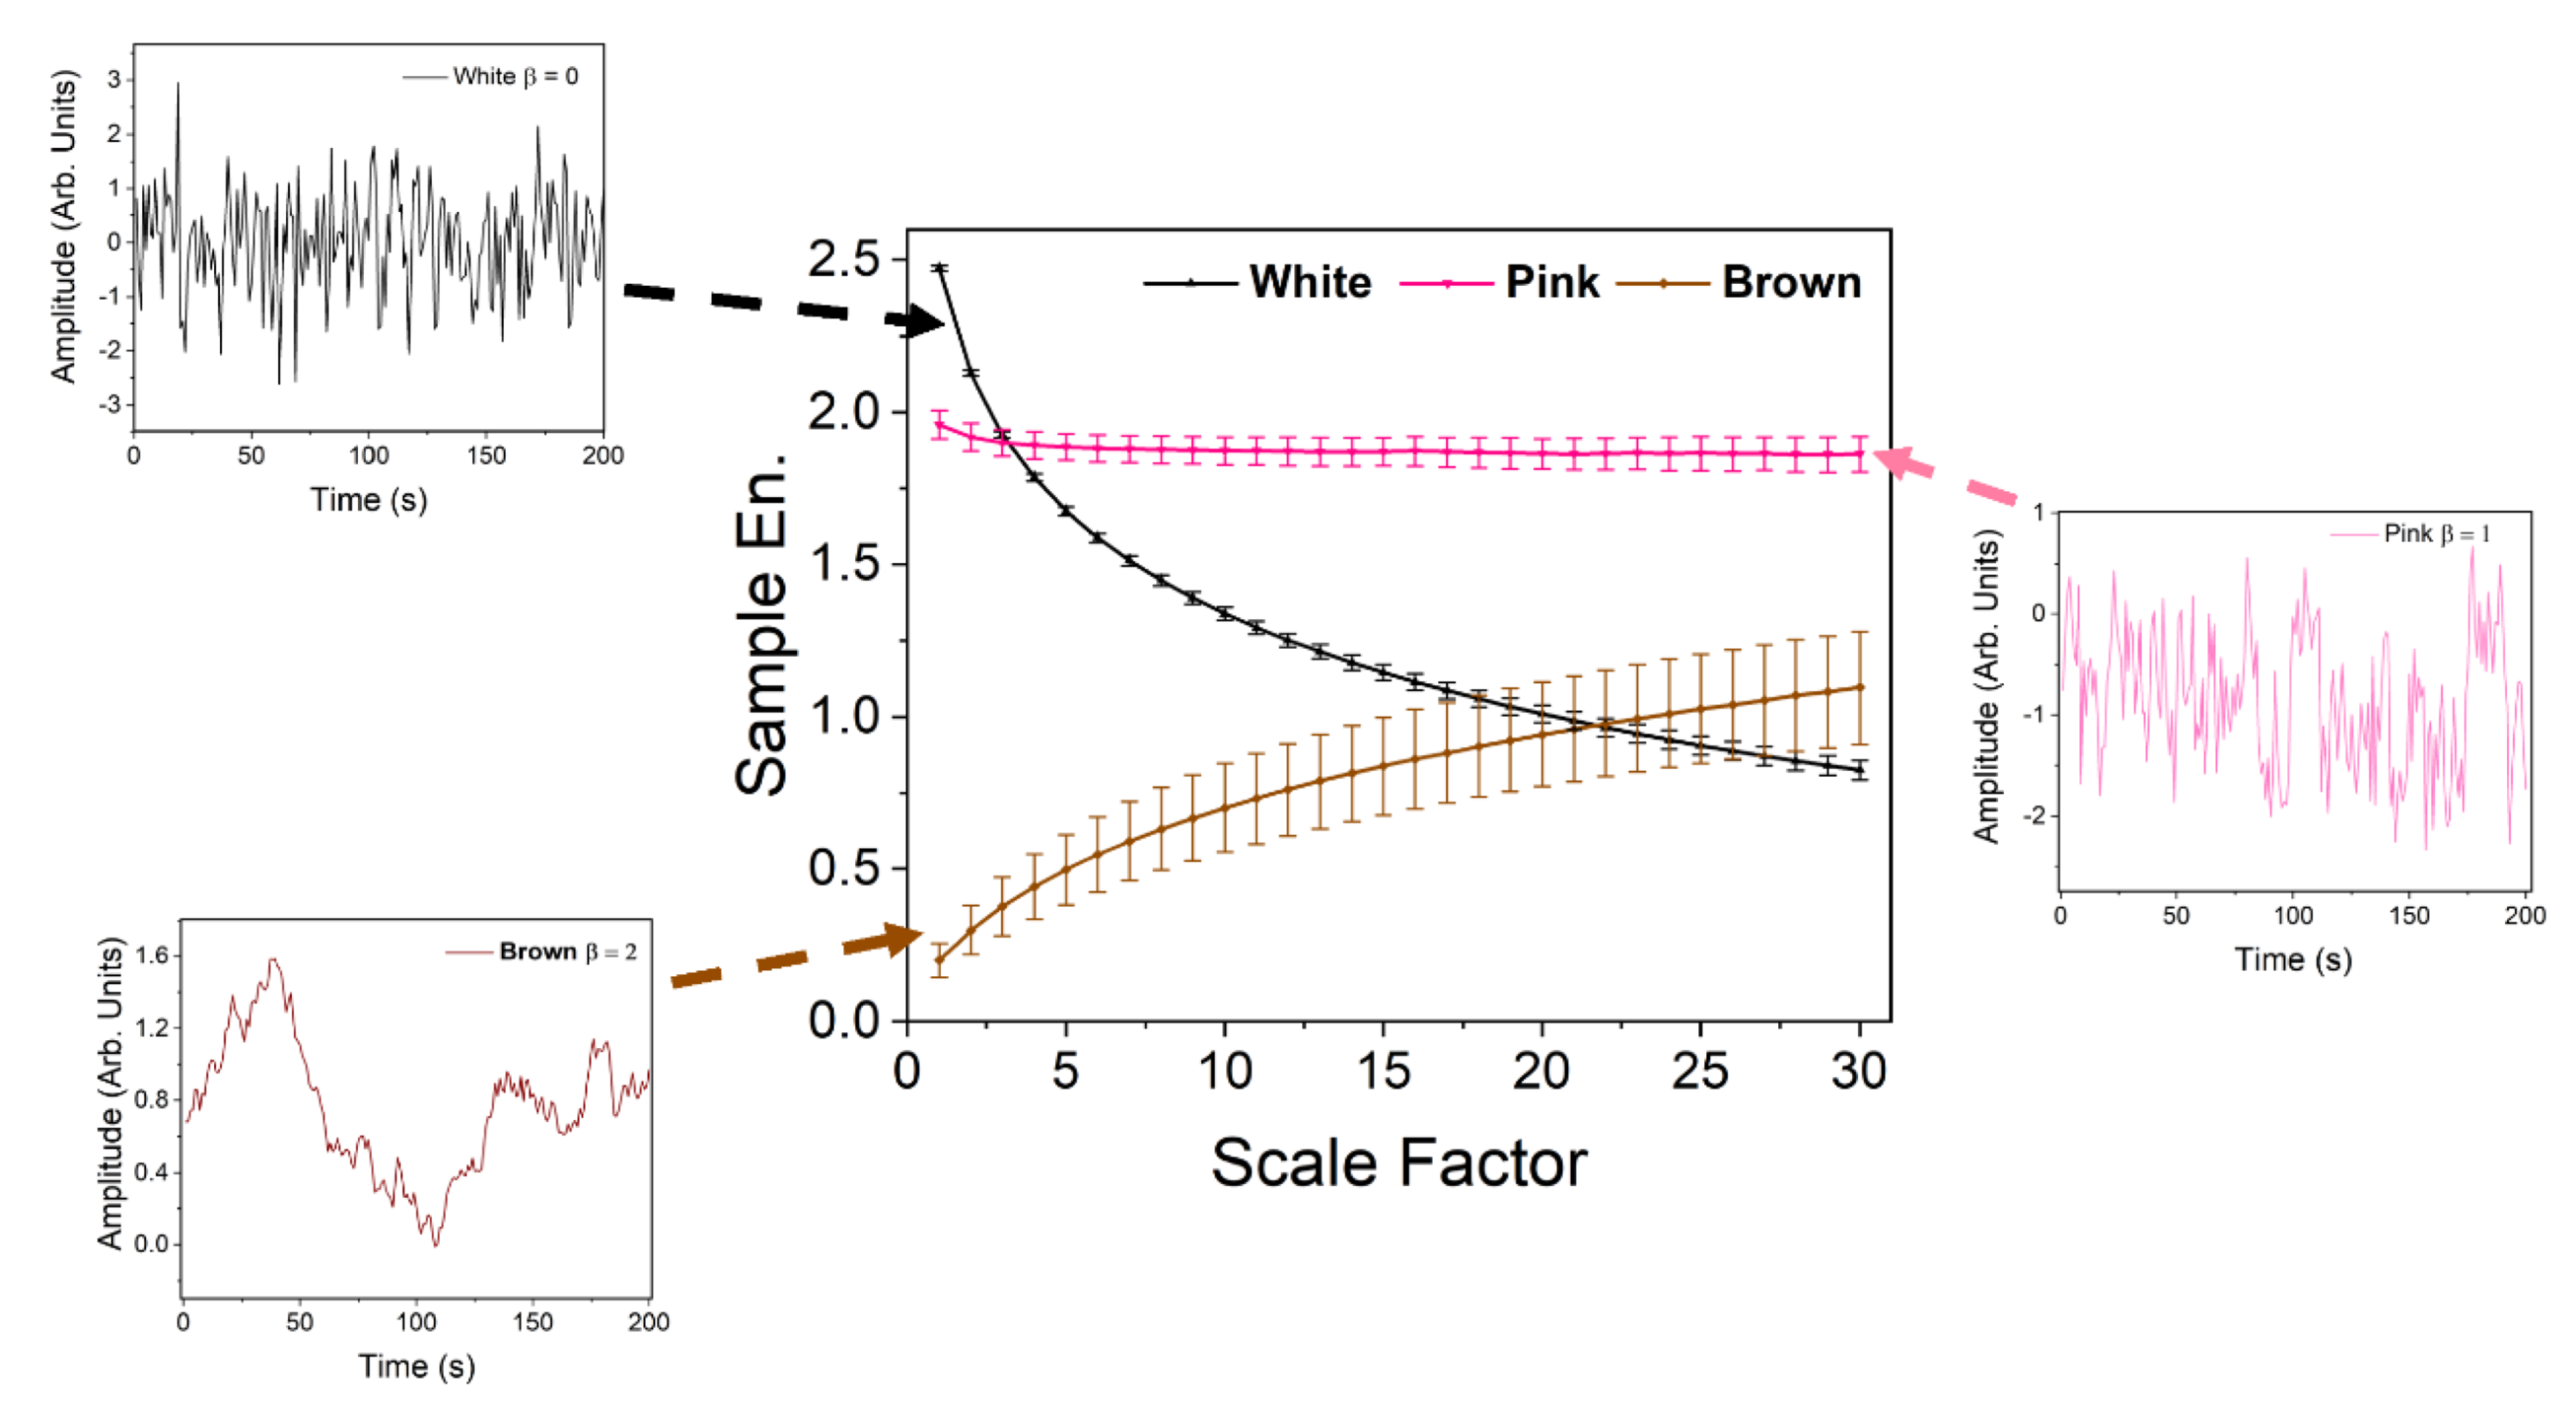
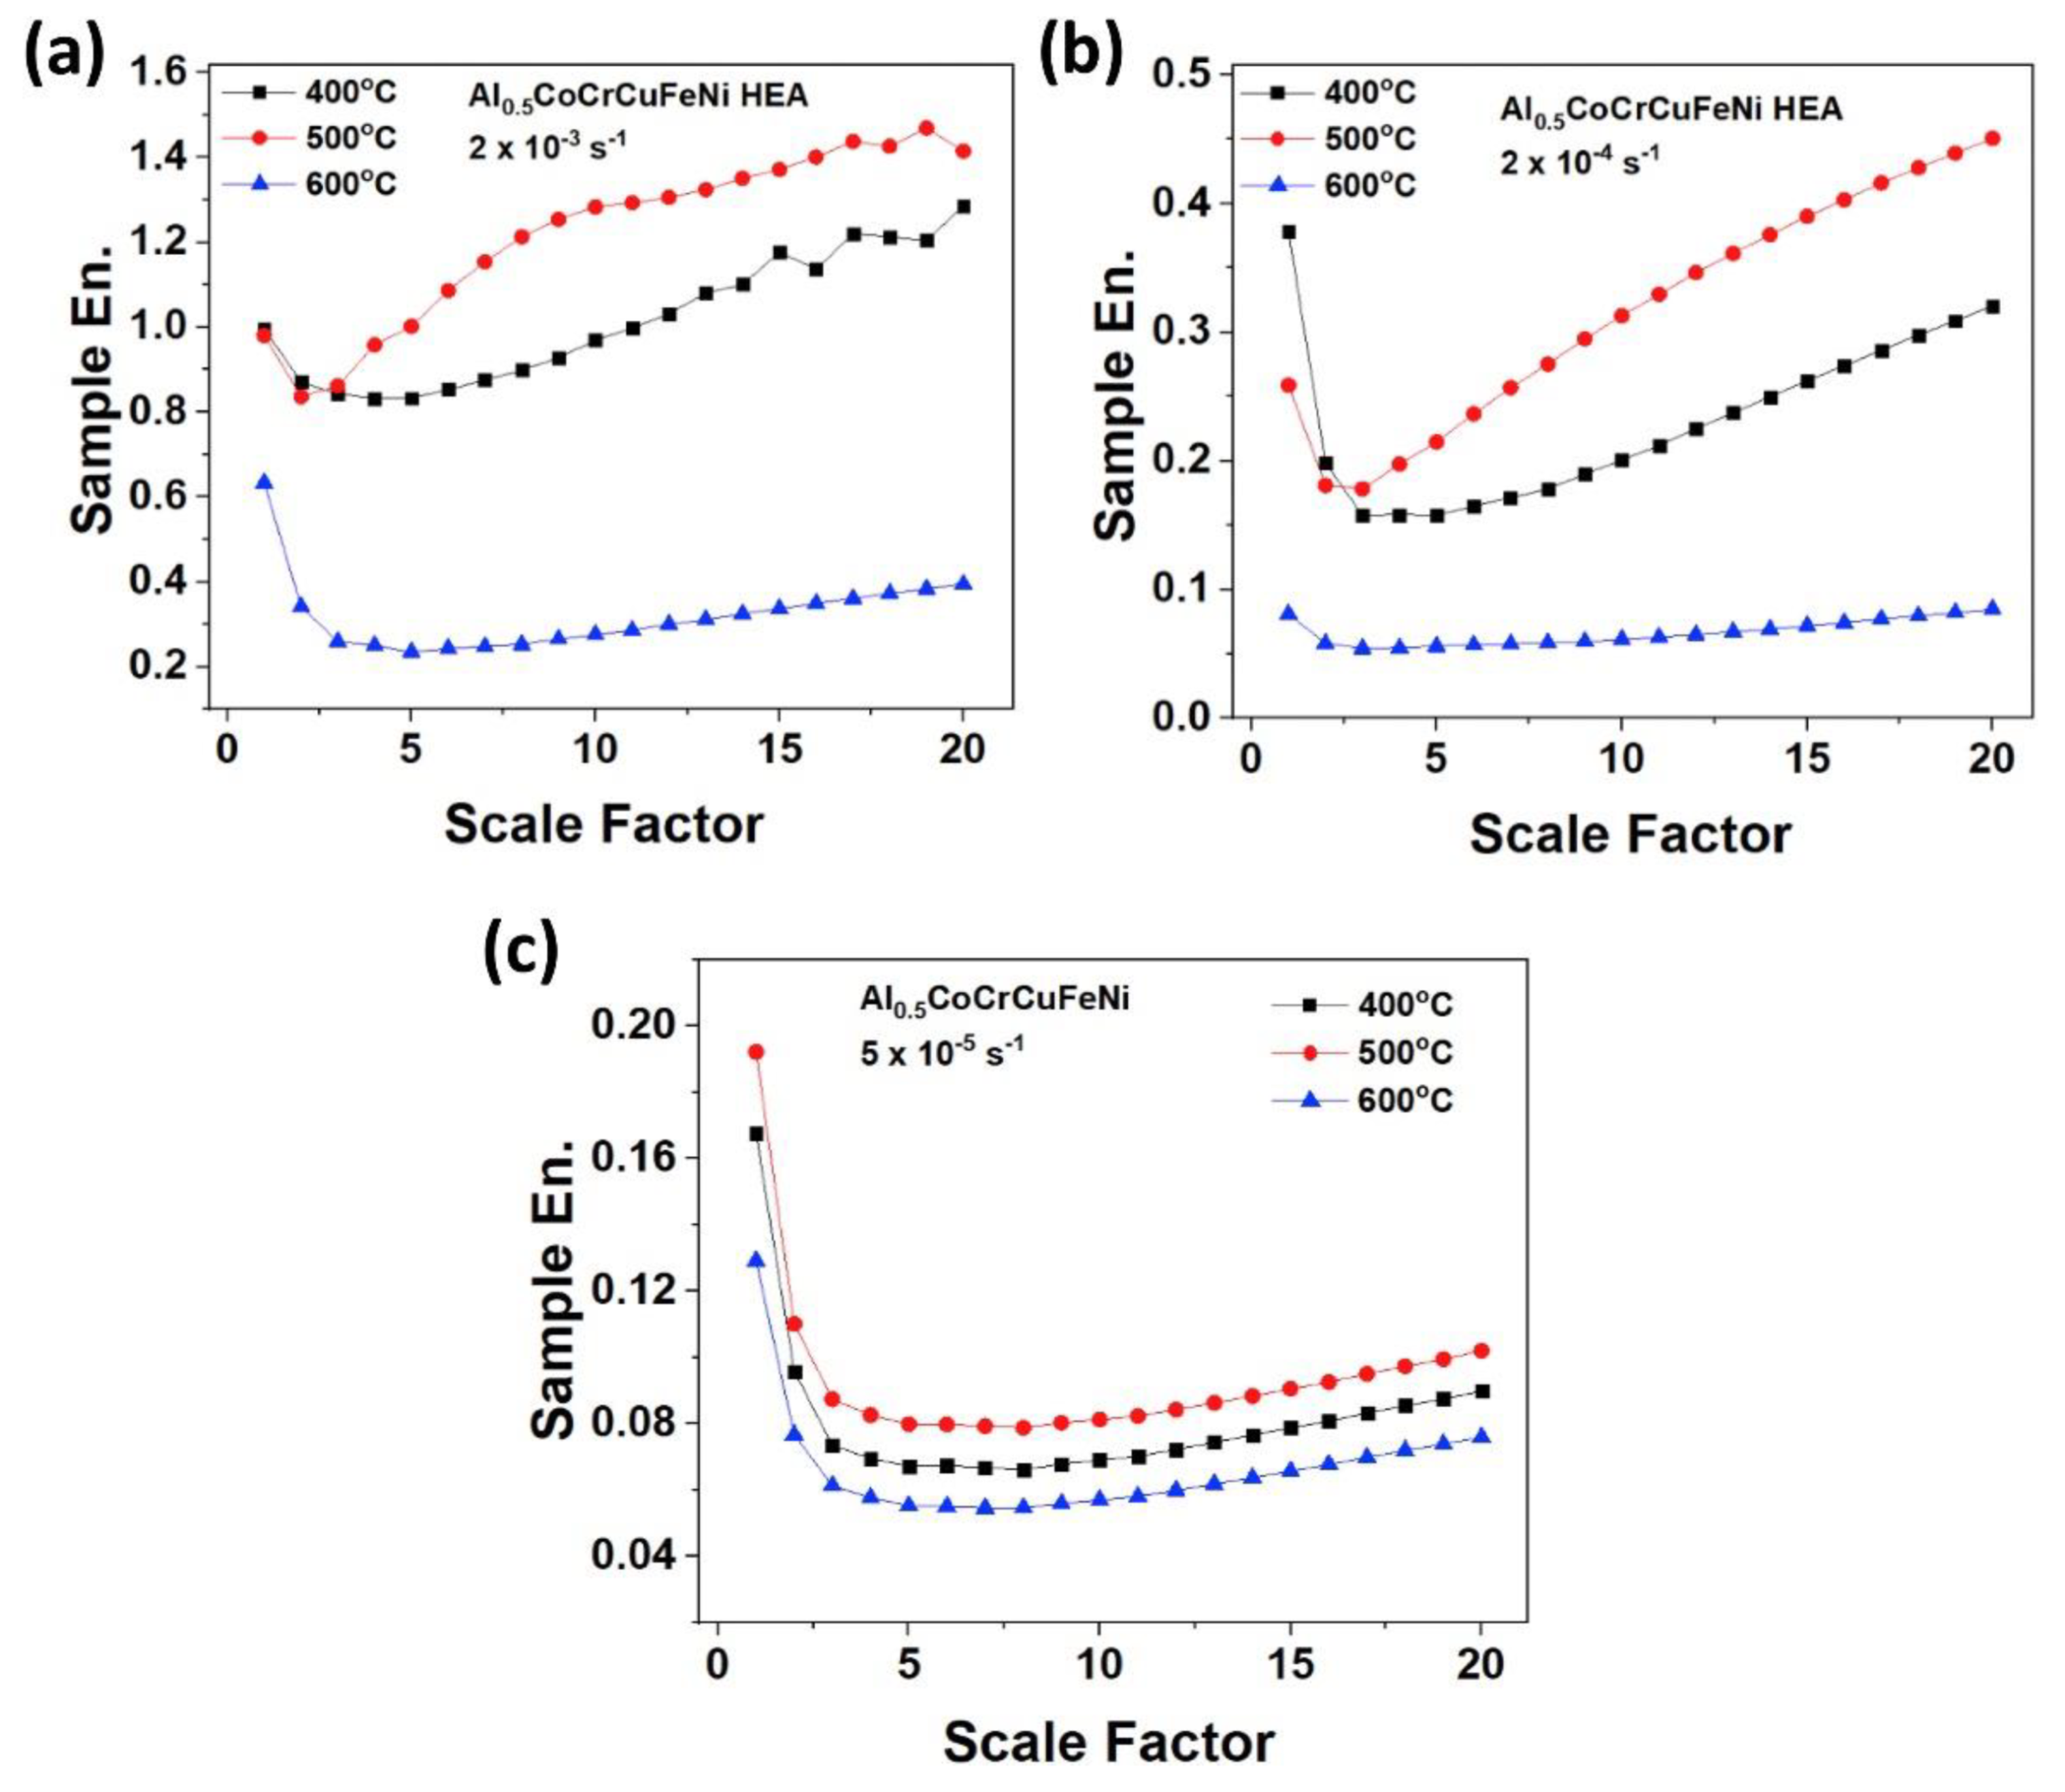
The serration data were analyzed by using different analytical techniques, such as the RCMSE (complexity) and multifractal methods. The results of the complexity analysis can be observed in
Figure 15a–c. For all of the strain rates, the sample-entropy values were the highest for the samples compressed at 500 °C, while they were the lowest for those compressed at 600 °C. This result indicates that, at 500 °C, the serrations exhibited the most complex dynamical behavior, while the opposite was true for the specimens compressed at 600 °C. Using the results from
Table 2, we can surmise that, as compared to the Type-A and Type-B serrations, the Type-C serrations exhibited less complex behavior. This lower complexity was attributed to the repeated pinning and unpinning of dislocations [
152], which is characteristic of simple behavior. In contrast, the more complex behavior inherent in the Type-A and Type-B serrations corresponded to a couple of factors. Firstly, the relatively greater complexity of the serration behavior could be attributed to the presence of the deterministic chaos that is inherent in Type-B serrations. Secondly, the increased complexity could be related to the greater variety of defect interactions that occur during the serrated flow. These interactions include the solute atom–dislocation line, dislocation line–dislocation line, dislocation line–precipitate interactions, as well as the solute atom–solute atom interactions [
180].
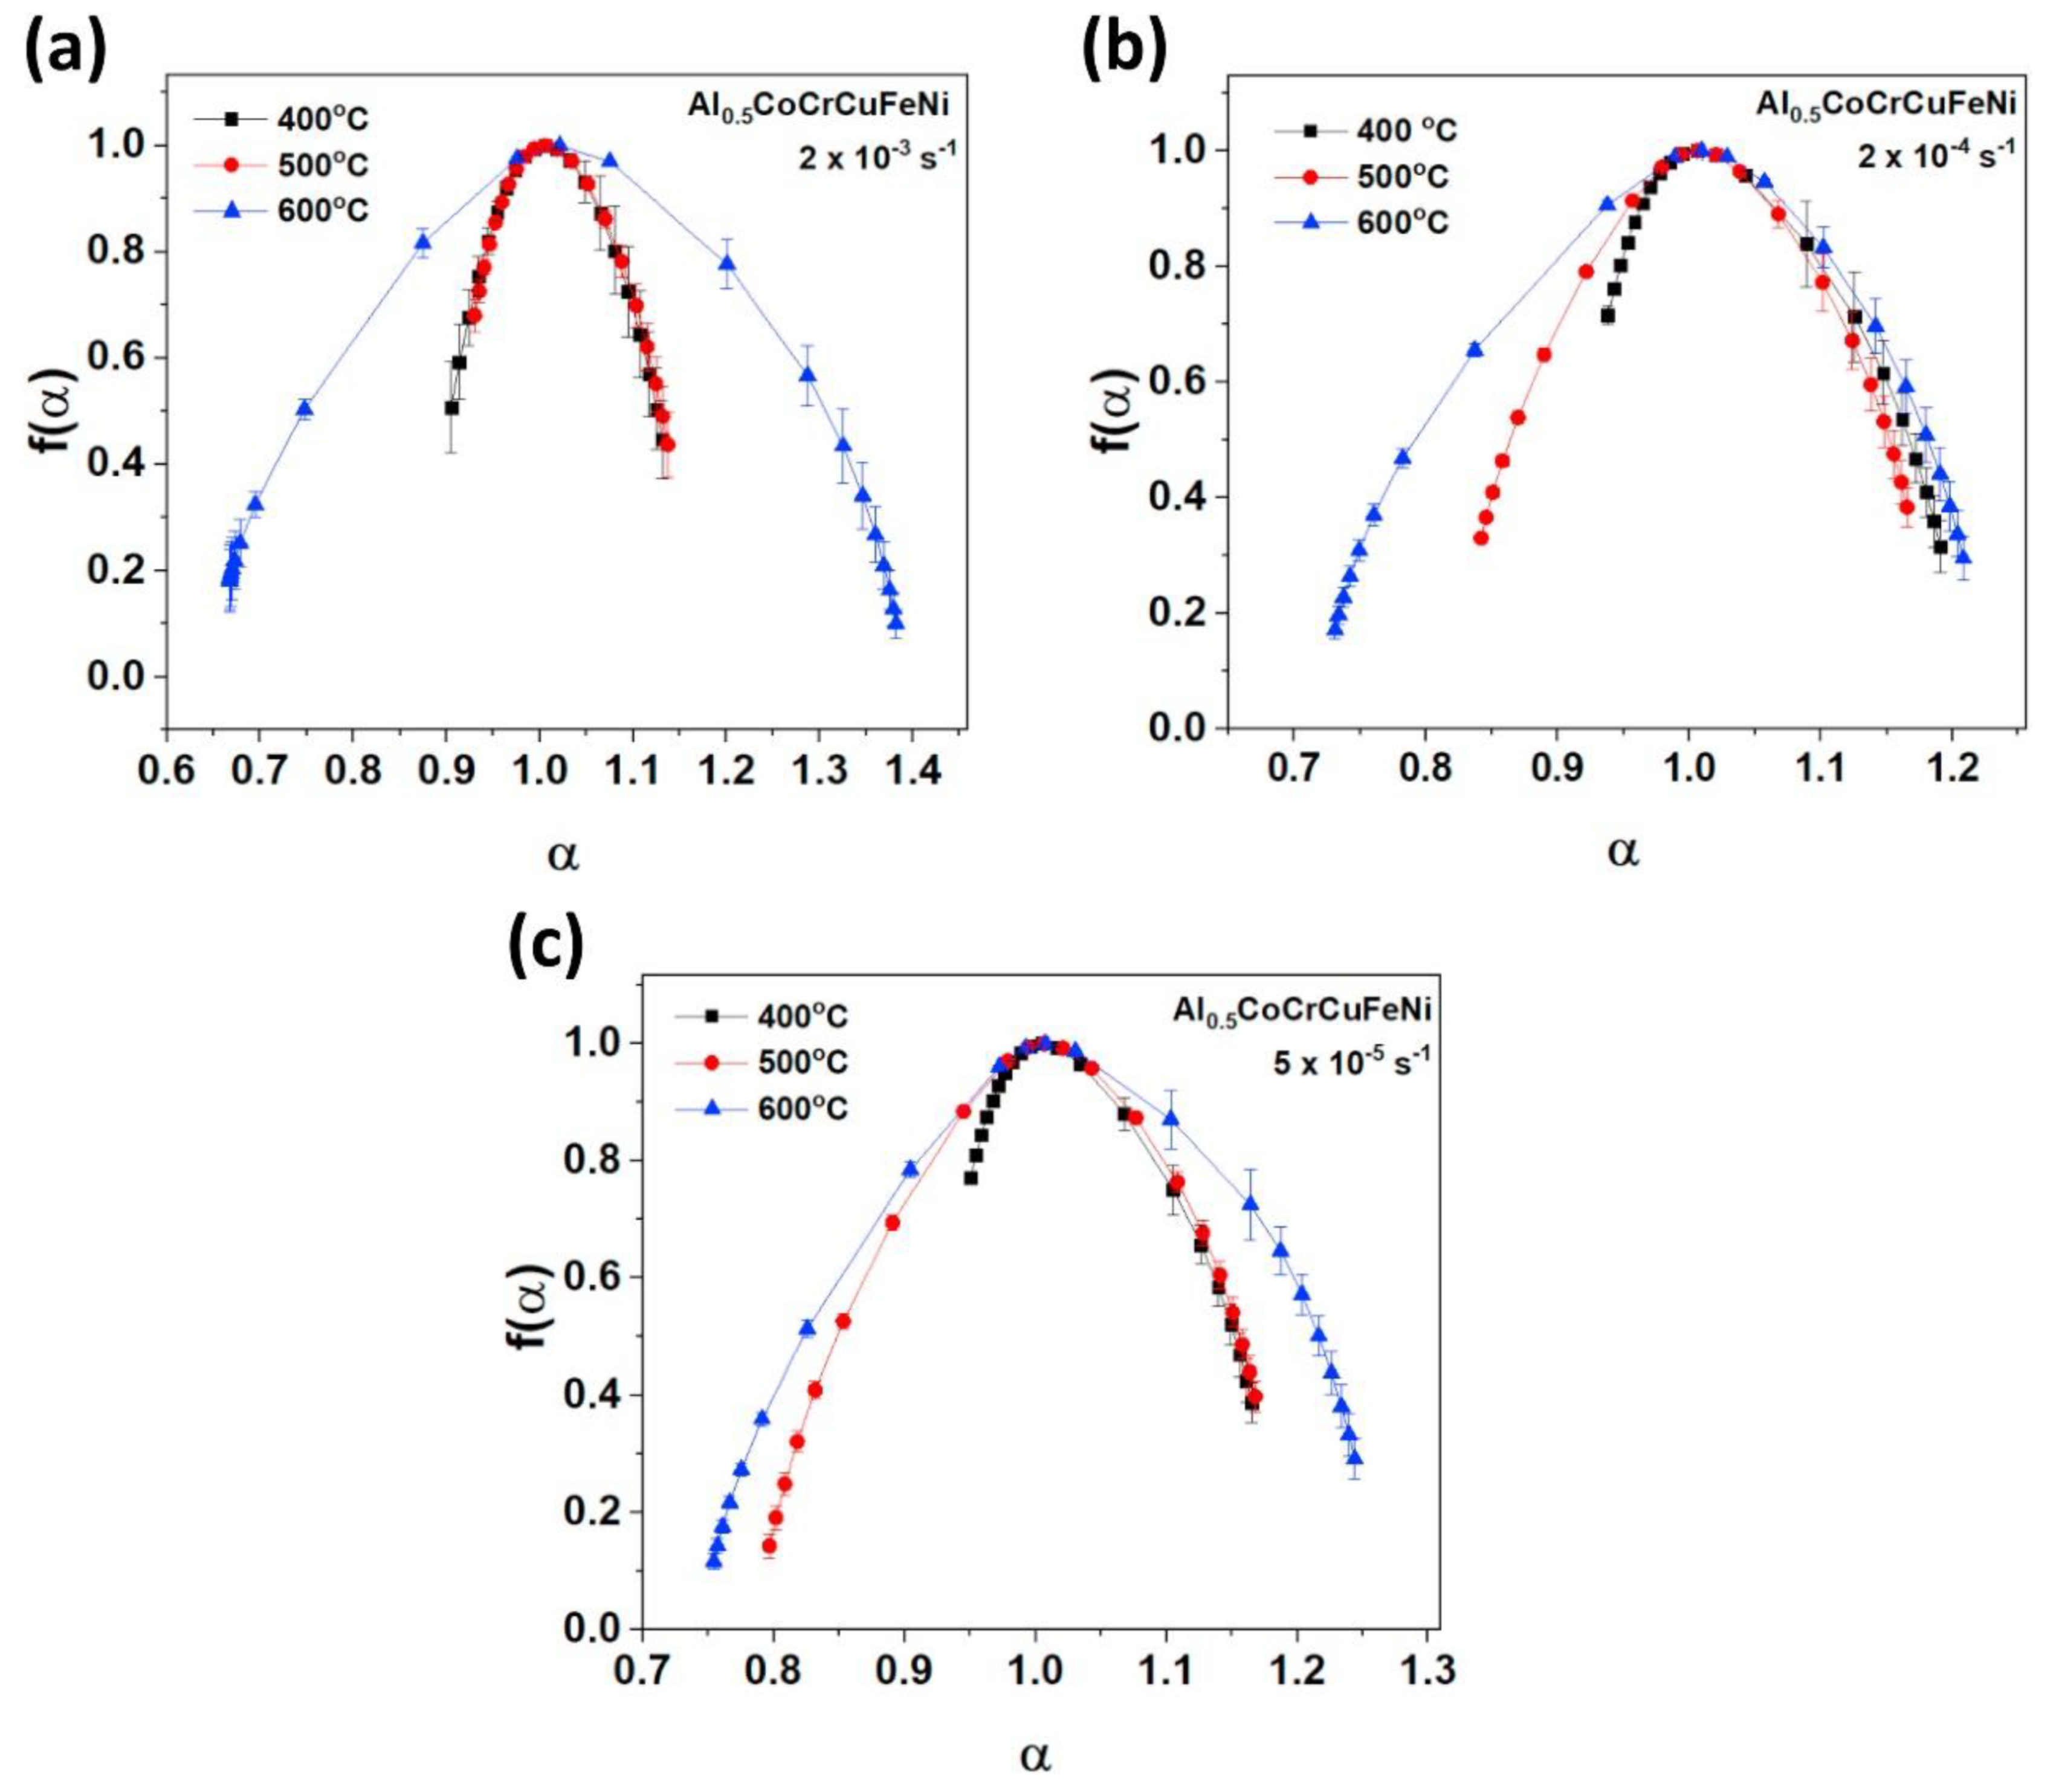
Figure 16a–c displays the multifractal spectra for the specimens tested at the prescribed temperatures and strain rates. As can be observed, all the spectra exhibited a parabolic shape for all the experimental conditions. Furthermore, the multifractality was generally found to increase with an increase in the temperature for each strain rate. Consequently, the Type-C serrations were accompanied by the widest multifractal spectra (greatest multifractality), as compared to the other serration types. There was also a sharp increase in the multifractality, and hence the dynamical heterogeneity, at 600 °C for a strain rate of 2 × 10
−3 s
−1. This burst in the multifractality may represent a transition point between different serration types or dynamical behavior [
244]. It should also be mentioned that, for the samples tested at 400 and 500 °C, where Type-A and Type-B serrations were observed, the multifractality of the serrated flow was markedly lower. The relatively lower multifractality of the serrations at these temperatures may correspond to serration dynamics that exhibit the self-organized criticality [
216].
In another study [
155], the Al
0.5CoCrCuFeNi HEA was compression tested at temperatures ranging from RT to 700 °C and a strain rate of 5 × 10
−5 s
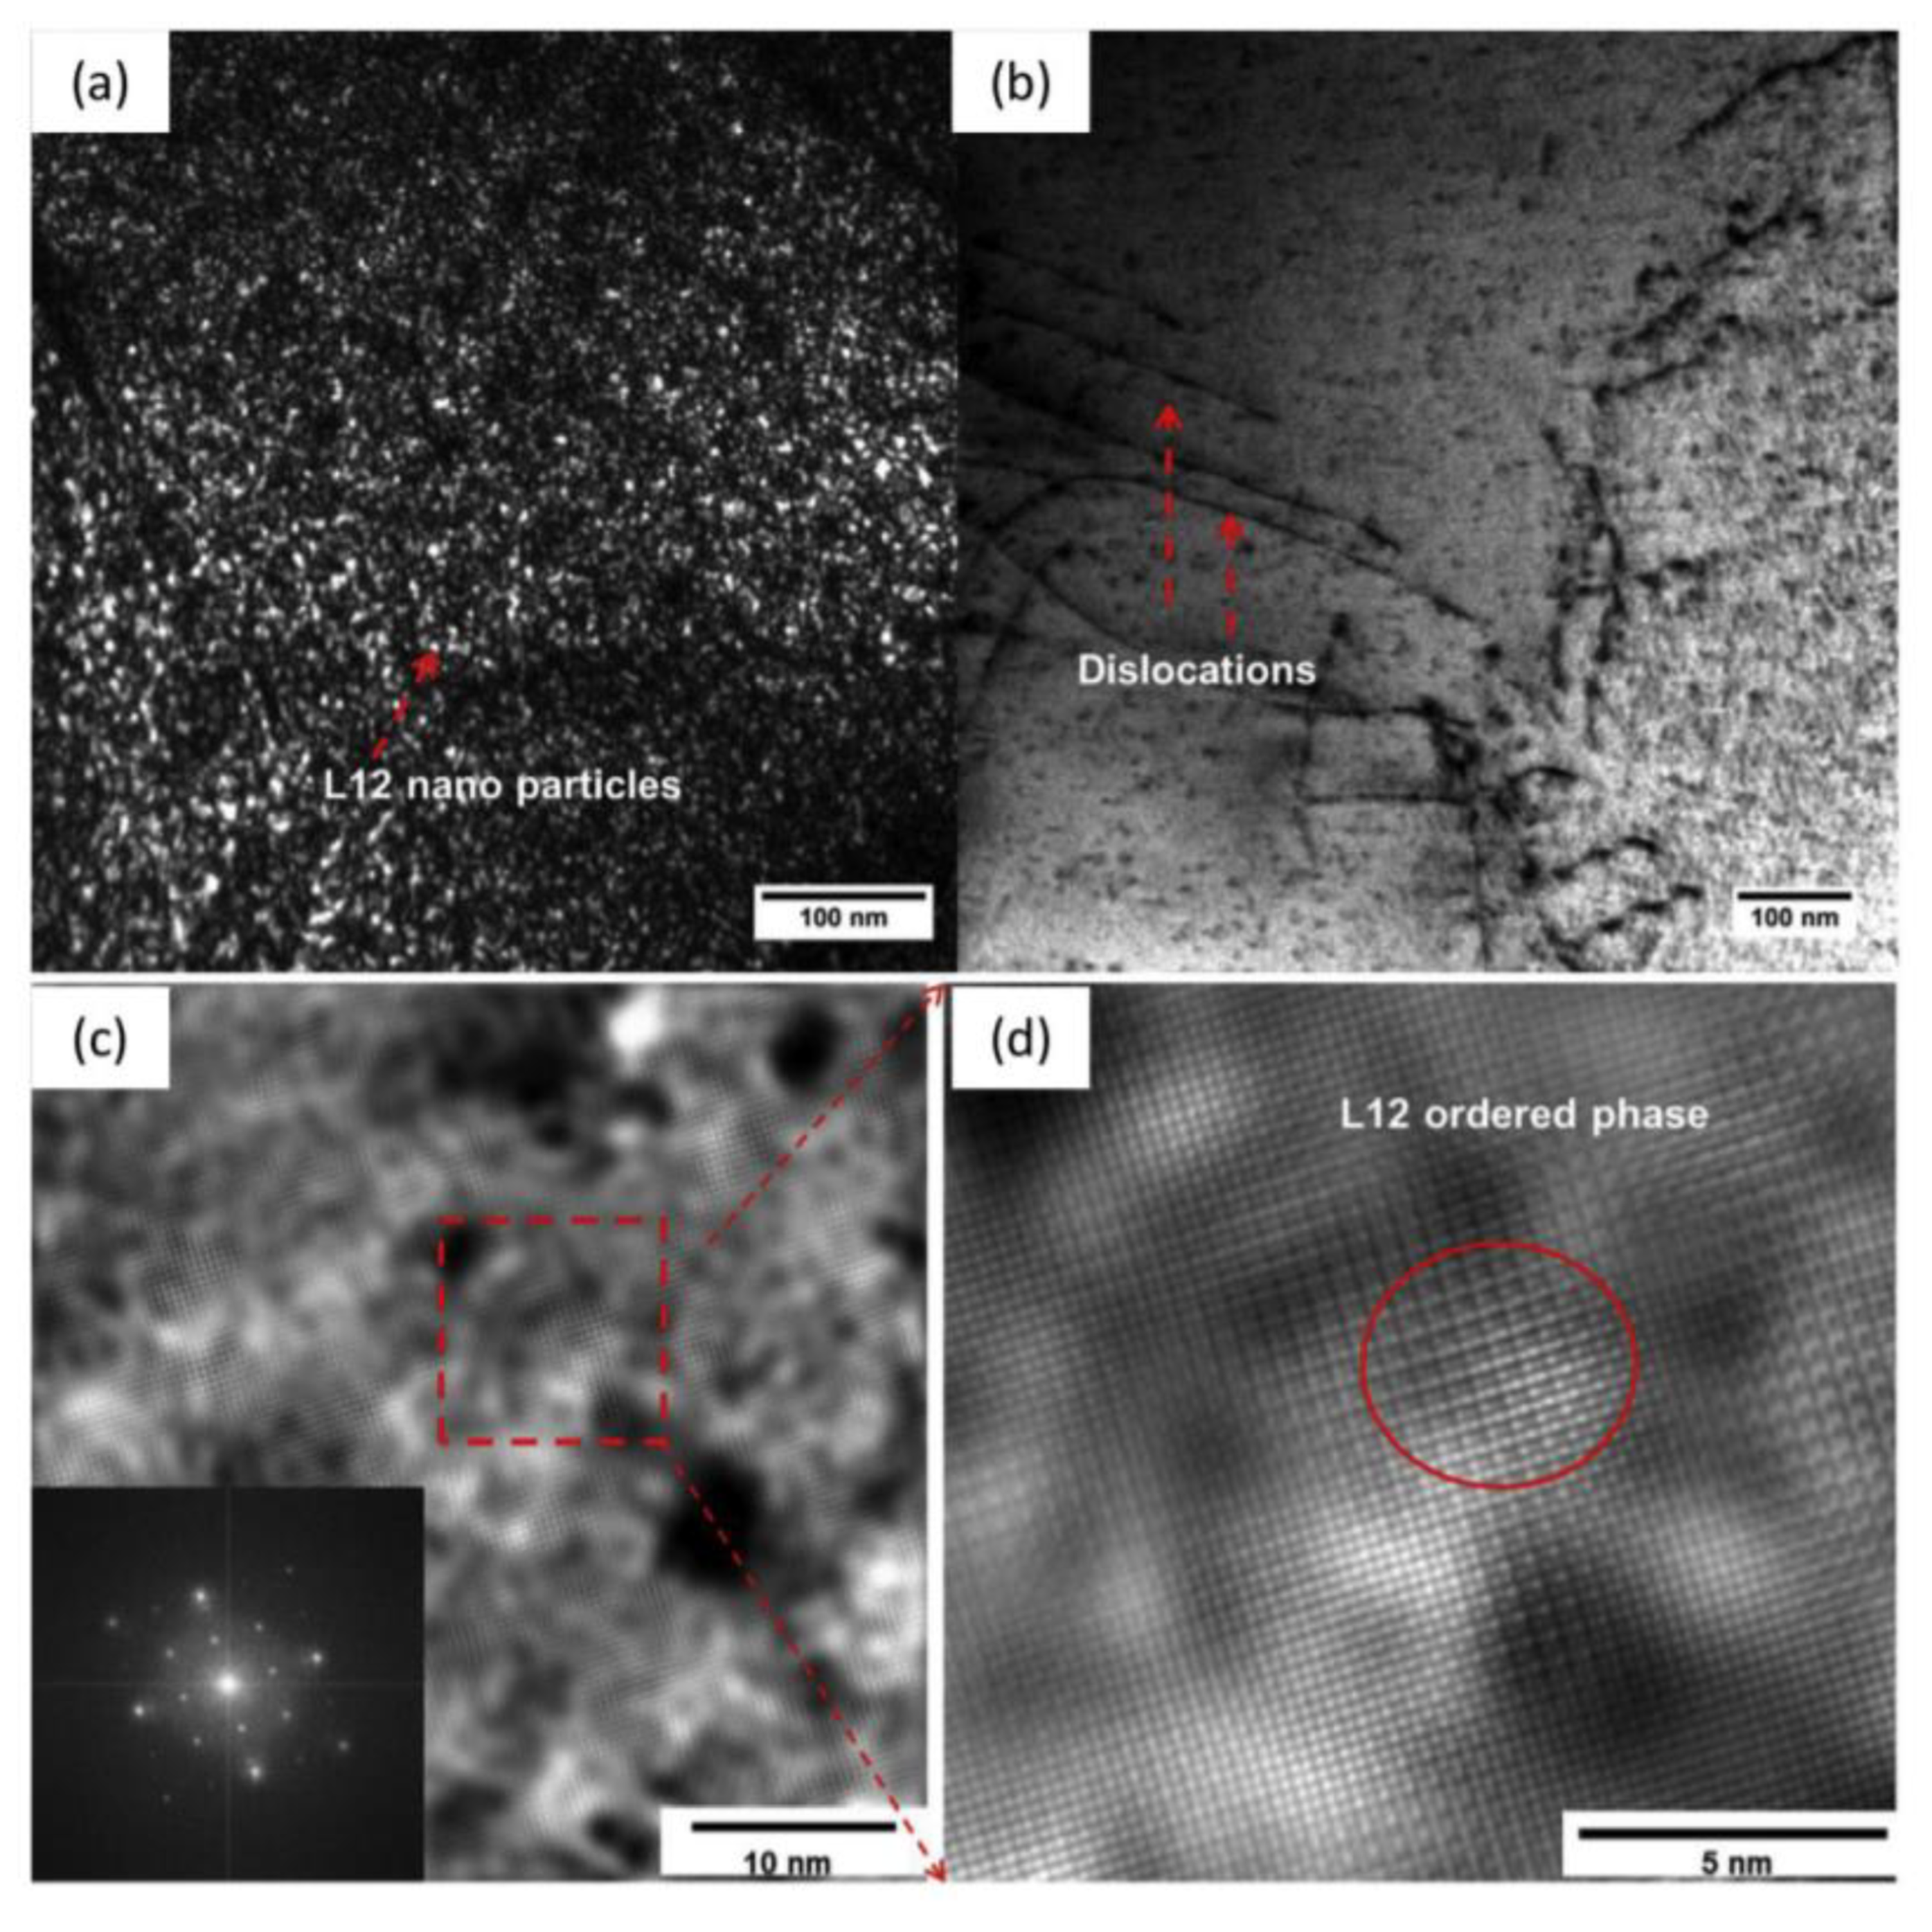
−1. The subsequent TEM (see
Figure 17a–d) and XRD characterization revealed that, after testing at a temperature of 600 °C, the matrix contained dislocations, fully ordered L1
2 particles, and both BCC and FCC phase structures in the alloy. It was also determined that, at 500 °C, there were the partially ordered L1
2 particles and an FCC phase present in the matrix. It was hypothesized that, during compression, the L1
2 particles can act as an obstacle for the moving dislocations [
155]. This obstruction reduces the mobility of the dislocations enough such that mobile solute atoms can catch and pin them, resulting in the serrated flow. With regards to the serration dynamics, the less complex serrations (Type-C) that were observed at 600 °C may somehow be related to the presence of the fully ordered L1
2 nanoparticles and BCC phase in the matrix. On the other hand, the more complex serrations observed at 500 °C (Types A and B) were apparently associated with a matrix that contains partially ordered nanoparticles and a single FCC phase. However, the exact relation between the nanoparticles and serration dynamics are still not well understood and should therefore be the focus of future investigations.
In addition to compression and tension testing, the nanoindentation [
281] serration behavior of the Al
0.5CoCrCuFeNi HEA has also been examined [
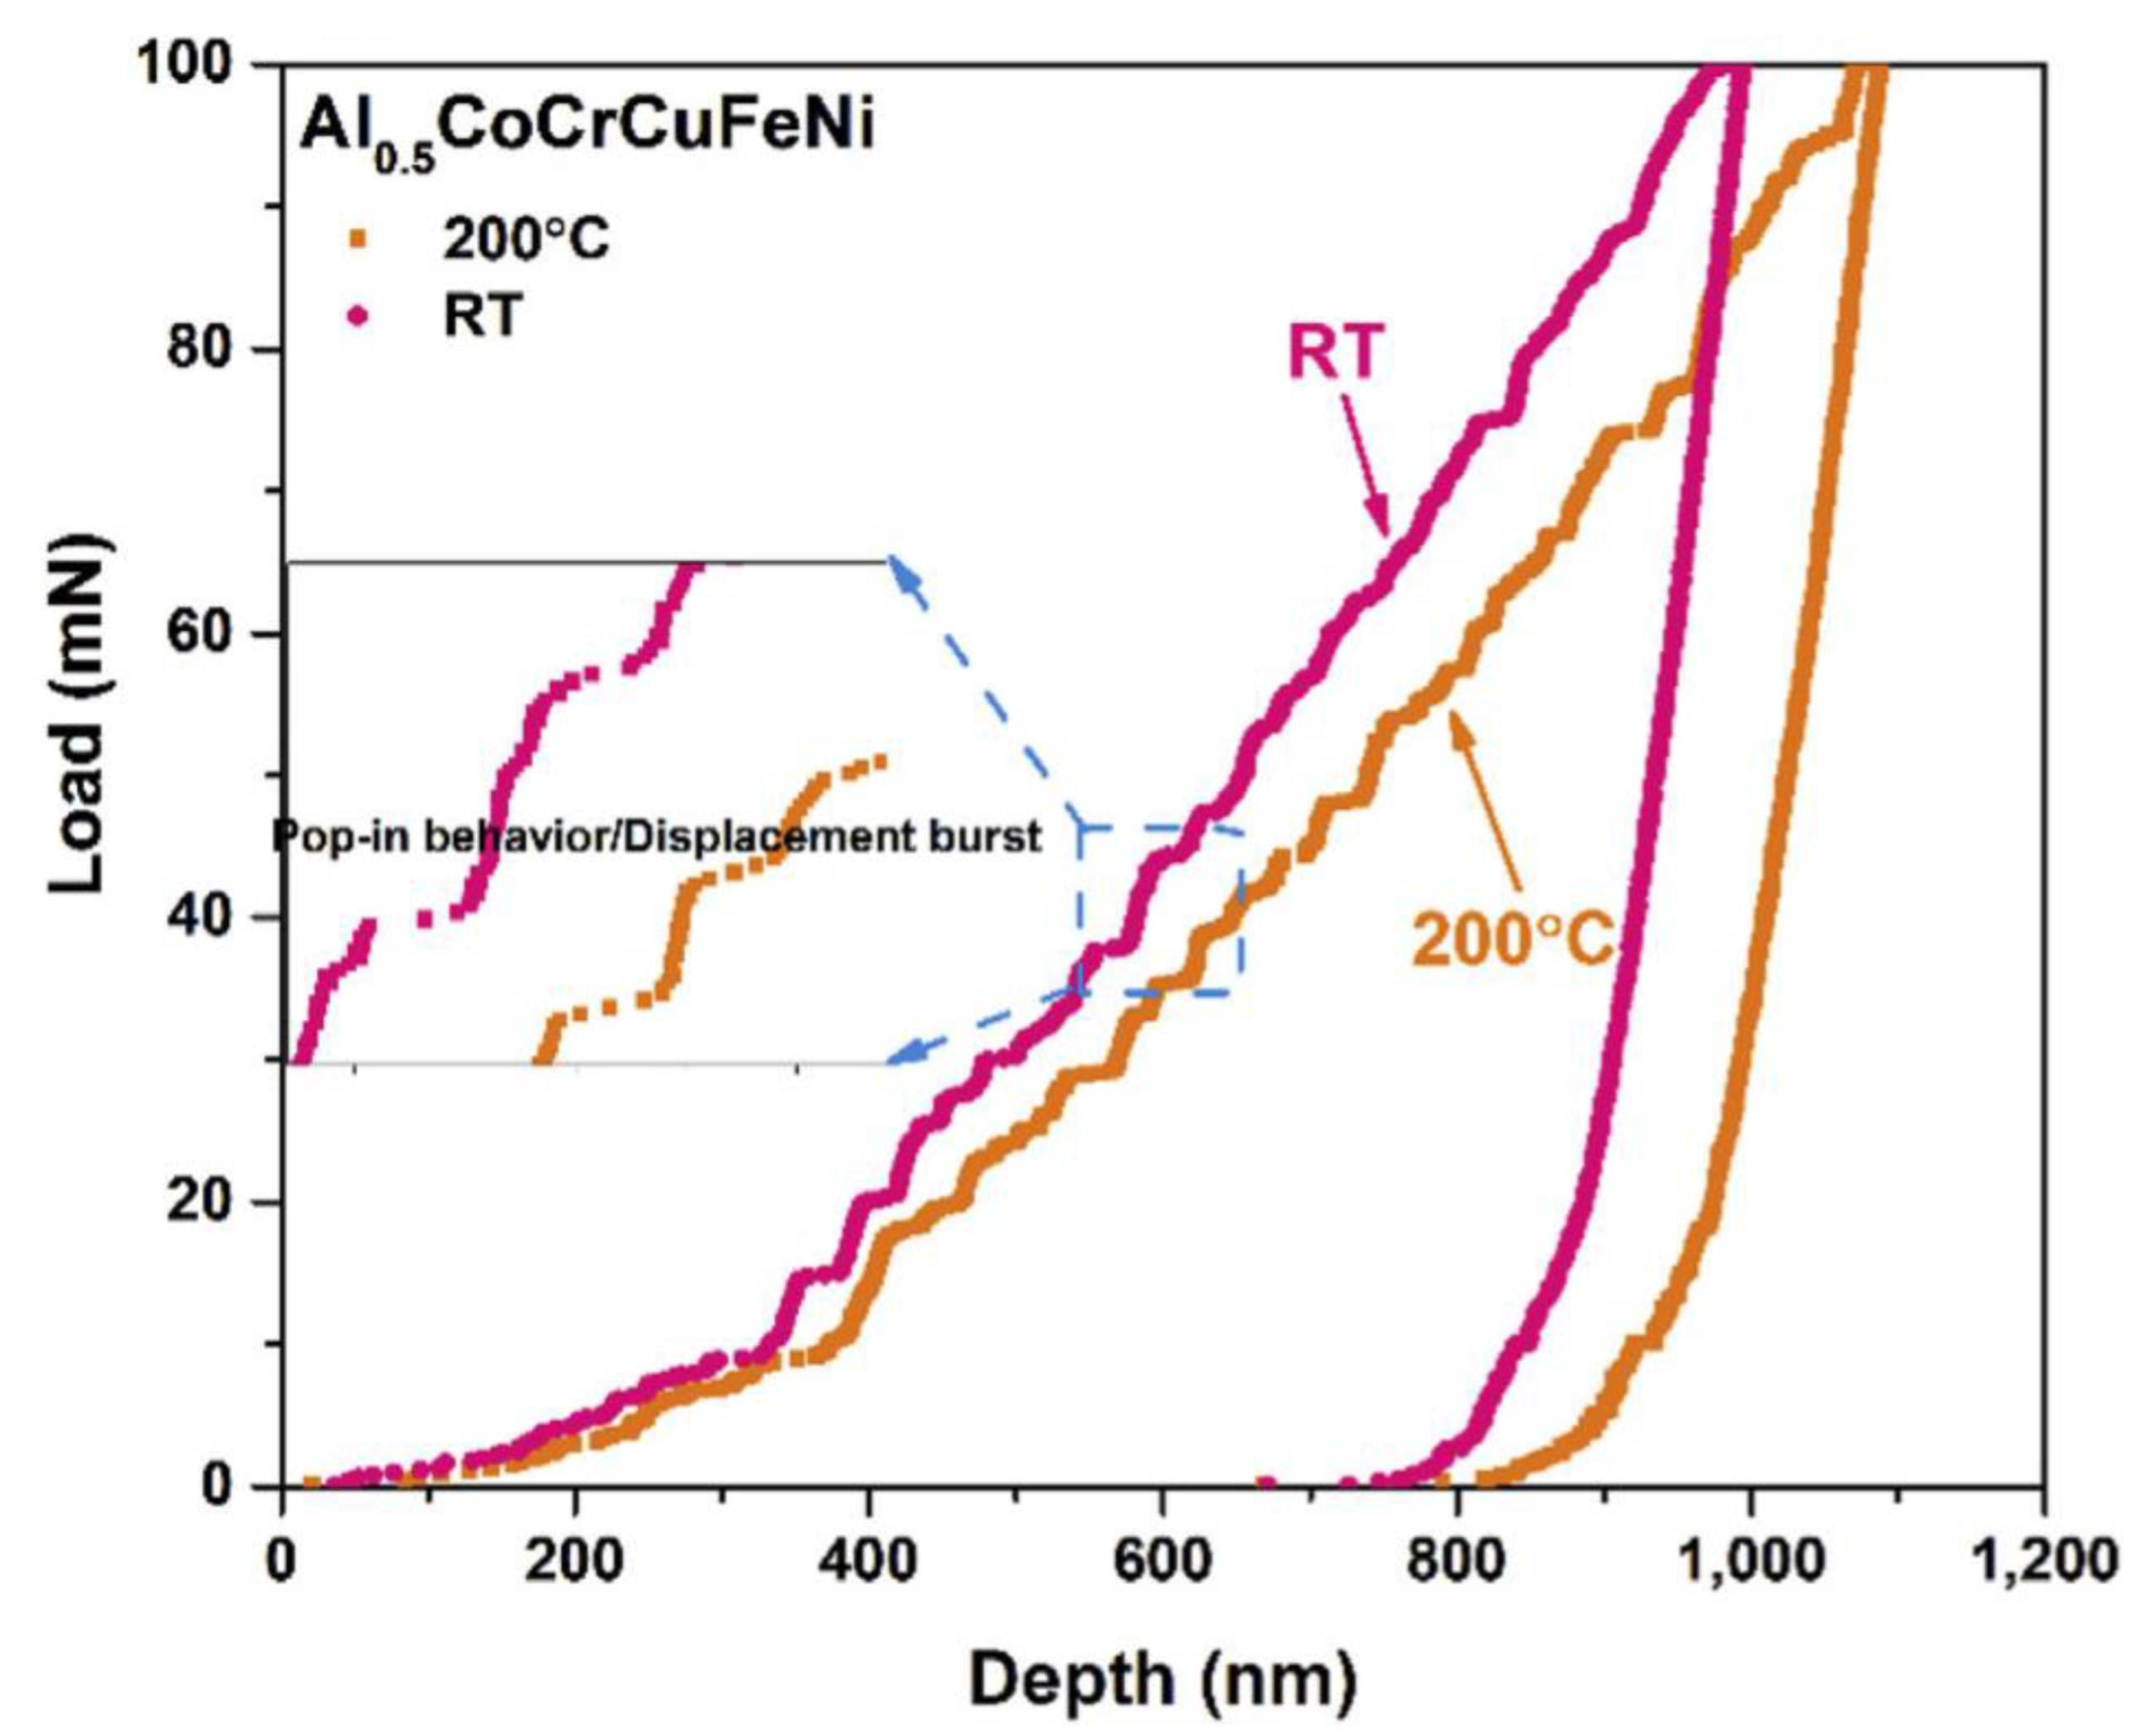
157]. For their work, nanoindentations were performed, using a NanoTest Vantage (Micro Materials Ltd., Wrexham, UK) equipped with a diamond Berkovich indenter. For the indentations, the samples were indented to a maximum load of 100 mN, using a loading rate of 10 mN/s. To study the effect of temperature on the indentation deformation, the experiments were performed at RT and 200 °C.
Figure 18 displays the nanoindentation load as a function of displacement. The magnified insets show that there was a noticeable stair-step pattern for both the RT and 200 °C conditions, which correspond to the serrated flow (displacement bursts). These serrations were thought to be caused by several factors, including the breakaway of dislocations from various obstacles, such as atoms or precipitates, dislocation multiplication, or the evolution of dislocation cells or tangles [
282].
Furthermore, it was observed that, for the 200 °C nanoindentation, the sample exhibited larger displacement bursts, as compared to the RT condition. These relatively larger displacement bursts indicate that, at higher temperatures, there is a greater concentration of dislocations that can be activated during the nanoindentation deformation. It should also be noted that, as compared to the RT condition, the tip penetrated the sample at greater depths during nanoindentation at 200 °C. This result suggests that the sample exhibited softening with an increase in the temperature and was most likely a direct result of the promoted thermal activation of dislocations during deformation at higher temperatures.
In a later study, Chen et al. analyzed the nanoindentation-serration behavior of the Al
0.5CoCrCuFeNi HEA, using multiple analytical techniques, including the chaos analysis and ApEn methods [
154]. Here, indentations were performed, using a Berkovich tip at RT and 200 °C to a peak load of 100 mN. For each temperature condition, three different holding times, namely 5, 10, and 20 s, at the peak load were used.
Figure 19 displays the associated depth vs. time data for the nanoindentation experiments with the prescribed temperatures and loading times. As can be observed, there was serrated flow in the holding regime of the data.
The data corresponding to the serrated flow that occurred during the holding periods were analyzed by using methods such as the chaos and ApEn analytical techniques.
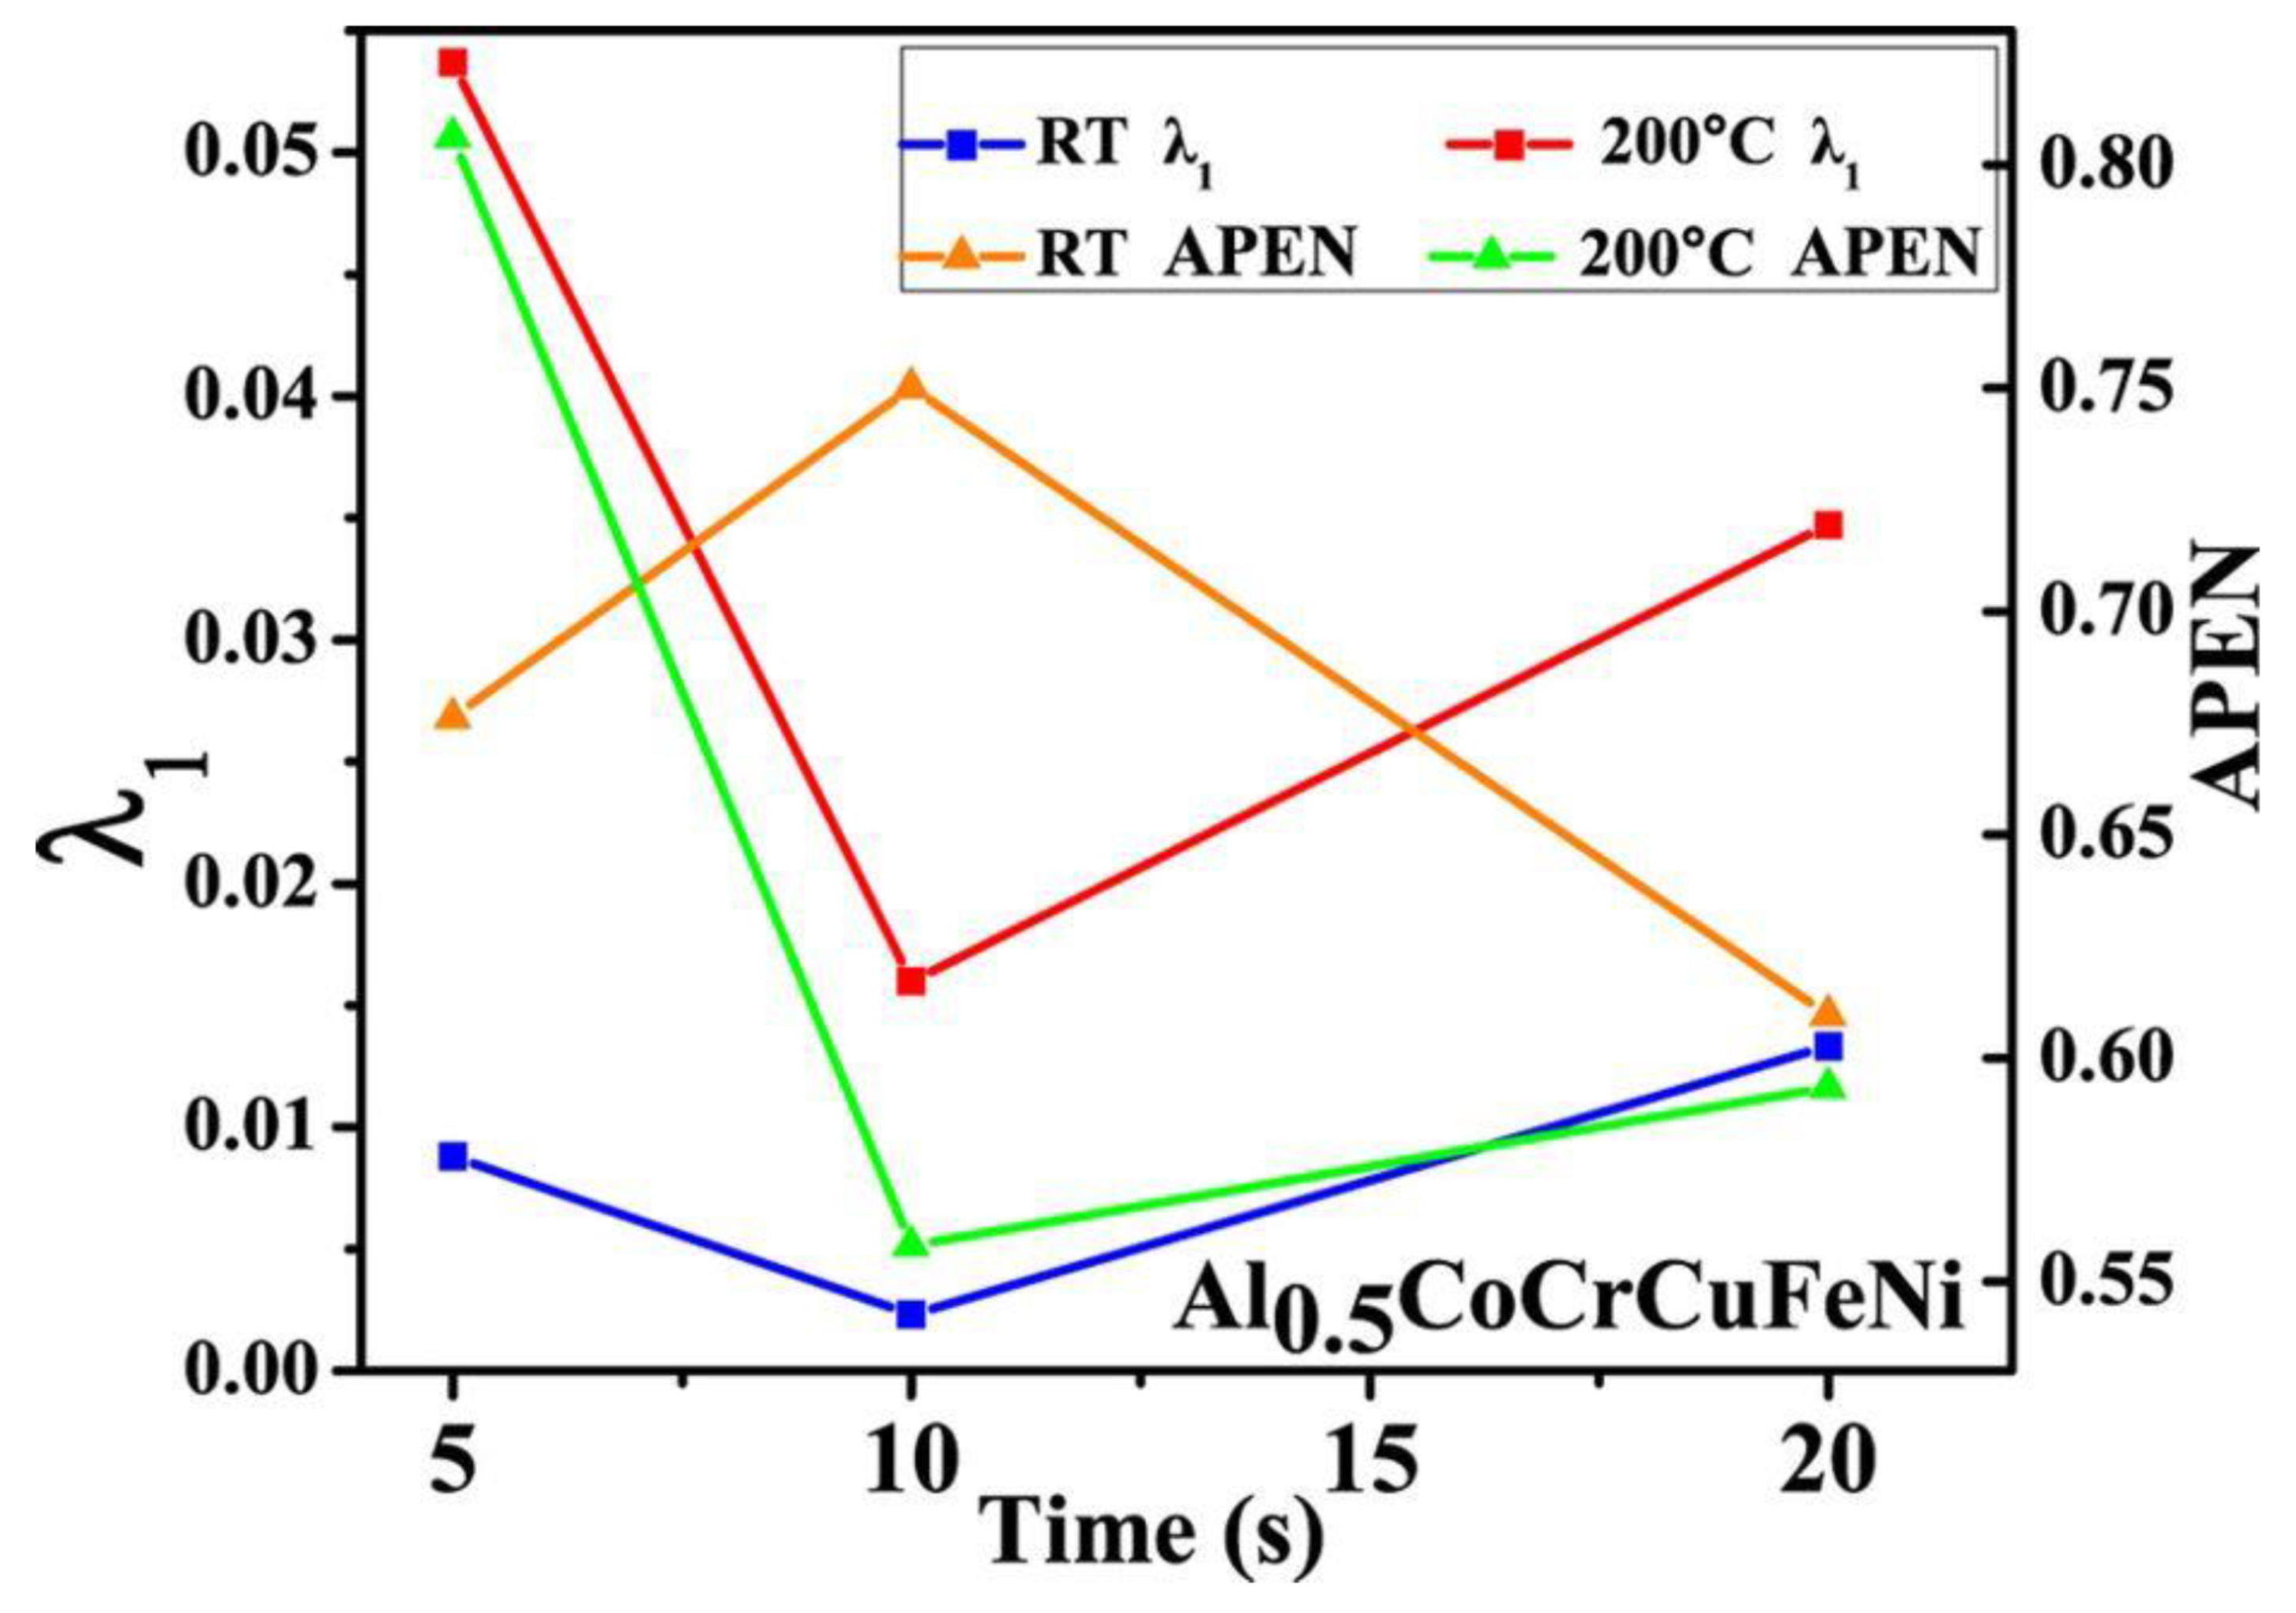
Figure 20 displays the largest Lyapunov exponent, λ
1, and the ApEn results as a function of holding time for times ranging from 5 to 20 s. For both the RT and 200 °C conditions, the λ
1 values are positive for all the loading times. This finding signifies that for all the experimental conditions, the serrated flow is associated with slip-band dynamics that exhibit chaotic behavior. The result also means that the serration dynamics are sensitive to initial conditions. Furthermore, the largest Lyapunov exponent increased with an increase in the temperature (for a given holding time), indicating that the serrated flow exhibited a greater degree of chaotic behavior at 200 °C. This increase in the chaotic dynamics at the elevated temperature was attributed to a greater mobility of dislocations. It was also observed that, for both temperatures, λ
1 attained a minimum at a holding time of 10 s, which indicates that the serrated-flow behavior was the least affected by initial conditions, as compared to the other holding times. In terms of the ApEn values, they exhibited a similar trend as λ
1 for the sample tested at 200 °C. Furthermore, both values attained a maximum for a holding time of 5 s. The authors hypothesized that the maximum values for the lower holding time corresponded to the increase in the number of interactions among the slip bands that are indicative of a more complex process. As for the room-temperature nanoindentation, a holding time of 10 s was accompanied by both a minimum λ
1 value and a maximum value for the ApEn. This result indicates that the serration behavior exhibited dynamical behavior that has both a relatively low sensitivity to initial conditions and also a greater degree of freedom [
154].
Antonaglia et al. applied the mean-field theory to analyze the slip-avalanche statistics for the investigated conditions [
167]. For the experiments, specimens with a length of 4 mm and diameter of 2 mm underwent uniaxial-compression tests at a strain rate of 4 × 10
−4 s
−1, at temperatures of 7, 7.5, and 9 K. The test temperature was controlled by using liquid He.
Figure 21a shows the stress vs. strain data resulting from the compression experiments, and the results of the analysis are displayed in
Figure 21b. As can be seen, serrations were observed at all three test temperatures. Furthermore, it was found that the magnitude of the serrations significantly increases with an increase in the compression strain. It was also noted that a similar trend has previously been observed in BMGs [
133,
136,
283]. The largest stress-drop size decreases as the temperature increases from 7 to 9 K. This decrease in the slip size for the above temperature range is in agreement with the model prediction, which states that the magnitude of the slip avalanche will be reduced as the temperature increases [
284]. The reduction in the avalanche size was related to the twinning phenomenon in the HEA at cryogenic temperatures, where an increase in the temperature increased the difficulty in which deformation twinning could be induced during compression.
In a similar study, the serrated flow during uniaxial compression was analyzed by using the chaos formalism [
165]. Here, samples were compressed at a strain rate of 4 × 10
−4 s
−1 and temperatures ranging from 4.2 to 9 K. It was found that the serrated flow exhibited similar behavior (7.5 and 9 K) to that observed by Antonaglia et al. [
167]. The results of the analysis revealed that the largest Lyapunov exponent was negative at all the test temperatures. This result indicates that the serrated flow did not exhibit chaotic behavior and indicates that the slip dynamics are stable. It is interesting to note that these results are in contrast with those from Chen et al, where it was determined that the serrated flow during nanoindentation at RT and 200 °C exhibited chaotic behavior [
154]. However, it is important to note that the deformation mechanisms associated with twinning at cryogenic temperatures are completely different from those which occur during nanoindentation pop-ins at temperatures greater than or equal to RT. Therefore, these findings suggest that the sensitivity of the serration behavior to initial conditions may depend on the underlying deformation mechanisms.
3.2. Al0.1CoCrFeNi HEA
Xia et al. studied the deformation mechanisms of an Al
0.1CoCrFeNi HEA that was produced by vacuum-levitation methods [
285]. For the experiment, specimens underwent uniaxial-compressive tests where samples were exposed to a strain of 2 × 10
−4 s
−1 and temperatures of 77 K, 200 K, and 298 K. Results showed that the serrated flow was only observed in the sample compressed at 77 K.
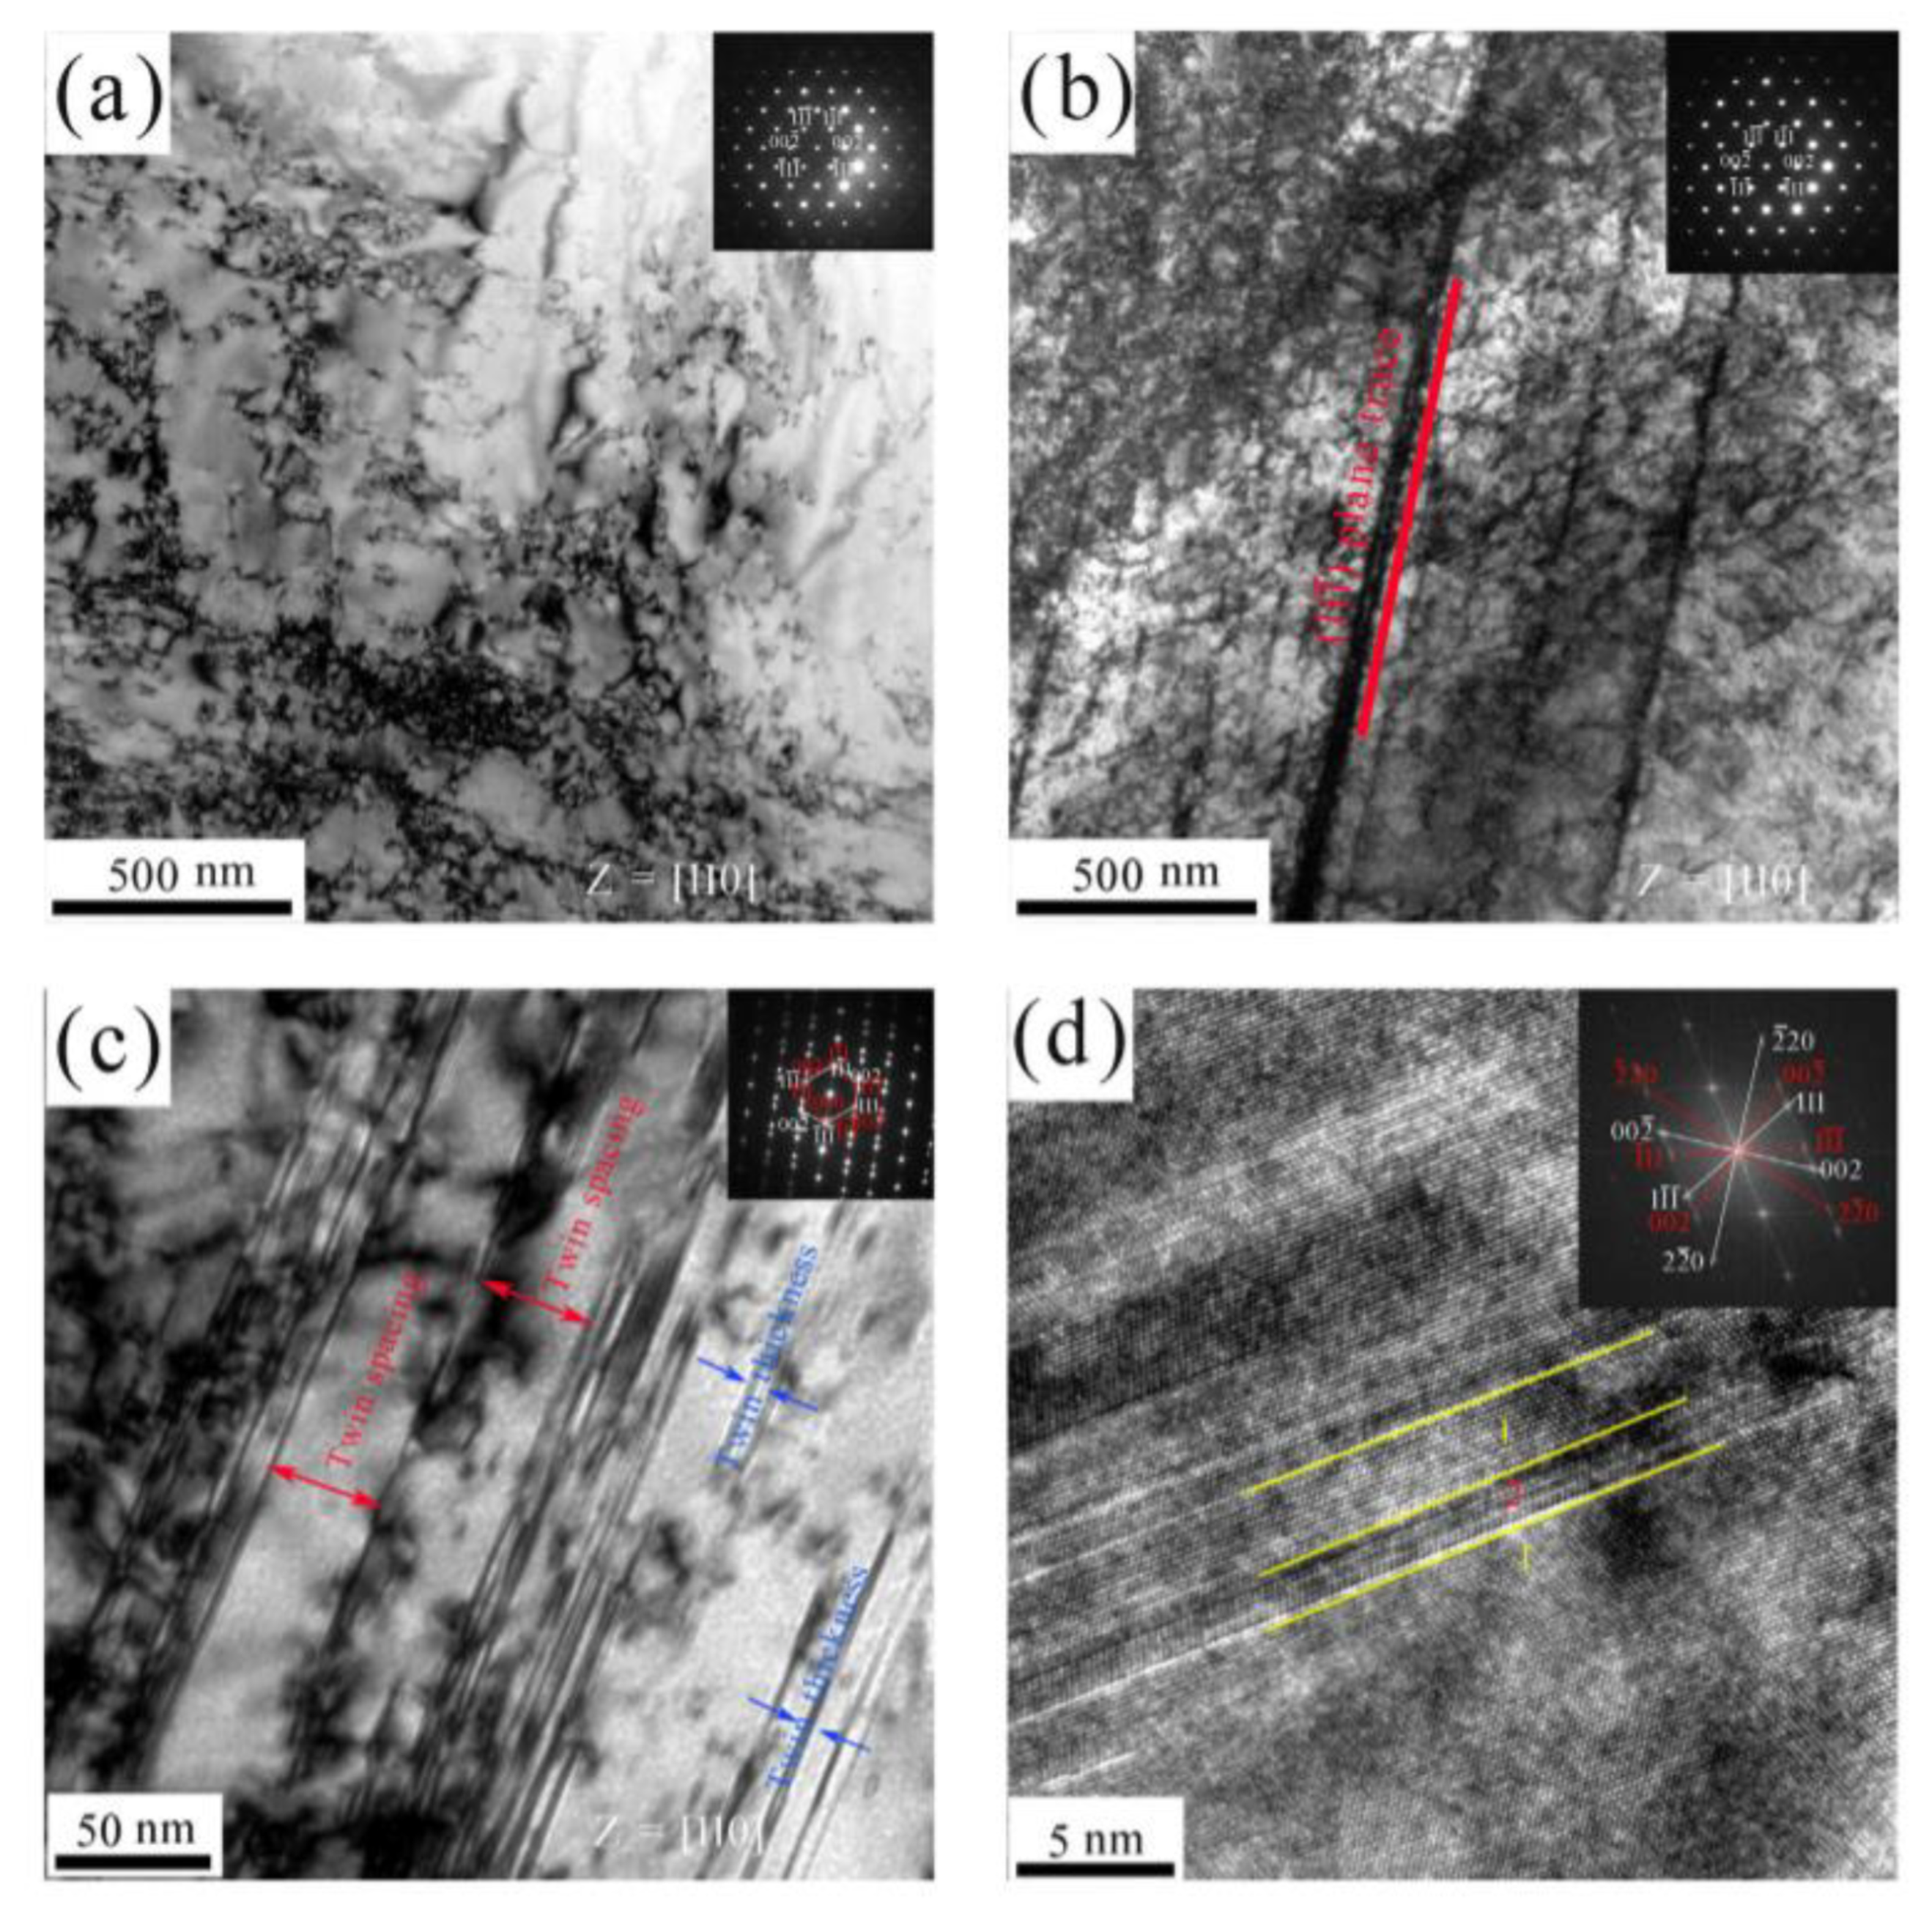
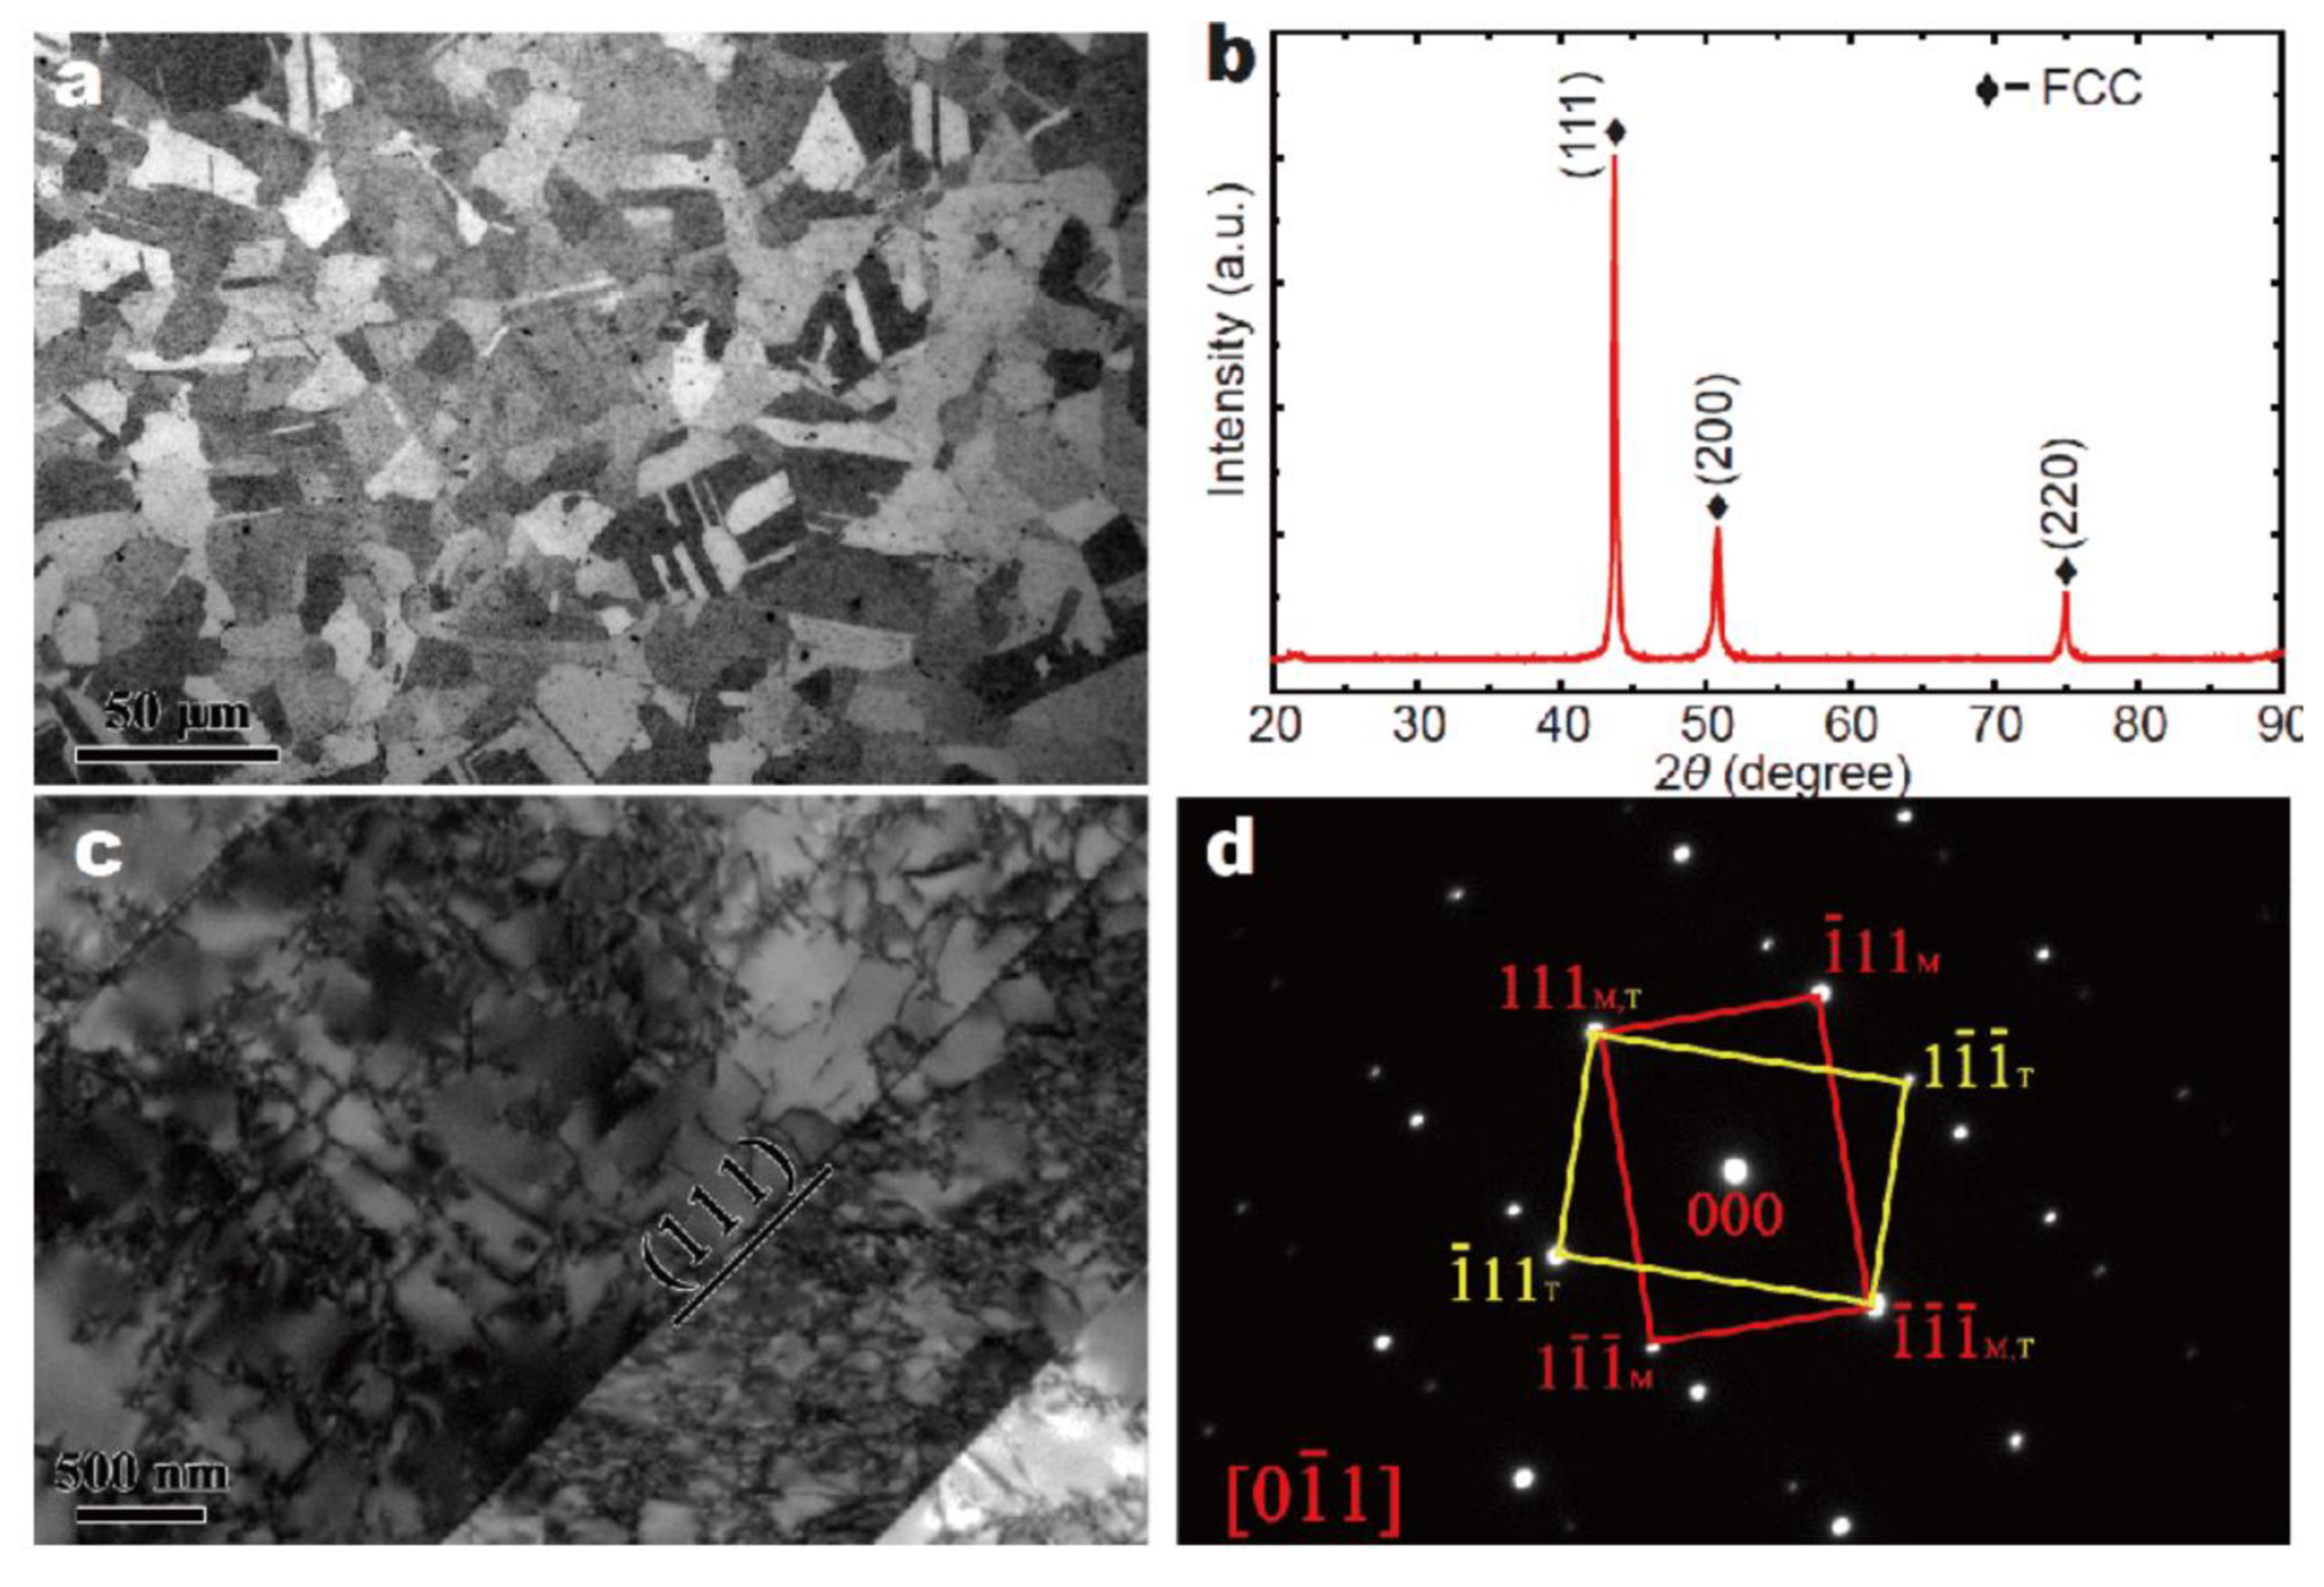
To gain a better understanding of the underlying deformation mechanisms, TEM characterization was performed on the samples after testing (see
Figure 22a–d).
Figure 22a,b displays the microstructures of the specimens that were tested at 200 and 298 K, respectively. As can be seen, the sample that was compressed at 200 K had a greater dislocation density, as compared to the sample that was tested at 298 K. The results of the Burgers-vector analysis revealed that at these temperatures, the plastic deformation in the HEA occurred mainly by the planar slip of ½ < 110> type dislocations on {111}-type planes. This result indicates that deformation at these temperatures occurs only by the dislocation glide. Importantly, this finding is consistent with what is observed in other FCC solid solutions [
286].
Figure 22c,d shows the TEM imaging results for the sample tested at 77 K. Here, the microstructure consisted of narrow deformation twins that had widths on the order of tens of nanometers. Furthermore, the TEM characterization indicated that nanoscale-deformation twins leading to the {111} <110> primary slip system were the primary deformation mechanisms responsible for the serrated flow during compression.
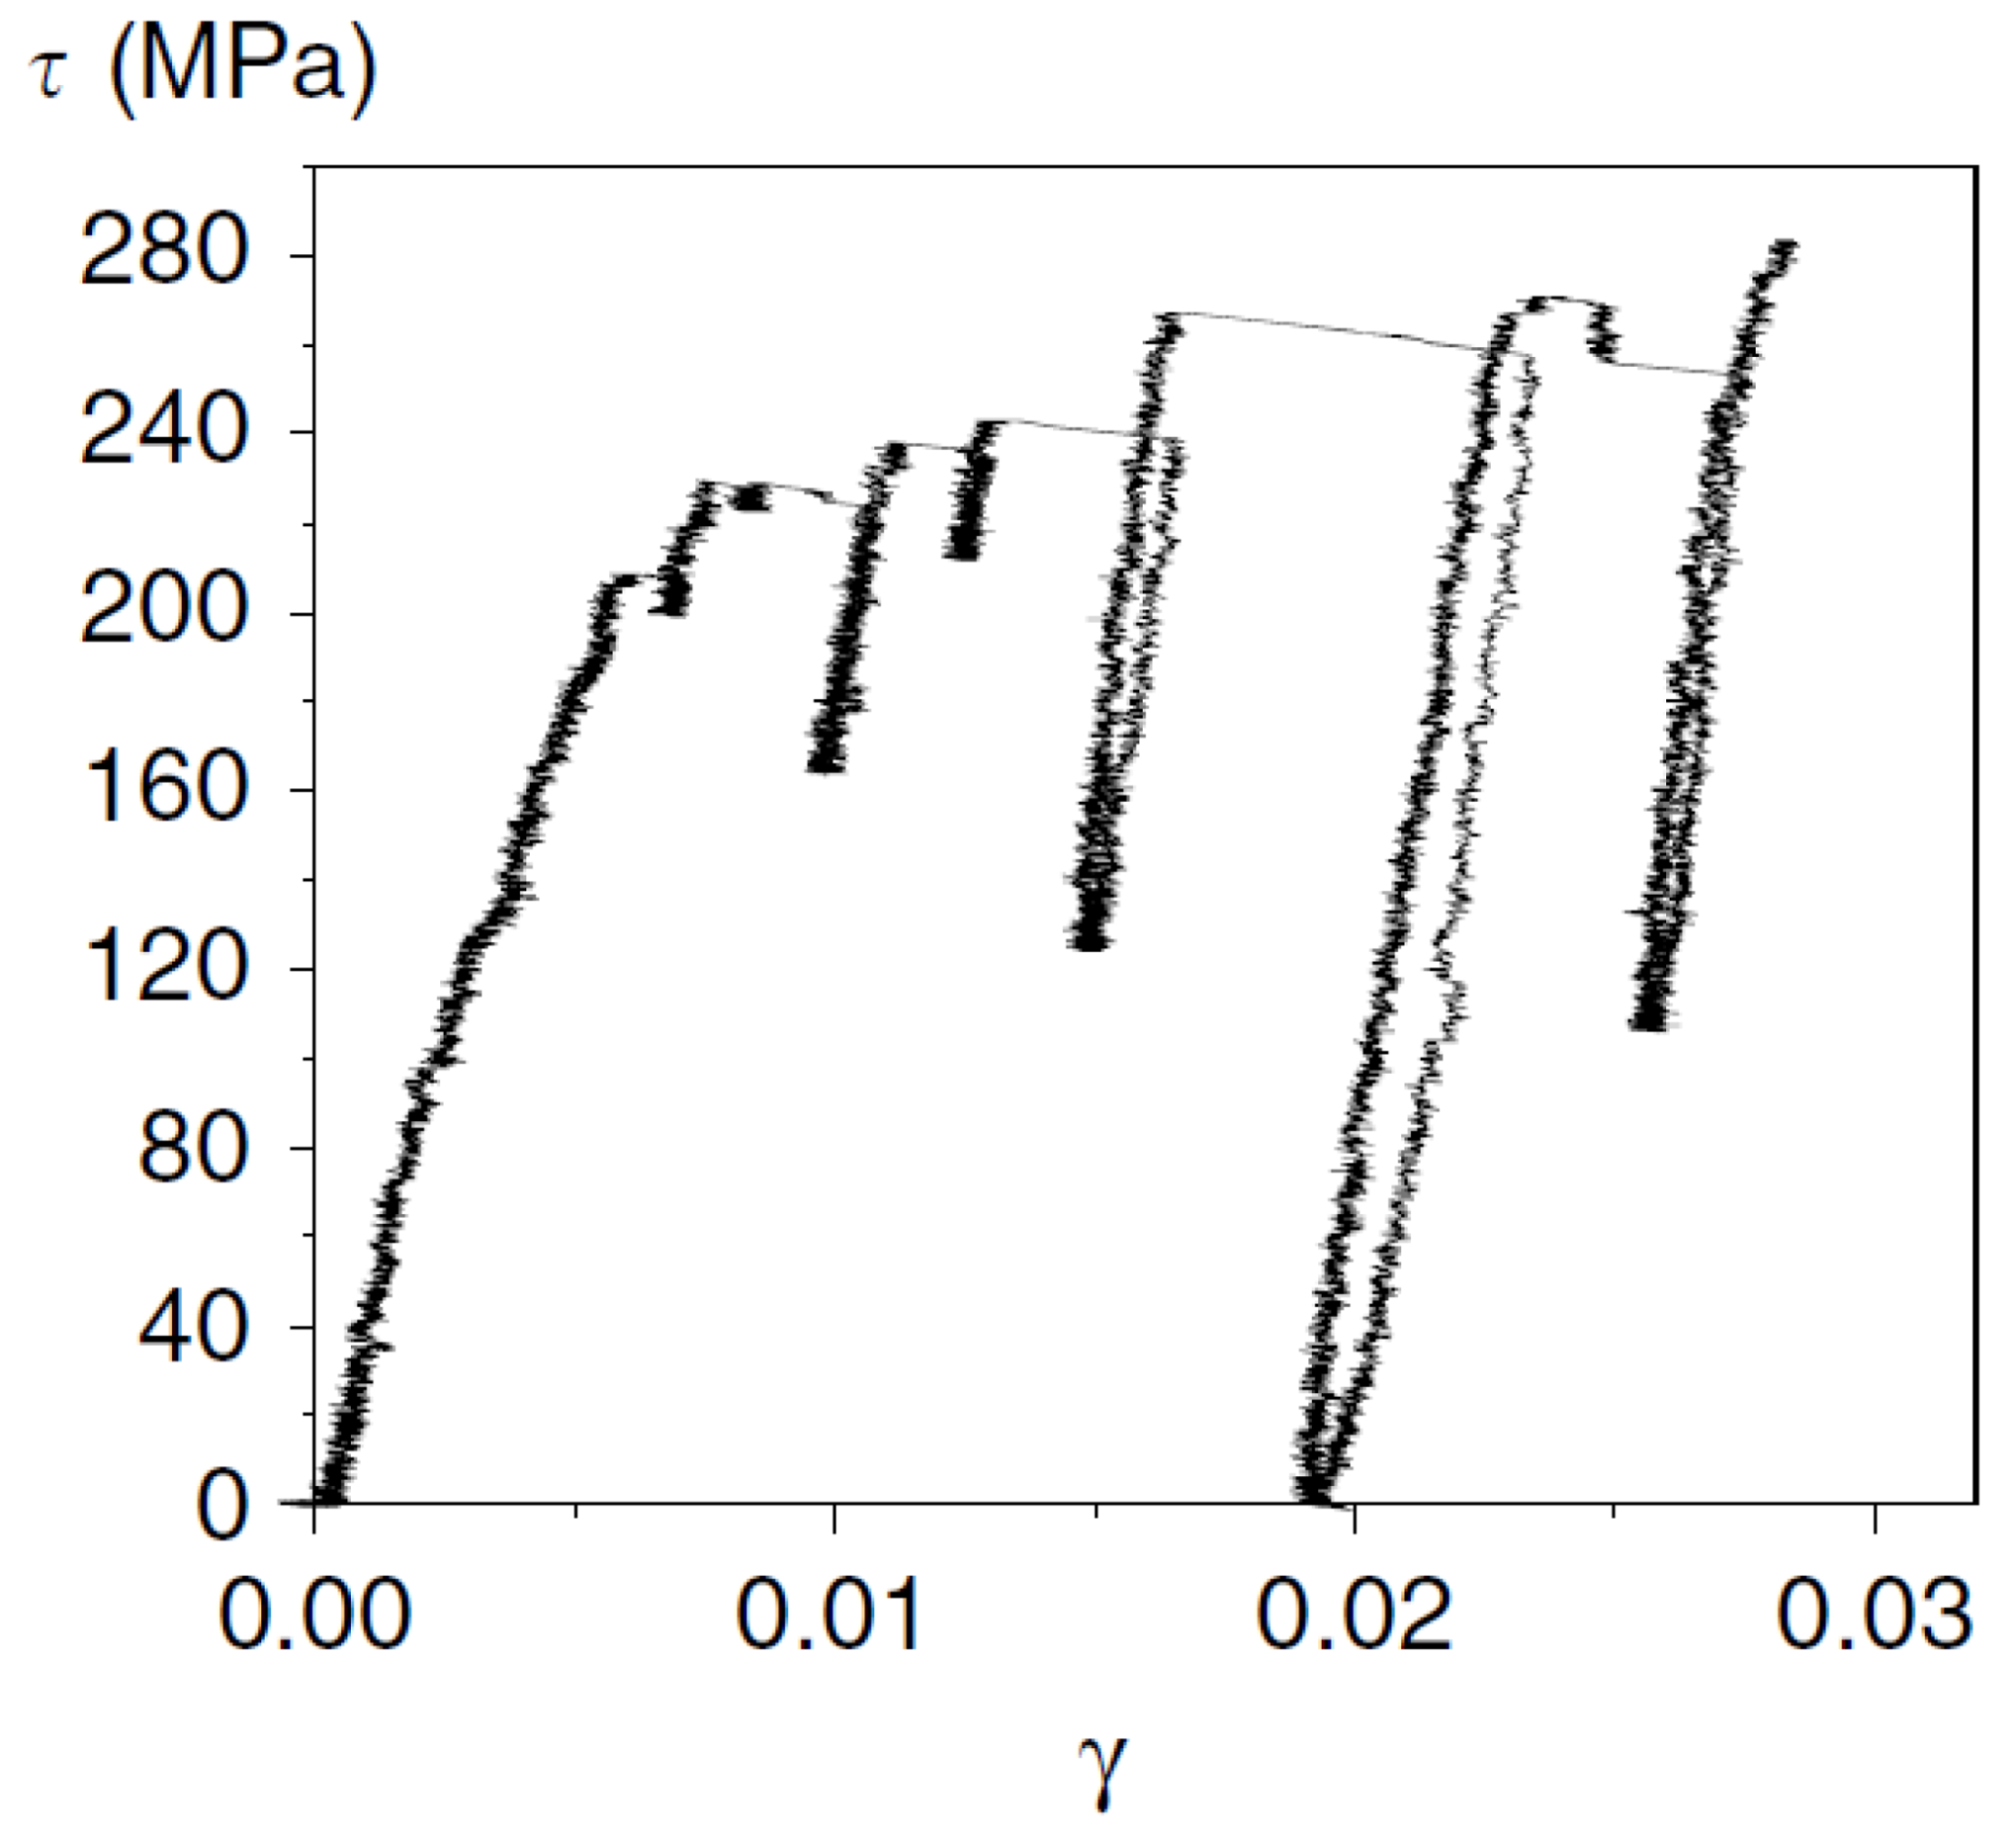
Hu et al. examined the serrations in the compressed nanopillars composed of the Al
0.1CoCrFeNi HEA [
160]. For the experiments, pillars with diameters of 500–700 nm underwent in situ compression tests, using direct electron imaging. The compression tests were performed by using a strain rate of ~1 × 10
−3 s
−1 in a Hysitron PI95 picoindenter equipped with a 2 μm flat punch diamond indenter in a JEOL 2010 LaB6 TEM (JEOL USA Inc., Boston, MA, USA) with an operating energy of 200 keV. The mechanical-deformation data were accumulated, using a data-acquisition rate of 500 Hz.
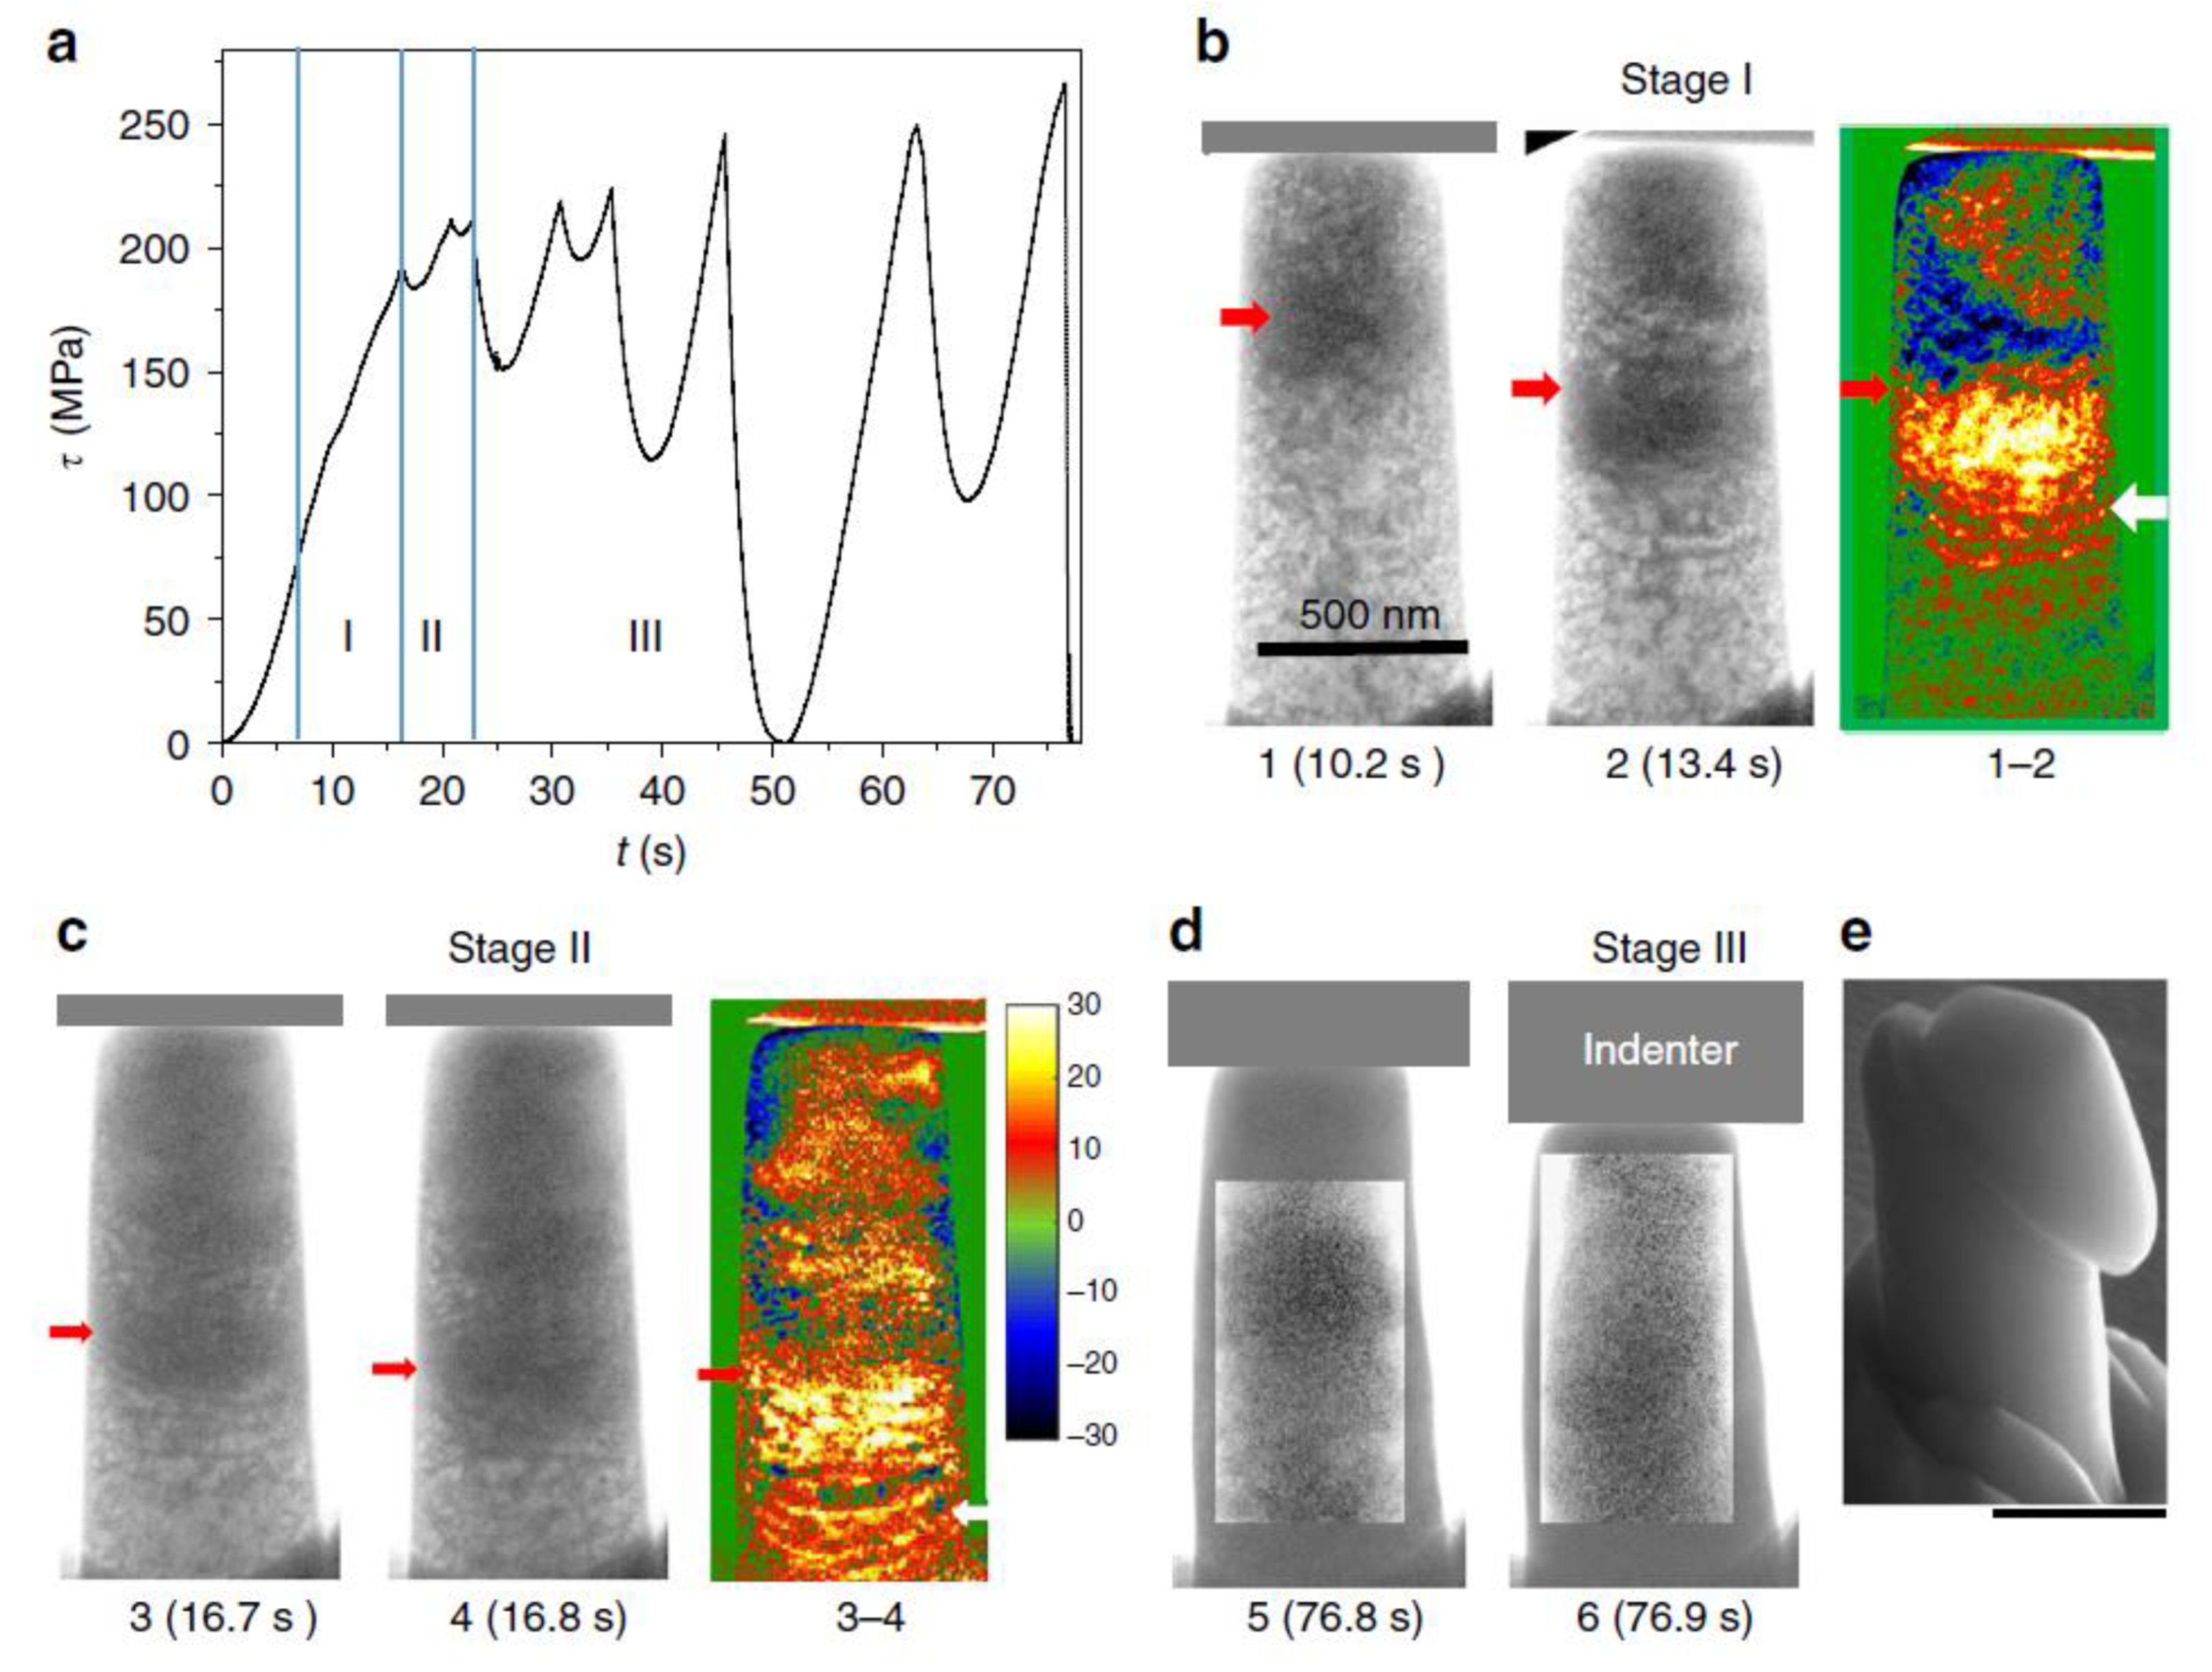
Figure 23 presents the stress vs. strain data for the in situ TEM compression test. As can be observed, there were multiple slip events that occurred during the experiment. Furthermore, the authors divided the deformation process into three stages that consisted of (1) little or no stress drops, (2) medium-sized stress-drops, and (3) relatively larger stress-drops. A comparison of the stress-time data and the three corresponding stages of the stress-drop behavior, as observed by the TEM and SEM, can be seen in
Figure 24a–e. With respect to stage I, the stress drops corresponded to the wave-like propagation of dislocations from the top of the pillar to the bottom. As for Stage-II stress drops, they were attributed to small dislocation avalanches. Finally, stage III stress drops corresponded to dislocation avalanches that led to large crystal slips.
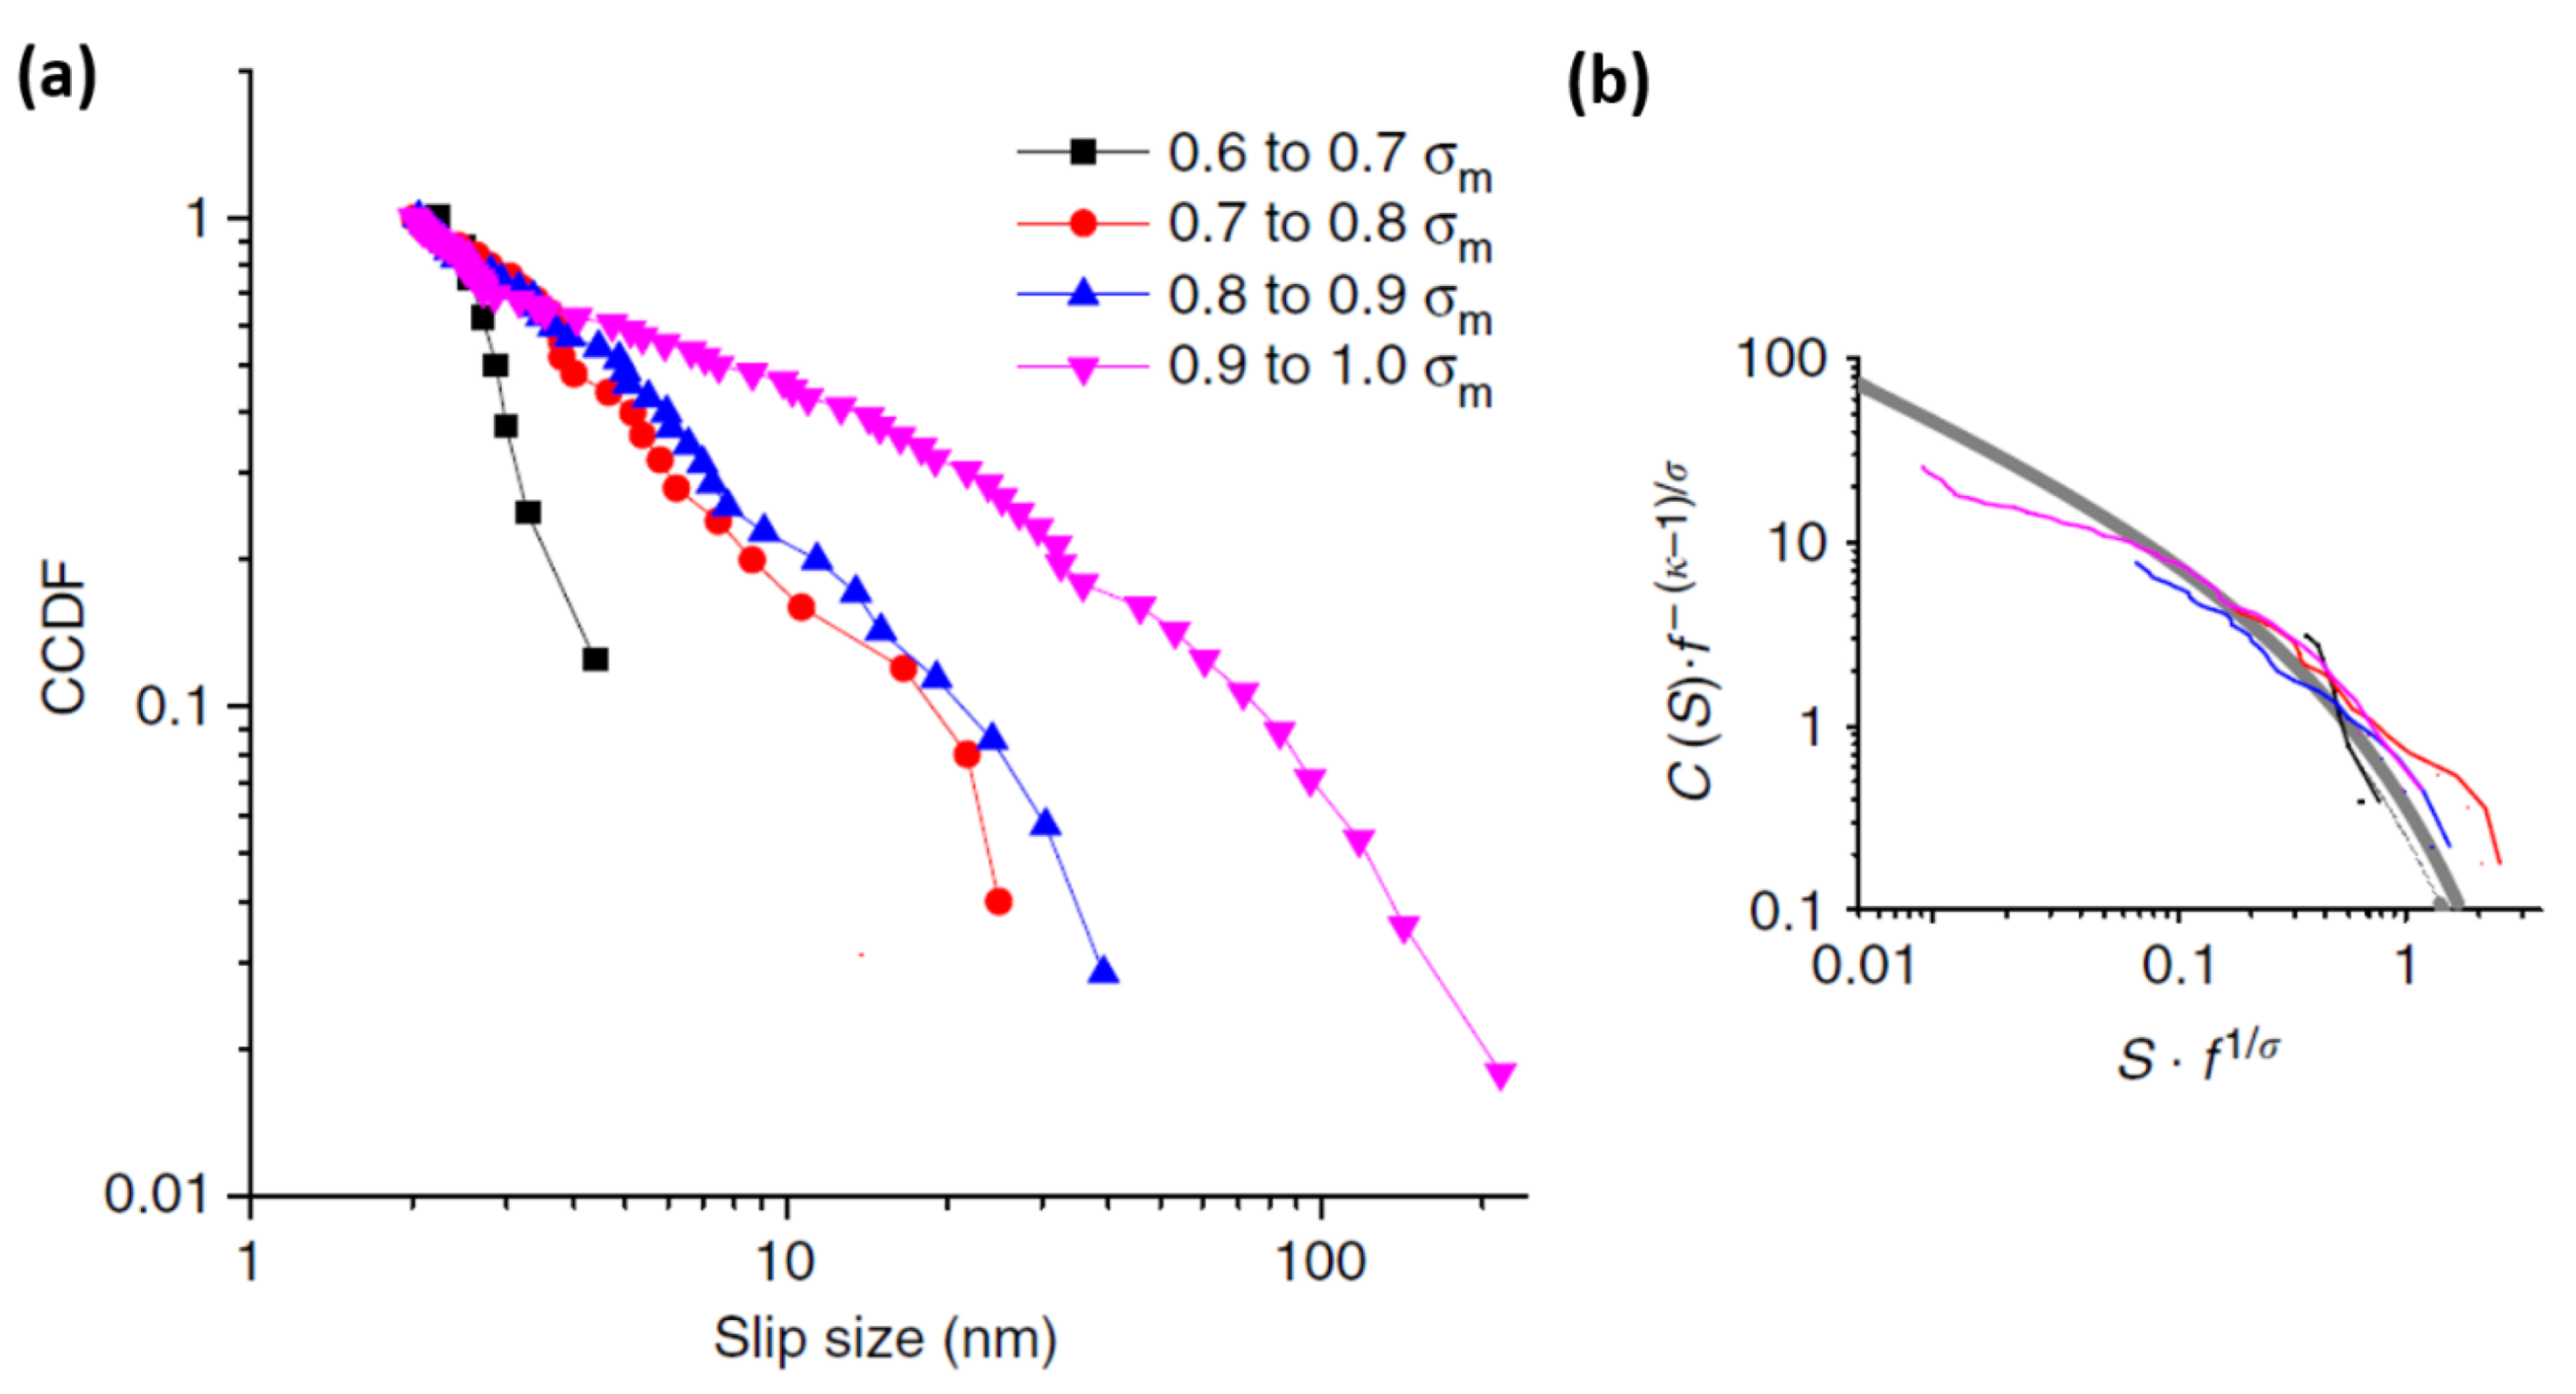
The CCDF analysis was performed on the serration behavior, and the results can be seen in
Figure 25a,b. The data were modeled according to Equations (15) and (16), for which
D(
S,
q) =
S−(κ − 1)g[
S(
σ −
σc)
1/β], where
κ and
β are critical exponents,
σ is the applied stress,
σc is the failure stress, and
g is a universal scaling function defined as
[
222] with
A = 1.2. These data were for samples with diameters ranging from ~512 to 655 nm. For
Figure 25a, the CCDF, as a function of the stress level over the maximum stress, was plotted with respect to the slip size.
Figure 25b displays the rescaled CCDFs in which the curves have collapsed onto one another. The critical exponents, κ and
β, were determined by tuning them until the curves collapsed, and were found to be consistent with the predicted MFT values of 1.5 and 0.5, respectively [
222].
The results of the analysis led to the following important conclusions. Firstly, the distribution used in their analysis is predicted by a simple, coarse-grained model [
222,
256]. Secondly, the avalanche mechanism responsible for the observed serration behavior in the samples is based not only on the interactions between the dislocation bands and the dislocation pileups, but also the pileup and the dislocation pinning centers, as well. Thirdly, the applied stress is a critical tuning parameter due to the dependence of the slip avalanche on the stress level. Finally, the deformation behavior exhibited by the Al
0.1CoCrFeNi HEA is characteristic of the tuned critical behavior rather than the self-organized criticality, indicating that the corresponding avalanche distribution is universal in nature.
3.3. Al0.3CoCrFeNi HEA
The effect of Al on the serrated flow has also been observed in an investigation involving the Al
0.3CoCrFeNi HEA [
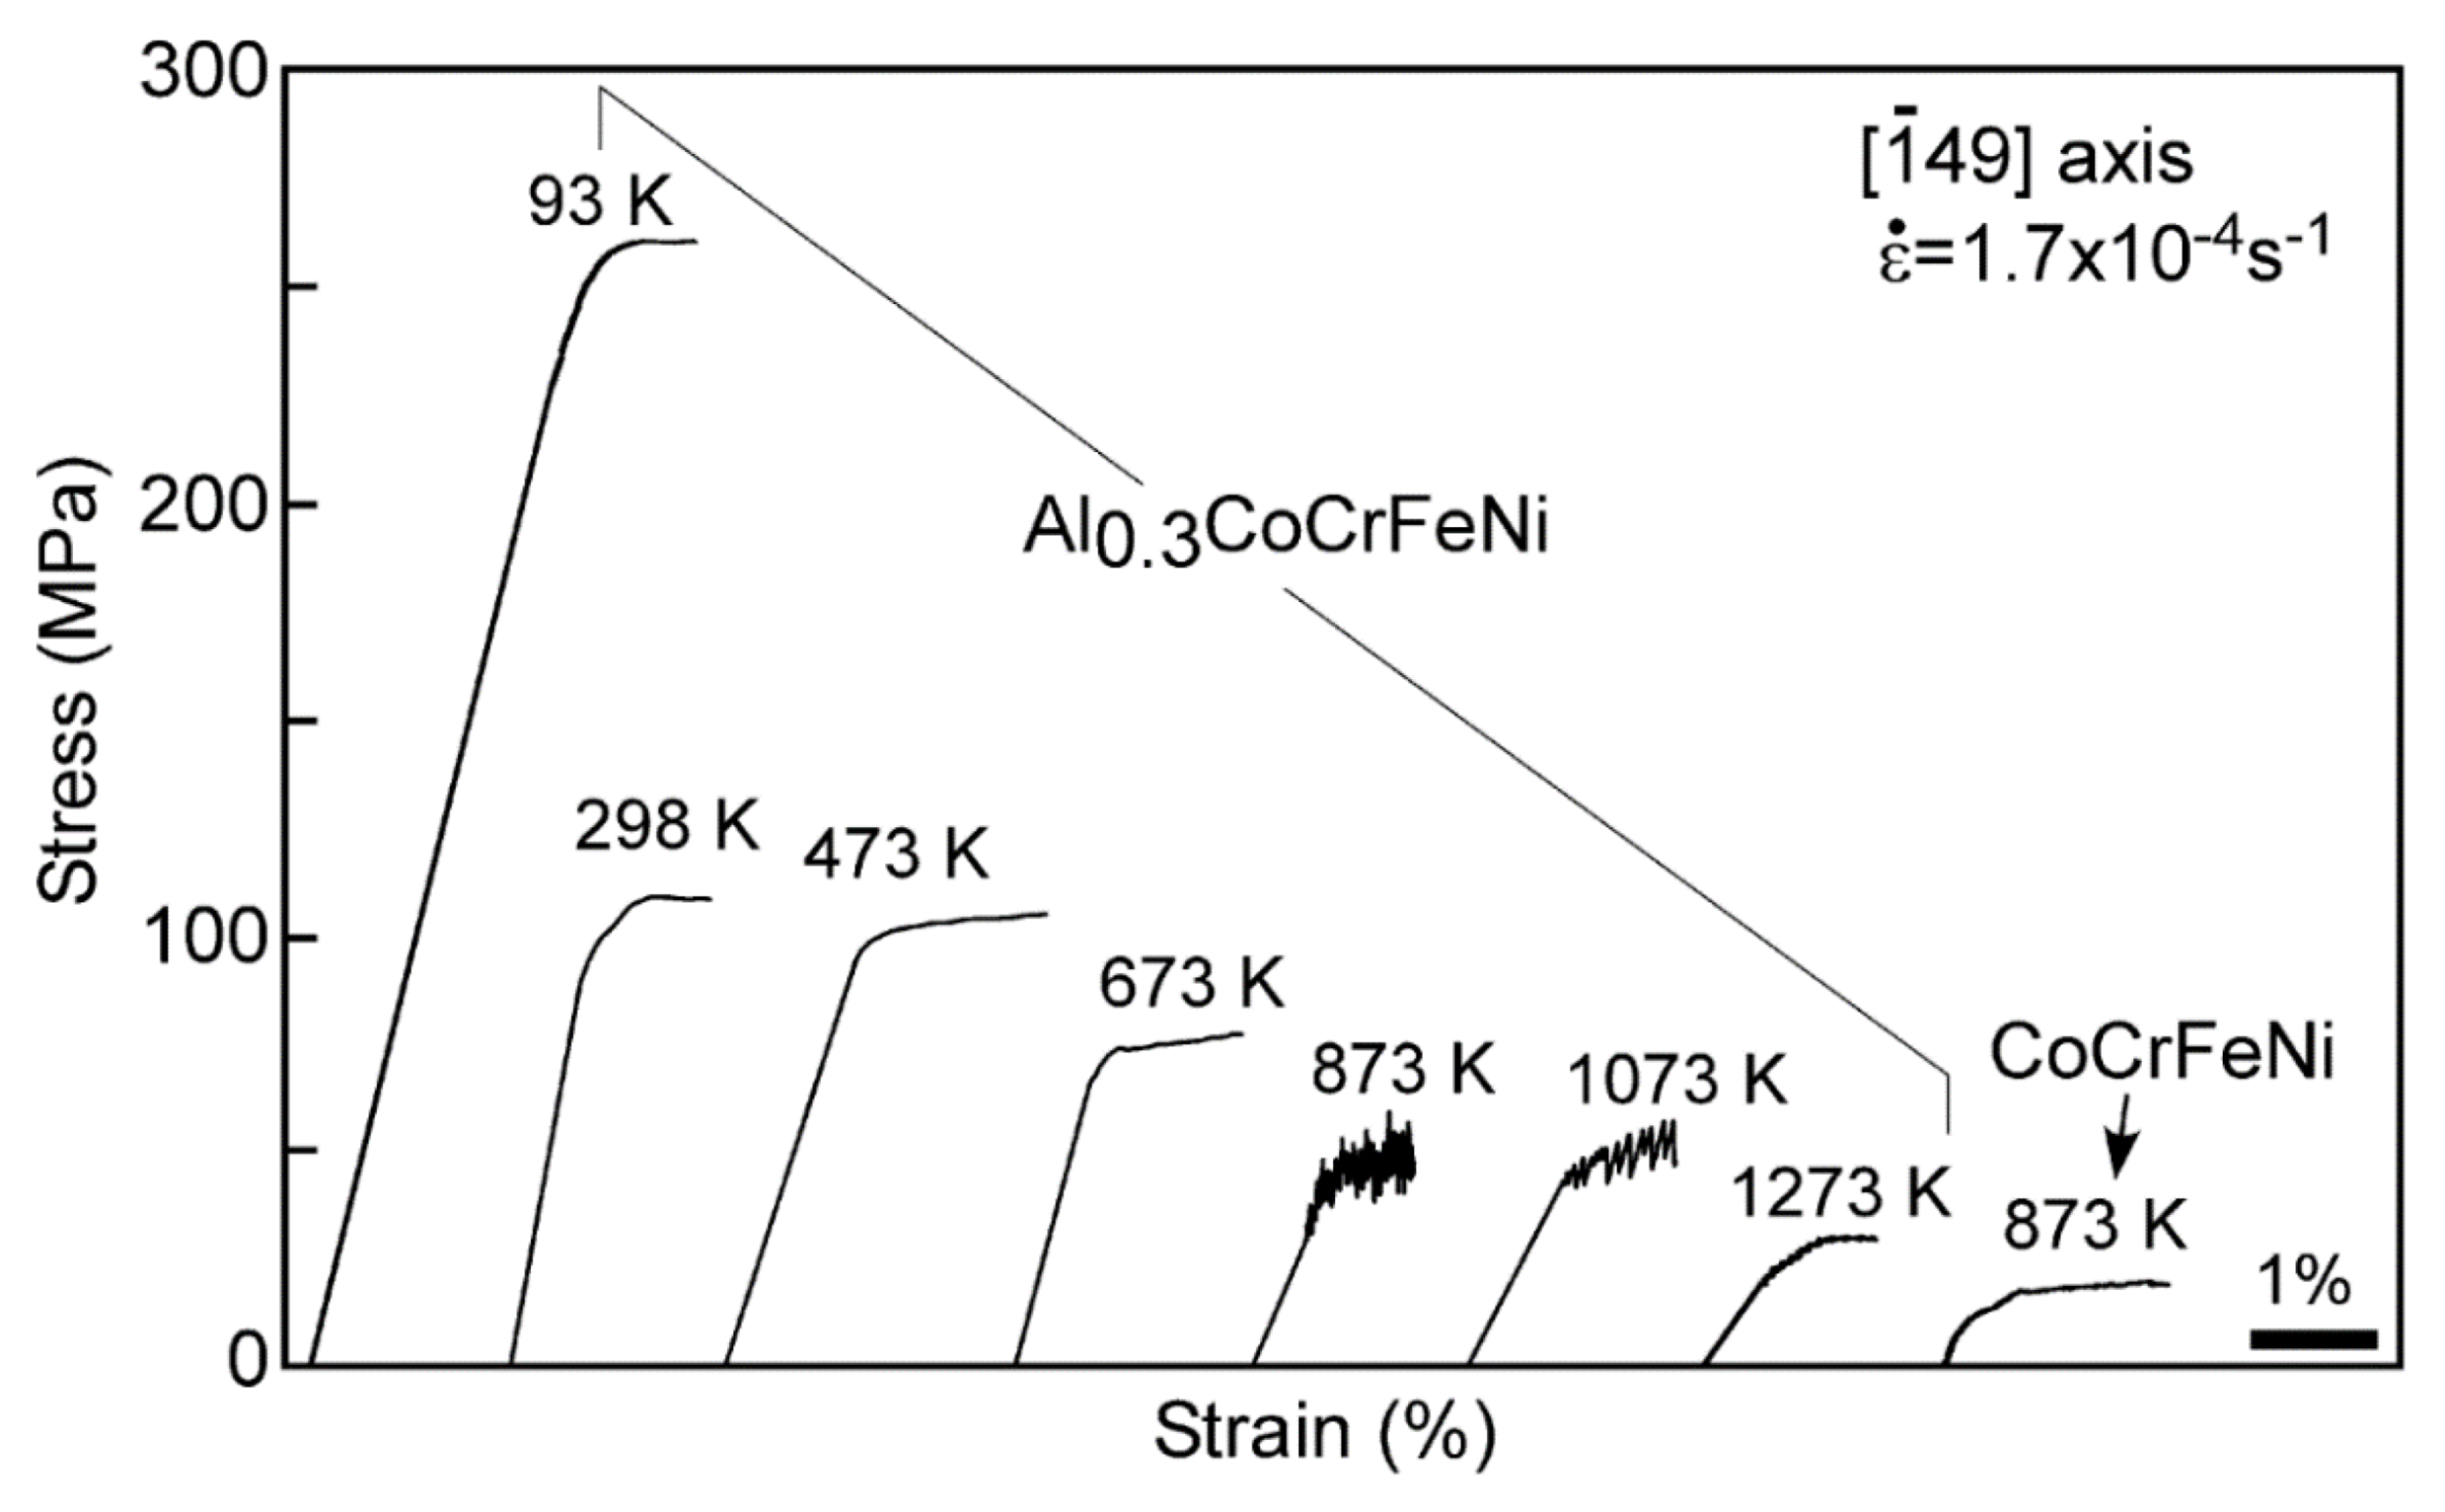
191]. Here, Yasuda et al. examined the deformation behavior of the single-crystal CoCrFeNi and Al
0.3CoCrFeNi HEAs during compression. For their experiment, they compressed samples at a strain rate of 1.7 × 10
−4 s
−1 for temperatures ranging from −180 to 1000 °C (93–1273 K).
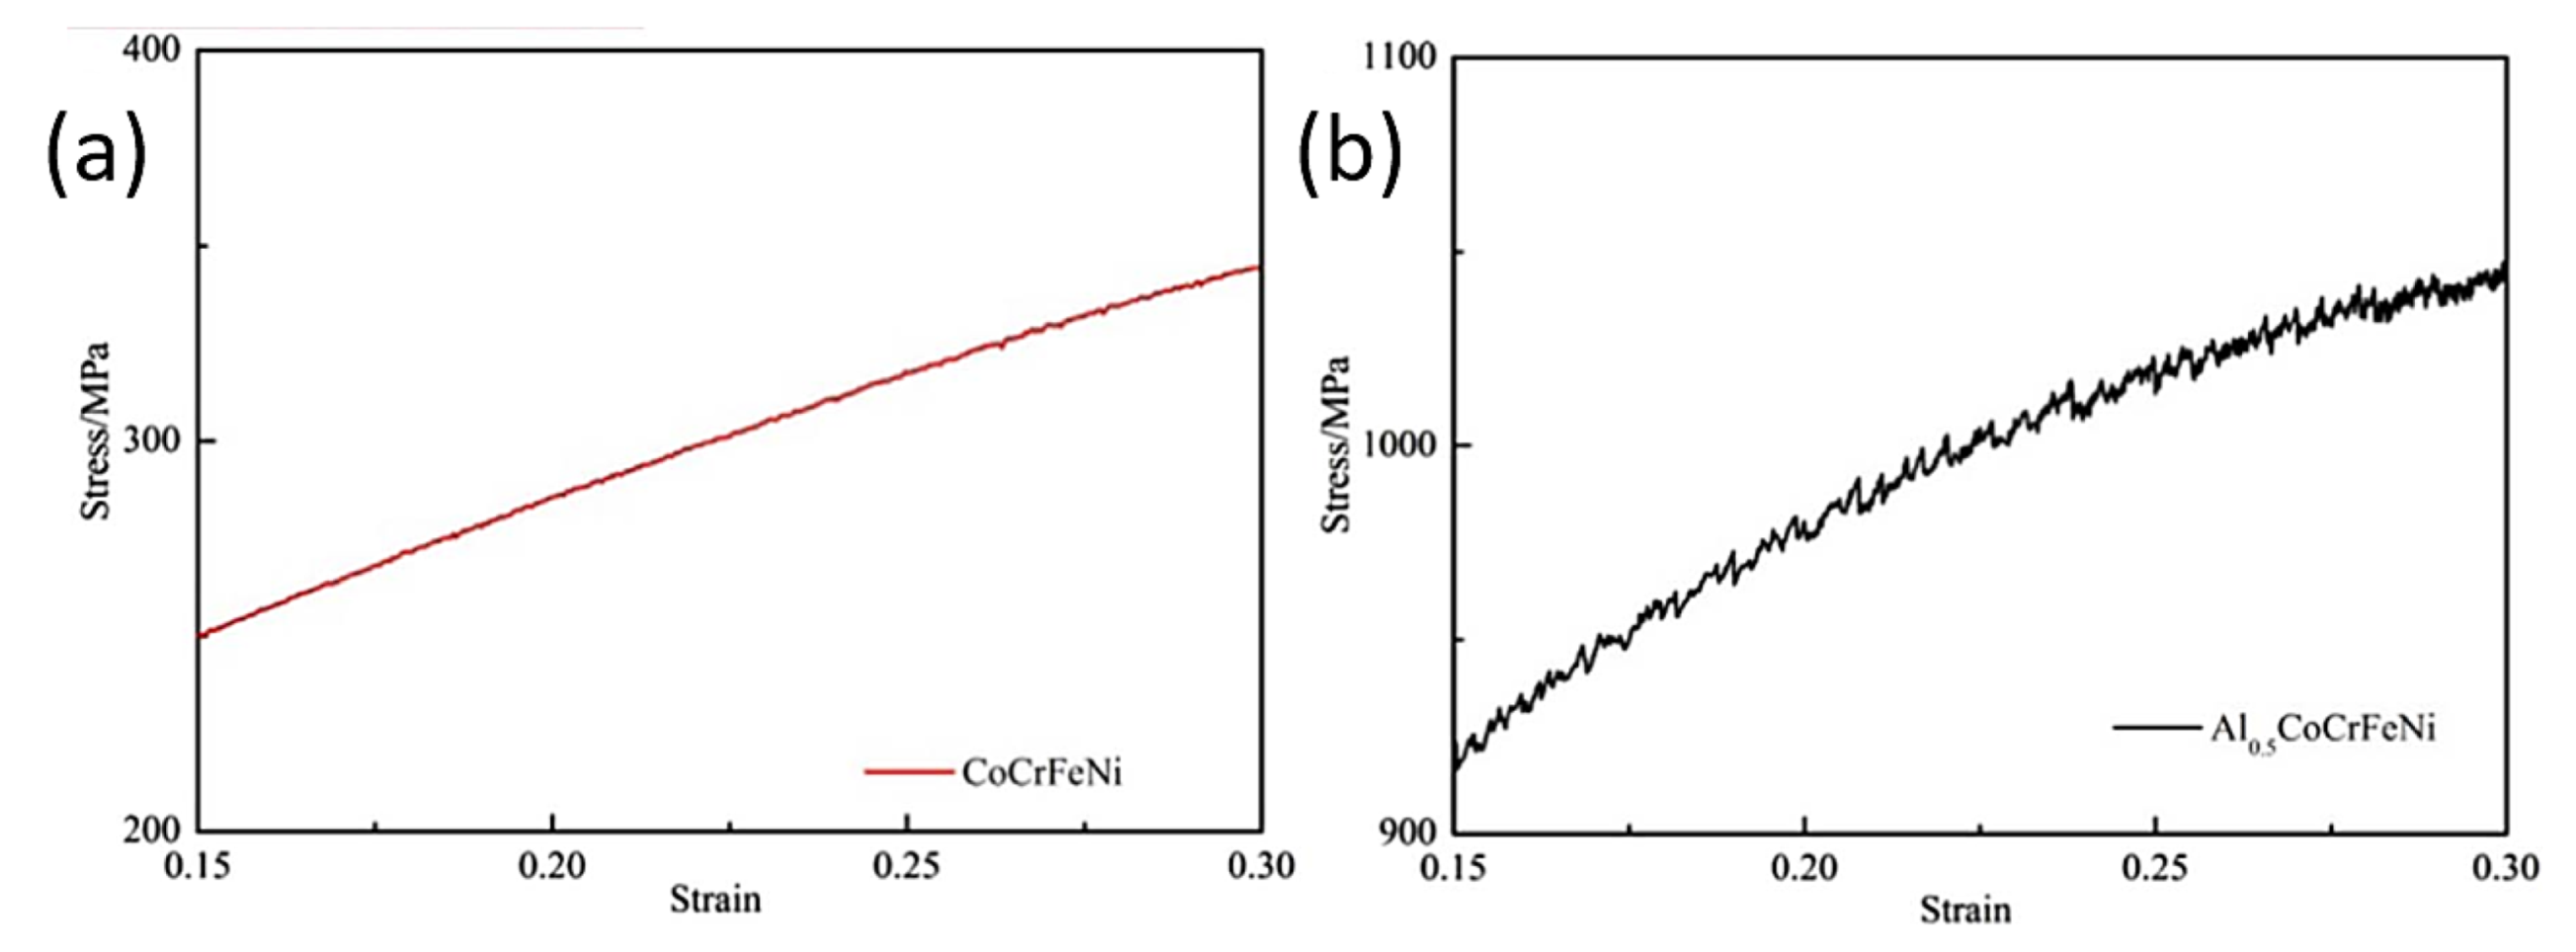
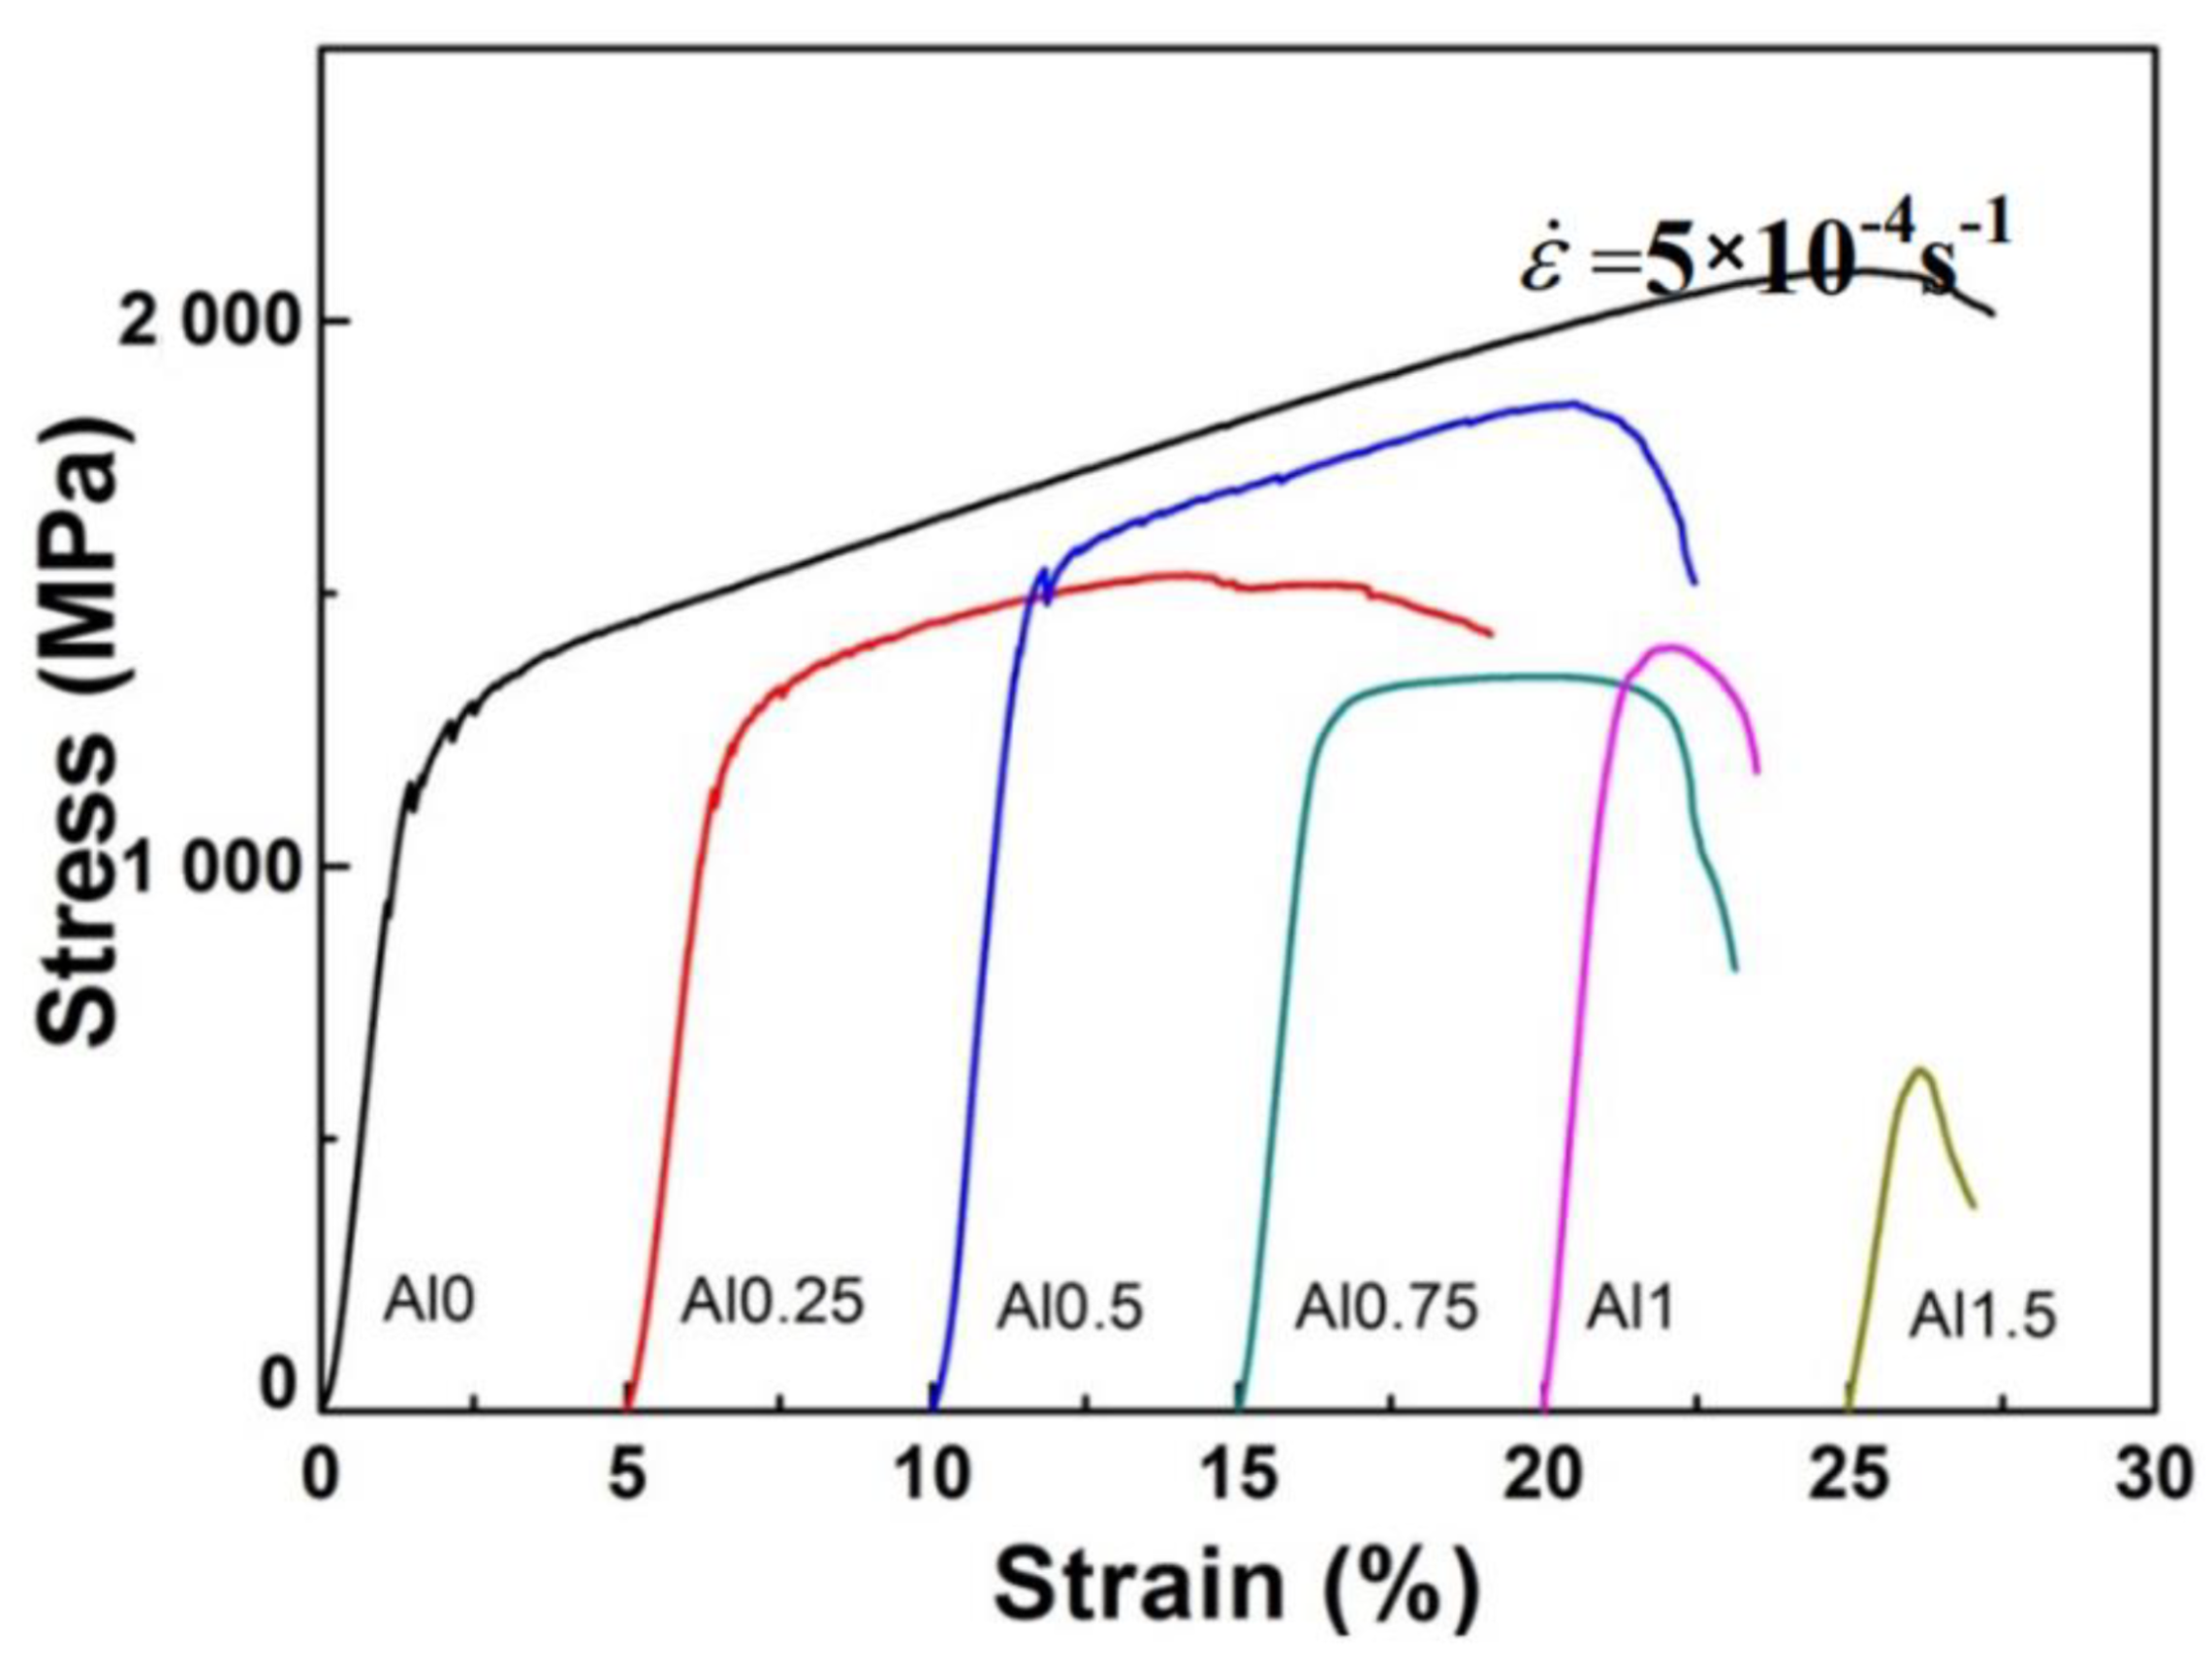
Figure 26 displays the results, and, as can be observed, the Al
0.3CoCrFeNi HEA exhibited the serrated flow, while the other specimen did not when tested at 600 °C. The serrated flow that was observed in the DSA regime was thought to be related to Al-containing solute atmospheres that were created near a moving dislocation core, thus leading to an increase of the frictional stress on the dislocations. Similar to the findings reported by Niu et al. [
94], this result indicates that Al atoms play an important role in the serrated-flow behavior that occurs in the HEA during DSA. This finding also suggests that not every atom can act as a solute that participates in dislocation locking that results in the serrated flow.
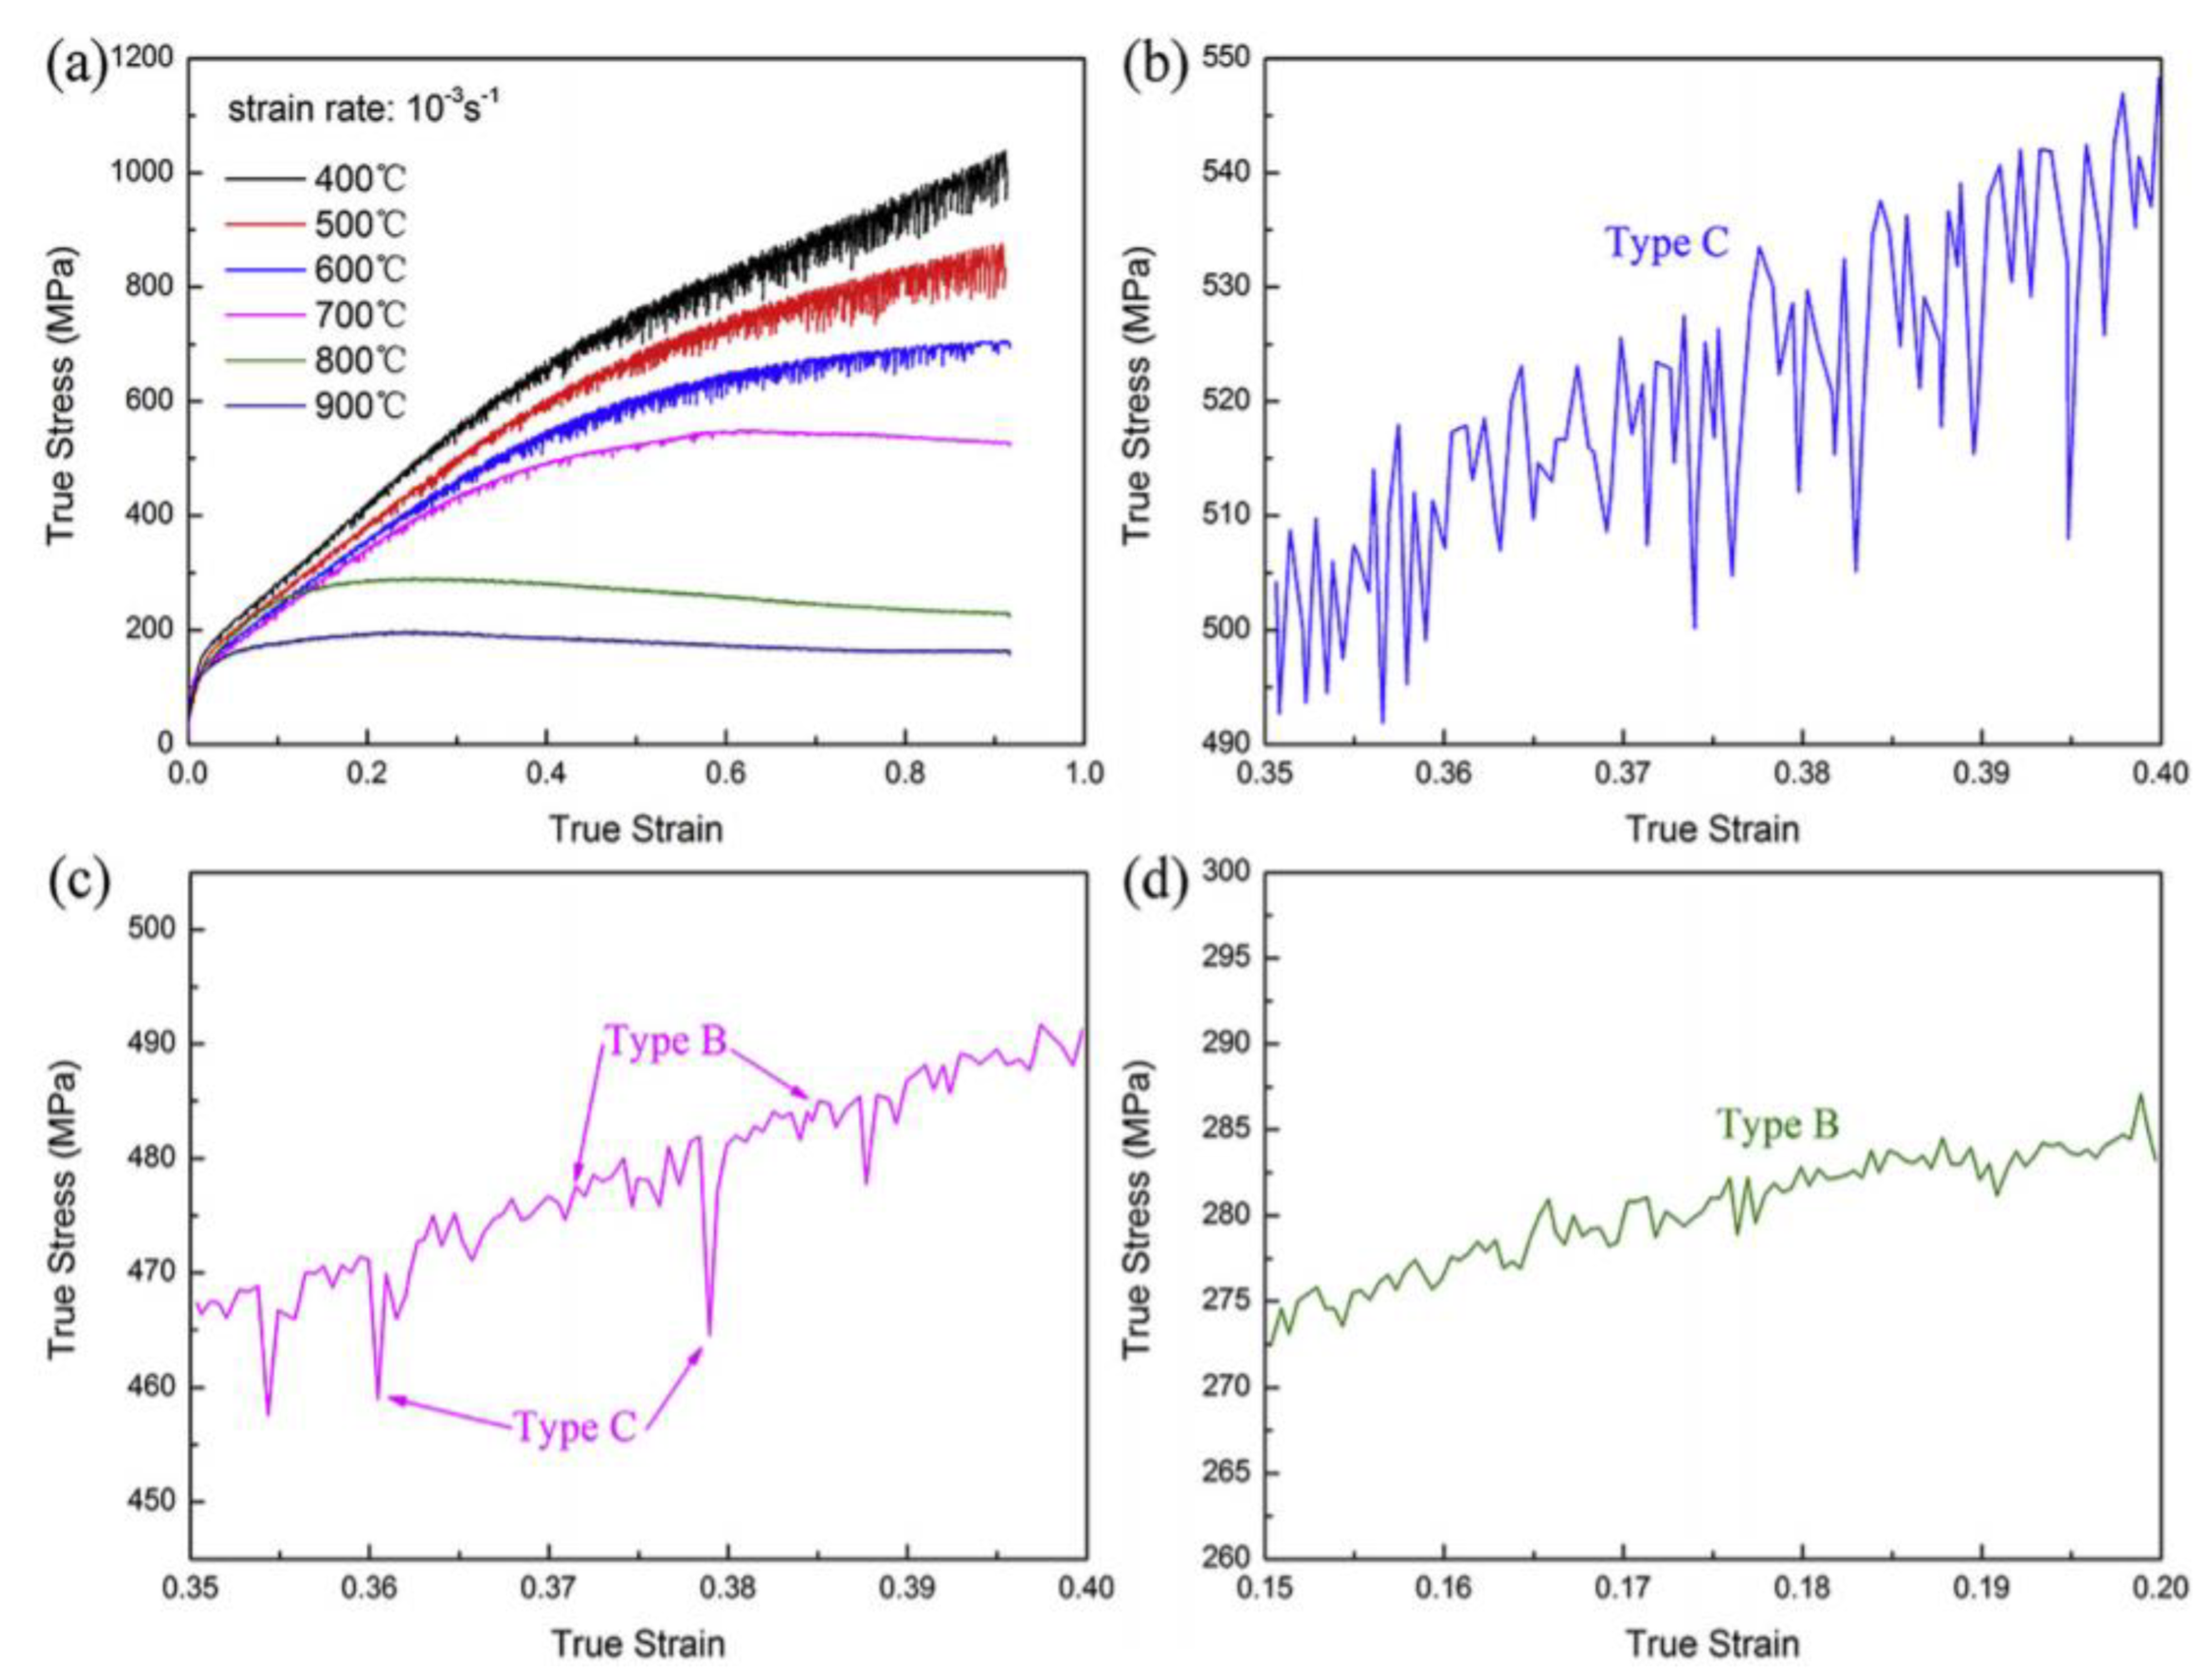
Zhang et al. also examined the compression behavior of the Al
0.3CoCrFeNi HEA [
169]. The compression tests were performed on a Gleeble 3500 thermo-mechanical simulator (Dynamic Systems Inc., Poestenkill, NY, USA) at temperatures ranging from 400 to 900 °C at a strain rate of 10
−3 s
−1.
Figure 27a–d shows the true stress vs. true strain behavior for the samples tested at the above conditions. Serrations were observed in all of the deformation curves, and it was determined that the serration type was dependent on the test temperature. A summary of the serration type for each of the experimental conditions is displayed in
Table 3. As can be seen in the table, Type-C serrations were observed at 400, 500, and 600 °C. At 700 °C, the serrated flow exhibited Type-B + Type-C serrations, whereas only Type-B serrations could be observed in the deformation curve at 800–900 °C. The authors reported that the number of relatively larger stress drops decreases with respect to the test temperature. Furthermore, it was also found that Type-A serrations were not observed in any of the deformation curves. These results appear to contradict those of other studies [
8] where serrations have been observed to evolve from Type-A to Type-B, and then to Type-C with increasing temperature. Importantly, it was hypothesized that Type-C serrations were related to the nucleation and growth of twins, while Type-B serrations corresponded to the pinning (by mobile solute atoms) and unpinning of moving dislocations that is inherent in the DSA model [
94,
191].
Qiang et al. investigated the nanoindentation-serration behavior of as-cast and torsionally deformed (nano-grained) Al
0.3CrCoFeNi HEA samples [
287]. Room-temperature nanoindentations were performed by using a Hysitron Triboindenter TI950 (Bruker Corp., Santa Barbara, CA, USA) equipped with a Berkovich indenter. For the deformed samples, they underwent a compressive pressure of 10 GPa (RT) for 1, 3, and 10 rotations at one revolution per minute. For the nanoindentations, 15 indents were performed in which a loading rate of 250 µN/s was used. The samples were also examined, using different methods, such as XRD and Vickers-hardness tests. The XRD characterization revealed that all the samples contained a single-phase FCC structure. Vickers-hardness tests revealed that torsion led to a significant hardening of the alloy. The results also showed that the grain size was reduced from hundreds of microns in the as-cast state to tens of nanometers after 10 revolutions. It was also found that nanotwins and SFs were observed in the nanograins, despite the reported high SF energy.
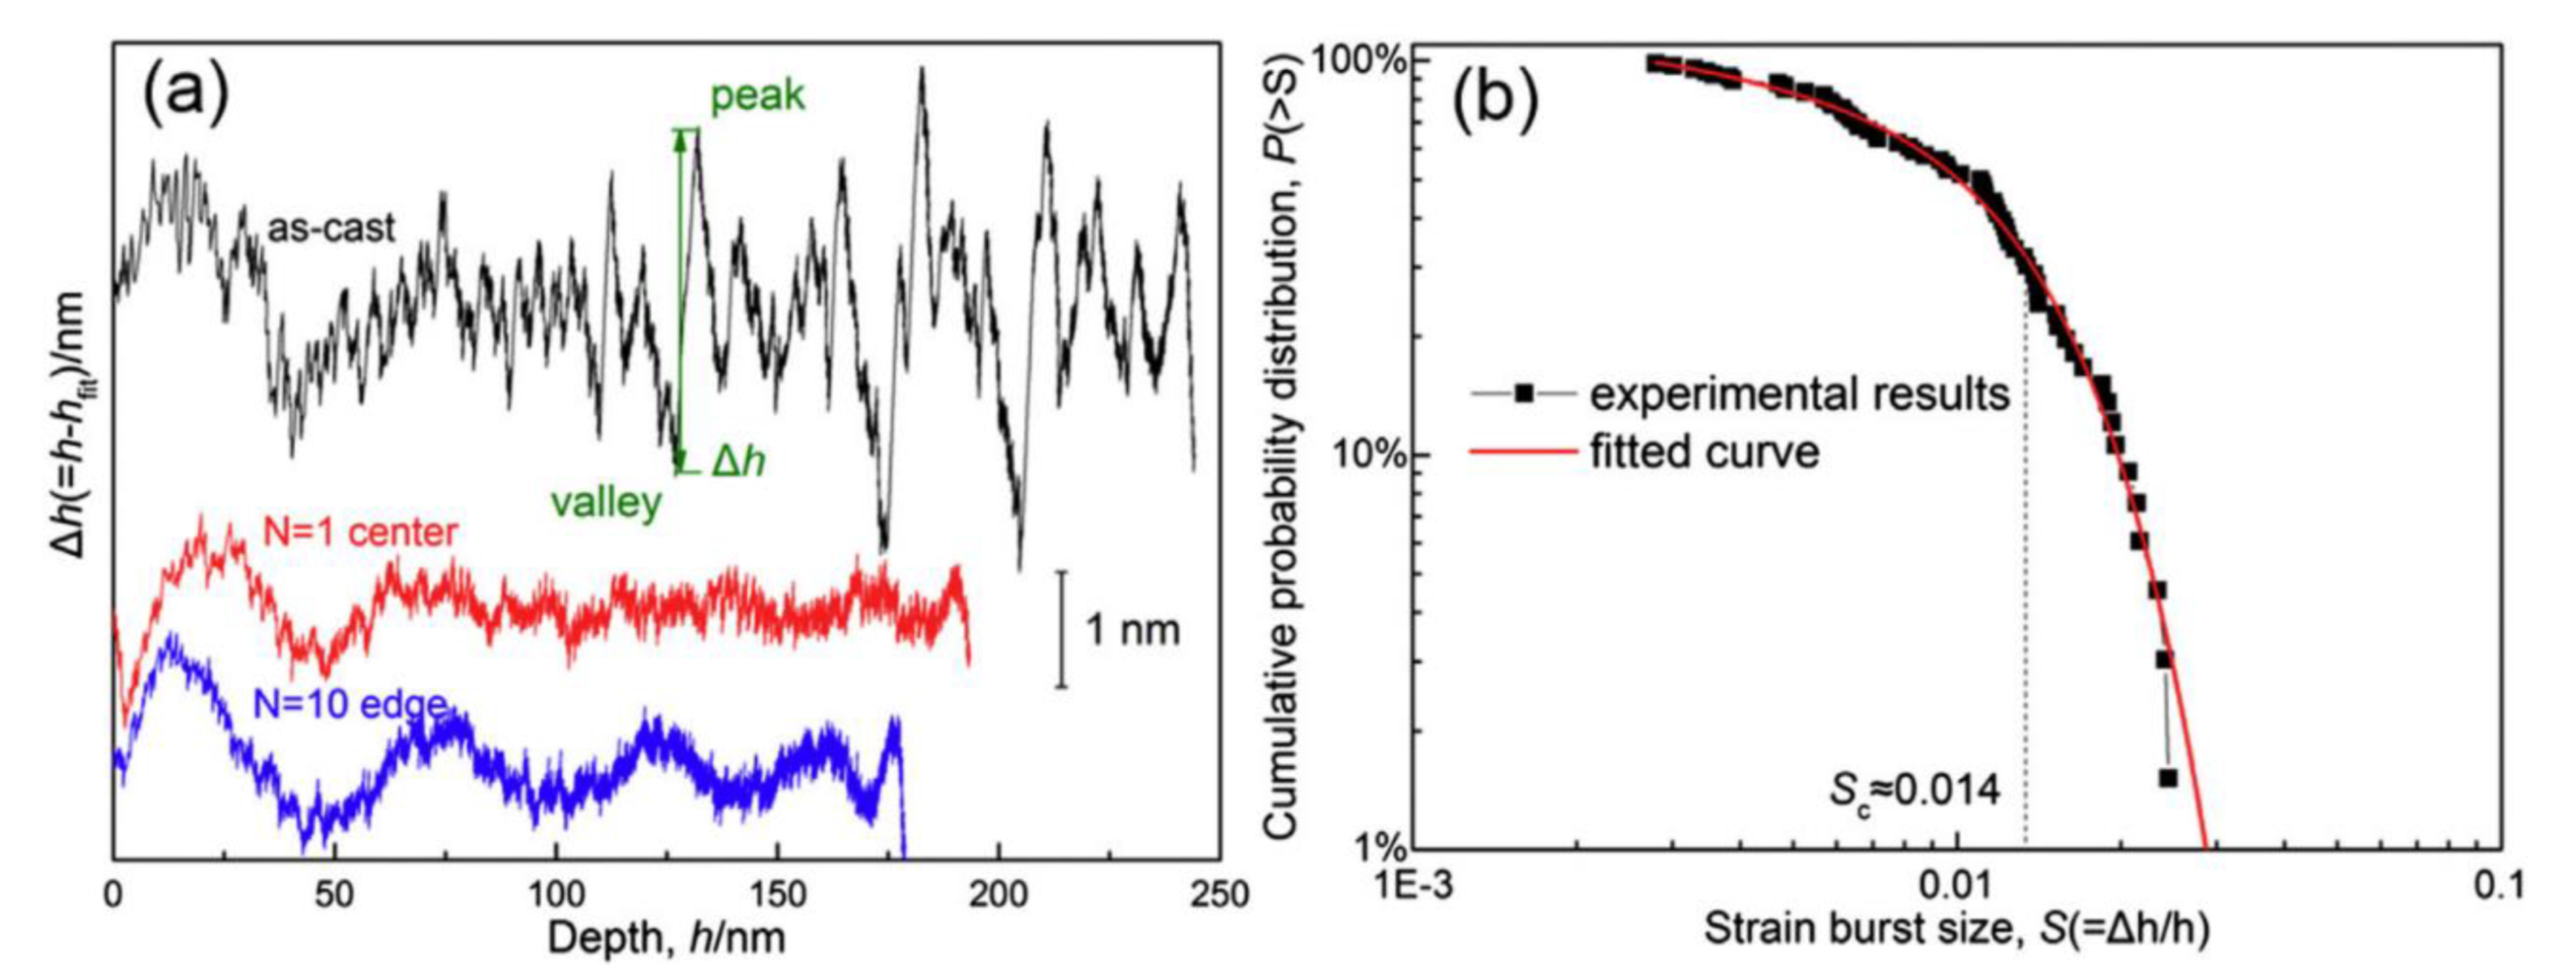
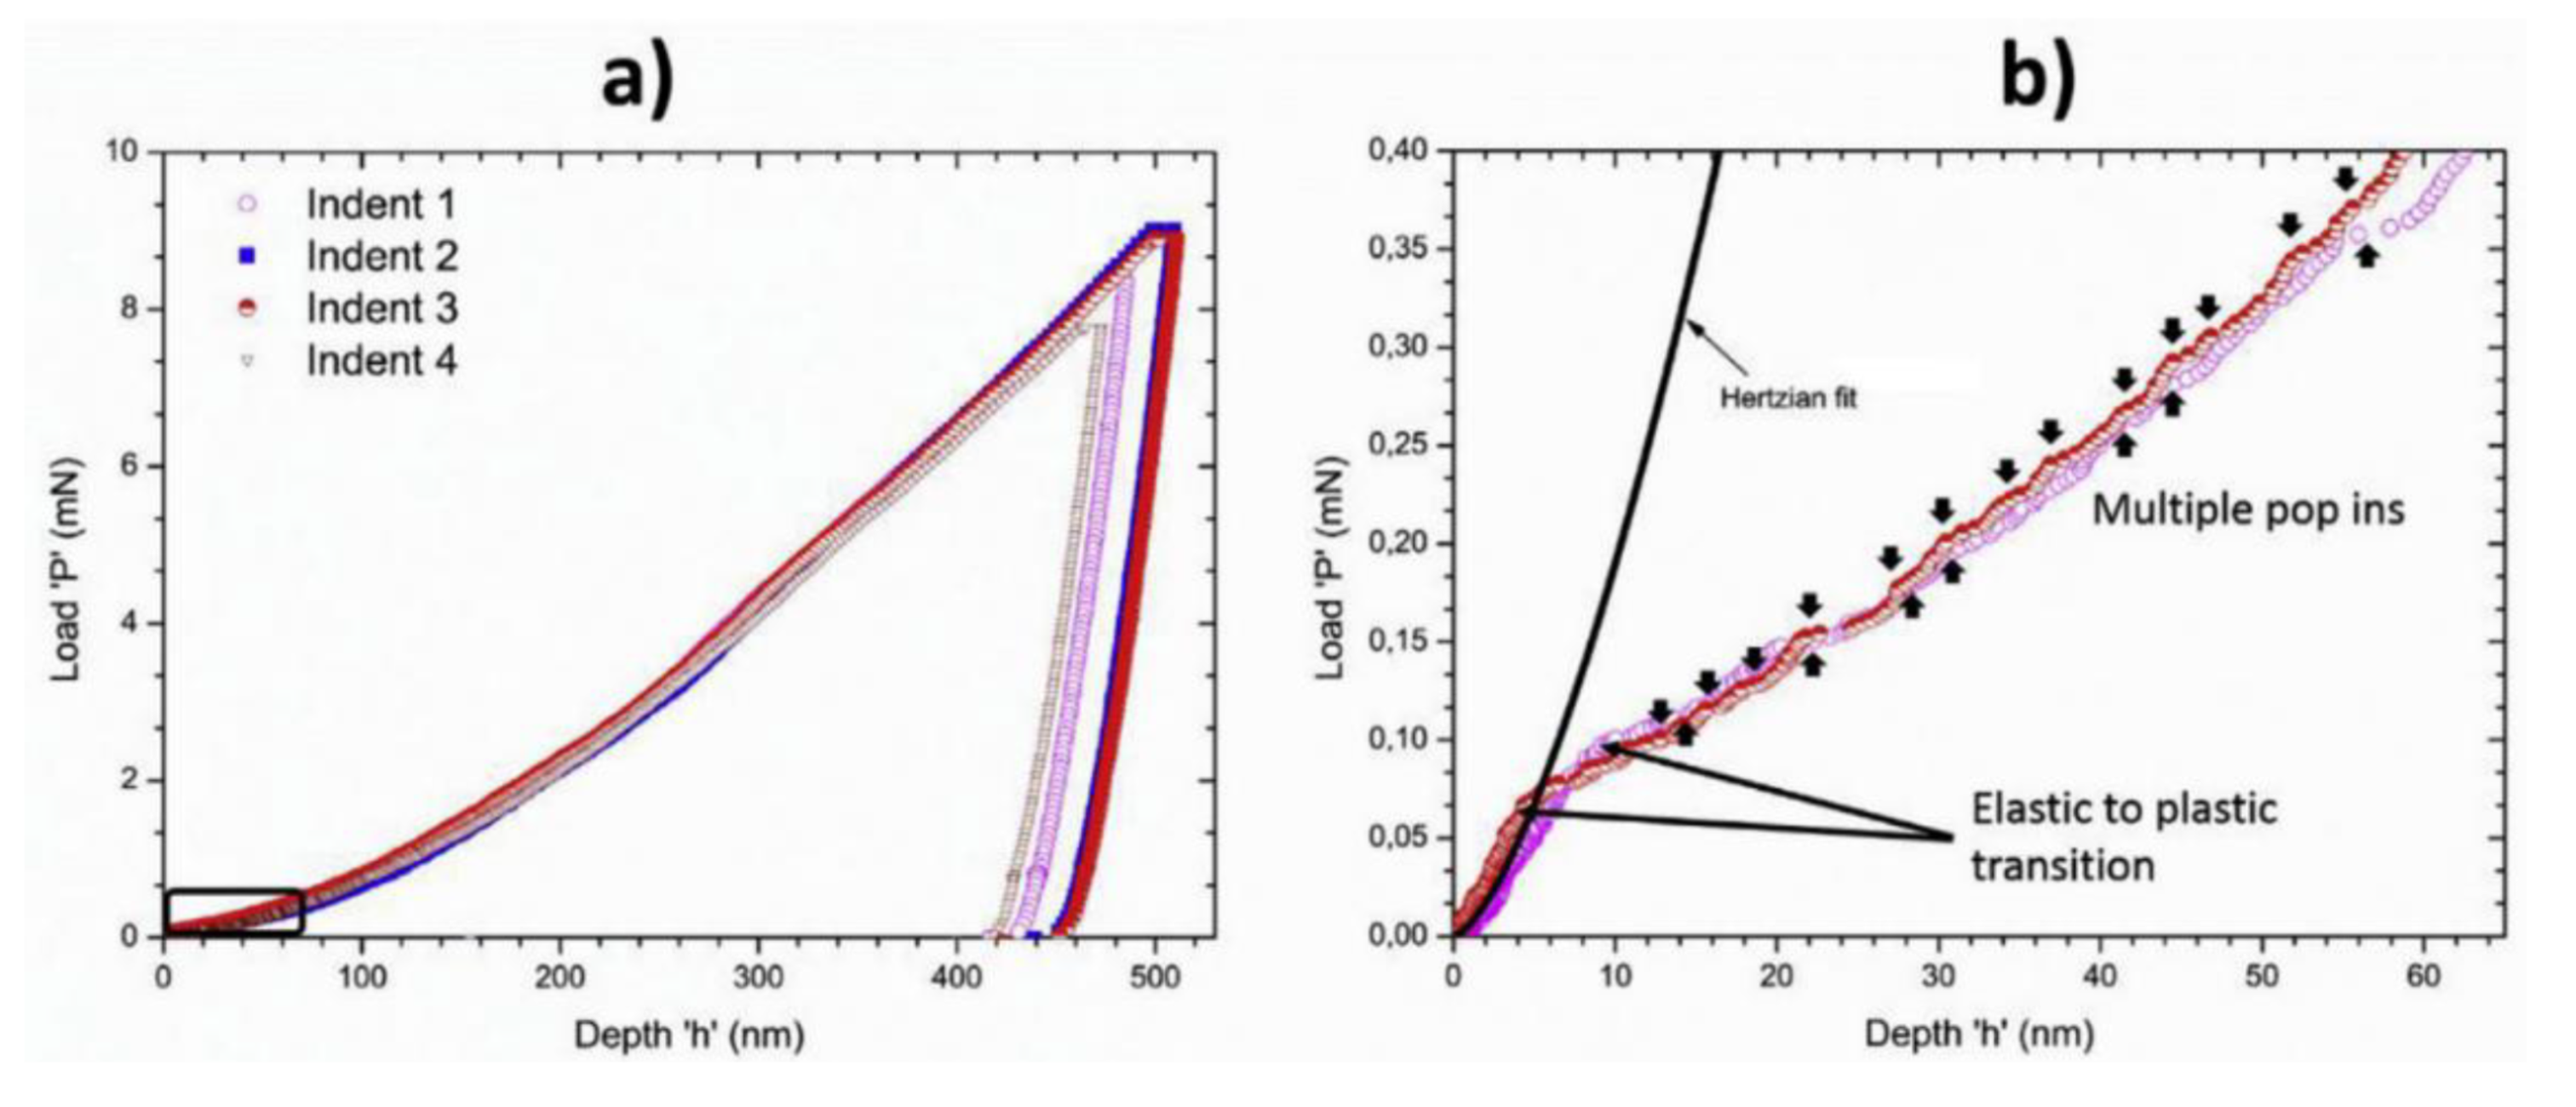
In terms of mechanical behavior, it was surmised that, in the deformed nanograined HEA, the emission of Shockley partial dislocations at the grain boundaries and/or grain-boundary sliding may be the dominant deformation mechanism in the alloy. It was also reported that the as-cast HEA showed the slip-avalanche behavior, while the deformed samples did not exhibit any pronounced pop-ins (see
Figure 28a). The lack of pop-ins exhibited by the deformed samples were attributed to the presence of affluent grain boundaries that act as extra mediators for plastic deformation and barriers for dislocation motion. The pop-ins that occurred in the as-cast sample exhibited relatively smaller pop-ins, as compared to alloys with a BCC lattice that displays only one pronounced pop-in [
288,
289]. This difference in the magnitude and the number of pop-ins was likely due to different dislocation-nucleation processes in the alloys, such as perfect dislocations in BCC crystals and partial dislocations in FCC crystals [
289].
Figure 28b presents the cumulative-probability distribution of the displacement burst size,
S], for the as-cast Al
0.3CrCoFeNi HEA sample. As previously discussed, the distribution represents the percentage of pop-in events with the displacement burst size being larger than a given value,
S. As can be seen in the figure, the probability of observing a pop-in of a size,
S, significantly decreases with an increase in the size,
S. It was also reported that the parameters
Sc and
β were approximately 0.014 ± 0.000 and 0.15 ± 0.02, respectively, which indicates that slip avalanches did indeed occur in the as-cast sample during the nanoindentation deformation.
3.9. CoCrFeMnNi HEA (Cantor Alloy)
Carroll et al. examined the serration behavior in multiple alloys, including CoCrFeMnNi HEA with CoCrFeNi HEA, CoFeNi medium-entropy alloy, CoNi low-entropy alloy (LEA), and pure Ni [
153]. The above samples had configurational entropies ranging from 0R for the pure Ni to 1.61R for the CoCrFeMnNi HEA. Here, the specimens underwent tension tests with strain rates and test temperatures ranging from 1 × 10
−5 to 1 × 10
−2 s
−1 and 300 to 700 °C, respectively.
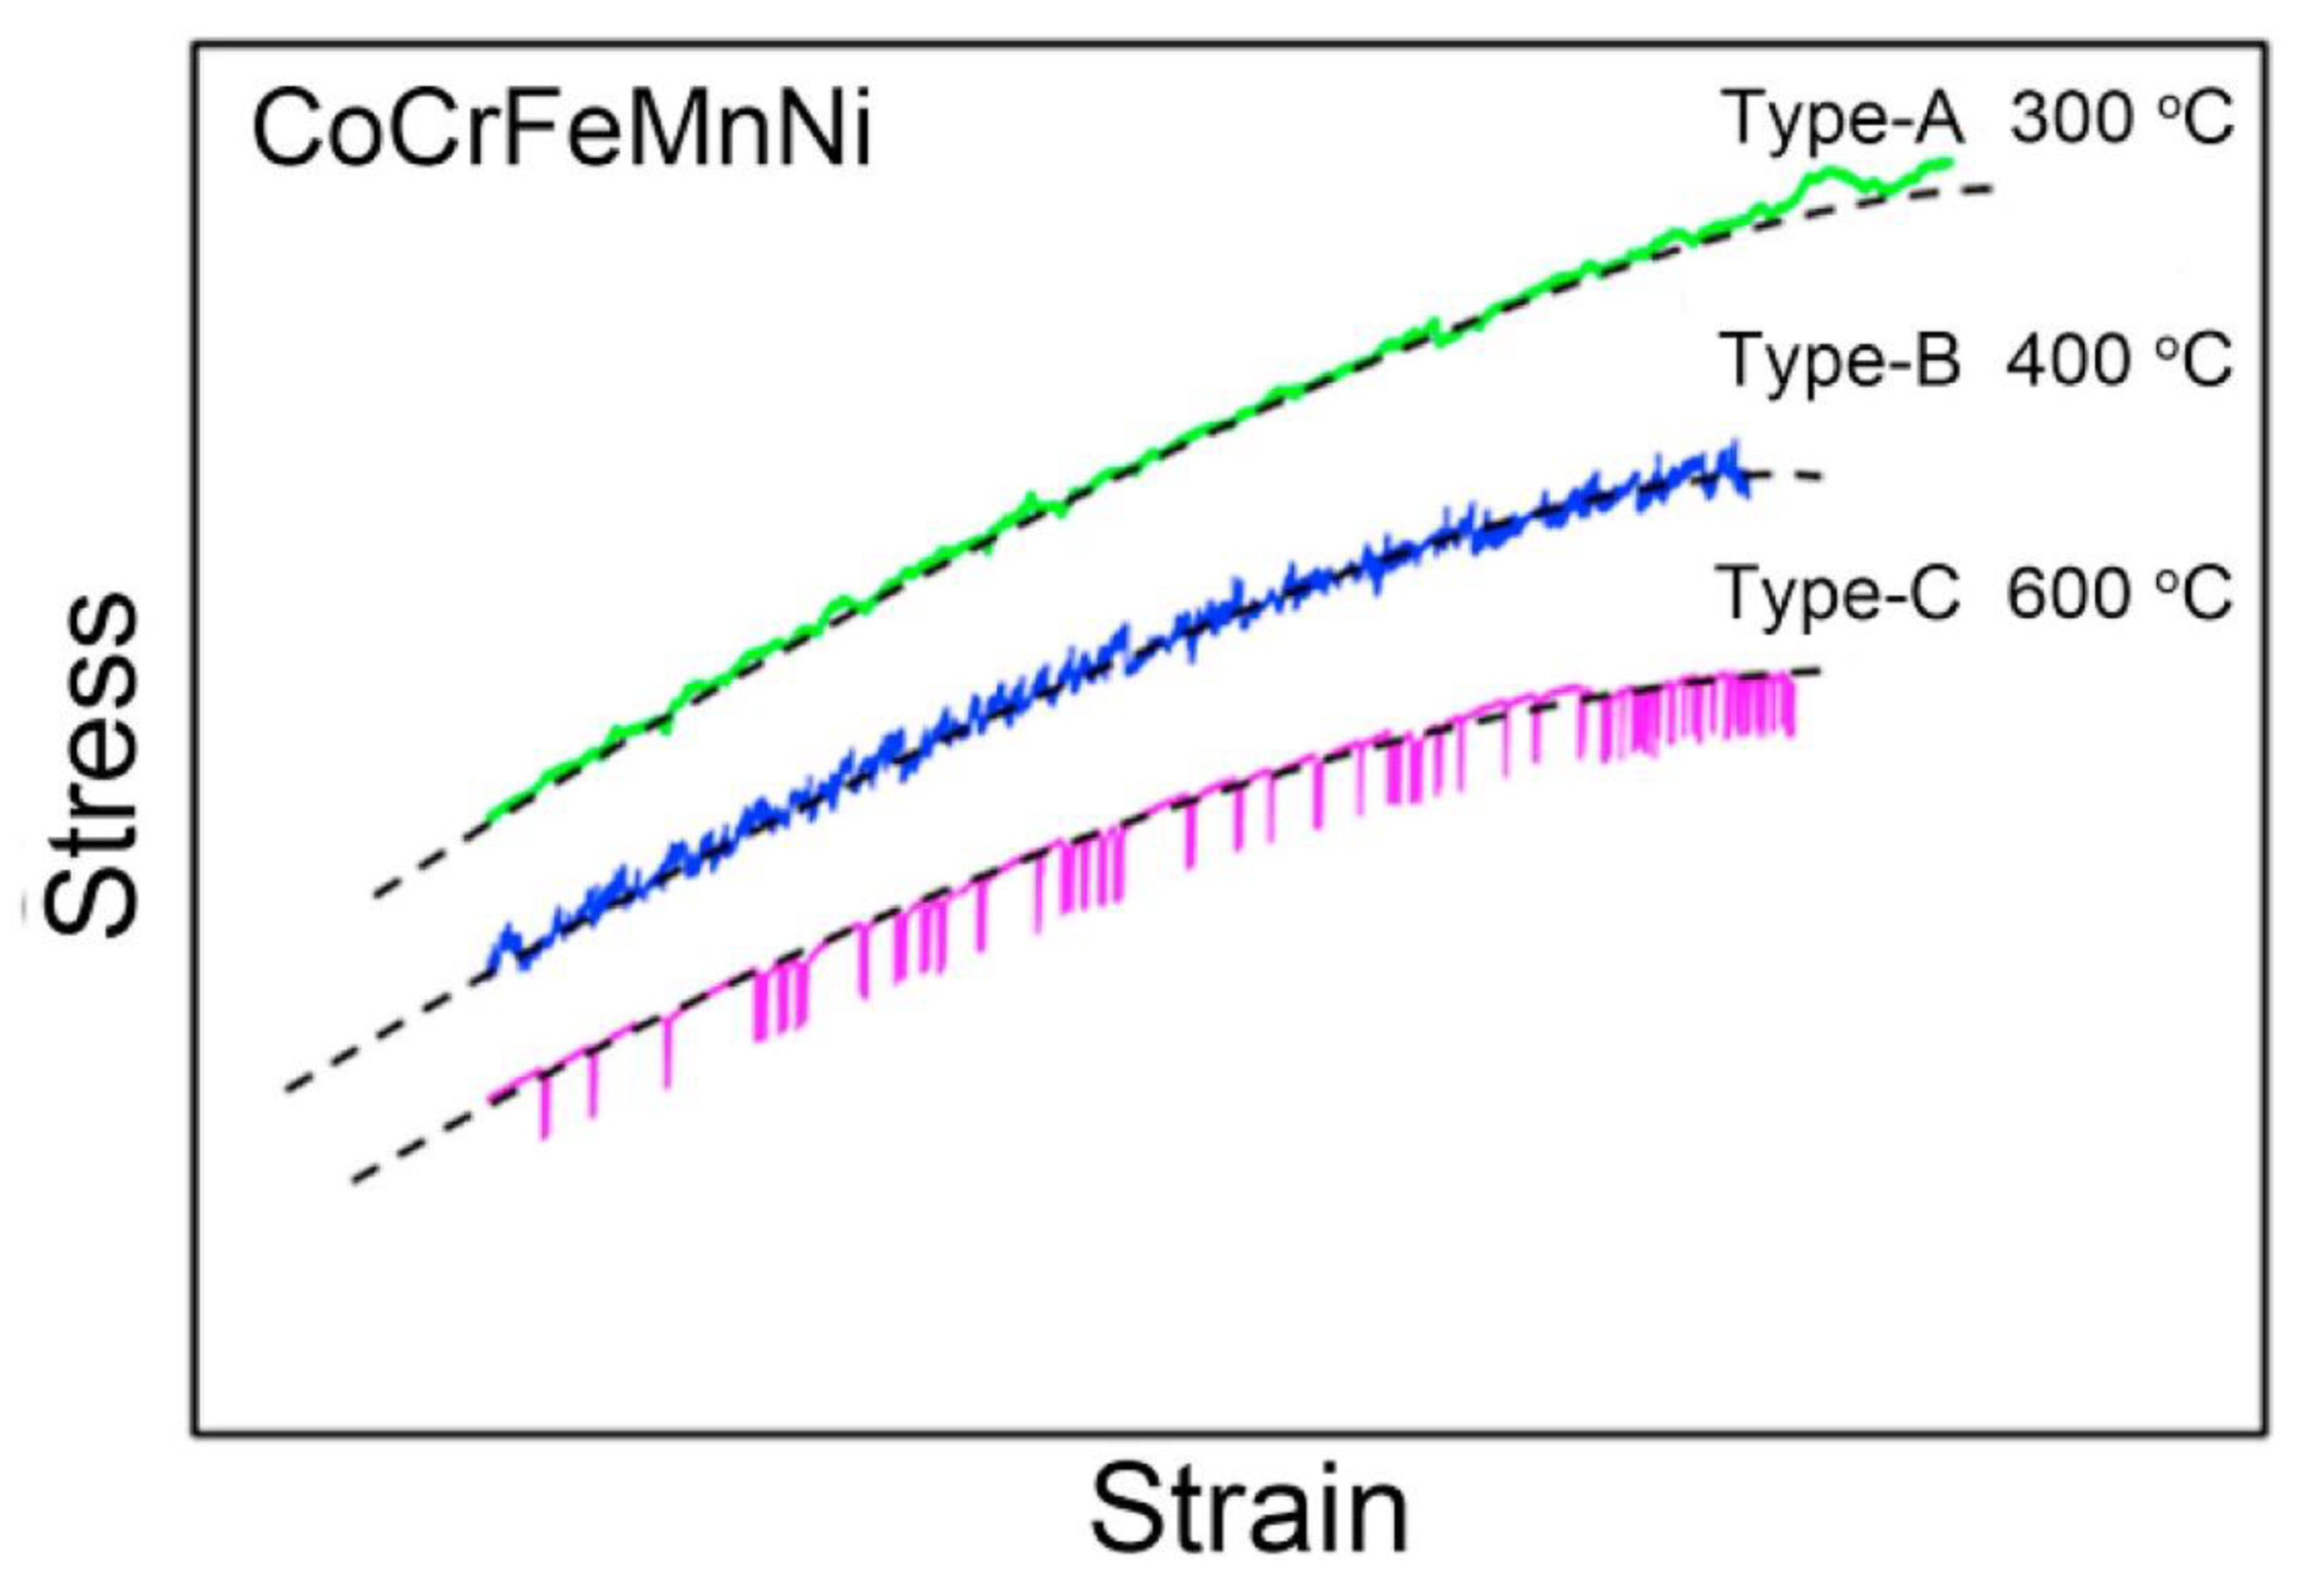
Figure 35 displays the stress–strain curves for the CoCrFeMnNi HEA tested at a strain rate of 1 × 10
−4 s
−1 for temperatures of 300–600 °C [
181]. The observed serrated flow consisted of Type-A, Type-B, and Type-C serrations, where the serration type depended upon the temperature.
Table 5 displays a summary of the serration type and the corresponding temperature for the tests performed at strain rates of 1 × 10
−4 to 1 × 10
−2 s
−1 and 300 to 600 °C. For the sample tested at the highest strain rate, only Type-A serrations were observed. Furthermore, the sample that was tested at 1 × 10
−4 s
−1 exhibited serrations that were Types A and C at the highest and lowest temperatures, respectively. For the intermediate temperatures of 400 and 500 °C, Type-B serrations were observed. It should be noted that a similar trend was observed in Al
0.5CoCrCuFeNi HEA [
180], as discussed previously.
It was found that, for a strain rate of 1 × 10⁻⁴ s−1, the pure Ni and CoNi alloy did not exhibit serrations at any of the prescribed temperatures. Furthermore, the temperature range for which serrations were observed increased with an increasing chemical complexity of the alloy, such that the CoCrFeMnNi HEA was had the largest range of temperatures. From here, the authors suggested that the structure of the HEA prevents thermal vibrational from destroying the pinning effect, thereby allowing mobile solute atoms to pin the moving dislocations at lower temperatures.
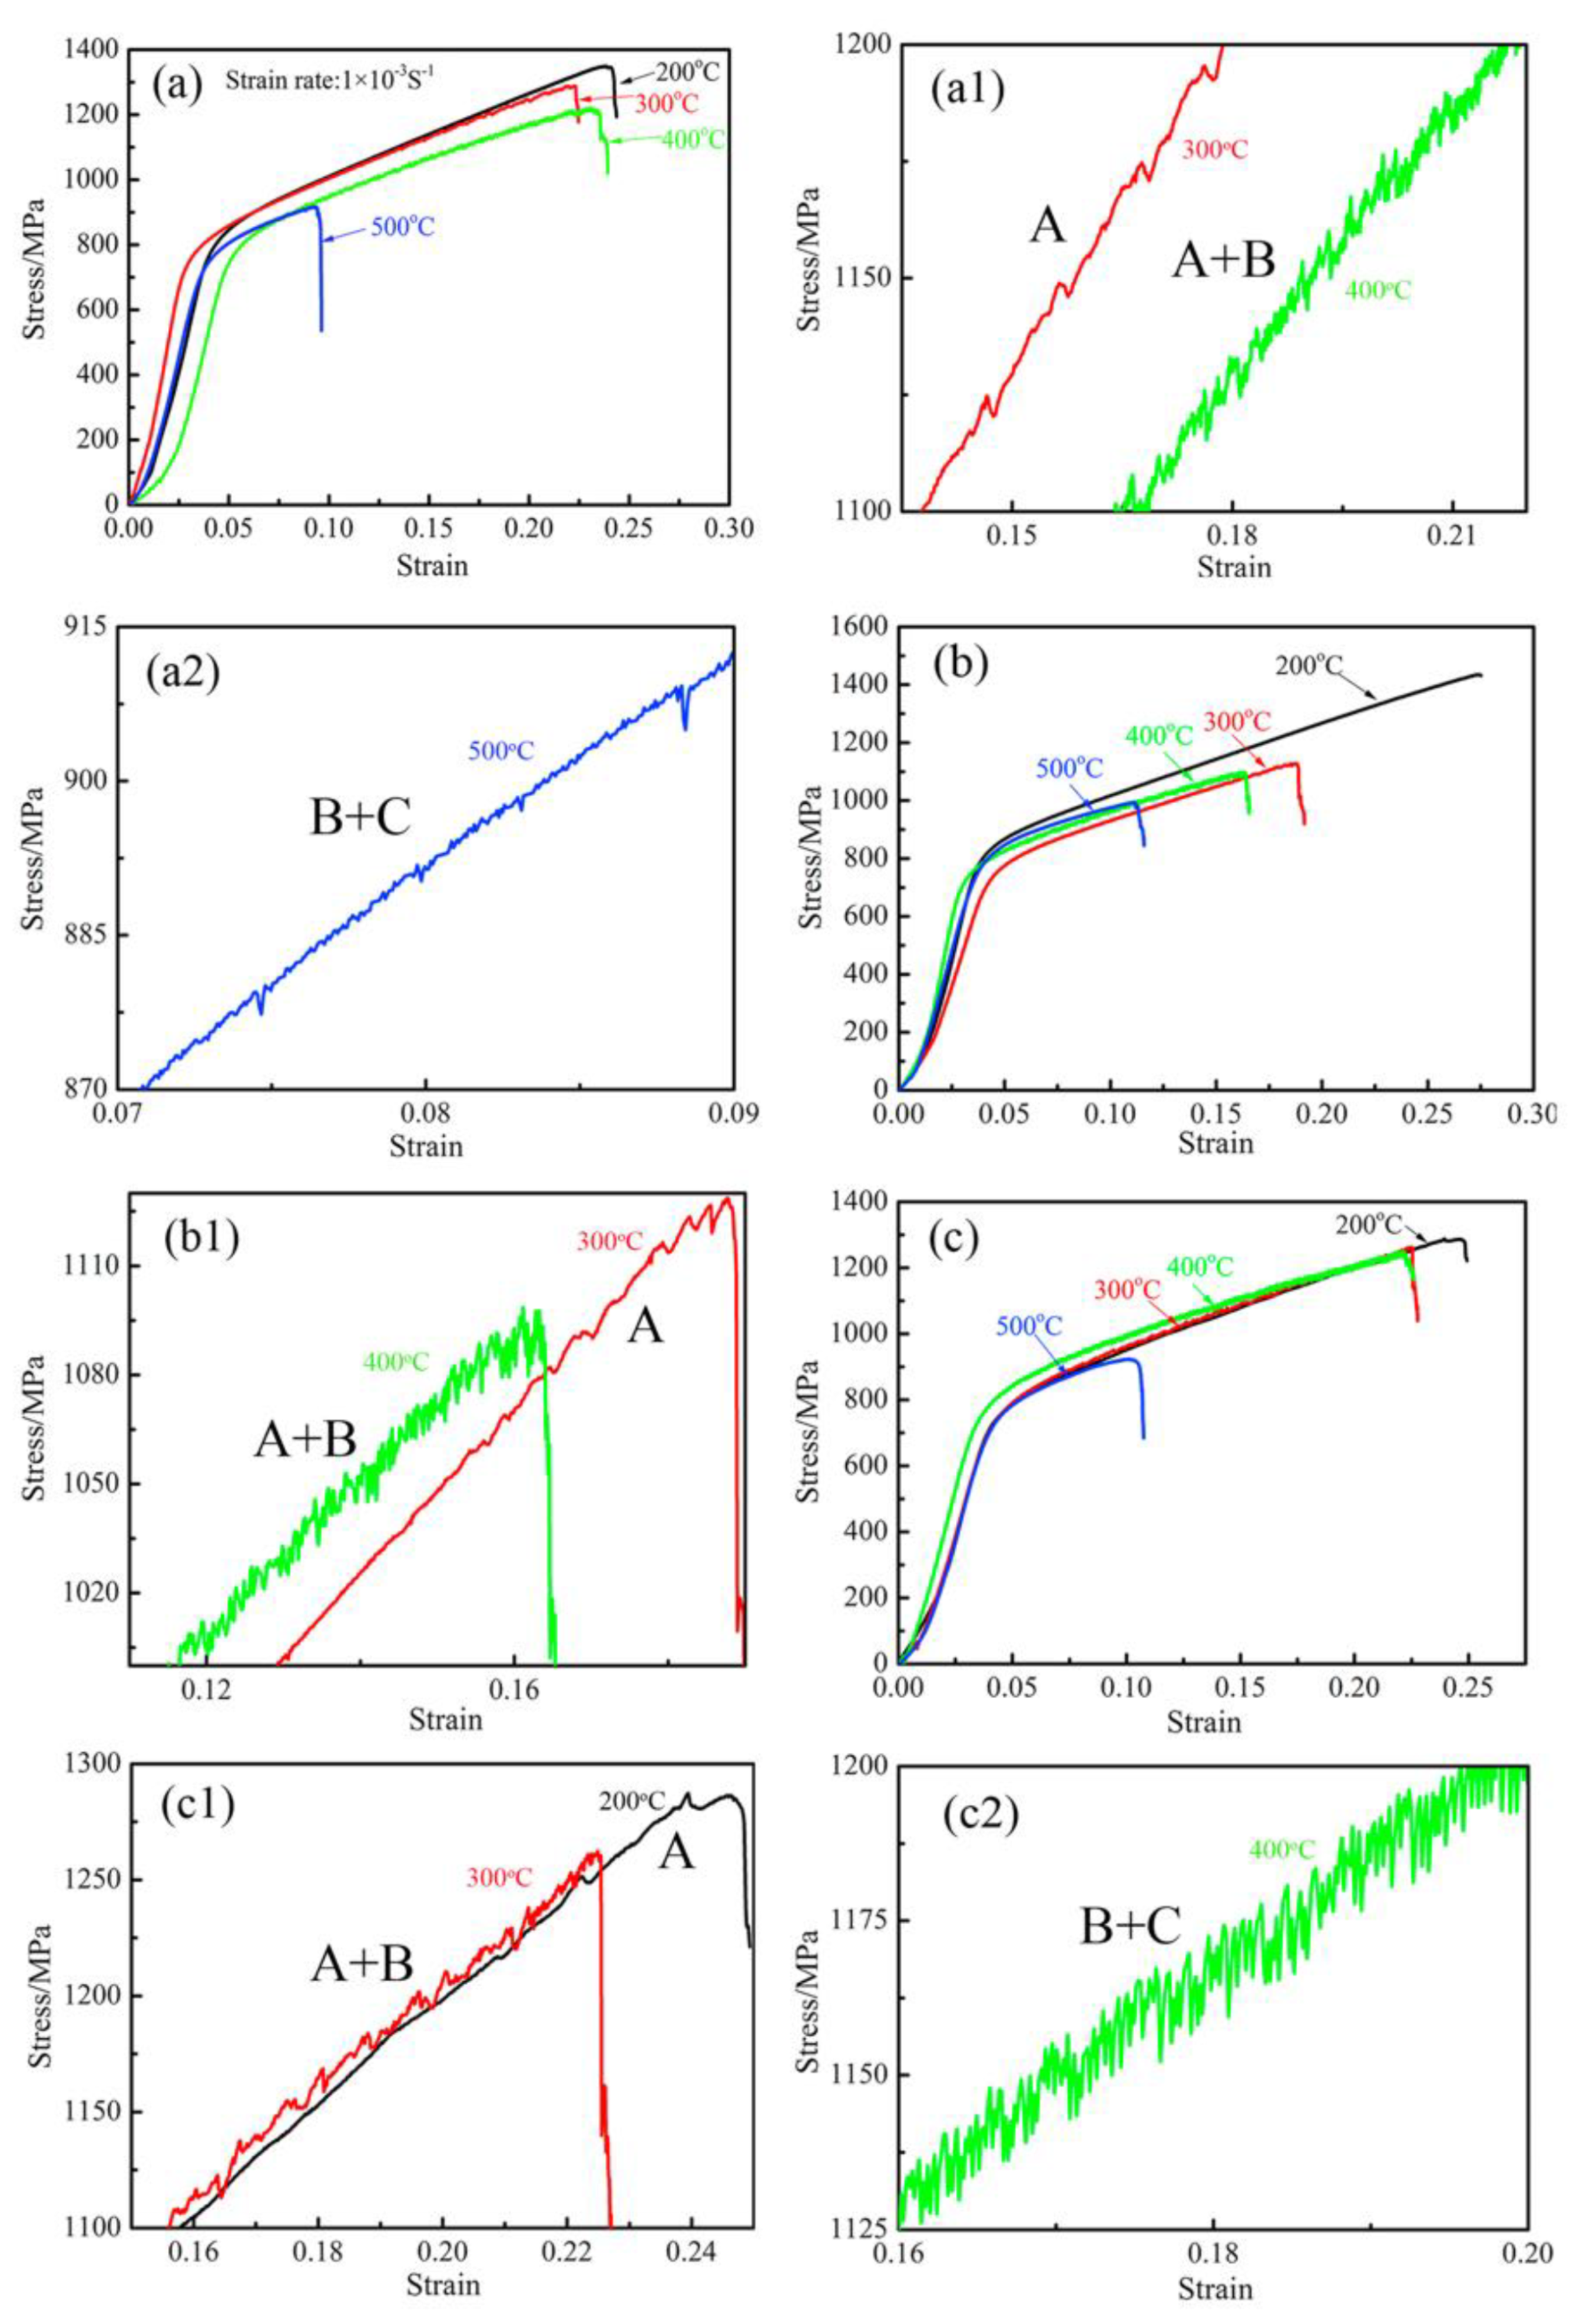
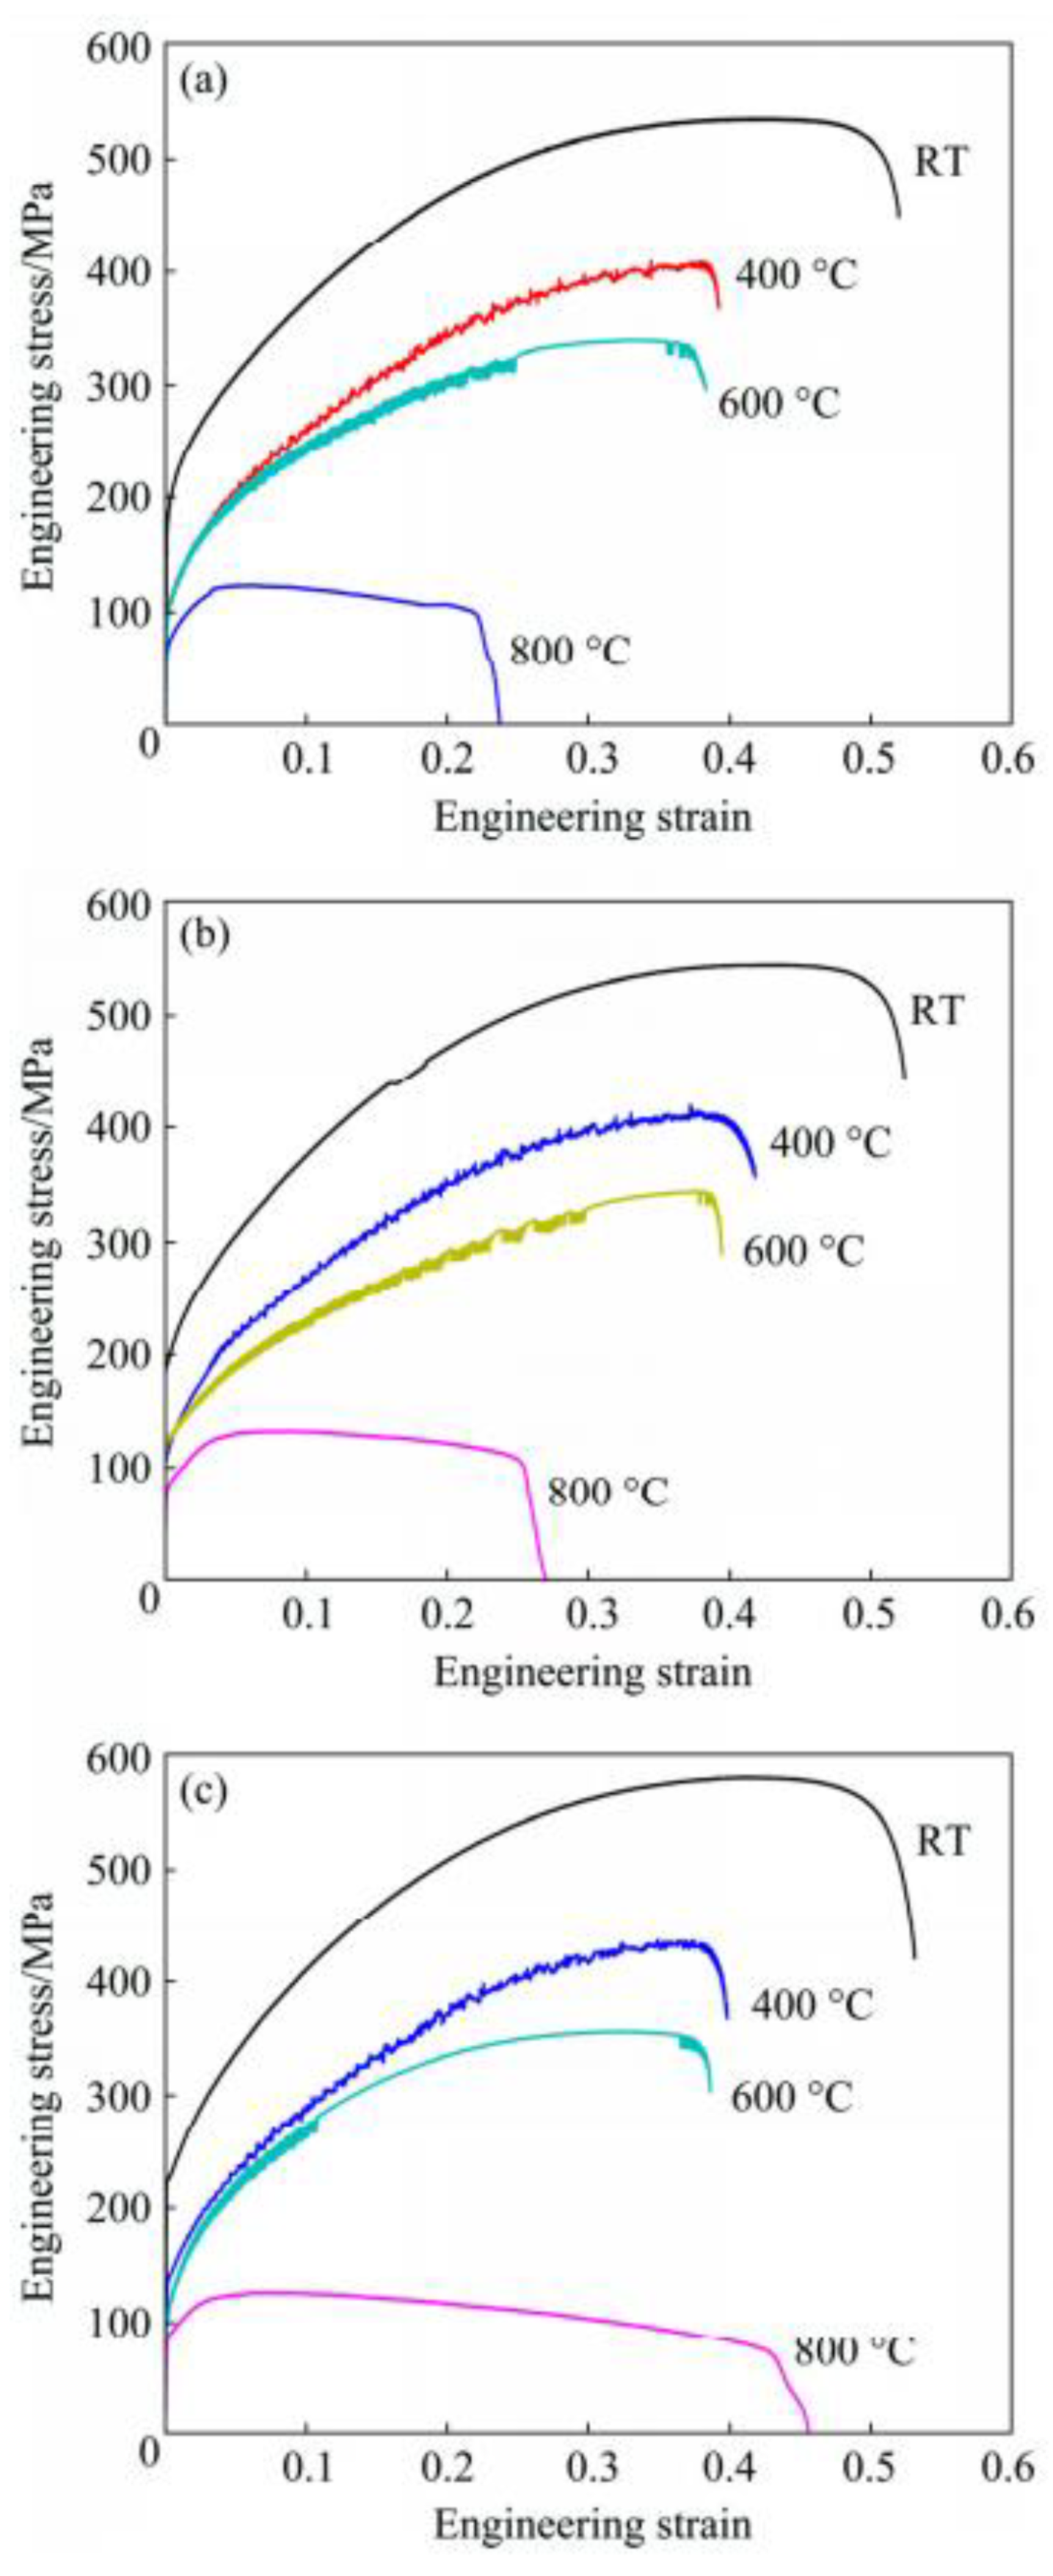
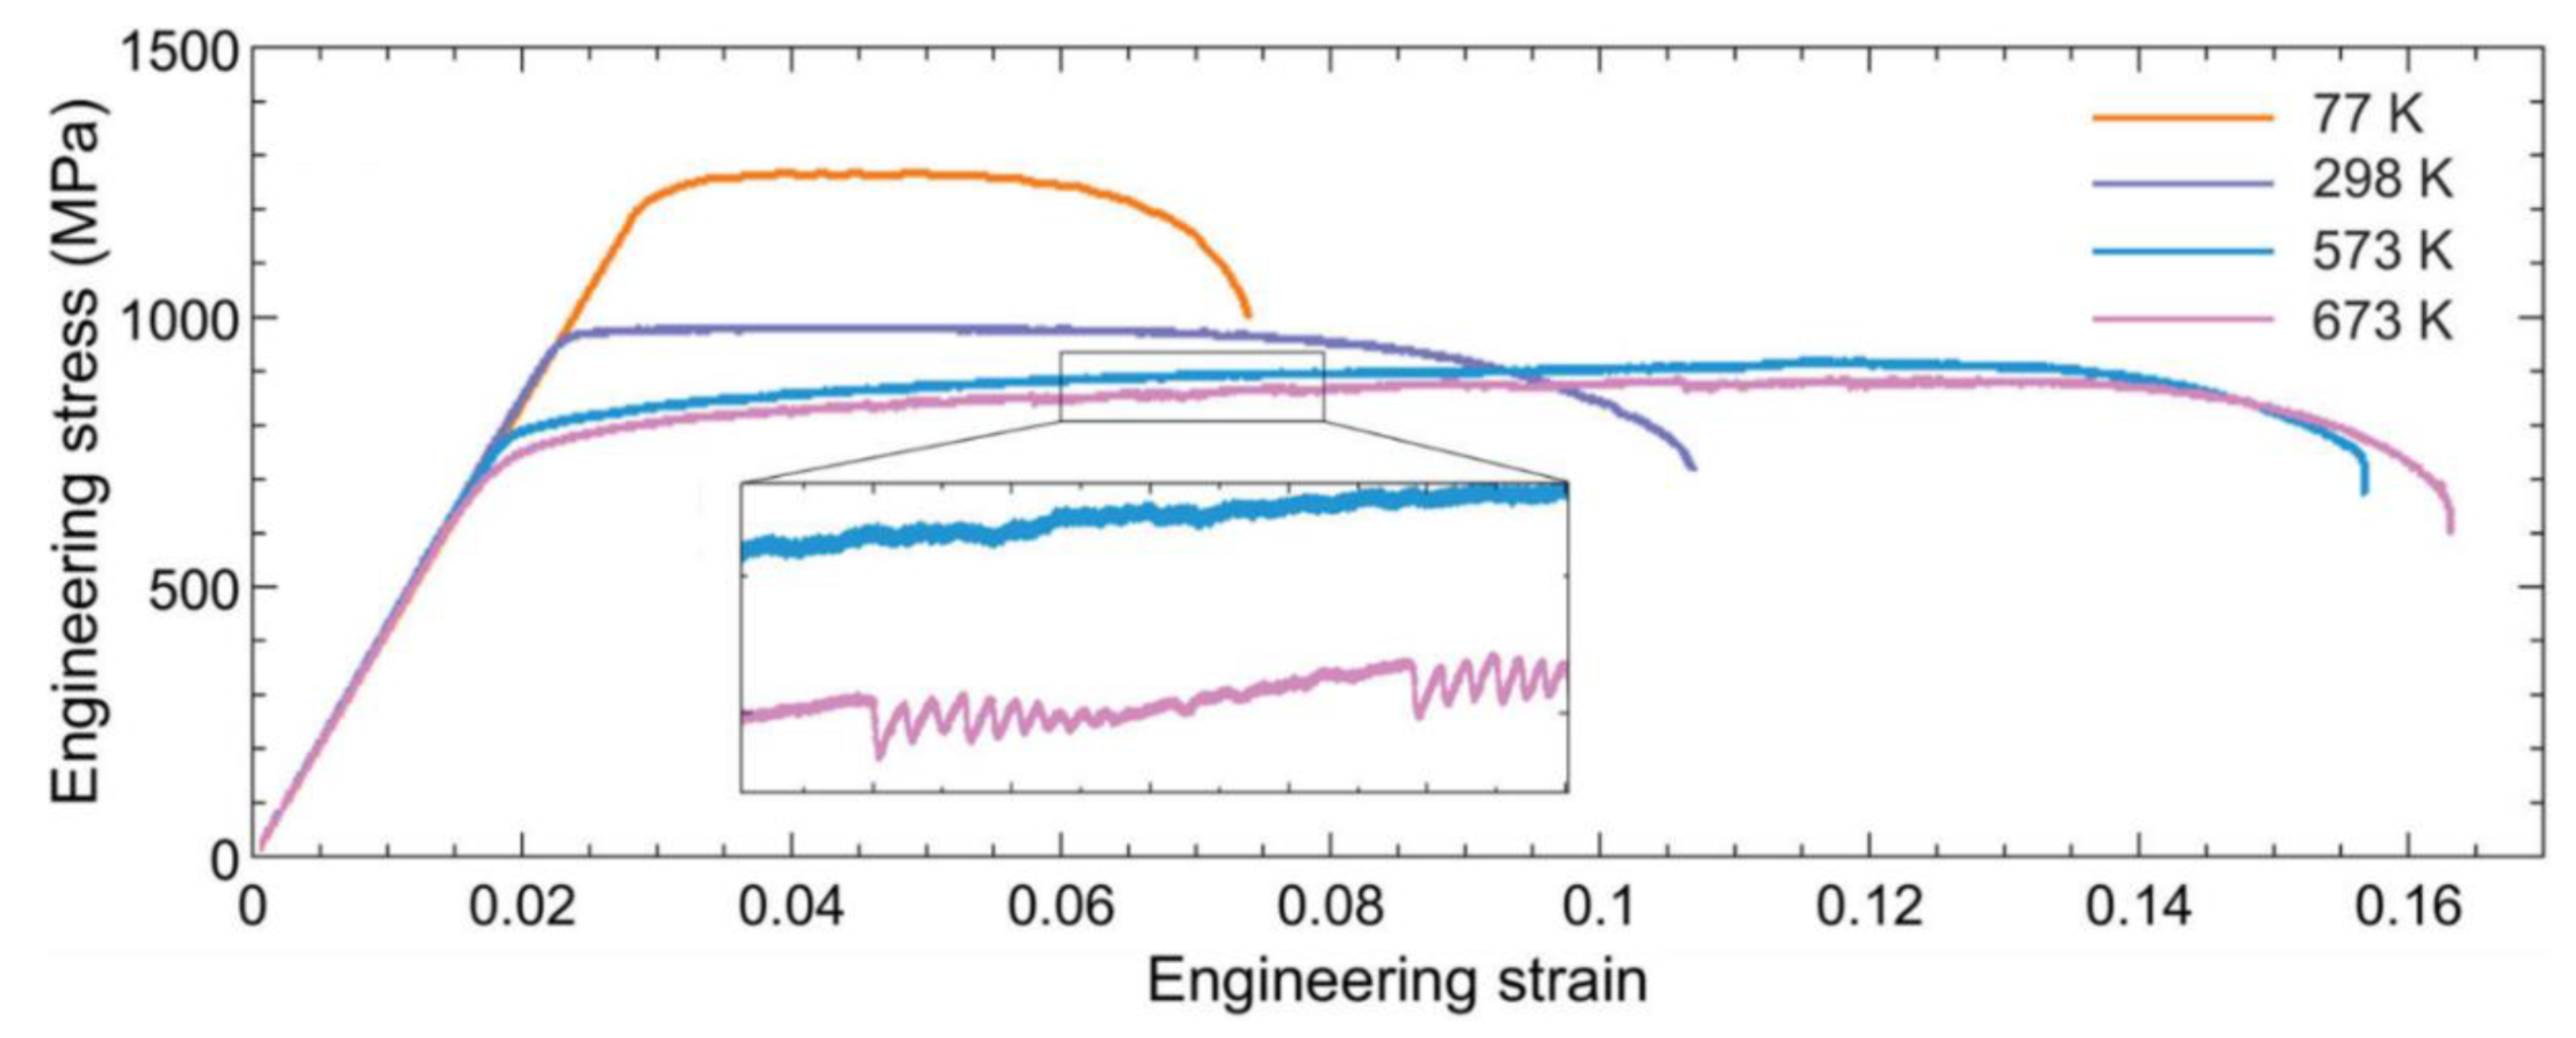
Fu et al. examined the deformation behavior of a CoCrFeMnNi HEA that underwent homogenization, cold-rolling, and recrystallization [
163]. The samples were homogenized at 1100 °C, for 24 h, in vacuum, and then subsequently cold-rolled, which led to a reduction in thickness of 40%. After cold-rolling, the sheets were recrystallized at 900 °C for 1 h. After the samples were fabricated, they underwent tension testing at temperatures ranging from RT to 800 °C and strain rates from 1.0 × 10
−5 to 5.0 × 10
−3 s
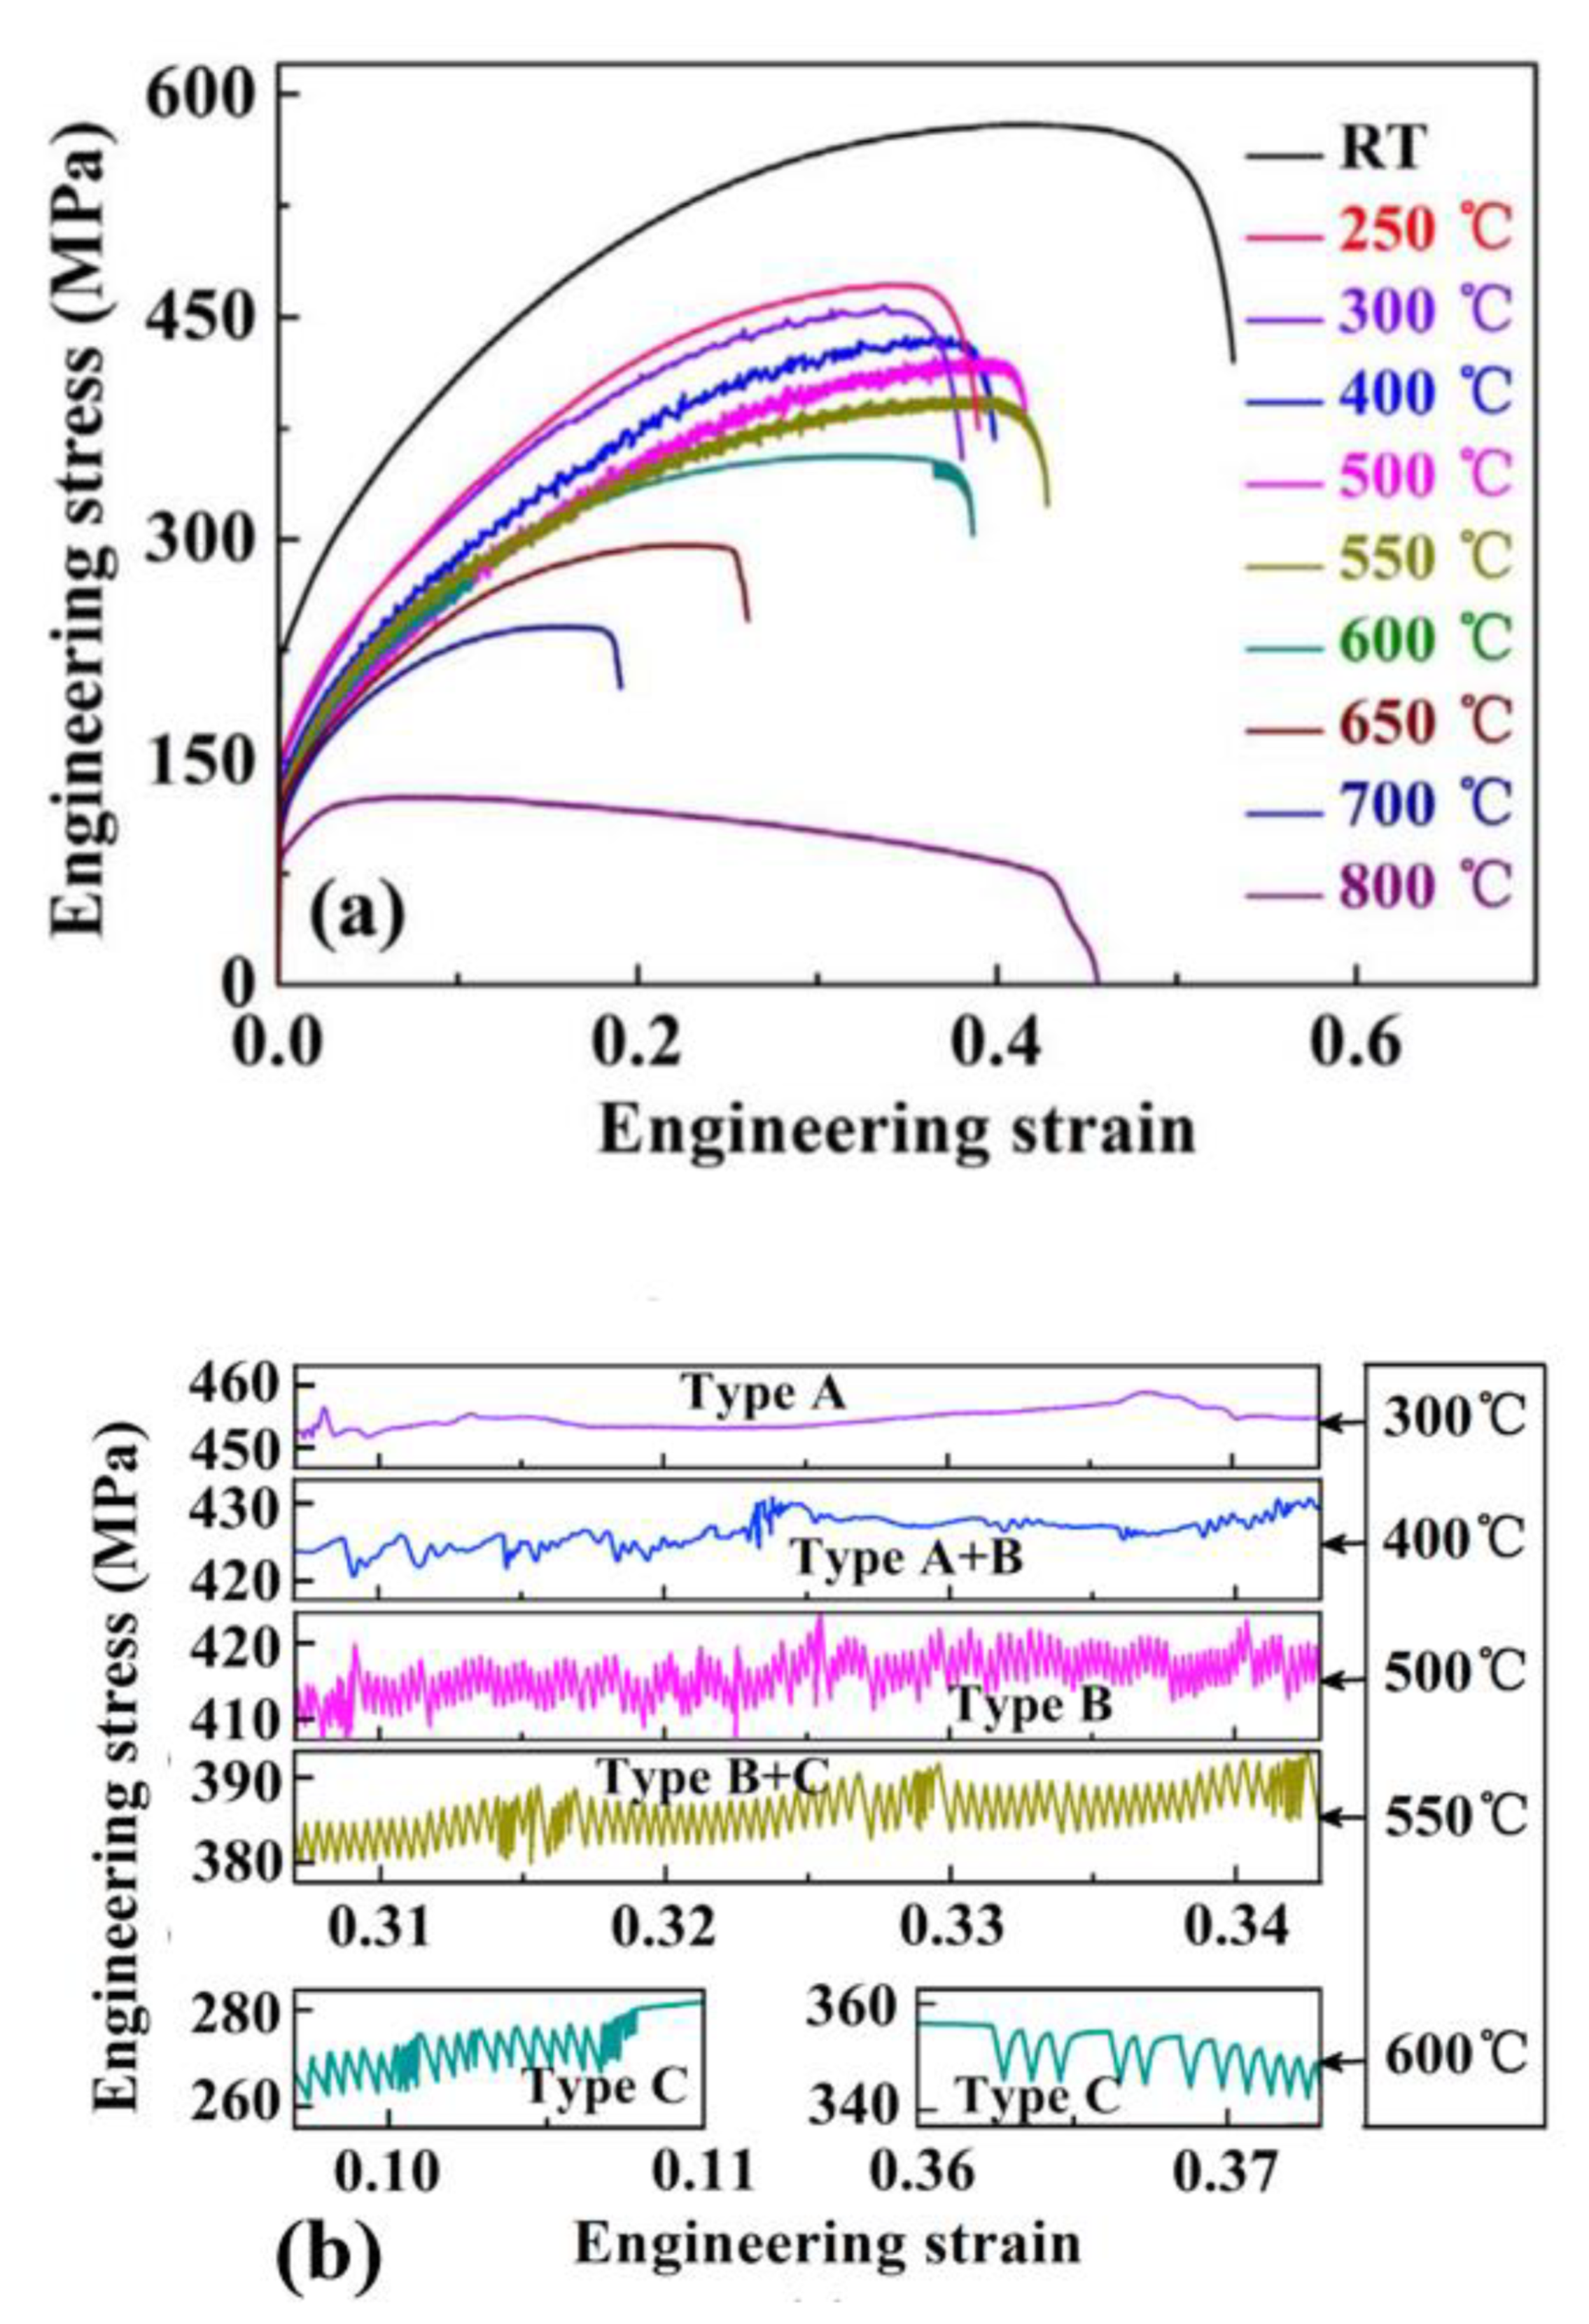
−1. The engineering stress vs. strain data for the samples tested at a strain rate of 3.0 × 10
−4 s
−1 and temperatures ranging from RT to 800 °C can be observed in
Figure 36a,b. As can be seen in the figures, the serrations are well defined for temperatures ranging from 300 to 600 °C. Furthermore, the serration type was dependent on the test temperature (see
Figure 36b). At 300 °C, Type-A serrations were observed in the graph, while Types A + B were seen in the sample tested at 400 °C. On the other hand, Type-B serrations occurred in the sample that was tested at 550 °C, while Type-C serrations were observed at 600 °C.
It was also found that the critical plastic strain for the onset of serrations was significantly affected by both the temperature and the applied strain rate. For example, at a strain rate of 3.0 × 10⁻⁴ s−1, the critical strain decreased monotonically with respect to the temperature. In contrast, the critical strain increased with an increase in the strain rate. From the critical strain, it was determined that, for the above strain rate, there were two temperature regimes for the activation energy of the serrated flow. For the first region, which corresponded to test temperatures of 300–500 °C, the activation energy was 116 kJ/mol, and the solute pinning of dislocations was controlled by pipe diffusion. As for the second region, which occurred at temperatures ranging from 500 to 600 °C, the activation energy for serrations was 296 kJ/mol. In this region, the pinning-and-unpinning process was dominated by a cooperative lattice diffusion mechanism in which Ni was the rate-controlling constituent.
It should be noted that serrations were not observed for temperatures either below 300 °C or above 600 °C. For the lower-temperature conditions, the lack of observable serrations is most likely a consequence of diffusing solute atoms that are too slow to catch and pin mobile dislocations [
153]. At higher temperatures, it is thought that the thermal vibration of atoms is large enough as to prohibit the effective locking of dislocations [
155,
297].
Figure 37a,b displays the engineering stress vs. strain curves for the samples tested at strain rates ranging of 1.0 × 10
−5–5.0 × 10
−3 s
−1 at a temperature of 500 °C. From the figures, it is apparent that the serration type is dependent on the strain rate. At the lowest strain rate, namely 1.0 × 10
−5 s
−1, the sample exhibited Type-B + Type-C serrations, while Type-A serrations were observed at the highest strain rate. At intermediate strain rates, the stress-drop behavior exhibited Type-A + Type-B (1.0 × 10
−5) and Type-B (1.0 × 10
−4) serrated flow.
Table 6 features the serration type for the temperature and strain-rate conditions of the experiments.
In a later study, Fu et al. performed a similar study on the CoCrFeMnNi HEA, but this time they examined samples that had been cold rolled such that the sample thicknesses were reduced by 20%, 30%, and 40% [
168]. Furthermore, the sheets were recrystallized at both 900 and 1000 °C (1 h) for each cold-rolling condition. XRD revealed that the alloy retained a simple FCC solid-solution phase after cold rolling and recrystallization. Samples undergoing quasi-static tensile tests were performed at temperatures ranging from RT to 800 °C. The fractured surfaces of the samples were examined by using SEM.
Figure 38a–c features the engineering stress vs. engineering strain for the HEA samples that were tested at temperatures ranging from RT to 800 °C and rolling conditions of 20%, 30%, and 40% reduced thicknesses. In the sample recrystallized at 900 °C for 1 h, the serrated flow was observed at the intermediate temperatures of 400 and 600 °C for all the rolling conditions. Interestingly, there was a discontinuous gap in the serrated flow for the samples tested at 600 °C. Similar to other studies involving the same alloy [
153,
163], the serrations appear to be of Types A and B at 400 °C, while they were characteristic of Type-C behavior at 600 °C. Moreover, for the samples tested at 600 °C, the discontinuous feature in the serrated flow was the most pronounced in the sample that had a thickness reduction of 40%. No serrations were observed in the samples tested at RT or 800 °C. The lack of observed serrations at 800 °C was attributed to the softening of the alloy at the higher temperature. As for the lack of observable serrations at RT, this trend was again due to the relatively low speed of the moving solutes, thus rendering them unable to reach and pin dislocations [
163].
The SEM characterization revealed massive annular striation patterns located around the dimples on the fractured surface for the specimens tested at 400 and 600 °C. These striation patterns were attributed to a decrease in the ductility of the alloy. In contrast, no such striations were observed in the sample tested at 800 °C.
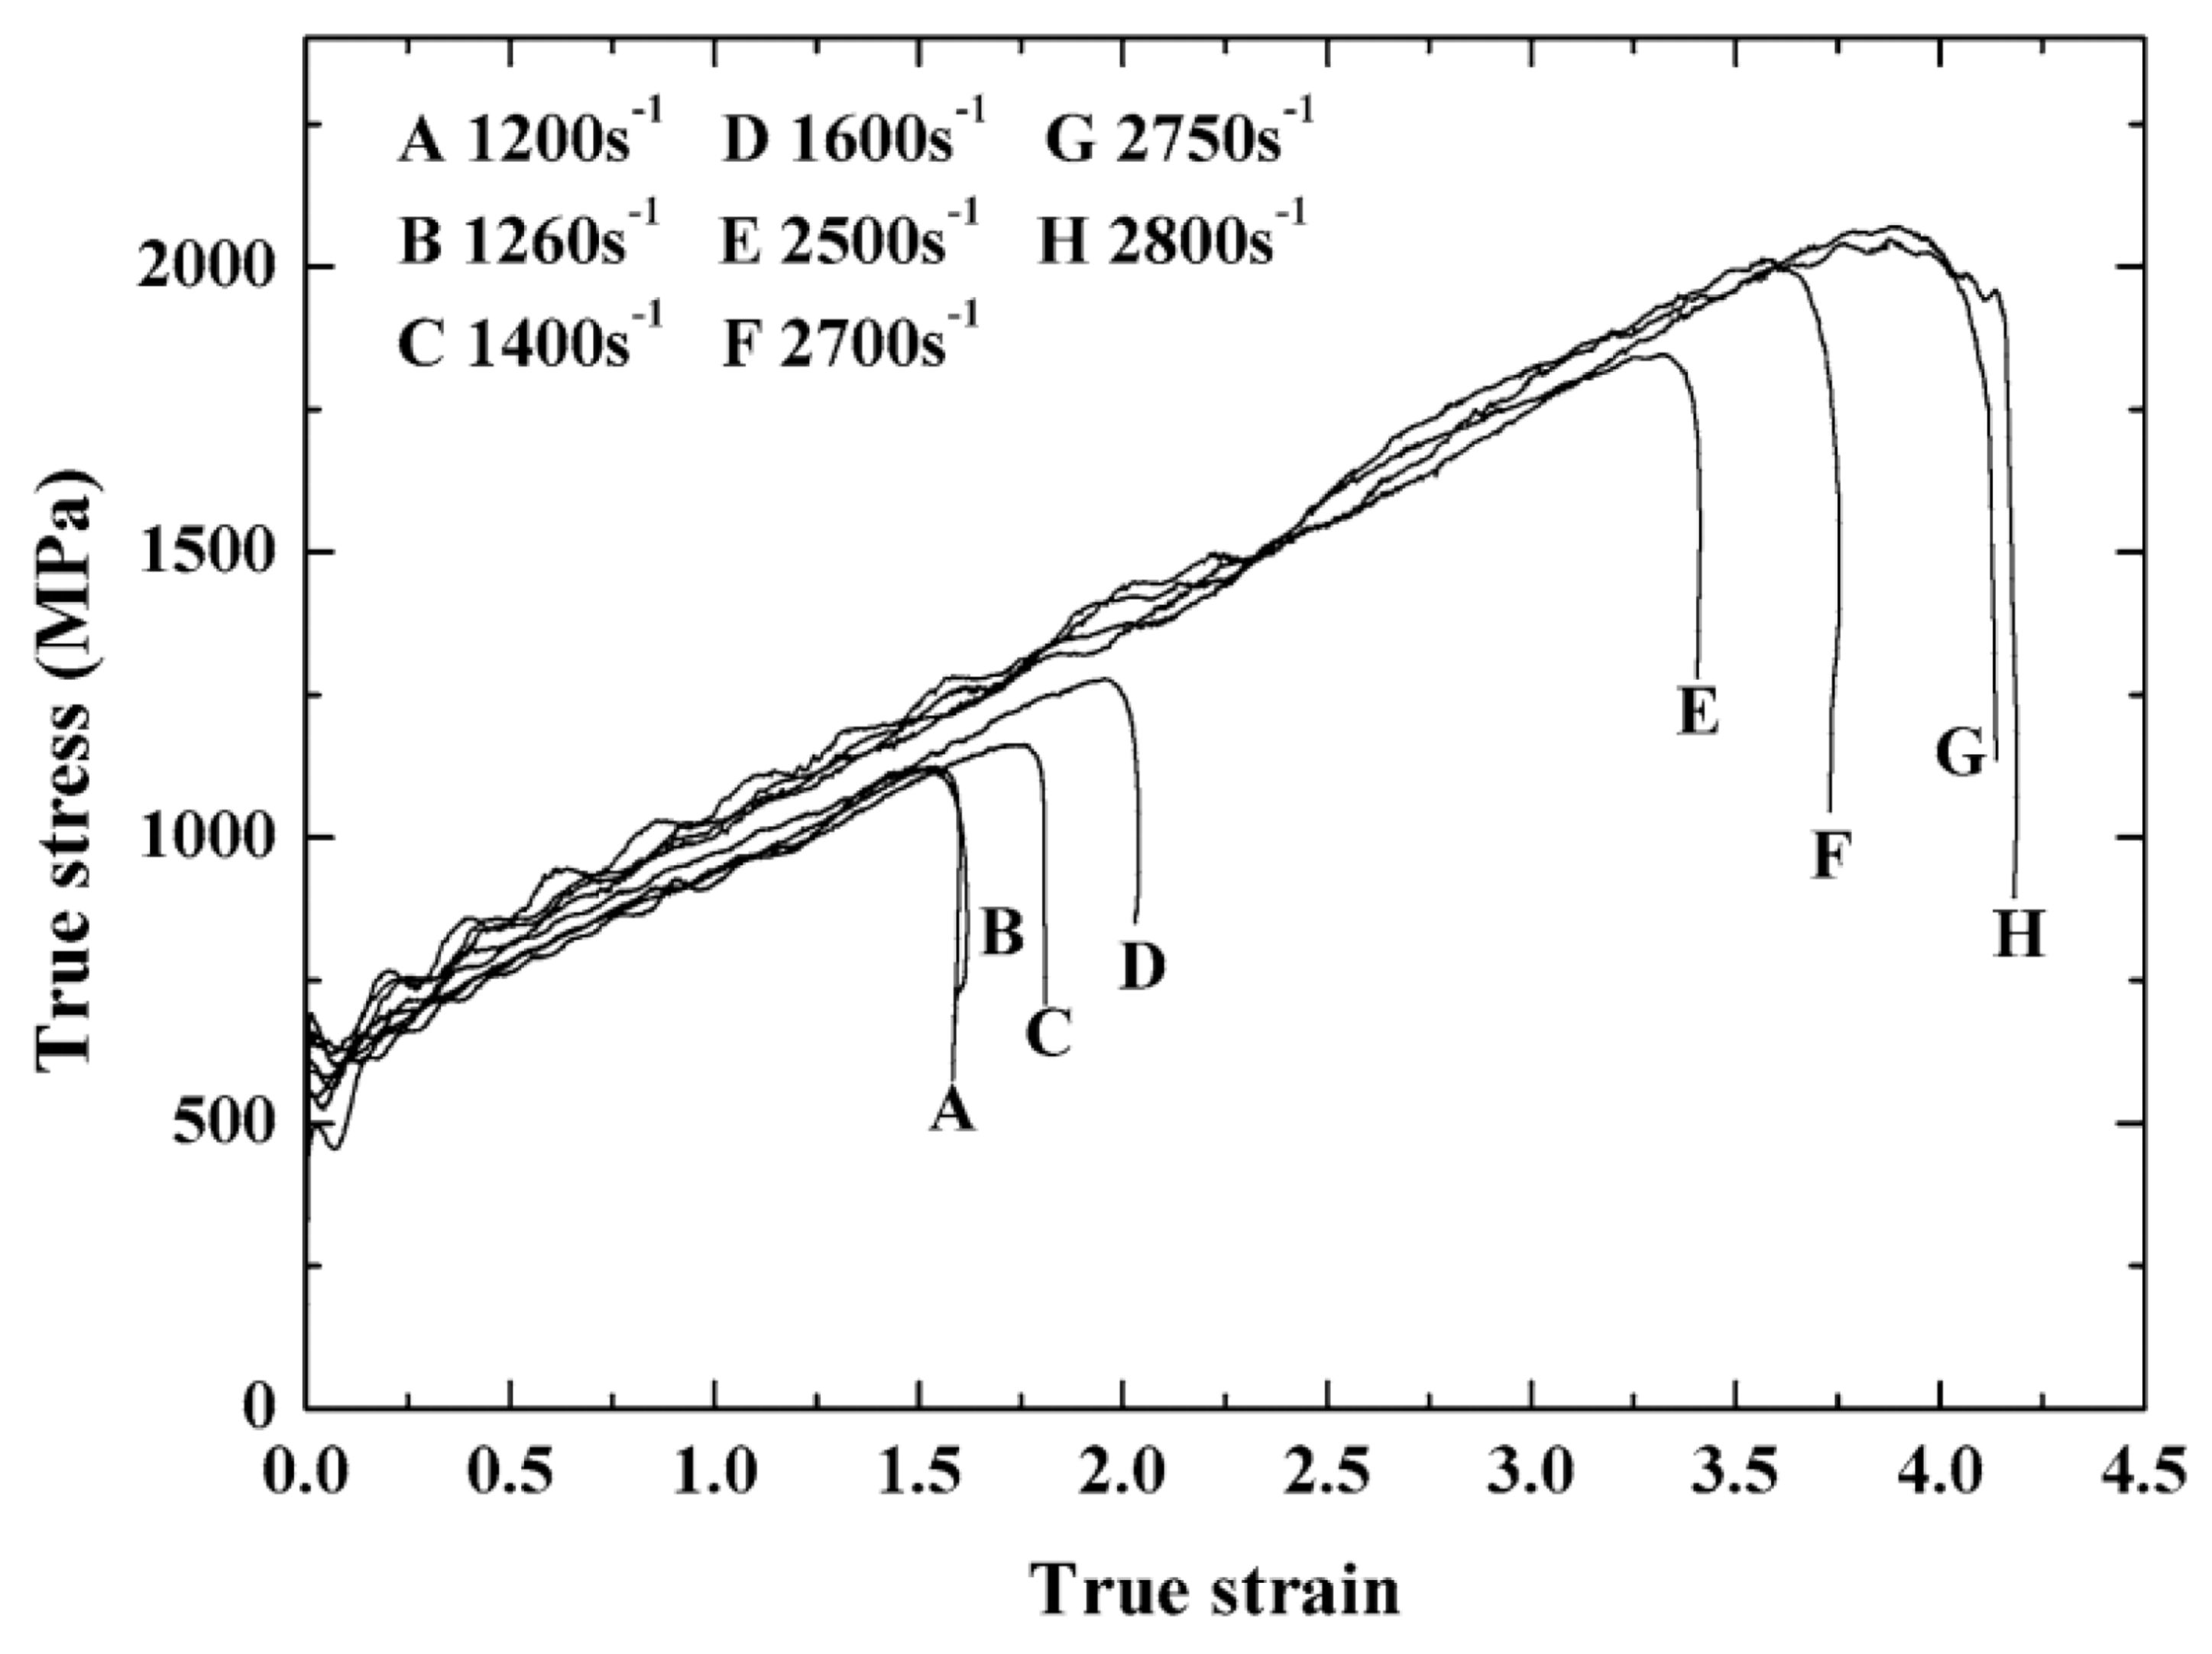
Wang et al. examined the deformation behavior of a spark-plasma-sintered CoCrFeMnNi HEA during high-strain-rate compression [
166]. The results of the XRD characterization determined that the samples had a simple FCC structure. For the mechanical testing, samples were subjected to room-temperature impact tests, using a split-Hopkinson pressure bar system and strain rates ranging from 1 × 10
3 to 3 × 10
3 s
−1. During dynamic deformation, these strain rates amounted to loading rates that varied between 1200 and 2800 s
−1.
Figure 39 displays the true stress vs. true strain behavior for the specimens, and as can be seen, there are observable serrations in the graph. Furthermore, these serrations appear comprise Type-A serrations. It was also determined that the serration behavior in the HEA is sensitive to changes in the applied-loading rate. Additionally, the general temperature of the sample approached values as high as 1300 K during testing. In this scenario, local hotspots in the matrix can weaken intergranular bonding, leading to the formation of cracks and microvoids in the severe-deformation zone.
From the results, the authors hypothesized the following process involved in initializing the serrated flow. During the initial stages of deformation, dislocations form and then subsequently accumulate along the grain boundaries that become elongated during compression. As the deformation continues, the grains become more elongated, leading to a further decrease in the width of the grains. Meanwhile, the generated thermal hotspots weaken the intergranular bonding and ultimately lead to an eventual collapse of the grain boundaries. Consequently, numerous microvoids form along the grain boundaries, and shear bands are generated in the specimen, resulting in the observed serrated flow.
Before moving on, it is important to note that the split Hopkinson pressure bar test depends on the one-dimensional wave propagation in the bar [
298]. The relatively smooth nature of the stress fluctuations, as can be seen in
Figure 39, is indicative of poor pulse shaping during the test. This result suggests that the fluctuations may be due to machine noise rather than an actual physical metallurgical phenomenon.
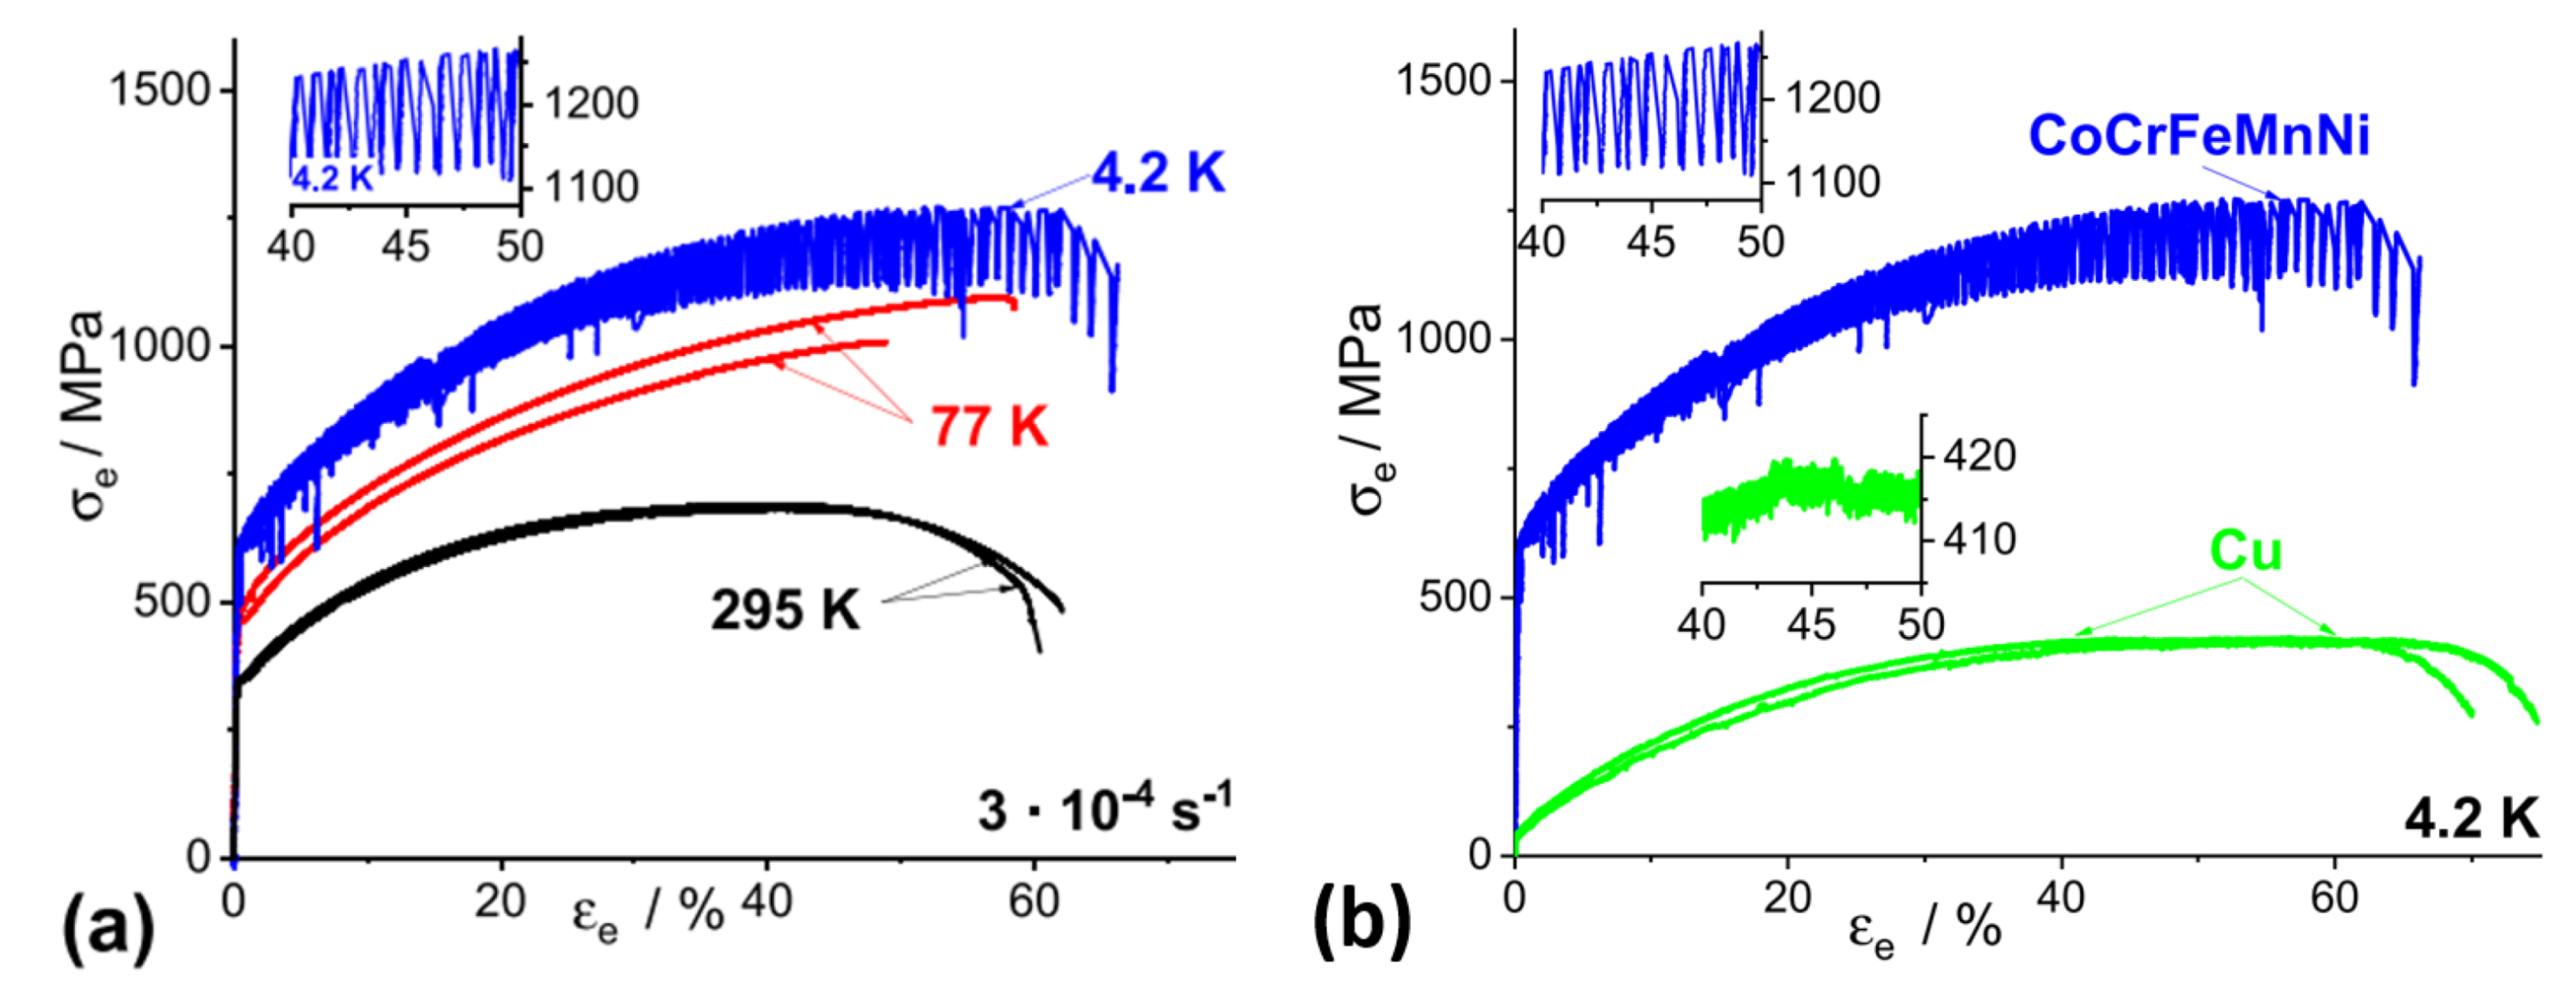
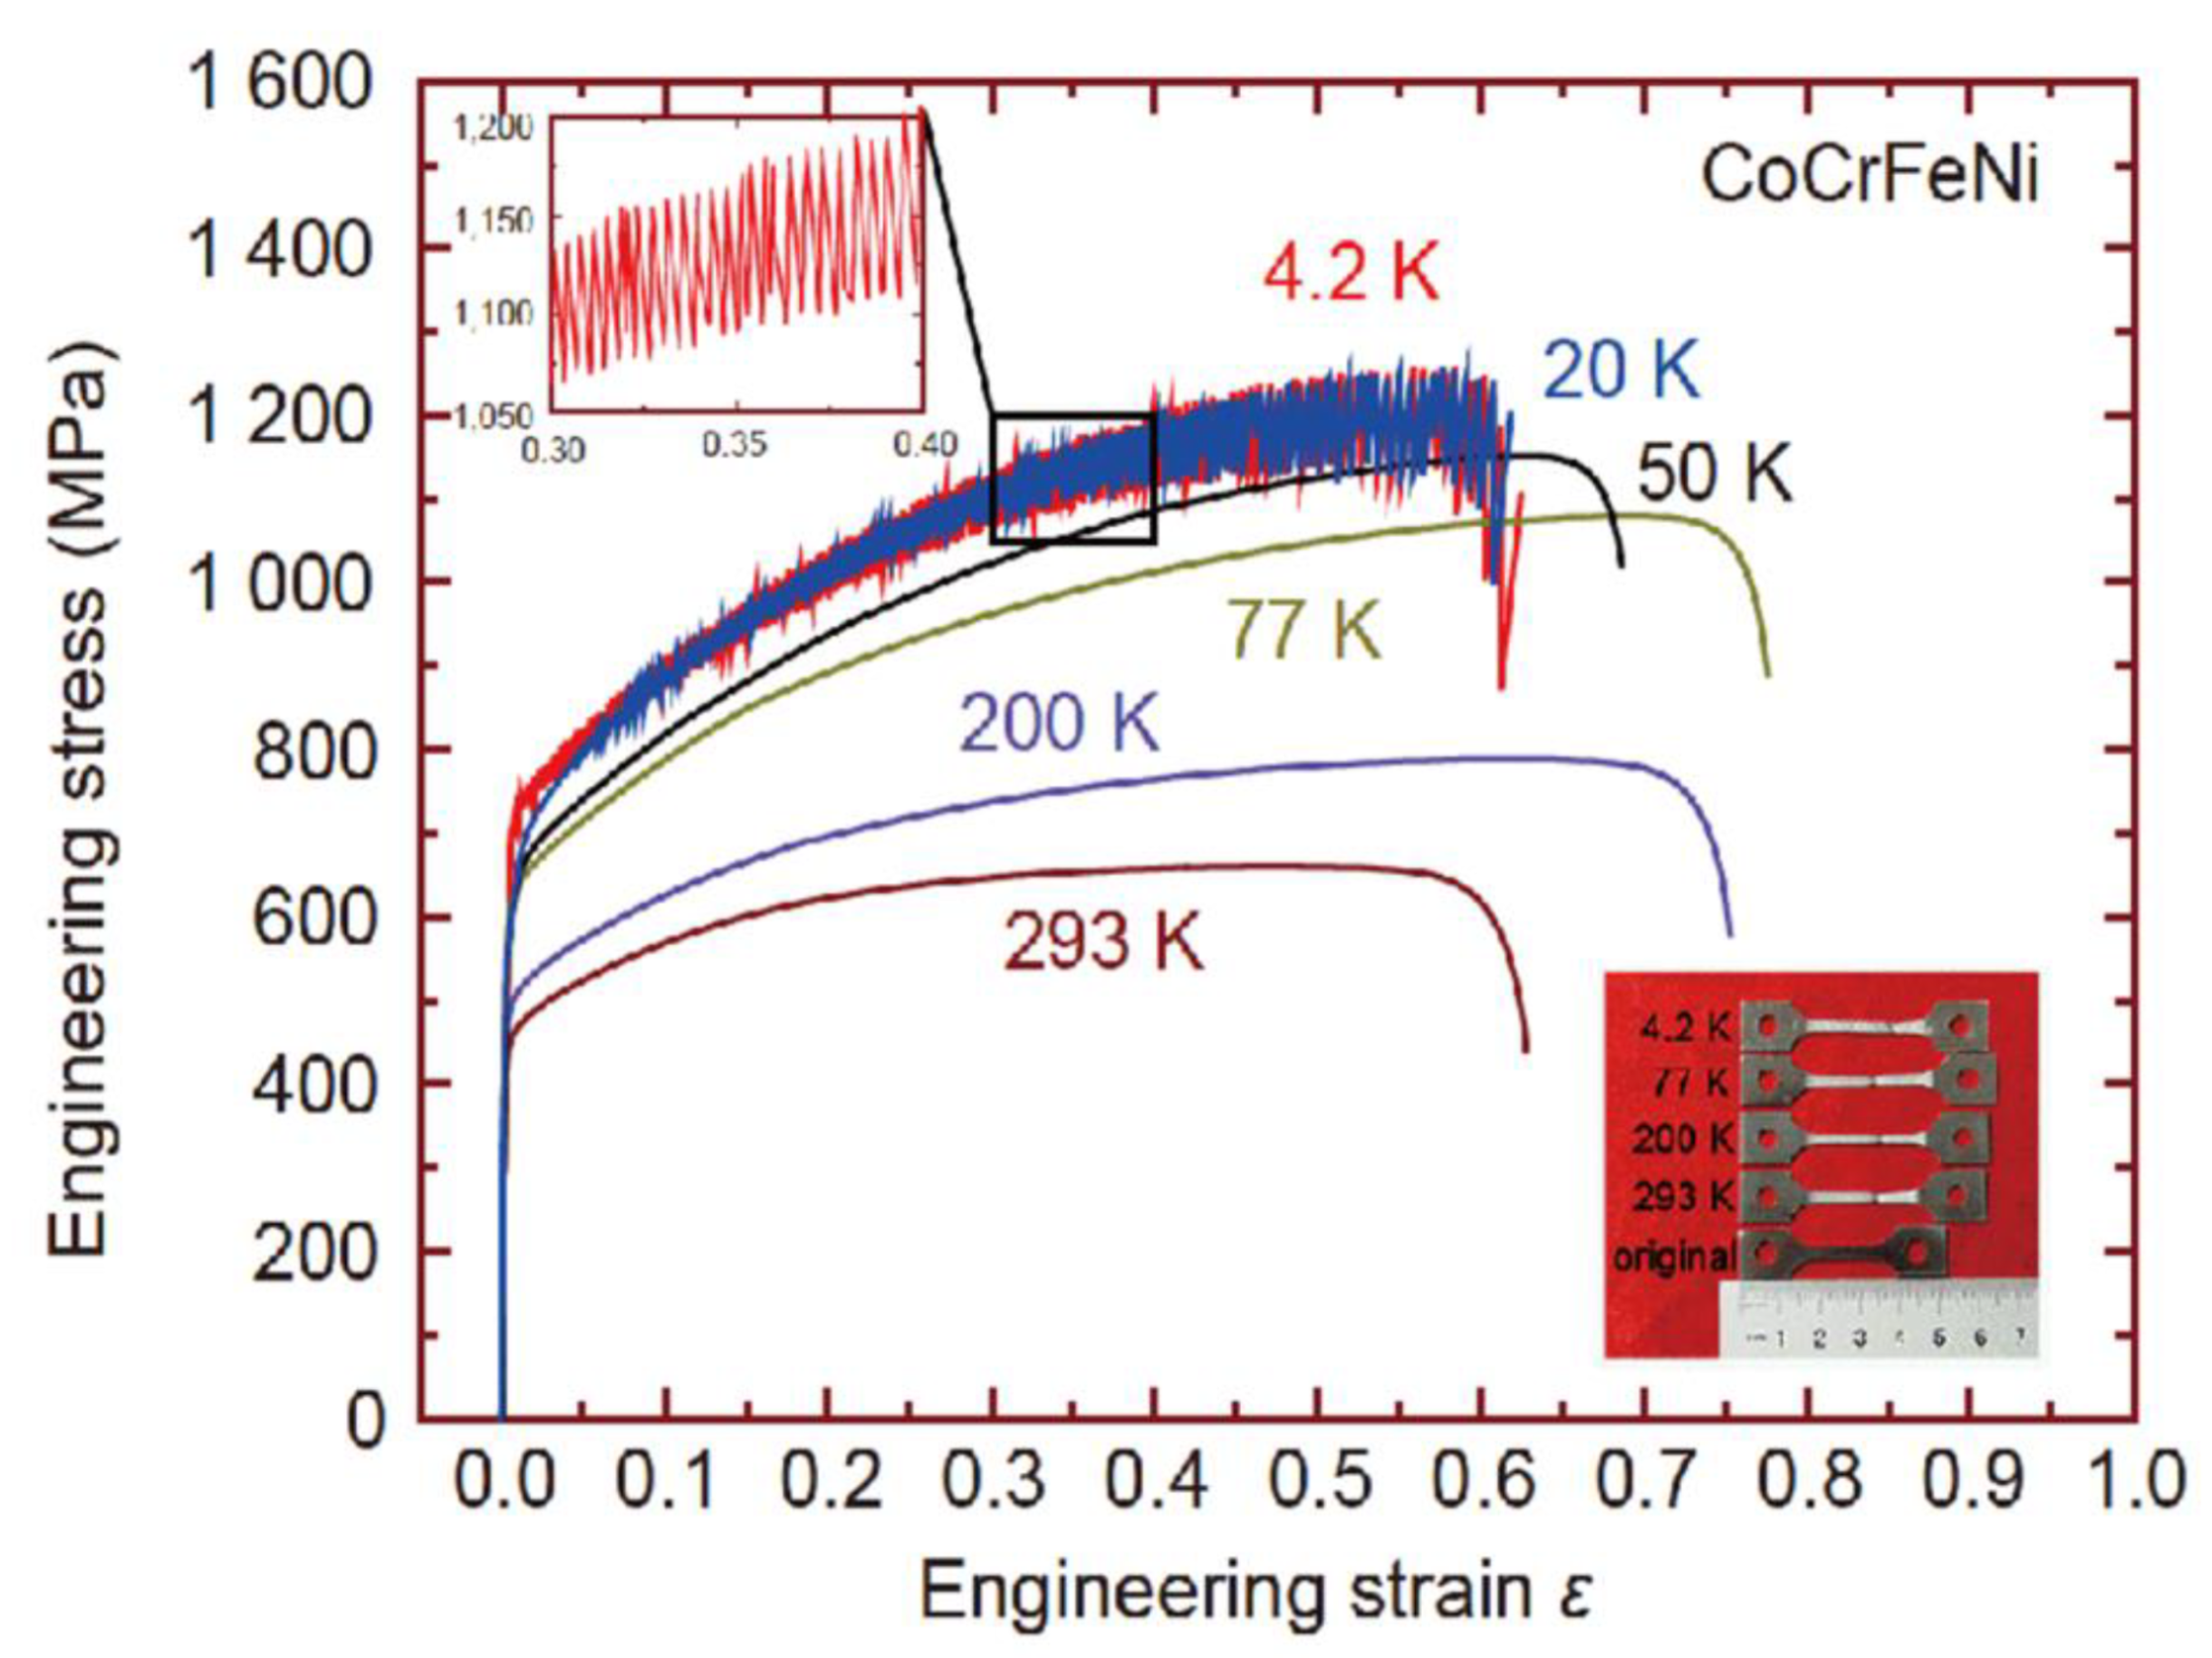
Tirunilai et al. compared the deformation behavior of the CoCrFeMnNi HEA and pure Cu at cryogenic temperatures [
299]. Here, tensile tests were performed at RT (295 K), 77, 8, and 4.2 K. For the experiments performed at 4.2 K, the samples were placed in a liquid He bath, whereas samples were placed in a vacuum cryostat when tested at 8 K. To examine the serration behavior in the HEA, tensile tests were performed at mean plastic strain rates of 6 × 10
−5, 3 × 10
−4, and 1 × 10
−3 s
−1. A sample rate of 10 Hz was used for the data acquisition rate.
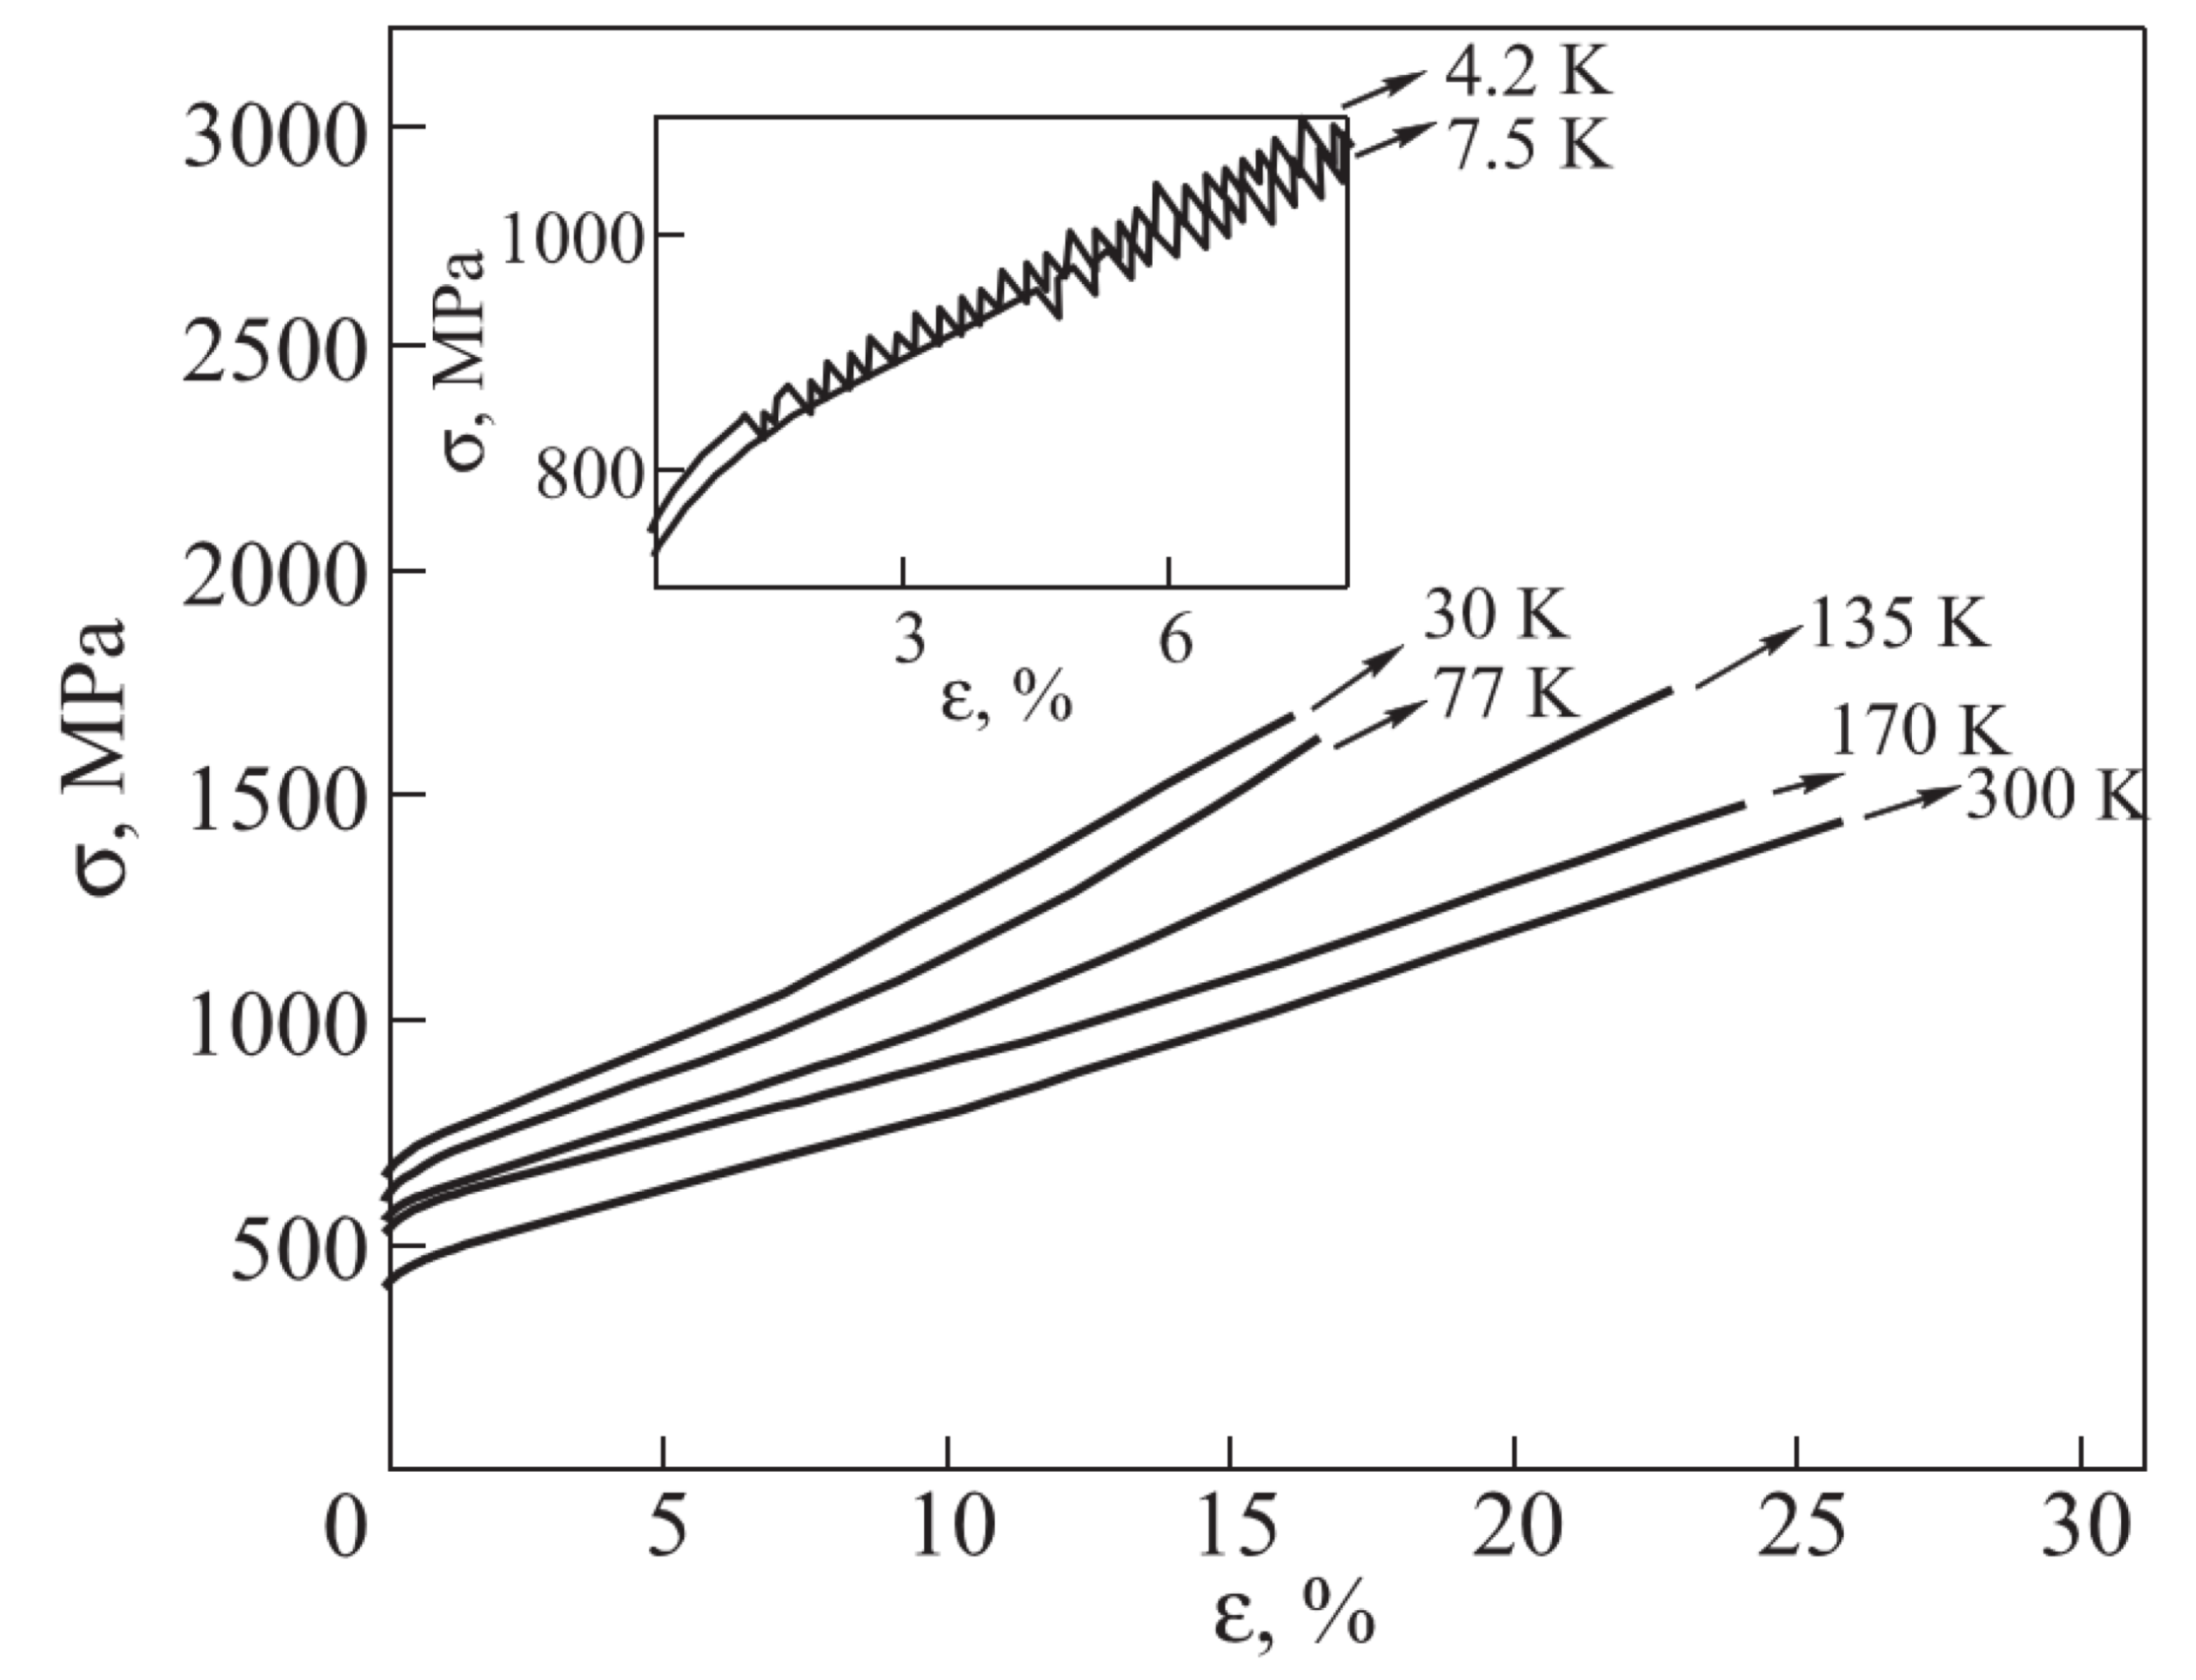
Figure 40a features a plot of the engineering stress–strain curve for the HEA tested at RT, 77 K, and 4.2 K and strain rate of 3 × 10
−4 s
−1. As can be seen, there were pronounced serrated flows at 4.2 K whereas no apparent serrations were present at temperatures of 77 K and RT. Furthermore, deformation twinning was observed in the samples tested at 4.2 and 77 K. It was also found that the ductility in the sample deformed at 4.2 K remained relatively high.
Interestingly, the authors reported that such serrated flow behavior was significantly less pronounced in pure Cu when tested at a strain rate of 3 × 10
−4 s
−1 at 4.2 K, as shown in
Figure 40b. For instance, the serration amplitude was ~150 MPa in the HEA, whereas it was only 5 MPa in the Cu metal. The significantly more pronounced serrations observed in the HEA (as compared to the pure Cu) were attributed to the impact of the solid solution in the alloy. It was also suggested that the discrepancy in the serration behavior may be a result of the differences between the properties of the material systems, such as yield strength, ultimate tensile strength, work-hardening, thermal conductivity, and heat capacity.
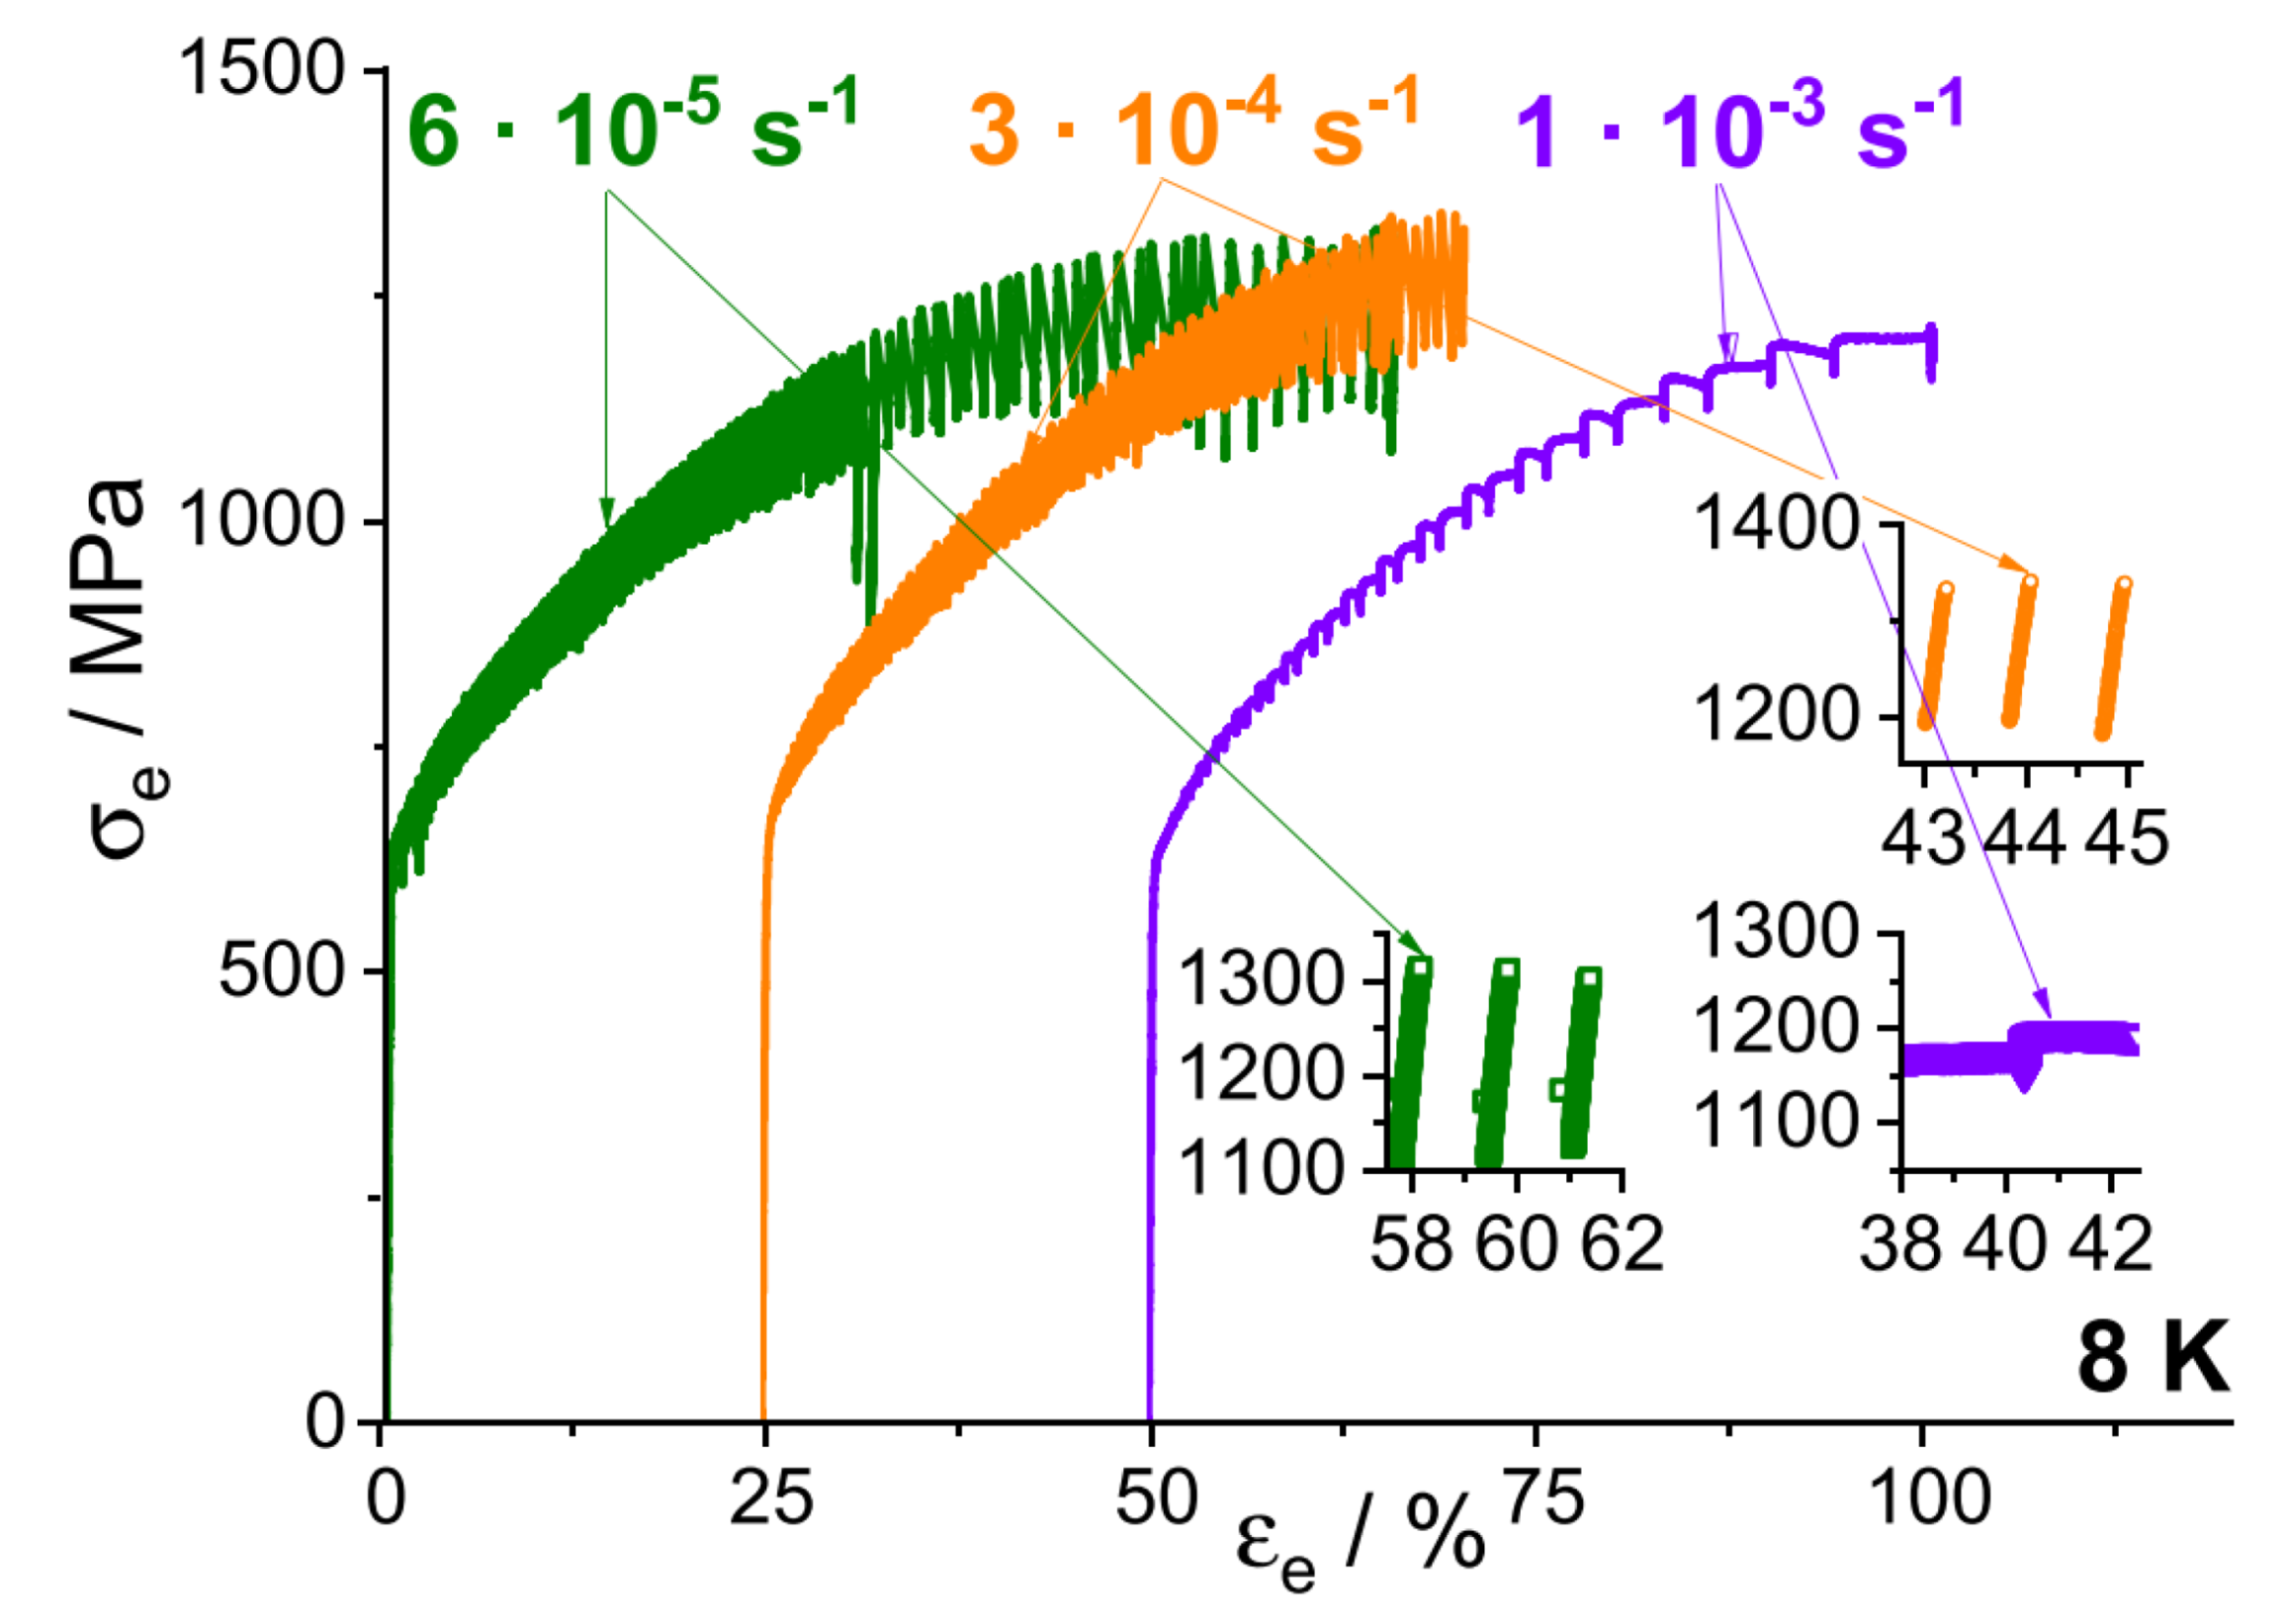
Figure 41 features the stress vs. strain data for the samples that were tested at 8 K and strain rates ranging from 6 × 10
−5 to 1 × 10
−3 s
−1. As can be observed, the characteristics of the serrated flow were affected by the strain rate. For example, the time between stress-drops apparently decreased with an increase in the strain rate. The insets of the figure suggest that, for strain rates of 6 × 10
−5 and 3 × 10
−4 s
−1, the serrated flow consisted of Type-B serrations. On the other hand, the serrations were reminiscent of Type-D behavior at the highest strain rate.
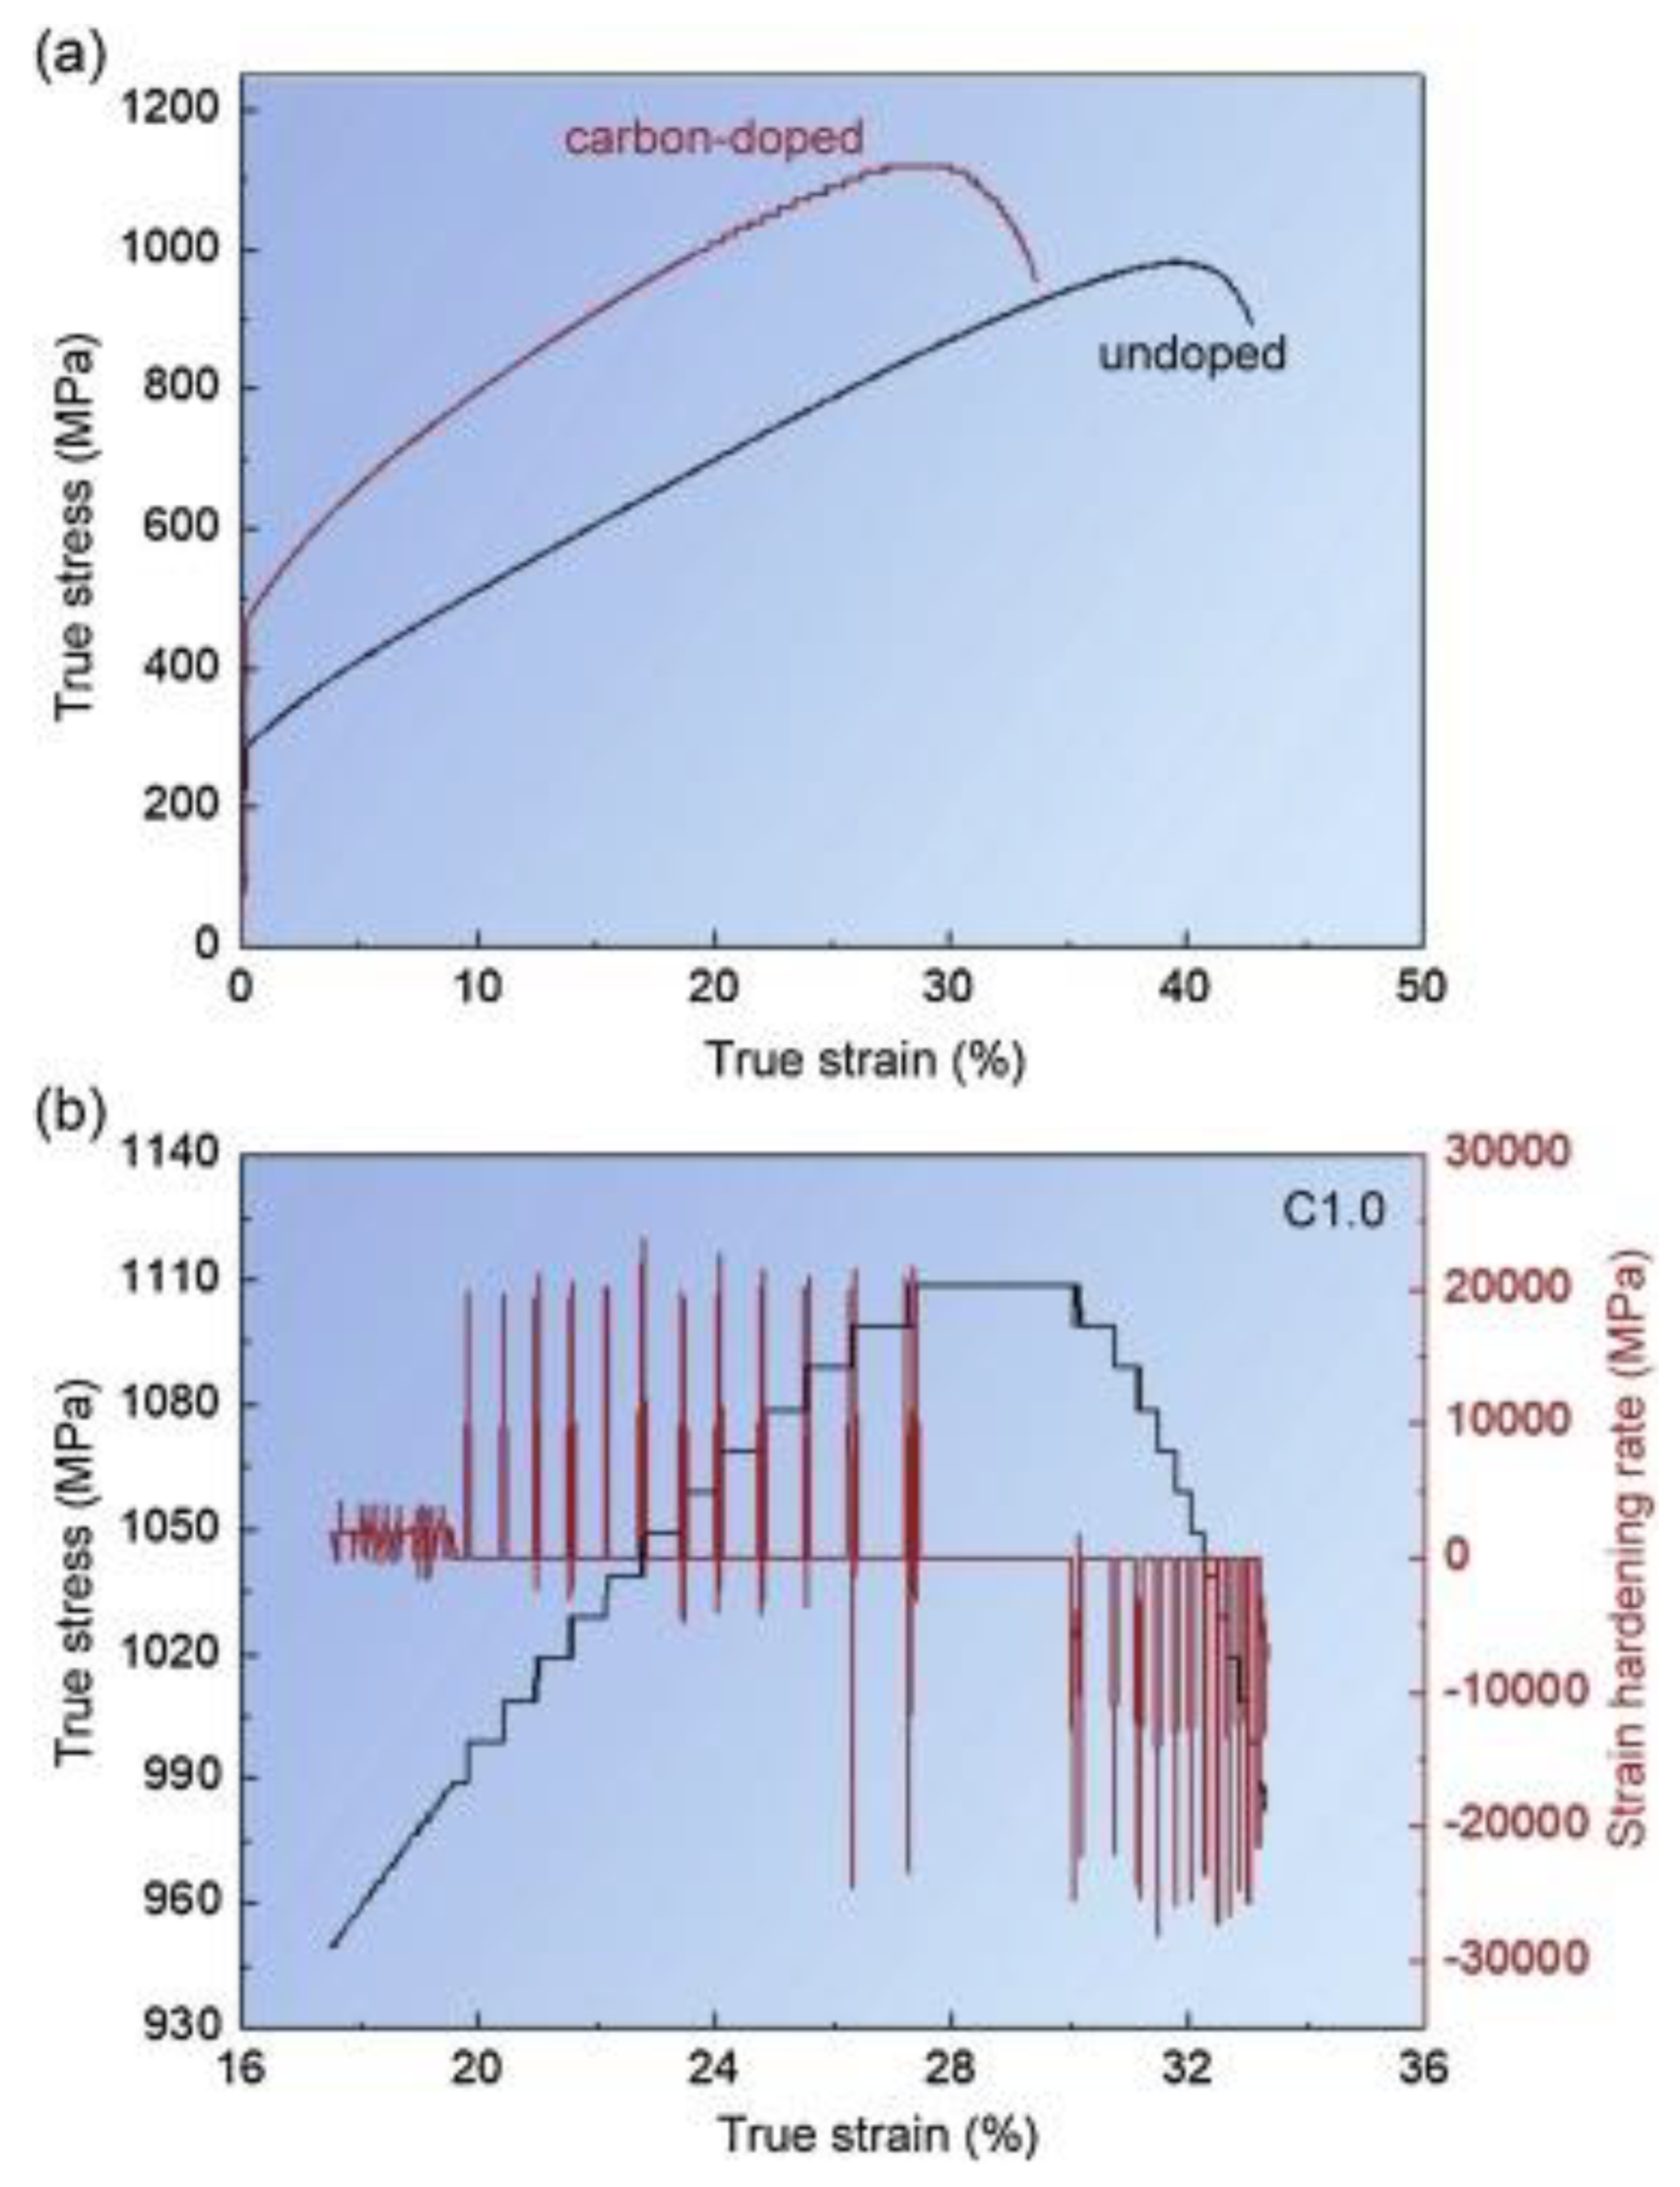
Guo et al. examined the effects of carbon impurities on the deformation behavior of a CoCrFeMnNi HEA [
192]. Here, the undoped and doped (0.93 atomic % C) samples were subjected to tension testing at RT and a strain rate of 1.6 × 10
−3 s
−1.
Figure 42a,b compares the true stress vs. strain of the carbon-doped and undoped HEA. As can be observed, serrations are clearly present in the deformation curve for the doped sample. This result is in contrast with the undoped specimen where serrations were absent. A magnified view of the serrated-flow behavior in the doped sample is displayed in
Figure 42b. Here, the serrations exhibit a stair-step type pattern. The authors reported that the serrated flow exhibited Type-A serrations, although they could have instead been Type-D serrations (see
Figure 10) [
182].
The occurrence of the serrated flow in the HEA was attributed to the interplay among the carbon, SFs, and moving dislocations. The sharp increase in the stress during a serration event corresponds to the alteration of the short-range order by the dislocations that is accompanied by the migration of C from octahedral sites to tetrahedral sites and SFs. Since it is energetically unfavorable for the C to remain in the SF, the C will hop back into the octahedral site. Consequently, the SF energy is decreased, thus resulting in the accelerated plastic deformation that is characterized by the plateau region between successive serrations.


 ,
, 


