Abstract
The effect of a ferrite/mixed phase banded structure on the fatigue crack growth behavior of pipeline steel has been investigated in this work. Constant stress-controlled fatigue tests were carried out on unilateral notch specimens in the longitudinal direction (LD) and the transverse direction (TD). The strain accumulation was measured by digital image correlation (DIC) method and the fatigue fracture morphology was analyzed. The results show that the banded structure in the LD would cause a wide range of crack deflections, especially in the early stage of fatigue crack growth, which results in a lower fatigue crack growth rate compared to the TD. At the later stage, due to the increase of the plastic zone of the crack tip, more ferrite in the crack growth path of the TD specimen is also beneficial for crack tip blunting, thereby slowing down the increase of the crack growth rate.
1. Introduction
The fatigue failure of steel used in engineering structures can cause catastrophic losses. Investigation of the fatigue crack growth behavior in steel is of great significance for further optimizing the design of high-strength, low-alloy (HSLA) steel. A lot of research works have studied the mechanism of fatigue crack propagation by using the experiment and finite element method [1,2,3]. Various microscopic mechanisms have been proposed for the fatigue crack propagation in metals, such as striation formation, microcleavage, void coalescence and intergranular separation [4], where a common crack growth mechanism is the plastic blunting process of the crack tip proposed by Laird [5]. Generally, steels with different microstructures have different fatigue crack growth characteristics. The grain type, grain size, hard phase and other factors would affect the fatigue crack growth behaviors [6,7,8]. Korda et al. found that distributed pearlite (P) structure had better fatigue crack growth resistance than networked-like pearlite structure [9]. Guan et al. found that ferrite/bainite (F/B) dual-phase microstructures could inhibit the fatigue crack propagation more effectively than ferrite/pearlite (F/P) microstructures [10]. Zhao et al. studied the fatigue properties of F/B duplex microstructure of X80 pipeline steel and found that film-like and rod-like martensite/austenite (M/A) constituents could act as effective barriers to the crack propagation [11].
The banded structure caused by segregation is a common microstructure in steel [12,13]. The banded pearlite orientation in the F/P steel has been observed to have a lower fatigue crack growth rate which was explained by the crack closure mechanism and crack tip stress shielding phenomena [14]. Ronevich et al. found that the hydrogen-induced fatigue crack growth rate perpendicular to F/P banded structure in X65 pipeline steel was lower, and the crack branching phenomenon was observed [15]. The fatigue crack growth behaviors in F/P banded structure have been the focus of previous research. However, many types of banded structures are more likely to exist in steel, such as F/B banded structure, ferrite/acicular ferrite (F/AF) banded structure, etc. [16]. There is little in the literature that refers to the fatigue crack growth behaviors of different orientations in these banded structures.
As a nondestructive deformation measurement method, the digital image correlation (DIC) method has the advantages of being a full field test and having high sensitivity, strong anti-interference ability and being multiscale, and has been widely used in failure analysis of materials [17,18,19]. In particular, many research works have investigated the effect of the banded structure on the mechanical behavior of HSLA steel by DIC. For example, the anisotropic tensile properties of the F/P banded structure were explained by the deformation field measured by DIC [20]; the effects of banded morphology and grain size on the tensile behavior of acicular ferrite HSLA steels were investigated [21]. DIC has also been used to study the microscopic mechanism of fatigue crack growth behavior of metallic materials. Carroll et al. proposed a high-resolution DIC method for strain accumulation measurement in fatigue crack propagation, and the relationship between microstructure, crack path, strain field and crack growth rate during fatigue crack growth was investigated in depth with a nickel-based superalloy [22,23]. Malitckii et al. investigated the strain accumulation during microstructurally small fatigue crack propagation in polycrystalline 18% Cr ferritic stainless steel by DIC, and found that the place and intensity of shear strain localization zones varied during the crack growth that was related closely to the local variation of crack growth rate [24]. In summary, DIC can be used to study the fatigue crack growth behavior in banded structures as an effective method.
In this paper, tensile fatigue tests for pipeline steel specimens containing the banded structure in both longitudinal direction (LD) and transverse direction (TD) were carried out. The crack path and cumulative plastic deformation during crack growth were obtained by a laser scanning confocal microscope (LSCM) and DIC method. The fracture analysis was done according to the fracture surface images captured by a scanning electron microscope (SEM). Finally, the influence of the banded structure on the fatigue crack growth behavior of pipeline steel was discussed.
2. Experimental Work
2.1. Specimen Preparation
The material used in this work was X80 pipeline steel, which was provided by Tianjin Pipe (Group) Corporation. Firstly, the as-received steel block was austenitized at 1000 °C for 30 min followed by furnace cooling using a high temperature resistance furnace. Banded structure is not the main metallographic microstructure of X80 steel but it may appear as the defect structure. Thus, the above-designed heat treatment processing was done to process the as-received steel to obtain banded structure as the research object. Then the steel block processed by heat treatment was cut into dumbbell-shaped specimens with a unilateral notch along LD and TD by wire-cutting technology. The yield strength and tensile strength of specimens in LD and TD were measured by the standard tension test. For LD specimen, the yield strength σs is 369 MPa and the tensile strength σb is 537 MPa. For TD specimen, σs is 362 MPa, σb is 503 MPa. Figure 1 shows the shape and size of specimens. The prefabricated unilateral notches of specimens were made by wire electrical discharge machining, which can ensure that the fatigue crack propagates in a direction perpendicular or parallel to the banded structure in the specimen. In addition, there were no prefabricated fatigue cracks in the specimens before tests. The fatigue specimens were ground with metallographic sandpaper and polished with 2.5 μm diamond powders, and then the surface of the specimens was etched in the 4 vol% nital solution. The micrographs of specimens were obtained by an LSCM (Olympus Lext OLS4500). Figure 2a,b shows the banded structure around notch tips of specimens, where the banded structure in the TD specimen is not obvious. Figure 2c shows the metallographic structure of the banded structure. The bright band is mainly composed of polygonal ferrite (PF), which is the soft phase. The dark band is a mixture of granular bainite (GB), degenerated pearlite (DP), M/A islands and PF, which is referred to as hard, second-phase band in the following text.
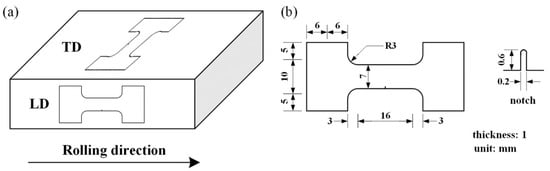
Figure 1.
(a) Illustration of the longitudinal direction (LD) and the transverse direction (TD) specimen orientations in steel; (b) the shape and dimensions of the specimen.
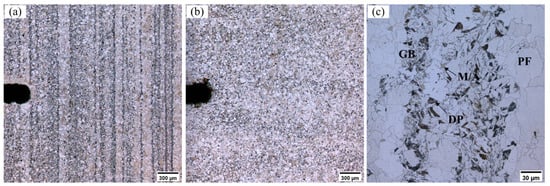
Figure 2.
Optical micrographs of specimens: (a) banded structure around the notch tip in LD; (b) banded structure around notch tip in TD; (c) micrographs of different phases in banded structure.
2.2. Experiment Procedure
The fatigue experiments for two LD and two TD specimens were carried out using an electronic fatigue testing machine (Instron ElectroPuls E10000, Norwood, MA, USA). The test was controlled by load in the pull-pull mode, the stress ratio was R = 0.1, the maximum load was 1500 N, the minimum load was 150 N, and the frequency was 15 Hz. The length of the crack during the fatigue test was measured using a graduated reading microscope every 5000 cycles. The test was interrupted when reading the crack length a, and the test machine kept the average value of the load at 825 N for a short time, which could ensure the clarity of the crack tip. When a extended to about 2.5 mm, the experiments were terminated.
In order to analyze the strain accumulation in the crack propagation process, images of the micro region along the crack path should be captured by a microscope. Because LSCM can avoid image blur caused by local off-plane displacement, it was used to capture images of the specimen surface by 10×, 20× and 50× objective lenses for four times (one time before the experiment, two times during the experiment, one time after the experiment) in this work. The specimen needed to be unloaded and placed in LSCM at each moment of the image acquisition. The size of images captured by LSCM is 1024 × 1024 pixels.
3. Results and Discussion
3.1. a-N and da/dN-a Curves
Figure 3a shows the a-N curves of specimens, where a is the crack length and N is the number of cycles. When the numbers of cycles are the same, the crack lengths of the LD specimens are shorter than that of the TD specimens. That is to say, the fatigue crack growth resistance of the LD is usually higher than the TD. Figure 3b shows da/dN-a curves in the logarithmic coordinate system, where the crack growth rate da/dN is calculated by the secant method. The linear fitting straight lines are also plotted in Figure 3b, which shows that da/dN of the LD specimen is lower than that of the TD specimen in the early stage of the crack growth. However, da/dN of the TD specimen is smaller in the later stage.
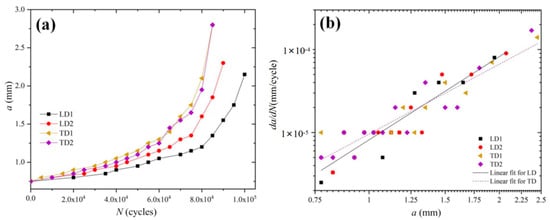
Figure 3.
(a) a-N curves; (b) da/dN-a curves.
3.2. Fatigue Crack Growth Path
The LD1 specimen and TD1 specimen are taken as two examples to analyze the fatigue crack growth path. Figure 4a is the fatigue crack growth path in the LD1 specimen when the crack length was about 1.75 mm and Figure 4b is the corresponding da/dN-a curve. Overall, the crack growth rate da/dN increases gradually as the crack length increases in Figure 4b. However, there are also some obvious deflections in this curve, which is closely related to the fatigue crack growth path in Figure 4a. Obviously, the fatigue crack path of the LD1 specimen is tortuous, and the existence of banded structure is liable to cause obvious large angle crack deflections. The uneven distribution of the grain boundary and the asymmetry of the second phase in the plastic slip near the crack tip affected the propagation direction of the crack tip, which is the main reason for the tortuous crack path. Such large angle crack deflections have been suggested to limit maximum stress intensity and cause roughness-induced crack closure [14,25]. An example of the crack deflection in the region of the rectangle is also plotted in Figure 4a. The crack deflection angle of this example is about 45°.
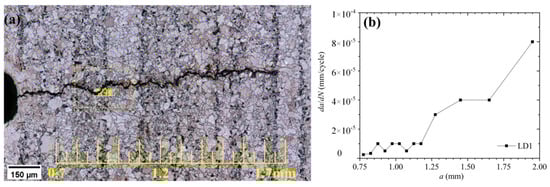
Figure 4.
(a) The crack growth path of the LD1 specimen; (b) da/dN-a curve of the LD1 specimen.
To further observe the relationship between the crack deflection and grains, the partially enlarged view of region of the rectangle in Figure 4a is shown in Figure 5. It can be clearly seen from Figure 5 that the crack tends to propagate at the grain boundaries or inside the ferrite. The significant slip phenomenon can be seen in some of the ferrite grains, indicating the slip mechanism of the fatigue crack growth process. Grain boundary, GB, DP and M/A island structure play an important role in the crack deflection when the fatigue crack extends to the hard, second-phase band. Because the banded structure caused the crack to be deflected, the crack growth rate decreases significantly at a = 0.925 mm in Figure 4b.
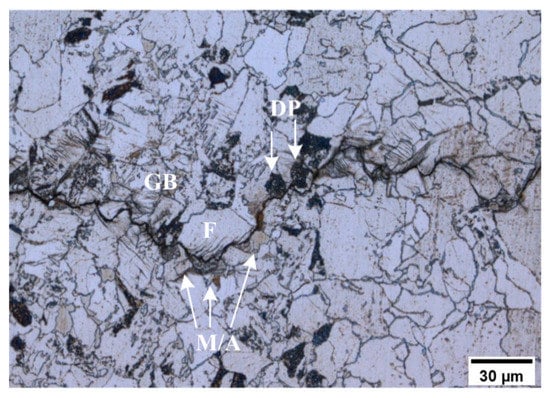
Figure 5.
The partially enlarged view of the crack path of the LD1 specimen.
Figure 6a is the fatigue crack growth path in the TD1 specimen when the crack length was about 1.75 mm and Figure 6b is the corresponding da/dN-a curve. In the early stage of the crack propagation (a < 0.95 mm), the fatigue crack path is relatively flat with respect to the LD1 specimen due to the lack of a hard phase barrier, which is manifested by a higher growth rate relative to the LD. When the crack extended from 0.75 mm to 0.9 mm, the average crack growth rates of the LD1 specimen and TD1 specimen were 5.27 × 10⁻⁶ mm/cycle and 8.33 × 10⁻⁶ mm/cycle, respectively. However, although the crack propagates within the ferrite band, there was also a certain crack deflection phenomenon. As shown in Figure 6a, the crack deflected at about a = 0.95 mm, 1.25 mm and 1.65 mm in the TD1 specimen, corresponding to the decrease in the crack growth rate in Figure 6b. The partially enlarged views of three regions of crack deflections are shown in Figure 7. Due to that more ferrite in the crack growth path of the TD1 was prone to plastic slip, a large number of slip bands are visible near the crack, which absorbed a large amount of energy, and especially the crack tip was easily plastically blunted. At the same time, it can be seen that the crack tip easily deflects and branches along the direction of the slip band, which reduced the crack growth rate. Especially in the later stage of crack growth, the plastic zone of the crack tip increased due to the increase of stress intensity factor range ΔK, which would increase the possibility of crack blunting.
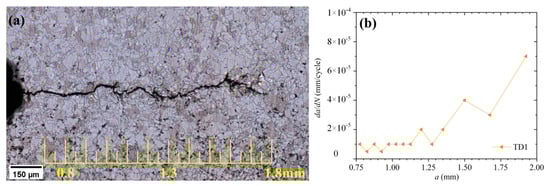
Figure 6.
(a) The crack growth path of the TD1 specimen; (b) da/dN-a curve of the TD1 specimen.
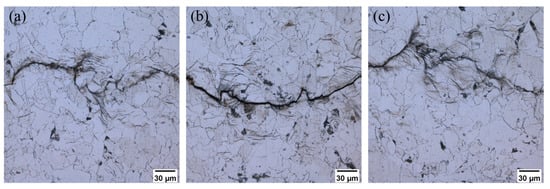
Figure 7.
The local crack path of the TD1 specimen in three crack deflection regions: (a) region around a = 0.95 mm; (b) region around a = 1.25 mm; (c) region around a = 1.65 mm.
3.3. Strain Accumulation Analysis
DIC was used to analyze the strain accumulation in the fatigue crack growth process. During DIC processing, the image before the experiment was taken as the reference image, the size of subset was set as 51 × 51 pixels, the calculation step was 3 pixels and the size of the strain calculation window was 15 × 15 pixels. The measured von Mises strain fields of regions of interest (ROI) were used to describe the strain accumulation. The LD1 specimen and TD1 specimen were taken as two examples to analyze the strain accumulation. Figure 8 shows two measured von Mises strain fields for different cycles in the crack growth process of the LD1 specimen under the 10× objective lens. It can be seen that the cumulative strain is basically symmetric along the crack, which exhibits a “V” shape at the crack tip. This phenomenon fully conforms to the strain characteristic of the crack tip. Because the ΔK of the crack tip is constantly increasing with the crack growth, the corresponding strain accumulation is also increasing and the strain near the crack growth path is larger than that in other regions. As shown in Figure 8, as the crack length increases, the area where the strain accumulates becomes larger and larger. And after the crack passes through a region, the cumulative strain of this region substantially unchanged although the crack continues to propagate (e.g., region A and region B). Moreover, the strain accumulation periodically increases and decreases along the crack growth path. The strain values in A, B and C regions are relatively larger than that in the D and E regions. It can be seen by the metallographic structure that the regions with larger strain values tend to exist in ferrite bands, while the regions where the hard, second-phase bands located tends to be strain suppressed. The strain accumulation distribution is closely related to the banded structure. The main reason for this phenomenon is the difference in the plastic slip deformation ability of grains in the two kind bands. The hard, second-phase band has a high resistance to the plastic deformation, which makes the slip zone in the crack growth process blocked.
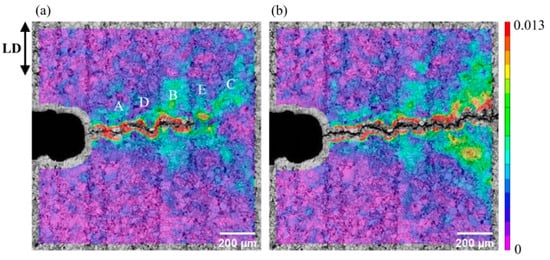
Figure 8.
Von Mises strain fields of the LD1 specimen under 10× objective lens: (a) a = 1.2 mm, N = 80,000 cycles; (b) a = 1.75 mm, N = 95,000 cycles.
To analyze the strain accumulation at a smaller scale, Figure 9 shows two von Mises strain fields of the region around a = 1.05 mm for different cycles under the 50× objective lens. ROI is mostly in the hard, second-phase band. Obviously, the strain concentration is often at the ferrite matrix inside the hard, second-phase band (positions 1, 1′, 2 and 2′). While the GB and DP are of small strain values (approximately 0.0003 to 0.008 in Figure 9a and 0.005 to 0.011 in Figure 9b), indicating that they have strong resistance to deformation. These hard phases were often avoided during the crack growth, which tended to cause tortuous crack growth paths. At position 3 in Figure 9b, DIC calculation is out of correlation due to the obvious slip bands on ferrite.
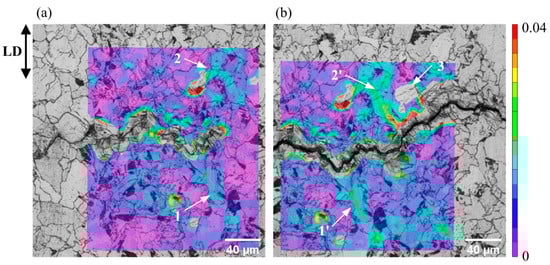
Figure 9.
Von Mises strain fields of the LD1 specimen under 50× objective lens: (a) a = 1.2 mm, N = 80,000 cycles; (b) a = 1.75 mm, N = 95,000 cycles.
To analyze the cumulative strain distribution on the band interface, Figure 10 shows two measured von Mises strain fields under 95,000 and 100,000 cycles in the crack growth process of the LD1 specimen under the 20× objective lens. ROI is around a = 1.75 mm. When N = 95,000 cycles, the crack tip was just in the hard, second-phase band as shown in Figure 10a. Obviously, the cumulative strain values at the band interface such as regions 1 and 2 are relative larger than that in the adjacent hard, second-phase band. The cumulative strain values of region 1 in Figure 10b are basically the same as that in Figure 10a, while the cumulative strain values of region 2 in Figure 10b increased compared to that in Figure 10a. The main reason for this phenomenon is that the stress state of the crack tip is most closely related to the strain accumulation while the cumulative strain values at a cracked region are basically substantially unchanged. Region 1 is behind the crack tip both in Figure 10a,b, while region 2 is in front of the crack tip in Figure 10a. Figure 11 shows von Mises strain values of the dotted line in Figure 10 under 95,000 and 100,000 cycles. The abscissa represents the serial number of pixel points selected on the dotted line from left to right. Figure 11 clearly reflects the uneven distribution of strain due to the presence of banded structure and strain accumulation between different bands. The crack propagation was delayed due to the blocking action of the hard band before the crack split it, and the crack tip generated the strain accumulation concentration at the interface between bands. When the crack tip entered the hard band, the strong resistance to plastic deformation of the hard phases would make the crack tip relatively sharp, so the stress concentration effect was relatively strong. Then, when the crack tip passed through the hard band and entered the ferrite band with better plasticity, the crack tip stress would quickly relax with the strong plastic deformation of ferrite, and even crack bifurcation would occur. Thereby a more obvious “V”-shaped cumulative strain distribution is produced at the inter-band interface (region 2′ and region 3).
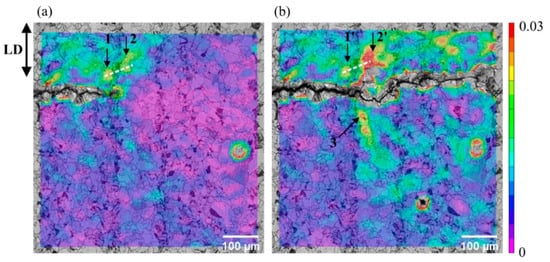
Figure 10.
Von Mises strain fields of the LD1 specimen under a 20× objective lens: (a) a = 1.75 mm, N = 95,000 cycles; (b) a = 2.15 mm, N = 100,000 cycles.
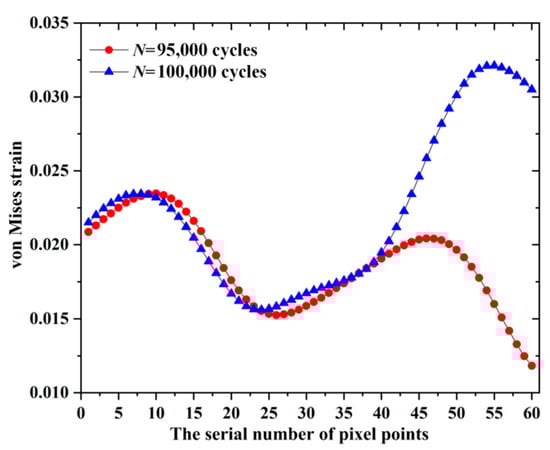
Figure 11.
Von Mises strain values of the dotted line in Figure 10.
Figure 12 shows the cumulative von Mises strain distribution of the TD1 specimen under different cycles using a 10× objective lens. The cumulative strain fields are basically symmetric and increase relatively uniformly with the crack propagation. The distribution of “V”-shape strain concentration regions are more dispersed than that of the LD1 specimen. That is mainly due to the distribution of uniform ferrite around the crack path. The better plasticity of ferrite is prone to alleviate the stress concentration at the crack tip.
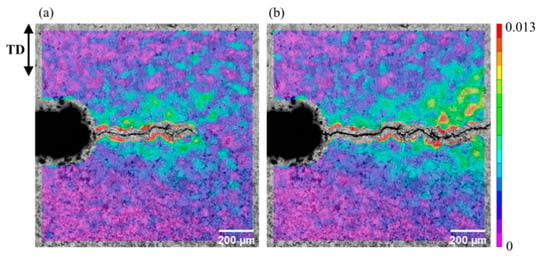
Figure 12.
Von Mises strain fields of the TD1 specimen under a 10× objective lens: (a) a = 1.25 mm, N = 55,000 cycles; (b) a = 1.75 mm, N = 75,000 cycles.
Figure 13 shows the cumulative von Mises strain distribution of the TD1 specimen under different cycles using a 20× objective lens. Figure 13a is the strain field around the crack tip when a = 1.25 mm. Figure 13b and c are the strain fields of different region of the specimen when a = 1.75 mm. Figure 13d is the strain field around the crack surface when a = 2.80 mm. It can be seen that the large plastic deformation occurred at the crack tip (Figure 13a,c), resulting in a decorrelated effect of the DIC calculation. Since the plastic deformation of the crack tip is favorable for the crack tip blunting, the crack tip stress is also relaxed, and the strain concentration zone around the crack tip is relatively dispersed. This would slow the growth of the crack growth rate. Figure 14 reflects the same phenomenon as Figure 13. The plastic deformation of the crack tip leads to the large-scale decorrelation and the more dispersed distribution of the strain concentration regions.
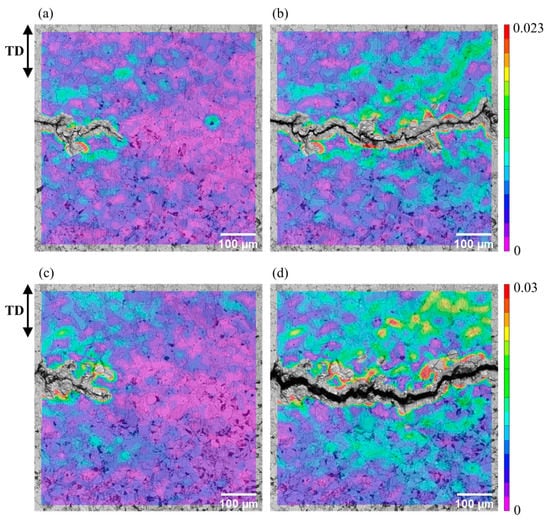
Figure 13.
Von Mises strain fields of the TD1 specimen under a20× objective lens: (a) a = 1.25 mm, N = 55,000 cycles; (b) a = 1.75 mm, N = 75,000 cycles; (c) a = 1.75 mm, N = 75,000 cycles, crack tip region; (d) a = 2.80 mm, N = 85,000 cycles.
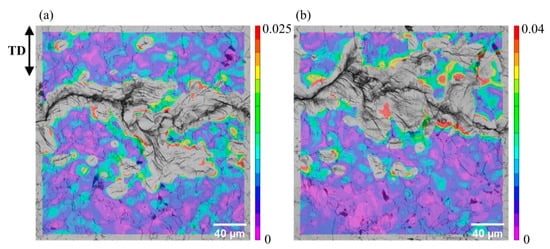
Figure 14.
Von Mises strain fields of the TD1 specimen under a 50× objective lens: (a) a = 1.25 mm, N = 55,000 cycles; (b) a = 1.75 mm, N = 75,000 cycles.
In order to study the strain accumulation with different directions of banded structure, more bands need to be shown in the strain field. The images with von Mises strain fields under a 10× objective lens were selected. As shown in Figure 8b and Figure 12b, under the same crack length (a = 1.75 mm) and load conditions, set the maximum strain scales for both the LD and TD as 0.013. It can be seen that the LD has a more obvious strain concentration effect.
3.4. Fatigue Fracture Surface Analysis
Figure 15 shows the fatigue fracture surface morphology of the LD1 specimen and TD1 specimen acquired by a SEM (ZEISS EVO MA15, Germany) with a 1.50 k× magnification (the arrow indicates the positions of the secondary microcracks) at a < 1 mm. The fracture surface of the TD1 specimen is relatively regular and the number of secondary microcracks is fewer than that of the LD1 specimen. The fracture surface of the LD1 specimen is slightly messy, which is caused by the change of crack growth path due to the easy occurrence of hard phases.
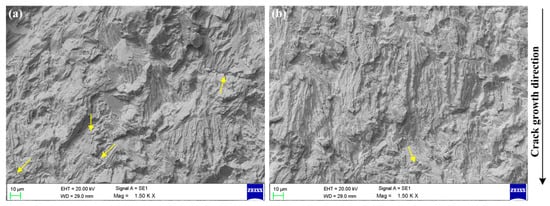
Figure 15.
Fatigue fracture surface morphologies at a < 1 mm: (a) LD1 specimen; (b) TD1 specimen.
Figure 16 shows the fatigue fracture surface morphology of the LD1 specimen and TD1 specimen at a > 1 mm. It can be seen that as a increases, both of two specimens have more secondary microcracks. The direction of the microcracks is perpendicular to the growth direction of main crack. Especially, although there was less hard phase blocking in the TD1 specimen, the secondary microcracks in the fracture surface gradually increased in the later stage of the crack growth and the plastic blunting effect at the crack tip was more obvious.
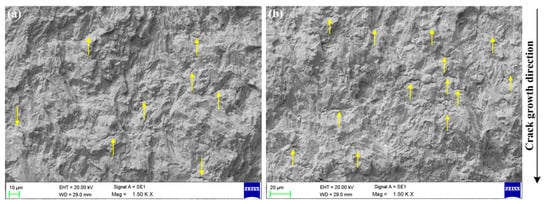
Figure 16.
Fatigue fracture surface morphologies at a > 1 mm: (a) LD1 specimen; (b) TD1 specimen.
Figure 17 shows both obvious fatigue striations and secondary microcracks in the fracture surface of the TD1 specimen under 5.00 k× magnification, indicating a significant slip mechanism during crack growth progress.
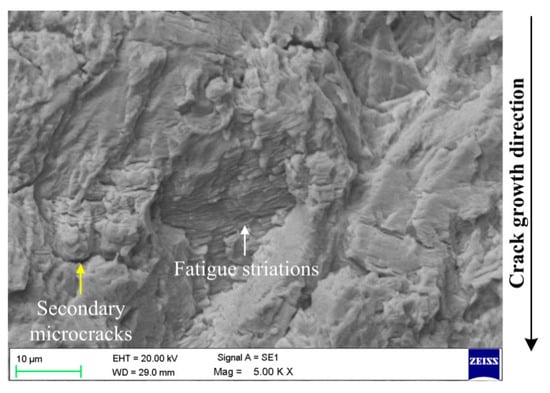
Figure 17.
Fatigue striations and secondary microcracks.
The above fracture surface analysis showed that at the initial stage of crack propagation the TD had a regular surface with less secondary microcracks while the LD had a more chaotic surface with more secondary microcracks. With the crack propagates, the density of secondary microcracks in the LD and TD both increased, and the number of secondary microcracks showed no significant difference. The banded structure had more effects in the early stage of crack propagation.
3.5. Discussion
According to the above-mentioned analysis, the fatigue crack growth behavior of the pipeline steel with banded structure is different in the LD and TD. In the LD, the alternating presence of ferrite and hard, second-phase bands in the fatigue crack growth path causes the deflection of the crack, which would suppress the crack growth. In the TD, the lack of the hard phase (such as GB, DP or M/A island) is easy to produce a smooth crack growth path, which should result a higher growth rate than the LD. However, with the increase of ΔK, more ferrite is easy to cause large plastic deformation at the crack tip, thereby alleviating the stress concentration, causing crack deflection and blunting and then slowing the growth rate of crack. Therefore, the advantage of the fatigue crack growth resistance of the LD specimens relative to the TD specimens is mainly reflected in the initial stage of crack growth. Meanwhile, although the LD is more likely to cause large-scale deflection of the crack, the number of deflections is relatively small, resulting that the arrestment effect on fatigue crack growth relative to the TD is not significant. Overall, the fatigue performance difference between the LD and TD is small under the load condition in this work. In addition, we have also done another three group tests to verify the repeatability of the results. The results of the verification tests are basically in accordance with the results analyzed in this section.
4. Conclusions
The fatigue crack propagation behavior in the ferrite/mixed phase banded structure of pipeline steel was analyzed in this work. The main conclusions are as follows: The crack perpendicular to the banded structure in the LD fatigue test is prone to deflect to reduce the crack tip driving force for fatigue crack growth. In the TD fatigue test, the growth path of the crack in the ferrite band parallel to the banded structure is smoother in the early stage of the crack growth. But the crack tip blunting and deflection occur at the later stage of the crack growth to slow the crack growth rate. The strain accumulation field indicates that the hard, second-phase band in the LD has a strong resistance to plastic deformation, and the stress concentration effect of crack tip in the TD is slightly lower than that in the LD because of more ferrite in the crack path in the TD. Especially in the early stage of crack growth, the fracture morphology of the LD is more complicated, indicating that more crack deflection occurs. Overall, although the banded structure usually causes the significant anisotropy of the mechanical behavior of steels, the fatigue performance difference between the LD and TD is small under the load condition in this work. Just from the a-N curve, with the same load and cycle times the crack growth length of the LD is less than the TD. That is to say, the LD is more resistant to crack propagation than the TD. The fatigue performance of the LD is slightly better than the TD.
Author Contributions
Methodology, N.Z. and Z.H.; experimental work, N.Z. and Z.H.; investigation, N.Z. and X.Z.; writing—original draft preparation, N.Z.; writing—review and editing, Z.H. and X.Z. All authors have read and agreed to the published version of the manuscript.
Funding
This research was funded by the National Natural Science Foundation of China, grant number 11872275.
Conflicts of Interest
The authors declare no conflict of interest.
References
- Lesiuk, G.; Smolnicki, M.; Rozumek, D.; Krechkovska, H.; Student, O.; Correia, J.; Mech, R.; De Jesus, A. Study of the Fatigue Crack Growth in Long-Term Operated Mild Steel under Mixed-Mode (I plus II, I plus III) Loading Conditions. Materials 2020, 13, 16. [Google Scholar] [CrossRef]
- Zhang, L.; Wu, X.; Liu, J. Computation of residual stress intensity factors induced by single overload during fatigue crack growth. J. Mech. Strength. 2011, 33, 432–437. (In Chinese) [Google Scholar]
- Rozumek, D.; Marciniak, Z. Fatigue crack growth in AlCu4Mg1 under nonproportional bending-with-torsion loa Pennsylvania ding. Mater. Sci. 2011, 46, 685–694. [Google Scholar] [CrossRef]
- Richards, C.; Lindley, T. The influence of stress intensity and microstructure on fatigue crack propagation in ferritic materials. Eng. Fract. Mech. 1972, 4, 951–978. [Google Scholar] [CrossRef]
- Laird, C. The influence of metallurgical structure on the mechanisms of fatigue crack propagation. In Fatigue Crack Propagation; ASTM International: Pennsylvania, PA, USA, 1967. [Google Scholar]
- Laurito, D.; Baptista, C.; Torres, M.; Abdalla, A. Microstructural effects on fatigue crack growth behavior of a microalloyed steel. Procedia. Eng. 2010, 2, 1915–1925. [Google Scholar] [CrossRef]
- Mutoh, Y.; Korda, A.A.; Miyashita, Y.; Sadasue, T. Stress shielding and fatigue crack growth resistance in ferritic-pearlitic steel. Mater. Sci. Eng. A 2007, 468, 114–119. [Google Scholar] [CrossRef]
- Mutoh, Y.; Radhakrishnan, V. Effect of yield stress and grain size on threshold and fatigue limit. J. Eng. Mater. Technol. 1986, 108, 174–178. [Google Scholar] [CrossRef]
- Korda, A.A.; Miyashita, Y.; Mutoh, Y.; Sadasue, T. Fatigue crack growth behavior in ferritic-pearlitic steels with networked and distributed pearlite structures. Int. J. Fatigue 2007, 29, 1140–1148. [Google Scholar] [CrossRef]
- Guan, M.F.; Yu, H. In-situ investigation on the fatigue crack propagation behavior in ferrite-pearlite and dual-phase ferrite-bainite low carbon steels. Sci. China-Technol. Sci. 2013, 56, 71–79. [Google Scholar] [CrossRef]
- Zhao, Z.P.; Qiao, G.Y.; Li, G.P.; Yang, W.W.; Liao, B.; Xiao, F.R. Fatigue properties of ferrite/bainite dual-phase X80 pipeline steel welded joints. Sci. Technol. Weld. Join. 2017, 22, 217–226. [Google Scholar] [CrossRef]
- Majka, T.F.; Matlock, D.K.; Krauss, G. Development of microstructural banding in low-alloy steel with simulated Mn segregation. Metall. Mater. Trans. A 2002, 33, 1627–1637. [Google Scholar] [CrossRef]
- Verhoeven, J.D. A review of microsegregation induced banding phenomena in steels. J. Mater. Eng. Perform. 2000, 9, 286–296. [Google Scholar] [CrossRef]
- Korda, A.A.; Mutoh, Y.; Miyashita, Y.; Sadasue, T.; Mannan, S.L. In situ observation of fatigue crack retardation in banded ferrite-pearlite microstructure due to crack branching. Scr. Mater. 2006, 54, 1835–1840. [Google Scholar] [CrossRef]
- Ronevich, J.A.; Somerday, B.P.; San Marchi, C.W. Effects of microstructure banding on hydrogen assisted fatigue crack growth in X65 pipeline steels. Int. J. Fatigue 2016, 82, 497–504. [Google Scholar] [CrossRef]
- Shi, L.; Yan, Z.S.; Liu, Y.C.; Yang, X.; Qiao, Z.X.; Ning, B.Q.; Li, H.J. Development of ferrite/bainite bands and study of bainite transformation retardation in HSLA steel during continuous cooling. Met. Mater. Int. 2014, 20, 19–25. [Google Scholar] [CrossRef]
- Dai, X.; Yang, F.; Wang, L.; Zhang, D.; Pu, Q.; He, X. Load capacity evaluated from fracture initiation and onset of rapid propagation for cast iron by digital image correlation. Opt. Lasers Eng. 2013, 51, 1092–1101. [Google Scholar] [CrossRef]
- Song, H.; Bai, Z.; Zhang, H.; Niu, Y.; Leen, S.B. Effect of pre-corrosion on damage evolution and crack propagation in aluminum alloy 7050-T7651. Fatigue Fract. Eng. Mater. Struct. 2018, 41, 2376–2390. [Google Scholar] [CrossRef]
- Yu, L.; Pan, B. Experimental study of tensile properties and deformation evolutions of 2D and 2.5D woven SiO2f/SiO2 composites using single-camera stereo-digital image correlation. Compos. Struct. 2018, 200, 589–598. [Google Scholar] [CrossRef]
- Zhang, X.; Wang, Y.; Yang, J.; Qiao, Z.; Ren, C.; Chen, C. Deformation analysis of ferrite/pearlite banded structure under uniaxial tension using digital image correlation. Opt. Lasers Eng. 2016, 85, 24–28. [Google Scholar] [CrossRef]
- Ren, C.H.; Zhang, X.C.; Ji, H.W.; Zhan, N.; Qiao, Z.X. Effect of banded morphology and grain size on the tensile behavior of acicular ferrite in HSLA steel. Mater. Sci. Eng. A 2017, 705, 394–401. [Google Scholar] [CrossRef]
- Carroll, J.D.; Abuzaid, W.; Lambros, J.; Sehitoglu, H. High resolution digital image correlation measurements of strain accumulation in fatigue crack growth. Int. J. Fatigue 2013, 57, 140–150. [Google Scholar] [CrossRef]
- Carroll, J.D.; Abuzaid, W.Z.; Lambros, J.; Sehitoglu, H. On the interactions between strain accumulation, microstructure, and fatigue crack behavior. Int. J. Fract. 2013, 180, 223–241. [Google Scholar] [CrossRef]
- Malitckii, E.; Remes, H.; Lehto, P.; Yagodzinskyy, Y.; Bossuyt, S.; Hanninen, H. Strain accumulation during microstructurally small fatigue crack propagation in bcc Fe-Cr ferritic stainless steel. Acta Mater. 2018, 144, 51–59. [Google Scholar] [CrossRef]
- Suresh, S. Fatigue crack deflection and fracture surface contact: Micromechanical models. Metall. Trans. 1985, 16, 249–260. [Google Scholar] [CrossRef]


© 2020 by the authors. Licensee MDPI, Basel, Switzerland. This article is an open access article distributed under the terms and conditions of the Creative Commons Attribution (CC BY) license (http://creativecommons.org/licenses/by/4.0/).