Abstract
Cold gas-dynamic spray is a solid-state materials consolidation technology that has experienced successful adoption within the coatings, remanufacturing and repair sectors of the advanced manufacturing community. As of late, cold spray has also emerged as a high deposition rate metal additive manufacturing method for structural and nonstructural applications. As cold spray enjoys wider recognition and adoption, the demand for versatile, high-throughput and significant methods of particulate feedstock as well consolidated materials characterization has also become more notable. In order to address the interest for such an instrument, nanoindentation is presented herein as a viable means of achieving the desired mechanical characterization abilities. In this work, conventionally static nanoindentation testing using both Berkovich and spherical indenter tips, as well as nanoindentation using the continuous stiffness measurement mode of testing, will be applied to a range of powder-based feedstocks and cold sprayed materials.
1. Introduction
Originally developed in its modern form at the Institute of Theoretical and Applied Mechanics in Russia during the late twentieth century, cold gas-dynamic spray (cold spray) is a powder-fed solid-state materials consolidation technology [1]. Specifically, the particulate feedstock is mobilized by way of a heated carrier gas jet until leaving the end of a de Laval nozzle and impacting a substrate at supersonic velocity and strain rates that can be greater than the range associated with ballistic phenomena. Figure 1 depicts the cold spray process from the vantage point of a metallurgist rather than a manufacturing engineer [2]. Initially adopted and conceived of as a utilitarian technology that would enable the application of nearly fully dense to completely dense coatings with application-driven performance specifications, the cold spray process garnered well-received attention from the reclamation, repair, and remanufacturing communities [3], as well as the advanced and additive manufacturing sectors [4]. Though particle–substrate bonding is a critical and integral aspect of achieving high-quality material consolidations, particle–particle bonding must also occur as the deposition process continues layer-by-layer. Therefore, effective consolidation not only requires particle–substrate bonding, but also mechanical and metallurgical particle–particle bonding [5].
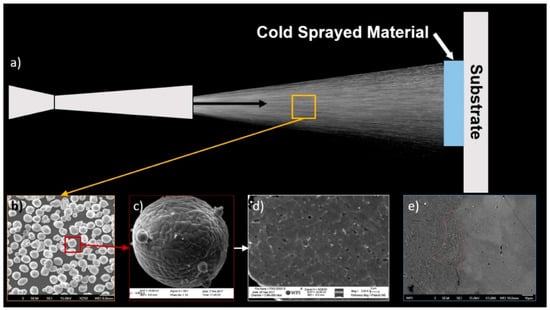
Figure 1.
Cold spray process depiction with gas-atomized Al 6061 feedstock. (a) is a schematic overview of the cold spray process; (b) presents an SEM micrograph of the powder; (c) is an SEM micrograph of the surface of a single particle; (d) illustrates a SEM micrograph showing the internal microstructure of a single particle following cross-sectional preparation; and (e) captures a SEM micrograph showing the microstructure at the cold sprayed particle–substrate interface.
With respect to the processing parameters associated with cold spray, consideration must be given to not only the nozzle material type (e.g., polybenzimidazole (PBI) or tungsten-carbide) but also the selection of feedstock composition and carrier gas source, among other matters of importance. In general, nitrogen and/or helium, which are both inert gases, are used during the cold spray deposition process. In so far as the particulate feedstock is concerned, typical particle diameters range from approximately 5 to 100 μm, and achieve particle velocities between 300 and 1200 m/s. In fact, multiple types of materials can be deposited via cold spray parameter optimization, including polymers, composites, pure metals and alloys, in accordance with a given application and the required part performance specifications and operational conditions [5]. Given the scope of this research, metallic materials will be focused upon.
Due to the fact that cold spray is classified as a solid-state process under the umbrella of thermal spray technologies, the characteristics and properties of the feedstock powder directly effects and influences the performance and behavior of the resultant component [6,7]. Consequently, it is essential that the feedstock properties are understood and controlled prior to deposition and consolidation through cold spray processing. Researchers have made a concerted effort to control and modify the properties of metallic feedstock particulates via microstructural manipulation through the use of thermal pre-processing, de-gassing, and ball-milling, among other approaches [8,9,10,11,12,13]. Where thermal pre-processing of the feedstock powder is concerned, the temperatures and times associated with heat treating powder need customization given the more rapid kinetics associated with rapidly solidified and highly non-equilibrium powder versus their bulk (cast or wrought) counterparts [14,15]. Ball-milling has been used to achieve modified internal particulate microstructures through the introduction of reinforcement constituents within microparticles [16] and has also enabled nanocrystalline and ultra-fine-grained powders to be obtained for cold spray applications [17]. However, elevated temperature pre-processing of a given feedstock material has allowed for the control of precipitates, dispersoids, grain size, and the removal of oxides and hydroxides, thus changing the properties of a given powder. Powder pre-processing has enabled increased deposition efficiency, increased coating toughness as well as ductility, and more [18].
Numerous feedstock production techniques have previously been industrialized for cold spray applications. The manufacturing methods for powder production can be classified as either mechanical or chemical. Mechanical methods include atomization, milling, and mechanical alloying, and includes the breakup of high-strength metals into powders, or the creation of powders from a molten pool. Electrolysis and reduction are two methods that are considered chemical in nature, producing powders by way of isolating elemental metal from an oxidized metal, for example, or via the isolation and purification of salts from a solution [19,20]. Given the nature of chemical methods, they yield powders with remarkably high purity, but are restricted by a limited rate of manufacturing, prohibitively great expenditures, and ecological concerns. Hence, mechanical means of production are favored at an industrialized scale [20]. When contemplating the mechanical fabrication of metal powders for cold spray, atomization procedures are frequently employed, as they have high production rates and deliver the most adaptable particle-size distributions (PSD) [20].
Metal atomization disperses molten metal liquid into fine droplets, which undergo rapid solidification and therefore form as powder particles with micrometric diameters. Atomization yields powder with a controllable PSD. The most common technique is that of fluid-based atomization, where the liquid metal is transformed into discrete droplets by way of a high-pressure gas or water stream [21]. Such powders are characterized by PSD that are log-normal, lower particle surface areas, and a small amount of porosity. Contingent upon the fluid medium used, PSD and morphologies will range from small and spherical to relatively large and non-spherical. Water atomization, for example (often used with ferrous materials due to cost-effective production), results in non-spherical powder with notably high oxygen concentrations at or near the particle surface [20].
Cold spray been adopted to some extent throughout many global manufacturing sectors of the international economy. Contact killing/inactivating and antipathogenic surfaces have been manufactured using copper cold spray [22,23,24]. Stints for the medical community have been fabricated using cold spray too [25,26,27,28]. Additional efforts have centered upon cold spray for solar energy applications [29]. Cold spray has also been used for innumerable defense-based purposes. Concerning the corrosion accompanying magnesium aircraft parts commissioned by the U.S. Naval force, as well as the U.S. Army, cold spray has reclaimed and repaired parts [5]. Cold spray was utilized by the U.S. Department of Defense for the production of electromagnetic interference shielding systems as well [5]. Similarly, gun barrel liners have been manufactured using refractory metal cold spray [30].
With the aforementioned background in mind, consideration of prior work and the importance and challenges associated with the mechanical evaluation of powders will now be given herein. Prior to the introduction of cold spray to the research community within the United States, attention was being given to the prospect of using microindentation and Vickers hardness testing for the evaluation of the mechanical properties of single metal particles. In fact, Shives and Smith, two research personal from National Institute of Standards and Technology (NIST), published a report that highlighted the fundamental limitations and problems with microindentation testing of metal particles [31]. During the course of the work described in [31], they considered the following mounting materials: poly(methyl methacrylate) (PMMA), epoxy, glass filled diallyl phthalate, wood flour filled phenolic resin, copper filled epoxy, silicon carbide fiber filled diallyl phthalate, and electrodeposited copper. When testing slightly alloyed nickel powder particles at 0.01 kgf in the wood flour phenolic resin, copper filled epoxy and glass filled diallyl phthalate, Shives and Smith found measurements to be “questionable” at best and fundamentally “inadequate” at 0.025 kgf. Surprisingly, conventional microhardness testing has persisted within the powder research community after Shives and Smith published their findings in the 1980s.
In light of the fact that micro-hardness testing has remained a method of powder characterization within some subsets of the global cold spray community, this work aims to demonstrate the need for fine-tuned nanoindentation procedures, especially dynamic protocols, for powder property evaluation through nanoindentation means. Additional consideration will also be given to the following: the use of dynamic single-particle powder compression testing for the evaluation of mechanical properties as a function of compressive strain; the implications of properly measured particle properties for the cold spray process; linkages between the powder properties and consolidated cold spray materials consolidations; and the nanoindentation-based nanomechanical assessment of consolidated cold spray coatings and materials as well.
2. Materials and Methods
During the course of this work, tens of different gas-atomized cold spray feedstock particulate systems were procured from an array of vendors. The vendors have been anonymized with labels such as Company A, Company B, etc., to ensure that readers are dissuaded from being influenced in so far as selecting a manufacturer or supplier for their own work is concerned. The use of an anonymizing substitute also enabled the authors to follow the implications of the data collected as well as the integrity of the data provided by the vendors in terms of its scientific merit in light of the implications of this original research article without being preoccupied with how the findings reported herein would affect commercial entities within the cold spray and powder metallurgy research community.
In any case, the gas-atomized Al 2024, Al 6061 and Al 7075 powders from Company B were mechanically sieved in accordance with relevant ASTM standards achieving PSD with ’s, ’s, and ’s reported in Table 1 of the Results and Discussion section. In statistical terms, signifies that 10% of the particles are smaller than this value, while signifies that 50% of the particles are smaller than the respective value prescribed to particle diameter, and the signifies the fact that 90% of the particles within a given powder are smaller than the associated value.

Table 1.
PSD characteristics for three of the alloyed Al powders from Company B studied herein.
Given the common use of Al feedstock during cold spray materials consolidation processing, particular details surrounding the Al 2024, Al 5056, Al 6061, and Al 7075 rapidly solidified and gas-atomized powders from Company B were reported upon while such detail was limited for the 10′s of other powders utilized herein unless the information was readily relevant to the interpretation of the observations. Accordingly, the compositions of the four gas-atomized alloyed Al powders from Company B were chemically evaluated using direct current plasma emission spectroscopy and inert gas fusion as performed by Luvak, Inc. (Boylston, MA, USA). The chemical composition of each of the four gas-atomized feedstocks mentioned are presented in Figure 2. Figure 2 also captures scanning electron microscopy (SEM) micrographs of the relevant gas-atomized powders. SEM was performed using a Zeiss Evo MA-10 series SEM (Oberkochen, Baden-Württemberg, Germany).
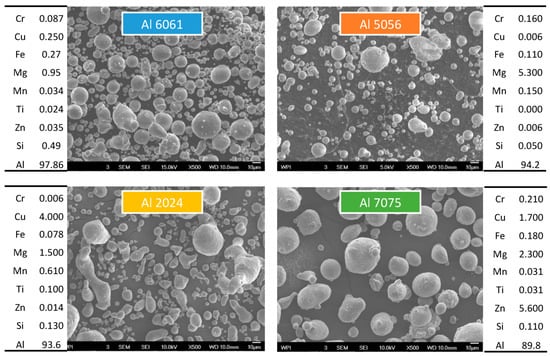
Figure 2.
Chemistry associated with four of the gas-atomized alloyed Al powders studied herein.
Dynamic nanoindentation was performed via the continuous stiffness measurement (CSM) technique. For the most part, CSM nanoindentation was performed using an iMicro Pro from Nanomechanics, Inc. (Oak Ridge, TN, USA), which is now part of KLA Instruments (KLA, Milpitas, CA, USA). The iMicro Pro was equipped with the InForce 50 mN electromotive actuator. To perform nanoindentation upon the particulates, powder was mounted in numerable materials and identified in the context of the Results and Discussion, wherein subsequent findings and data are presented and contextualized. That being said, the microparticles were always mounted or embedded in mounting materials that were more compliant than the powder being studied with some being less so than others.
3D confocal microscopy was performed using an Olympus Corporation system. Microindentation was applied to hemispherical particles embedded within the mounting materials considered. The Vickers microindenter utilized herein was that of the DiaMet Hardness Tester from Buehler (Lake Bluff, IL, USA). Varied loads were considered and are provided accordingly alongside the data. Digital images of the post-microindented powders were captured using the DiaMet’s intrinsic imaging system. To achieve suitable indentation surface roughness and metallographic surface finish, mechanical polishing, vibratory polishing, focused ion beam (FIB) polishing, and cross-sectional argon ion beam polishing was applied in certain cases.
With respect to conventional/traditional nanoindentation testing, a Keysight G200 Nano Indenter, iMicro Pro and iNano system was utilized. Additional CSM-based nanoindentation was performed using an MTS Nanoindenter XP, NanoFlip, iNano, and as already mentioned, the iMicro Pro. Mounting materials consisted of different compression mounting materials, such as phenolic thermosetting systems, cold castable epoxies, colloidal graphite and crystal bond.
Al powder heat treatment was performed on one set of samples at a time in a differential scanning calorimeter (DSC) due to its highly accurate temperature control. Heat treatments were performed using a heating rate of 50 °C/min and a cooling rate of 120 °C/min. Samples were brought to the solution treatment temperature determined for each alloy (i.e., Al 2024 = 490 °C; Al 6061 = 530 °C; Al 7075 = 480 °C, etc.) and held for one hour before being quenched. Nitrogen was used as the purge gas. Additional precipitation hardening treatments were also applied and are noted in the subsequent sections of this manuscript. A post-processing array of heat treatments were applied cold sprayed Al 6061 consolidations as well as an alloy equivalent counterpart in wrought bulk form. Additional thermal processing was also applied to stainless-steel feedstock and Cu/Ni coatings on an alloyed Al substrate for mechanical mapping inspection.
An additive yield strength model was employed to computationally determine the yield strength and hardness as a function of precipitation hardening heat treatment time and temperature by way of applying Thermo-Calc and DICTRA-module simulations to the Al 6061 powder composition given in Figure 2. More details are provided in the Results and Discussion section. Additionally, through the use of JMatPro’s mechanical properties model, yield stress and hardness as a function of cooling rate for the same chemical composition was utilized to determine a linear relationship for the hardness as a function of the 0.2% offset yield strength. Cooling rate calculations were also computed in accordance with the atomization process and molten metal used. Details surrounding such calculations may be found in the relevant Results and Discussion section too. From cooling rate analysis, microstructural feature sizes were discernable.
Particle compression testing was performed using an iMicro Pro with an InForce 1000 mN actuator and a flat-punch diamond indenter tip from Synton-MDP. A 3D digital microscope from Keyence was used herein as well. The flat punch had a diameter of 75 um. Alternatively, electron back scatter diffraction (EBSD) field emission SEM was coupled with static nanoindentation of powder particle grains to unveil the crystallographic dependency of nanoindentation hardness and modulus for a particulate material system. An alternative strategy for mechanical characterization surrounds the application of CSM-based spherical nanoindentation stress–strain protocols to particles to obtain their strengths. Synton-MDP was identified as the source for procuring cono-spherical tips of 1, 2, 5 and 10 μm nominal radii were purchased for use in the NanoFlip and iMicro Pro suites. Micro Star Technologies, Inc. (Huntsville, TX, USA), was turned to for the procurement of Berkovich diamond indenter tips.
The Applied Research Laboratory at Pennsylvania State University assisted with the implementation of cold spray particle impact finite element analysis (FEA) using Abaqus. Consolidated cold sprayed samples were produced by VRC Metal Systems and the Applied Research Laboratory at Pennsylvania State University. Mechanical mapping of the cold sprayed coatings was achieved using a Nano Indenter XP in some instances as well as the iMicro Pro in other cases. The laser induced projective impact testing (LIPIT) system maintained by Dr. Lee’s research group at the University of Massachusetts, Amherst, was used to generate idealized Al 6061 single particle depositions for subsequent characterization and comparison with FEA outputs. Once the LIPIT single particle deposit was obtained, a cross-section of the deposit was prepared by plasma-based FIB milling and polishing at the University of Connecticut. FIB milling was also performed at Harvard University’s Center for Nanoscale Systems (Boston, MA, USA).
The grain/sub-grain size for each of the samples were characterized via etching and subsequent optical microscopy (OM). For etching, samples were compression mounted in a phenolic resin and then ground and polished with a final 0.05 μm colloidal silica suspension step. Once polished to a mirror finish, the samples were etched using the reagents and times described below and microstructural grain/sub-grain sizes were then measured using OM micrographs and Olympus Stream’s software package for grains and intercepts. To reduce the distortion due to the local curvature on the edge of the polished powder particle cross-sections, after grinding and polishing, only features near the center of the front face of the powders were included in the measurements. The etching reagent for Al 2024 and Al 7075 powder was Keller’s Reagent (1.0% hydrofluoric (HF) acid, 1.5% hydrochloric acid, 2.5% nitric acid, and 95.0% distilled H2O) and the etching time was 5 s. The Al 6061 gas-atomized powder was etched using 0.5% HF acid and 99.5% distilled water for 60 s.
Additional details are provided throughout the remaining manuscript.
3. Results and Discussion
3.1. Particle-Dominated Nanoindentation Depth
When measuring the nanomechanical properties of a powder particle embedded within a mounting material, careful consideration must be given to the depth of indentation. If deliberation is not properly applied to the interactive nature of the particle-matrix system being studied, both the measured hardness and modulus of elasticity obtained by direct measurement will be artificially influenced by the properties associated with the mounting material matrix once a particular depth threshold is crossed. To better understand the maximal depth of indentation that can be applied to a mounted powder particle, such that matrix-independent nanomechanical properties of a particulate may be obtained, a limited number of researchers have pursued reconciliation through hybrid combinations of computational, theoretical, and experimental frameworks. Said reconciliation efforts within the nanoindentation community have considered various particle-matrix material combinations, to more easily extend purported models to particle-matrix systems where the particle is more compliant than the mounting material and vice-a-versa.
In so far as cold sprayable metallic microparticulate feedstock are concerned, commonly used mounting materials, such as castable cold mounting epoxy, compressive mounting resin, carbon paint, and crystal bond, for example, are generally more compliant than the embedded powder. Therefore, implementation, evaluation, and consideration of said matrix-independent powder property depth-based models are warranted for cold spray applications. To date, the authors of the present study are only aware of a finite number of cold spray researchers who have passively, not to mention actively, sought to integrate the currently available particle-matrix nanoindentation corrective methods with particulate feedstock assessment. For example, Jeandin et al. made mention of the need for matrix-independent particle assessment through indentation testing in a chapter of a relatively recent book on cold spray that was edited by Villafuerte in 2015 [1]. Therefore, one objective of this research is to synchronize and harmonize the state of the art associated with nanoindentation in combination with cold spray processing.
3.1.1. The Yan et al. Model
To overcome and avoid the mounting material influence associated with a given particle-matrix system, one may utilize the concept of a “particle-dominated depth” regime. The particle-dominated depth regime was articulated by Yan et al. in [32], wherein the authors successfully identified a narrow range of indentation depths that captures matrix-independent data and allows for experimental particulate property evaluation. At the same time, Yan et al. observed a “major matrix-influenced depth” regime that resulted in a composite-like particle-matrix nanoindentation measurement once the maximal particle-dominated depth was surpassed.
Yan et al. identified the two nanoindentation depth regimes by way of FEA, with particular attention given to the determination of the matrix-independent modulus of elasticity since the volume of material contributing to elastic deformation are greater than that associated with plastic deformation zones, which accompany the measure of hardness. Yan et al. evaluated particle-matrix systems wherein a stiff matrix surrounded a more compliant particle in addition to the opposite case-scenario, such that a compliant matrix housed a stiffer hemispherical constituent. Moreover, the difference between the particle properties and mounting material properties in-silico was numerically encoded to have highly mismatched elastic moduli and yield strengths. Ultimately, when the matrix material is more compliant than the particulate component, the particle-dominated depth regime was found to be adhered to if:
where is the embedded particle radius and is the maximal indentation depth before transitioning to the major matrix-influenced depth regime for a relatively harder particle. When the particle-matrix properties were reversed such that the particle was more compliant than the mounting material matrix, is formulated as:
Since most of the currently used particulate feedstocks associated with cold spray processing are less compliant than typical surrounding mounting matrix materials, as well as the fact that:
it stands to reason that ought to be utilized throughout the cold spray community, in general, as a tentatively conservative quantification of an for a given feedstock material. As will become clear shortly hereafter from inspecting the forthcoming experimental work provided herein, the qualifier “in general” associated with the previous statement will become clear. More to the point, for alloyed aluminum power particles, experimental data suggests that the principle may not be conservative enough. Continued discussion on this matter is provided hereafter. Nevertheless, at least for rapidly solidified, gas-atomized, alloyed aluminum metallic powder particles, experimental findings, such as the limit assigned in Figure 3 (Right), suggest that a relation between and ultimately needs to be abided by for particle-matrix systems relevant to metallic cold spray materials consolidation, thus attesting to qualification of as being tentative conservative approach.
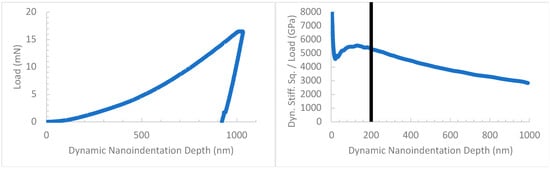
Figure 3.
One particles load versus indentation depth curve for continuous stiffness measurement (CSM) nanoindentation of gas-atomized Al 6061 powder with the D50 provided in Table 1 from Company B when the iMicro Pro system was employed (Left). The dynamic stiffness squared per load versus indentation depth curve is presented for a set of multiple microparticles (including the particle associate with the load vs. depth plot in (Left)) embedded within a compliant matrix and subjected to indentation loading as well (Right). The imposed line at 200 nm on the plot (Right) indicates a potential influence upon the recorded properties by the compliant mounting material relative to the powder. Notice that the prospective limit at 200 to 250 nm is less than the 380 nm upper bound that follows from the Yan et al. model.
3.1.2. Alternatives to the Yan et al. Model
Given the complexity of the mechanical relations underpinning the composite-like interaction between a mounting material matrix and an embedded powder particle during the loading portion of the nanoindentation process, Yan et al. are not the only researchers who have considered and studied the matter of determining matrix-independent particle moduli of elasticity and hardness’s via nanoindentation. Cao et al. proposed that the hardness of a stiffer particle embedded in a relatively soft mounting material matrix can be collected with less than 10% error if the following mathematical relation was obeyed, such that:
in accordance with [33]. With a similar intent to that of Yan et al. and Cao et al., Kashani et al. pursued the identification of an indentation depth range that would yield particulate hardness values when a particle was mounted in a compliant matrix as well [34]. Kashani et al. defined the nanoindentation depth limit in terms of the contact radius during nanoindentation deformation and indenter tip penetration into the cross-sectioned hemispherical volume of a mounted particle. In doing so, Kashani et al. claimed that a “conservative rule of thumb is that the intrinsic hardness of [a] particle is measured by nanoindentation until the contact radius reaches half of [the] particle radius”, in [34].
Beyond the realm of the models proposed by Yan et al., Cao et al., and Kashani et al., Constantinides et al. argued in favor of using an indentation depth limit of 10% of the particle size [35]. Though Mercier et al. appear to have had success applying the 10% rule identified by Constantinides et al. in [36], the validity of Constantinides et al.’s approach suffers from the same short-comings associated with the models from Cao et al. and the limit proposed by Kashani et al. As will be subsequently shown, the alternatives to Yan et al.’s model are beset by regularly overestimating the upper bound of the particle-dominated indentation depth regimes, especially when the modulus of elasticity needs to be measured.
3.1.3. Contrasting Particle-Dominated Depth Models
Since there exist competing models that aim to provide researchers with a guiding principle for the determination of as a function of , consultation of the literature and the average of a commercially available gas-atomized Al 6061 powder, especially marketed for cold spray processing, can be considered to test the hypothesis that Yan et al.’s model is best suited for cold spray powder evaluation at the time of preparing the present manuscript. By way of solving for the of a given powder with an of 19 μm, in accordance with the reported by Company A for their Al 6061 powder, one calculates a of 2.57 μm when the Cao et al. model is applied [33]. As will be shown more clearly by way of consulting work by Chen et al. [37], as well as forthcoming results presented within the present manuscript, the obtained via the Cao et al. model is too large for gas-atomized Al 6061 and will be shown to overestimate the for stiff particles embedded within compliant mounting materials.
As was already alluded to herein, previous work by Chen et al. reported nanoindentation measurements for gas-atomized Al 6061 powder at indentation depths near the 2.57 μm determined from the Cao et al. model when the powder was mounted in a more compliant matrix or epoxy-like material. At similar depths to that of 2.57 μm, Chen et al. reported measured hardness values between 0.15 and 0.51 GPa in [37]. Previous work has shown that indentation hardness’s in the range reported by Chen et al. are much too low for gas-atomized Al 6061 powder, which therefore speaks to the limitation of Cao et al.’s model and by logical extension attests to the insufficiency of Constantinides et al.’s 10% rule-of-thumb too [2,38,39]. On the other hand, analysis of the Yan et al. model was found to be appreciable, resulting in a maximal indentation depth of 380 nm into the particle to avoid the major matrix-influenced depth regime during nanoindentation of gas-atomized Al 6061 powder. The depth limit of 380 nm is much more consistent with the work successfully presented herein as well as prior observations, although as mentioned earlier, may need to be revised through a conservative lens to somewhere between and in light of the original experimental exploration of particle-matrix systems presented herein.
3.1.4. Additional Consideration of Yan et al.’s Model
More to the point, attention can also be afforded to the PSD data associated with the gas-atomized Al 6061 powder from Company B, which was found to have a of 41.2 μm as reported upon in Table 1. In comparison with the associated with the gas-atomized Al 6061 from Company A, the mechanically sieved counterpart sourced from Company B maintained a similar value of . In fact, since the associated with the Company A feedstock was slightly less than the sieved and gas-atomized Al 6061 powder from Company B, the according to Yan et al.’s respective model for the Company A gas-atomized Al 6061 series was applicable to the experimentally studied Al 6061 from Company B reported upon herein as well.
Even though the application of the Yan et al. model suggested that nanoindentation testing of embedded powder particles with a approximately equal to 19 μm can be employed at penetration depths less than or equal to 380 nm, in general, the dynamic stiffness squared per load versus depth curve in Figure 3 highlights the sensitivity of the instrumentation to the mounting material used. Such a sensitivity was exemplified by the continued decrease of the dynamic stiffness squared per load parameter following nanoindentation depths between 200 and 250 nm. Partial reliance upon the dynamic stiffness squared per load versus depth curve as an indicator of compliancy within a given system is consistent with discussion presented in [40]. This once again speaks to the need for the original experimental inspection of the accuracy associated with the Yan et al. model, which was derived in-silico with a relatively small number of mismatched particle and matrix materials. As already referred to herein, the data presented during the course of this analysis suggests that the Yan et al. model is the most accurate to date, whilst also speaking to the need for further essential conservative refinements.
Consideration of the continued decrease of the dynamic stiffness squared per load parameter after nanoindentation depths beyond 200 to 250 nm in depth may motivate oneself to question the validity of the upper bound associated with the Yan et al. model. Yet, multiple factors may have contributed to the experimentally apparent of 200 to 250 nm, such as variation in powder radius from the 19 μm average, irregular particle shape/morphology that contradicts the hemispherical sphericity encoded by Yan et al., and the range of particle-matrix property combinations included in Yan et al.’s study. Thus, future work in collaboration with the University of California, Merced’s research group led by Professor Yanbao Ma will couple computational analysis with our experimentation to refine the approach taken by Yan et al. for consistent extension into the realm of cold spray feedstock characterization. In any case, as we have already stated, the original analysis presented herein illustrates the likelihood that a more conservative relation between and will follow from future work.
3.2. Pile-Up and Particle Immersion
Important matters—deserving of focused consideration and continued discussion—concern the effects of “pile-up”, as well as particle immersion into the mounting material matrix as the indentation load applied to a given powder increases. Commonly understood by those in the nanoindentation research community, pile-up concerns the buildup of material along the edges and sides of the indenter tip as it penetrates the sample undergoing nanomechanical assessment. As discussed in detail by Oliver and Pharr, “in general, pile-up is greatest in materials with large and little or no capacity for work hardening”, where is the effective modulus of elasticity and is the materials yield strength [41].
Moreover, Oliver and Pharr continued by way of stating that “when pile-up occurs, the contact area is greater than that predicted by the [original] method, and both the hardness… and modulus… are overestimated, sometimes by as much as 50%” in [41]. Since the tendency for a material to work harden is not identifiable from the indentation load versus depth curve alone, Oliver et al. found that care must be taken when the “ratio of final indentation depth, , to the depth of the indentation at peak load”, , is greater than 0.7 and close to 1.0 in [41]. From the nanoindentation load versus depth curve presented in Figure 3 for multiple gas-atomized Al 6061 particles embedded in a phenolic resin, it stands to reason that the indentation data measured maintained a ratio of:
From the fact that the ratio of to was found to be greater than 0.7, nanoindentation of gas-atomized cold sprayable Al 6061 powder required careful consideration of pile-up and pile-up’s effects. Fortunately, Oliver et al. were able to remedy this dilemma by way of introducing a correction factor, such that:
In the expression for given above, is “the half-included angle of the indenter” and is the Poisson’s ratio [41]. From the observed to ratio associated with Figure 3, was properly introduced for a pyramidal Berkovich indenter tip geometry, according to Oliver and Pharr’s refinements to their original methodology associated with instrumented indentation testing [41], to ensure accurate hardness and modulus analysis.
3.2.1. On Particle Immersion
The occurrence of particle immersion into a mounting resin or mounting material matrix during indentation testing is considered next. Particle immersion is thought to occur when the interfacial mechanical adhesive or cohesive strength between the embedded particulate and mounting medium becomes overwhelmed as the applied indentation load increases. Such an occurrence has deleterious effects upon the recorded hardness and especially the measured modulus of elasticity. The reason for a more pronounced influence of the mounting matrix and particle immersion upon the directly measured modulus of elasticity stems from the fact that the elastic zone of deformation is much larger than the plastic zone of deformation required to measure the hardness. Thus, at similar indentation depths, the volume of material contributing to the evaluation of hardness can be 10-times less than that of the elastic zone associated with modulus of elasticity measurements.
In any case, the mechanical dissociation between a particle and respective mounting matrix is proportional to the size of a given particle. In general, as the decreases, the tendency for a particle to be immersed within the mounting material increases. Particle immersion was previously captured quite well in experimentally via confocal microscopy and numerically via cross-sectional analysis of a FEA rendering in [42,43], respectively. Graphically speaking, one may consider Figure 4, which was adopted from Schiel’s Master’s Thesis, compiled at the U.S. Naval Postgraduate School under the advisement of Brewer [44].
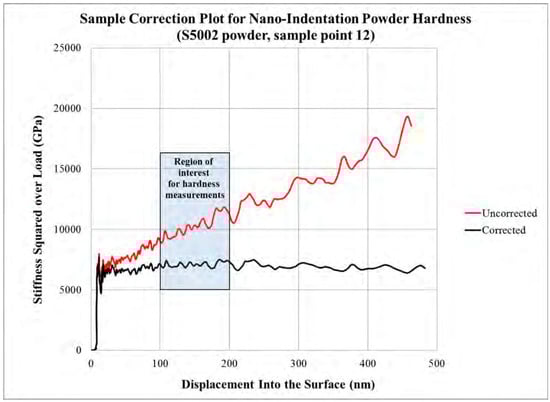
Figure 4.
Stiffness squared per load vs. indentation depth curve demonstrating the way in which the compliancy of a particle-matrix system may be identified from the experimentally collected nanoindentation data may be analyzed to predict particle immersion from graphical analysis. This figure was adopted from the publicly available work of Schiel in [44]. Interestingly, in comparison with Figure 3 (Right), which concerns the use of a compression mounting matrix, the use of a castable mounting epoxy (by Schiel) introduced much greater compliancy at much smaller depths.
Though Figure 4 captures potential occurrences of particle immersion through the analysis of nanoindentation test data and sources [42,43] captures particularly obvious occurrences of particle immersion ex-situ via confocal analysis and in-silico via FEA, respectively, we also present examples of particle immersion when applying microindentation-based loads. As shown in Figure 5, even when only 0.01 kgf is applied to an embedded aluminum alloy feedstock from Company A, particle decohesion and immersion can be observed. As a consequence of the decohesion between the particulate material and mounting resin, one may also observe a secondary effect of particle inclination from the sample surface orthogonal to the direction of indentation. Such a consequence introduces a second-order indentation event wherein the nanoindenter is penetrating the particle until reaching a load that causes the particle to indent the matrix as well.
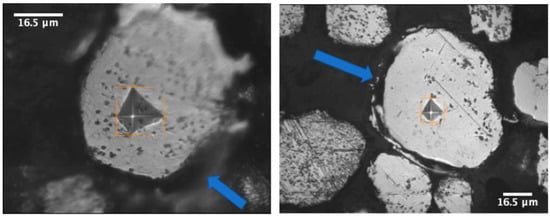
Figure 5.
The defocused nature of the micrograph following microindentation testing as well as the asymmetry of the four-sided pyramidal impression demonstrates the occurrence of particle immersion during Vickers hardness testing of a metallic particle (Left). At the same time, the (Right) micrograph presents particle immersion into the mounting material following particle decohesion from the matrix material during Vickers indentation loading as highlighted by the perimeter identified with the blue arrow(s).
3.2.2. On Pile-Up
From the aforementioned passage linking, , the ratio of to and the ratio of to together to account for the occurrence of the phenomena of pile-up within gas-atomized Al 6061 powder particles, 3D confocal microscopy was performed upon indented gas-atomized Al 6061 particles, which were embedded in an epoxy that was even more compliant than phenolic resin used to collect the data presented in Figure 3. From the 3D confocal analysis rendered and presented in Figure 6, the consideration and use of the ratio of to as an indicator for the tendency of a material to pile-up were experimentally substantiated for embedded powders too.
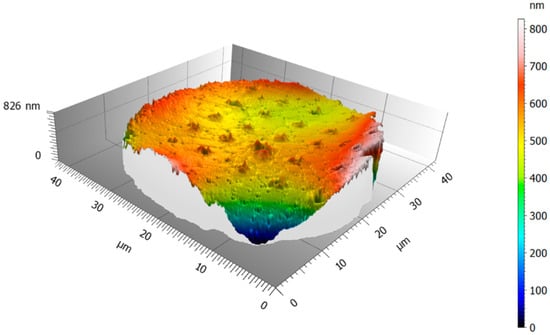
Figure 6.
Surface topography obtained by way of applying 3D confocal microscopy-based analysis to the pile-up associated with a nano-indented gas-atomized Al 6061 powder particle mounted in cold castable epoxy and sourced from Company B. Conventionally static nanoindentation was performed to produce the residual indentation marks captured herein.
By way of considering Figure 6 and Figure 7, pile-up has been shown to occur experimentally via confocal microscopy. Consideration of Figure 3 (Left) illustrated the need for the pile-up correction factor established by Oliver and Pharr. That said, the correction factor was successfully introduced in this analysis accordingly, such that the effects introduced by the occurrence of pile-up during nanoindentation was properly and adequately accounted. In many cases, modern nanoindentation testing suites already automate the introduction of by default. Therefore, the cold spray researcher employing nanoindentation methods presented herein to their feedstock must simply enter geometrically-dependent constants when defining a given indenter tip if a more modern nanoindentation system is acquired and utilized.
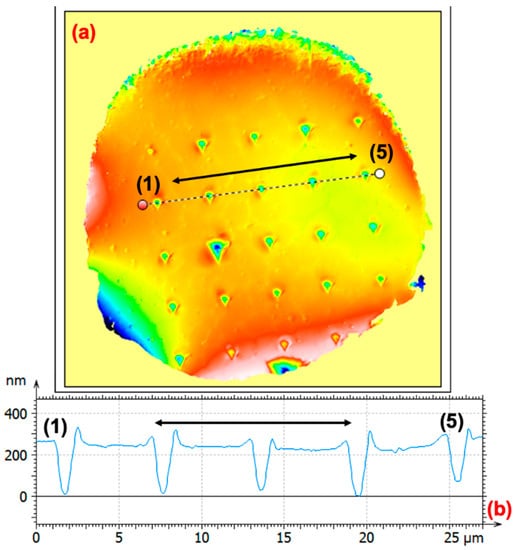
Figure 7.
Continued confocal analysis of pile-up associated with nano-indented Al 6061 powder. (a) presents five indentation imprints and their respective degree of pile-up that are associated with the graphical height versus spacing data presented in (b). The asymmetry associated with the pile-up identified to the left of the , which is further identified as the (x,0)-line along the y-axis, and the pile-up identified to the right is typical of a Berkovich indenter tip geometry and three-sided pyramidal arrangement.
3.3. Particle Surface Finish and Inclination
Just as consideration was given to the matter of pile-up and particle immersion when the applied indentation load exceeds the particle-dominated depth limit, consideration must also be given to sample preparation and sample surface roughness. The underlying theoretical and physical mechanistic framework associated with indentation testing assumes that the indenter tip makes contact with a perfectly flat sample. As a matter of practicality, it is impossible to achieve a completely flat sample through commercially available means. Nevertheless, sufficiently polished mirror finishes were found to be achievable if careful consideration and sample preparation was abided by before nanoindentation testing of embedded particles within a compliant matrix.
To achieve suitable indentation surface roughness and metallographic surface finish, mechanical polishing, vibratory polishing, FIB polishing, cross-sectional argon ion beam polishing, and electrochemical polishing have emerged as worthwhile methods for nanoindentation testing in general. Numerable papers have been published on the influence of surface preparation upon nanoindentation and a motivated reader should refer to [45] for additional information. Due to the fact that mounted particles are not in full contact with one another and are discretely dispersed within a mounting material, electrochemical polishing was unable to be applied to powder-based samples for nanoindentation; however, electrochemical polishing can be used for the preparation of cold sprayed consolidations and coatings as highlighted by Eason et al. in [46].
Outside of electrochemical polishing, mechanical, vibratory, FIB, and cross-sectional ion beam polishing were all found to be suitable for powder preparation for nanoindentation. Needless to say, each was found to have their intrinsic limitations. For example, vibratory polishing was found to cause localized chemical modification of powder cross-sectioned surfaces, during this work, if the powder was exposed to the polishing media for too long.
At the same time, improper or incomplete removal of the polishing medium, especially colloidal silica, from certain types of cross-sectionally mounted particle surfaces caused a corrosive response when stored after preparation for relatively long periods. Mechanical polishing can introduce residual stresses and artificially harden the material if care is not taken. The scratch across the particle on the right-hand side of Figure 5 illustrates the consequence of particle detachment when care is not taken, or the edge retention of the mounting resin is not sufficient for the prevention of extremely fine particle detachment. Specifically, the scratch marks across the surface of the particle presented in Figure 5 (Right) is typical of such an unintended consequence of mechanical polishing.
As for cross-sectional ion beam polishing, this process can introduce stratified surface features if the parameters are not optimized while FIB polishing can alleviate dislocations and introduce damage via curtaining as well as ion implantation and result in an inclined powder surface relative to what would otherwise have been orthogonal to the direction of indentation. The stratified surface features shown in Figure 8a,b are indictive of insufficient cross-sectional ion polishing parameters for powder preparation.
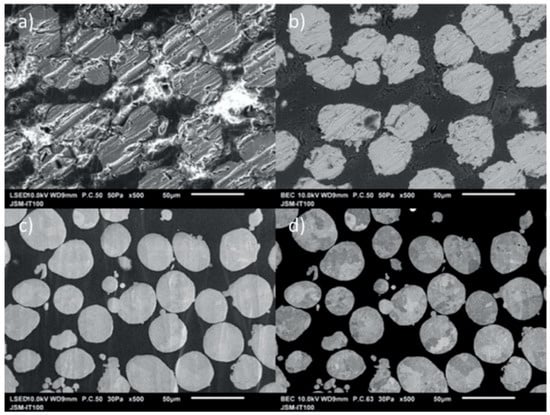
Figure 8.
SEM micrographs of Al 6061 powder during and after cross-sectional argon ion beam polishing is presented herein: (a,b) depict secondary electron and backscatter electron SEM micrographs before achieving the final polish, respectively; (c,d) capture similar micrographs after polishing.
Most of these limitations and challenges can be accountesfor. For example, vibratory polishing or cross-sectional ion beam polishing can be applied to a mechanically polished surface to relieve the accumulated residual stress profile near the polished sample surface without unintentionally modifying the crystallinity of the powder. Just as Figure 8a presents the stratified surface features associated with incomplete cross-sectional ion beam polishing, Figure 8d presents the case where cross-sectional ion beam polishing parameter optimization resulted in a desirable surface finish and sample preparation when gas-atomized Al 6061 from Company B was mounted in colloidal graphite and placed upon a pre-cut silicon wafer chip [2].
Prior work has established a rule of thumb that aimed to identify a minimum indentation depth required for a given surface roughness such that the indentation response would not be overly influenced by the roughness. The guiding 5% rule was found to be successfully applicable in many cases and research by Hay et al. illustrated the fact that if there exists less than a few percent scatter associated with a cluster of indents in a given region then the roughness was not believed to be influencing the nanoindentation data in [47]. However, for more sophisticated nanomechanical testing techniques, the presence of a degree of roughness can have a fairly impactful consequence. Accordingly, some researchers have elected to employ effective zero-point determination algorithms to virtually correct for any surface artifacts [45,48,49,50]. That being said, the occurrence of particle inclination was presented in Figure 9, wherein Figure 9 was measured during this research using 3D confocal microscopy. Another example of particle inclination may be found in [51].
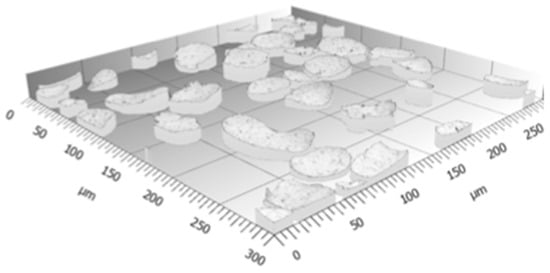
Figure 9.
Three-dimensional (3D) confocal analysis showcases the inclination associated with one of the powder preparation approaches taken during the course of this work. The degree of inclination identified herein is consistent with the hypothesis presented in this manuscript that cold mounting castable epoxies ought to be avoided to properly prepare cold sprayable particulates for nanomechanical assessment.
3.4. On Microindentation of Particulates
Remarkably, even in the wake of the discussion and constraints associated with nanoindentation testing of powder particles, researchers have continued to attempt to apply microhardness and Vickers indentation testing to powders embedded in a mounting material matrix and polished according to standard metallographic preparation techniques. In pragmatic terms, there exist several motivational factors that has lead materials scientists and engineers to want to use microindentation for testing powder particles reliably and feasibly. The general accessibility of microindenters at a variety of institutions, the instruments relative ease of use, relatively low cost, and minimal error dependence upon a given user are some of the features that are attributable to the pursuit of extending microhardness testers to metallic powder particles. However, as will be shown herein, the ability to use micro-indentation for particulate analysis is generally not feasible except for special cases where particle properties are just right such that loads of 0.001 kgf can be achieved.
In the late 20th century, Shives and Smith found the use of glass filled diallyl phthalate to be “questionable” at best as a mounting material for microhardness particle measurements in [31]. Still, they employed glass filled diallyl phthalate for a slightly alloyed nickel powder of 60 to 75 μm in diameter with a composition similar to Ni 200 or Ni 201. Shives et al. then measured a hardness of 84 Vickers number (HVN), even though the hardness measured for the same powder with diameters between 3 to 17 μm was approximately 292 HVN when electrodeposited copper was used as the mounting material instead and an indentation load of 0.005 kgf was applied. Though the 292 HVN at 0.005 kgf is more reasonable than 84 HVN, which would be closer in hardness to pure Ni (65.06 HVN), it still exceeds the bulk hardness of Ni 200 (170.1 HVN) by nearly double [52].
When prior work is consulted, alongside the data collected and presented in Figure 13 (from Section 3.7.1) comparing cast and gas-atomized powder hardness’s with one another, which previously established the fact that the hardness’s of rapidly solidified crystalline metallic powders are greater than the hardness of their wrought/cast (bulk) counterparts in [2], the difference between the indentation hardness of gas-atomized Al 6061 powder and bulk Al 6061, for example, is much less than 71.76%. As such, one would not expect a difference between particle and bulk hardness to be nearly 71.76%, which was associated with the Ni 200 provided above according to the report by Shives et al.
The discrepancy between (1) the slightly alloyed nickel powder of 60 to 75 μm in diameter that were mounted in glass filled diallyl phthalate, (2) the same powder with diameters between 3 and 17 μm that were mounted in electrodeposited copper, (3) and bulk Ni 200, as well as (4) the small size of the 3 and 17 μm powder, suggests that a composite hardness was measured. While this composite hardness was overlooked in their report, the composite hardness was measured between the electrodeposited copper mounting material and nickel powder. The claim that Shives and Smith recorded a composite hardness has yet to be reported upon elsewhere and follows from the fact that depending on the grain size, electrodeposited copper can achieve hardness’s as high as 203.9 to 305.9 HVN [53].
With the aforementioned in mind, many researchers seem to have either remained unaware of the report from the U.S. National Bureau of Standards researchers in the 1980s or cherry picked the favorable aspects of the report for continued microindentation of relatively stiffer powder particles embedded in a softer mounting material. For example, the following publications have employed microindentation testing for powder particle mechanical characterization following the work by Shives and Smith [9,13,54,55]. Specifically, Salahinejad et al. reported upon the hardness evolution of a mechanically alloyed Fe-Cr-Mn-N powder through the use of a microindenter with an applied load of 0.025 kgf in [54], for example.
Azevedo et al. stated that “Micro indentation tests were used to estimate the deformation properties of the powder” using a pyramidal Vickers indenter with applied loads between 0.005 kgf and 0.040 kgf for 316 L stainless steel in [55]. Moreover, Randaccio of Northeastern University (NEU) applied microindentation to Al 2024 powders that were gas-atomized and thermally pre-processed for (possibly) enhanced cold spray-ability in [9]. Two additional papers by Sabard et al. also applied microindentation to Al 7075 and Al 6061 powders that were also thermally pre-processed for (possibly) improved cold spray deposition in [13,56]. Unfortunately, even Company A appears to apply microindentation to powder particles, reporting HVN’s for powders with values provided as part of the quality control paperwork from Company A upon delivery of their powder.
Potentially more surprising is the fact that since the late 1990s and early 2000s, nanoindentation researchers have been raising concerns regarding the need for the continued development of models for evaluating plastic, elastoplastic and elastic properties of hard particles embedded in relatively softer mounting material, as highlighted earlier, with limited consideration by many others to date. Nevertheless, users of microindentation testing systems for powder evaluation have appeared to be unaffected by such relevant observations. In other words, many researchers haven’t given much thought to the fact that mounting materials effect nanoindentation testing, let alone microindentation testing, where the lower limit load in many contemporary systems are nearly 10- to 20-times greater in microindentation than a typical load applied for powder property evaluation via nanoindentation (50 to 100 vs. <5 mN) during this work for Al powder, as an example, before the is crossed.
In any case, the consequences of utilizing microindentation for mechanical evaluation of embedded powder particles, beyond the occurrence particle immersion into the mounting matrix material, are demonstrated through the consideration of Figure 10, Figure 11 and Figure 12.
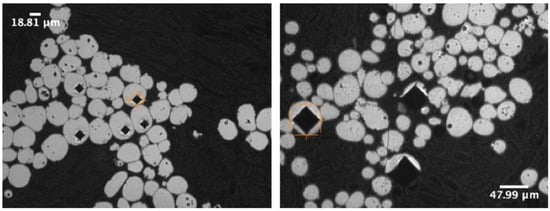
Figure 10.
The (Left) micrograph follows from the application of 0.01 kgf during microindentation/Vickers hardness testing of an alloyed Al gas-atomized particle mounted in a phenolic resin. The micrograph on the (Right) demonstrates how easily the particles are overwhelmed by an applied load of 0.1 kgf. Resultantly, the composite-like interaction at the microindentation-load ranges for particle-matrix systems.
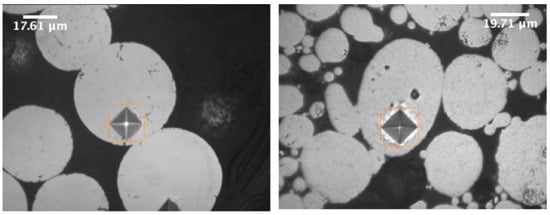
Figure 11.
The resultant residual indentation associated with the application of a 0.01 kgf microindentation load with a Vickers-shaped tip. In both the (Left) and the (Right) micrographs, alloyed Al particles were embedded within a phenolic resin compression mounting matrix material. From the diagonal length of the rectangular “base” of the indent, one can clearly summarize that the depth to particle radii violate the Yan et al. model mentioned earlier. The limited microscope to indenter target location resolution is also observable due to the fact that the post-indentation imprints were non-centered and close to the edge of the particle-matrix interface.
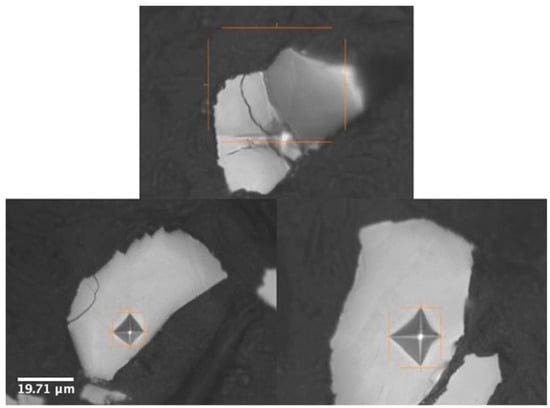
Figure 12.
The three micrographs presented herein concern the use of a cold sprayable feedstock material that is much denser and harder than Al and source from Company F. Furthermore, the (Top-most) micrograph illustrates the inability to apply a microindentation load of 0.01 kgf to a milled/crushed, rather than gas-atomized, pure feedstock embedded in another compression mounting matrix that was even less compliant than the phenolic resin associated with Figure 11. The bottom of the set of micrographs in Figure 12 (Left) and (Right) highlight the occurrence of inclination as a secondary indentation occurs after a particle-dominated depth limit was crossed. The scalebar embedded in the (Left) micrograph applies to all three micrographs presented.
3.5. Treating Embedded Powder as a Thin Film
Researchers on the margins of the powder nanoindentation community, who were not focused upon developing a precise analytical and physical mechanics model for instrumented indentation testing of a powder particle housed in a less stiff mounting material, showcased an inherent appreciation of the effect of mounting material compliance on the recorded indentation response. While not applying a particle-dominated depth criterion or another comparable framework for particle assessment, work by Evans while at NEU exemplifies a case-scenario where a cold spray researcher recognized the fact that microindentation could not be applied because of the particle-matrix interaction and therefore utilized nanoindentation in [57].
In any case, researchers showcasing said inherent appreciation of mounting matrix effects have applied a “thin film” correction to the protocol for indentation testing of powder in a mounting resin. The underlying intuition behind this adaptation of indentation testing for embedded powder systems is certainly commendable upon considering the motivation articulated in [38]. Nevertheless, the geometrical variation behind a planer thin film on a planer compliant substrate is not similar enough to an embedded hemispherical particle surrounded by a compliant mounting material, which would otherwise be analogously similar to a complaint substrate. Unfortunately, careful consideration of the previously reported findings within the literature has found that the thin film protocol cannot be extended to particle/matrix systems [33,58].
Before the various models associated with nanoindentation testing of embedded particles within a surrounding matrix were more commonly known and recognized, Němecěk et al. considered the “layered substrate-film system… to be successfully used as a first estimate” for “disordered structural multiphase materials”, i.e., hemispherical constituents surrounded by a matrix material [59]. Unlike Němecěk et al., Dutta did not find the thin film method sufficiently comparable to a particle-matrix system, writing that “there is no such study that describes the substrate effect during indentation for such type of small size granular materials whose modulus and hardness are much higher than the polymer matrix... Owing to these large differences in mechanical properties between the indenting sample and substrate, a possible substrate effect cannot be fully denied and needs further study…” in [60]. Generally speaking, when thin film protocols were employed during the course of this work, thin film corrections past the particle-dominated depth and assuming a planar geometry was found to be ill suited herein as well. This was observed across numerable nanoindentation systems and their respective methods and specifications. That said, the implications of performing nanomechanical assessment using various systems with different specifications are discussed next.
3.6. Nanoindentation Systems with Varied Specifications
During the course of this work, a number of nanoindentation systems with various testing methods were utilized. Beyond the fact that the range of nanoindentation systems offered static, quasi-static/cyclic, and dynamic testing methods, the suite of systems enabled comparative analysis between the instruments too. At the same time, the span of nanoindentation systems also enabled different methods and protocols to be explored. For example, the thin-film method associated with the iMicro Pro nanoindenter applies a constant strain-rate during testing as well as CSM-based harmonics while the thin-film method associated with the Keysight G200 Nano Indenter depends upon a conventionally static procedure.
Moreover, without purchasing additional hardware for the Keysight G200 Nano Indenter, CSM-based methods were not an option whereas advanced dynamic testing options were included with the iMicro Pro, iNano, NanoFlip, and MTS Nanoindenter XP systems by default. Furthermore, the implementation of mechanical property mapping methods and the respective mathematical/algorithmic framework underlying the nanoindenter systems (e.g., the iMicro Pro, iNano, and NanoFlip) manufactured by Nanomechanics, Inc., now vary with respect to the contour plot resolutions achieved when the same spacing and parameters are used. One ought to note that the iMicro Pro is virtually the same as the iMicro offered by KLA Instruments; however, the iMicro Pro system come with an InForce 50 mN actuator alongside the standard InForce 1000 mN actuator, thus achieving the functionality of the iNano as well.
At the same time, fundamental differences in the underlying hardware and assembly of each nanoindenter’s respective actuator results in varied specifications; for example, the InForce 50 mN electromotive actuator found in Nanomechanics, Inc., (now KLA Instruments) products achieves a load resolution of 3 nN whereas the Keysight G200 Nano Indenter equipped with the Standard XP Indentation Head has a load resolution of 50 nN, which is nearly 20-times greater than the InForce 50 mN. Concerning the displacement resolution, a similar trend was observed. That is to say, the InForce 50 mN actuator yields a displacement resolution of 0.004 nm while the displacement resolution of the Standard XP Indenter Head is less than or equal to 0.01 nm, which is nearly an order of magnitude in difference between the two. Though the discussion surrounding additional differences between the systems could continue, the final difference discussed herein between the Nanomechanics Inc., actuator assembly and the Keysight G200 Nano Indenter actuator concerns their fundamental data acquisition rates. While the Keysight system has a data acquisition rate of 12.5 kHz, the controller associated with Nanomechanics, Inc., systems have a data acquisition rate of 100 kHz, which is nearly 10 times greater than the rate associated with the Keysight options.
3.7. Measuring the Effect of Thermal Processing
Due to the aforementioned differences in specifications associated with a variety of instruments, variable means of probing the small-scale nanomechanical properties of particulate feedstock and cold sprayed material consolidations were available. In fact, the diversity of system configurations that were available during the course of this work was found to be essential with respect to the assessment and evaluation of the effects of thermally pre-processing powder upon the mechanical properties. More to the point, when thermal pre-processing of alloyed powder was performed to achieve a solution heat treated condition and also performed in the pursuit of precipitation hardening alloyed Al particles prior to cold spray deposition, nanoindentation was found to be an essential characterization tool for interpreting the results and implications.
3.7.1. Processing of Powder vs. Bulk Material
Since the thermodynamics and kinetics associated with heat treating powder has previously been shown to be fundamentally different than that of their traditional bulk counterparts, as referenced earlier, standard heat treatment times could not be applied to a compositionally equivalent batch of powder particles. The difference in thermal processing times required for reaching the peak hardness was captured in Figure 13, which contrasts the hardness versus treatment time for powder in comparison with a cast/wrought bulk equivalent. Accordingly, the difference in times are clearly shown for gas-atomized Al 6061 powder from Company B, which was measured using dynamic nanoindentation, and cast Al 6061 reported by Tan et al. in [61], undergoing a T6 treatment with variable hold times in Figure 13.
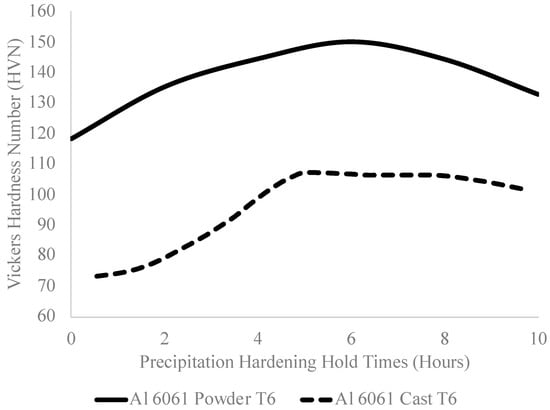
Figure 13.
Al 6061 T6 curves associated with powder and a cast system from literature [61].
3.7.2. Static Nanoindentation of Processed Powder
Experimentally speaking, the ability to evaluate the change in hardness as a function of thermal processing time was not immediately successful. When static nanoindentation was performed upon thermally processed gas-atomized Al alloys to capture their respective aging curves, a clear trend was not obtained for Al 2024, Al 5056 and Al 7075, and a questionable response was observed for Al 6061, where all of the powders were procured from Company B, as depicted in Figure 14 and introduced in the Materials and Methods section as part of Figure 2. While a careful reader would recognize the fact that Al 5056 is not conventionally heat treatable, the rapid solidification and undercooled microstructure as well as phases present in gas-atomized powder are atypical compared to the conventionally bulk counterparts, thus encouraging thermal processing exploration. More to the point, for Al 6061, the slight decrease in hardness from the homogenized and solution heat treated condition to the aged condition at 2 h was brought into question considering earlier research on Al 6061 (although earlier research considered Al 6061 that was not in the rapidly solidified gas-atomized condition).
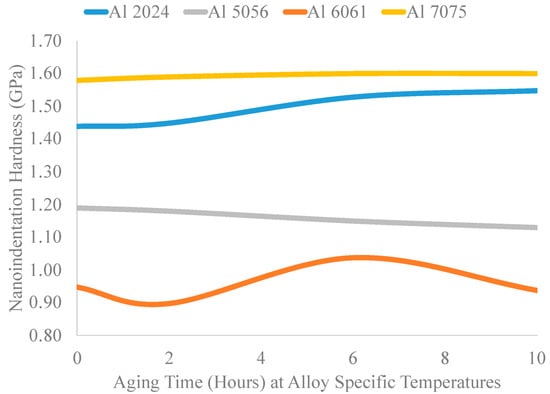
Figure 14.
Static nanoindentation aging curves using the Keysight G200 system.
EL-Bedawy did not identify an initial decrease in precipitation hardened Al 6061, using a similar aging temperature, at the 2 h mark in [62]. Rather, the hardness as a function of aging time was shown to continuously increase until reaching a peak hardness and ultimately achieving an overaged state with a decreased hardness thereafter for a compositionally equivalent system manufactured via different processing methods and solidification conditions. The continuous increase in hardness observed by EL-Bedawy was also substantiated by Tan et al. in [61]. Tan et al. reported a nonlinear continual increase in hardness as a function of precipitation hardening processing time until a relatively asymptotic plateau in hardness was achieved after 5 h and remained until at least 10 h, as shown in Figure 13.
3.7.3. Static vs. Dynamic Nanoindentation
Keeping in mind the fact that the precipitation sequence and kinetics associated with secondary phase formation and dissolution are not the same as the bulk counterparts studied by EL-Bedawy and Tan et al., among others [63], it stands to reason that an initial decrease in hardness prior to reaching the peak value was possible for rapidly solidified gas-atomized Al 6061 powder too. However, work by [64] observed a slight decrease prior to reaching the peak strength of Al 6061 during a similar precipitation hardening procedure. In light of the fact that no significantly identifiable changes were observed for Al 2024, Al 5056, and Al 7075 as well, a dynamic nanoindentation approach was taken to see if the static hardness trend was reproducible when elastic, elastoplastic and plastic deformation behavior, instead of fully plastic deformation behavior, was captured during testing and is presented in Figure 15.

Figure 15.
Dynamic, static and computational hardness’s obtained with the iMicro Pro. The slight dissimilarity between the dynamic and computational hardness’s may very well follow from the cursory dislocation density term in the computational additive yield strength model that will be detailed soon hereafter in the manuscript.
Interestingly, when static nanoindentation testing and dynamic nanoindentation were both performed upon particles, which were precipitation hardened for various times, of the same size category, vendor, storage condition, composition and preparation procedure, a discrepancy still emerged. In general, the dynamic nanoindentation approach not only resulted in a higher nanoindentation hardness in comparison with the hardness from static instrumented indentation testing, dynamic nanoindentation also enabled the differences between the hardness of powders that were thermally processed for various hold times to be realized. Prior to using the dynamic nanoindentation protocol, there was limited success associated with the experimental identification of the thermal processing time that would result in the peak aged hardness. To demonstrate this graphically, recall the fact that Figure 14 presents the hardness of Al 2024, Al 5056, Al 6061 and Al 7075 powder particles as a function of thermal processing time using conventionally static nanoindentation testing.
Though static nanoindentation testing was performed using a different instrument (the Keysight G200 Nano Indenter) for Figure 14 than the device used to perform dynamic nanoindentation testing and replicative static testing for Figure 15 (the iMicro Pro), the possibility of instrument dependence was ruled out. This was achieved by way of applying both static and dynamic nanoindentation testing to the same powder using the same nanoindenter (the iMicro Pro). The use of the same indenter resulted in the shared observation highlighted in Figure 14 for Al 6061, as shown in Figure 15. Therefore, the discrepancy between the static and dynamic hardness’s warranted continued discussion and contextualization via consultation of prior works of scholarship.
3.7.4. CSM Nanoindentation and Strain-Rate Sensitivity
In 2017, Leitner et al. asserted that “there is still an ongoing debate on whether this [dynamic/CSM] superimposed signal influences the mechanical properties of materials” and noted that “comparative and systematic studies performed on identical samples and nanoindentation devices are lacking in literature” in [65]. By way of testing two samples, one face-centered cubic (FCC) and the other body-centered cubic (BCC), Leitner et al. linked the observed discrepancy between the CSM hardness at a given depth and static hardness at the same depth to indentation creep and therefore the strain-rate sensitivity of a material. Since the dynamic hardness for a strain-rate insensitive material agreed well with the static nanoindentation data, Letiner et al. were able to demonstrate that the phenomena are not tied to lattice crystallography alone. However, the strain-rate sensitivities reported by Haghshenas et al. in [66] requires additional research concerning the observed CSM effect observed by Leitner et al.
3.8. Indentation Size Effects
Since the nanoindentation depths required for characterizing the hardness and modulus of elasticity associated with a given particulate feedstock must be carried out below , one must consider the validity of interpreting the recorded values as being proximally comparable to their depth-independent values. This is almost entirely due to the fact that the range of indentation depths generally utilized during indentation-size-effect (ISE) analysis extends far beyond the onset of the major matrix-influenced depth during the nanoindentation-based testing for nanomechanically assessing particles during the course of this research. For example, Pöhl et al. applied the ISE analytical procedure to data between 200 nm and 2400 nm in [67]. Even when assuming that the upper limit only needs to be 2000 nm according to [68], that is still more than five times greater than the limit that has been mentioned herein for gas-atomized Al 6061 powder with the reported in Table 1, for example.
Additional research has applied ISE analysis to hardness versus depth data with an upper indentation depth bound of 3000 nm in [69], whereas Kim et al. did so with upper bounds ranging from 1000 to 25,000 nm in [70], and Beake et al. considered maximum depths between 1500 and 2000 nm in [71]. Future work will consider the implications of the work performed by Prasitthipayong et al. since they were able to successfully apply the ISE analysis with indentation depths up to approximately 400 nm in [72], which is reasonably close to an of 380 nm. However, given the scope of this work, the validity of nanoindentation hardness and modulus measurements made below 380 nm was explored through a computational materials framework as well as the Hall–Petch relationship to determine if nanoindentation data below 380 nm accurately captures particulate properties rather than records an artificially higher hardness due to ISE within the tolerable particle-dominated indentation depth regime. Nevertheless, for continued consideration of ISE the reader should examine the literature review by Pharr et al. in [73].
Before consideration is given to the additive yield strength model that was utilized as the computational materials framework mentioned and employed during the preparation of Figure 15, note that an initial attempt was entertained in so far as ISE hardness versus depth curve data are concerned for gas-atomized Al 6061 in Figure 16 from Company B.
Figure 16.
Tentative indentation-size-effect (ISE) data for powder; however, near 350 nm data matrix influence arises.
Forthcoming ISE analysis of data similar to that presented in Figure 16 will require analysis of the hardness-depth data through the vantage point of a strain-gradient plasticity model that was previously presented by Nix and Gao in [74]. The ISE has been widely studied since Nix and Gao formally presented a strain gradient plasticity model to conceptualize the observed decrease in hardness as a function of indentation depth [73,74]. As such, an analytical framework was introduced that enabled hardness, H, versus indentation depth, h, data to be fit to
where “is the hardness in the limit of infinite depth”, in other words, the true hardness of the material and “is a characteristic length that depends on the shape of the indenter, the shear modulus and ” [74]. Accordingly, the direct application of curve fitting procedures enables one to directly obtain and from experimentally measured nanoindentation data. The underlying physical and mechanical relations associated with and are mathematically formulated below, where:
And
In the two relations for and , “is a constant to be taken as 0.5”, represents the Burgers vector while is the shear modulus, is the geometric angle separating the surface of the indenter tip and the material surface orthogonal to the direction of indentation, and “is the density of statistically stored dislocations” brought about via the process of indenting to a given depth [74,75].
Given the fact that a traditional approach to determining the depth-independent hardness for alloyed aluminum powder, for example, was not found to be currently tenable, an alternative method of assessing the validity of the measured nanoindentation hardness’s at particle-dominated depths was needed. Therefore, in the absence of an experimental ISE-based approach, computational thermodynamic and kinetic modeling was utilized to model the strength of Al 6061 powder as a function of precipitation hardening, also known as artificial aging, heat treatment times. Thus far, attention has only been given to the dynamic and static nanoindentation derived aging curves reported in Figure 15, which was precipitation hardened at 170 °C up to 10 h, using 2 h intervals, following a solution heat treatment. As discussed in terms of strain-rate sensitivity and dislocation density, the variation between the two indentation curves that were obtained using CSM and static protocols has already been attended to, in part, herein. Accordingly, consideration of the third data series plotted in Figure 15 will be discussed and contextualized in terms of validating the nanoindentation data at depths that are potentially impacted by the ISE effect, but also adhere to the particle-dominated indentation depth limit introduced by Yan et al.
3.9. Additive Yield Strength Model
The additive yield strength model utilized during the course of this work builds upon the work of [7,15,38,76,77]. The implementation of the computational thermodynamic and kinetic analysis established and introduced for gas-atomized aluminum powders by Belsito, and subsequently refined by [15,77], was carried over herein and slightly modified in accordance with a superposition principal such that:
where is the additive yield strength, “is rationalized as either a frictional stress resisting the motion of gliding dislocations or as an internal back stress”, in [76], captures the effects of solid-solution strengthening, is the dispersoid and precipitation strengthening term, “is due to hardening from forest dislocations”, in [76], captures the contribution to yield strength from the polycrystalline microstructure, i.e., grain boundary strengthening, and ranges from 1 to 2, serving as the superposition principal that aims to capture the interdependency of each term with one another at a mechanochemical level.
Accordingly, once the dislocation density is obtained via X-ray diffraction (XRD) or another method, the dislocation strengthening term can be calculated via:
where is the Taylor factor, is a constant, is the shear modulus, is the Burgers vector and is the dislocation density.
From the computational kinetic and thermodynamic analysis, the precipitation strengthening term is computed as a function of the thermal processing time by way of a summation of terms given as:
where
And
In is the precipitate volume fraction, is the precipitate radius, is a hardening constant associated with strain, is a modulus hardening constant, is an interfacial hardening constant, and is the incoherent inter-precipitate or inter-dispersoid spacing.
With respect to solid-solution strengthening, is given as:
where is another strain hardening constant and is the concentration of a given solute.
Finally, is expressed accordingly:
where is the Hall–Petch constant associated with the main matrix phase and is the microstructural grain size. Note that this Hall–Petch term is not the same as that utilized widely since the general Hall–Petch constant also encompasses the effect of other strengthening contributions due to its correlative nature. Instead, the has literally been determined by Thangaraju et al. in [76] and was utilized herein.
Considering the additive yield strength model with the chemical composition given in Figure 2, for the Al 6061 gas-atomized powder, the computed yield strength as a function of precipitation hardening heat treatment time was obtained via Thermo-Calc and DICTRA-module simulations. Through the use of JMatPro’s mechanical properties model, yield stress and hardness as a function of cooling rate for the same chemical composition was utilized to determine a linear relationship for the hardness as a function of the 0.2% offset yield strength. From the use of the JMatPro mechanical property model, the linear relationship between the hardness and yield strength for the Al 6061 compositional system considered herein was found to be given as:
with an value of . With the function captured using and analyzing JMatPro mechanical property outputs, the yield stress determined using the additive yield strength model was able to be converted to an equivalent hardness for direct comparison with the measured nanoindentation hardness as a function of precipitation hardening hold times. Stated otherwise, after the was computed, the value was substituted into the expression in place of .
Computational, Static and Dynamic Hardness
The resultant hardness from the conversion of the additive yield strength model is given in Figure 15 as the “computational” data series. By way of comparing the “dynamic” data plotted in Figure 15 with the computational hardness data, one can clearly observe good agreement between the experimental CSM nanoindentation data at an indentation depth of 250 nm for precipitation hardened Al 6061 powder and its computed counterpart. Such remarkable agreement speaks to the validity of the measurement technique in so far as aluminum powder is concerned.
Considering the fact that the underlying relations defined within the additive yield strength models strengthening terms, one may therefore be relatively confident that the models physical and metallurgical approach to mechanical property computation is robust and theoretically consistent. That said, an alternative method follows from the use of the Hall–Petch relation for the purpose of validation and verification of the nanoindentation hardness obtained for solution heat treated Al 6061 powder. When the Hall–Petch hardness relation (where is 39 HVN·μm1/2, given the fine-grained and ultrafine sub-granular nature of rapidly solidified Al 6061 powder in accordance with Sato et al. in [78] and Hasegawa et al. in [79]) was applied to the solution heat treated Al 6061 powder using the measured effective grain size of 1.53 μm, the estimated hardness was found to be 94.75 HVN. Even though this was shy of the hardness obtained for the solution treated powder when dynamic nanoindentation was employed, it is nearly the same as the hardness obtained via the additive yield strength model as well as the static hardness measured, which were both given in Figure 15.
While future work will explore the reason for the discrepancy associated with dynamic nanoindentation and strength models for solution heat treated powder, the sensitivity to strain-rate sensitivity hypothesis proposed by Leitner et al. in [65] may explain this discrepancy. Nevertheless, the agreement between the additive yield strength model, static nanoindentation, which would not be affected by the strain-rate sensitivity of the solutionized Al 6061 powder, is consistent with the trend observed when the additive strength model alone was utilized. Another challenge associated—with using the Hall–Petch model for evaluating the hardness of a processed powder follows from the fact that the microstructural nature and arrangement of the grains internal to the crystallinity of the powder experience very limited grain growth [14]. This speaks to the need for a multi-faceted model, such as the additive yield strength model, since it incorporates other contributions that are known to change as a function of thermal processing, beyond that of grain size. Tangentially, the additive yield strength model and Hall–Petch relationship not only serve to validate the integrity of the measured hardness via nanoindentation, but also introduces another avenue for the use of nanoindentation to fine-tune models associated with through-process model analysis of cold sprayable powder too.
3.10. Degassing and Additional Processing Effects
When powders are produced via atomization, moisture, hydroxides, oxides, interstitial volatile elements and gaseous impurities can become trapped during atomization [80]. Following the production of atomized powder, storage, handling and environmental exposure can contribute to the continued absorption of oxygenated volatile impurities within the powder as well as the growth and chemical modification of the outer hydroxide/oxide layer or film encapsulating the internal particle microstructure. Due to the presence of said volatiles and impurities within a given gas-atomized powder, secondary processing of the particulates as feedstock material will have detrimental effects if the gaseous species are not removed prior to consumption during powder-fed manufacturing. The negative consequences associated with powder fed manufacturing using as-atomized powder can include cracking, blistering, and insufficient component density [81]. With respect to cold spray in particular, surface oxides and hydroxides have been shown to raise the critical velocity of an aluminum microparticle by 14% in [82]. In order to overcome this dilemma, powder metallurgists have developed a post-atomization pre-processing method referred to as “degassing”.
3.10.1. Aluminum Powder Degassing
While other thermal processing conditions, such as artificially aged or annealed, are identified and standardized according to legacy data, specimen composition and geometry, and principles outlined and documented by standardization societies, “degassing schedules are derived empirically and hence may not be optimized with respect to the surface film chemistry changes being sought or the effect of the thermal exposure on the alloy and hence its subsequent deformation behavior and properties”, according to Tweed et al. in [83]. In other words, degassing parameters are not universal and must be evaluated in accordance with a case-by-case basis. The identification of a degassing procedure via parameter optimization must be undertaken in this manner to ensure that the thermal conditions and degassing hold times at elevated temperatures are minimized in an attempt to avoid significant microstructural modification. As observed by Yamasaki and Kawamura, “excess of degassing leads to decomposition of rapidly quenched phases”, as well as the prospective ripening or formation of undesirable secondary phases in Al-based powders [84].
Having already made mention of the fact that the kinetics associated with gas-atomized powders are uniquely more rapid relative to their respective wrought/cast counterparts, it stands to reason that the time required to achieve the degassed condition will be relatively short compared with thermal treatment times associated with bulk materials of the same chemical composition. Therefore, the identification of the proper degassing hold time at an elevated temperature must be performed on a per-powder basis. By way of building upon earlier efforts to establish degassing guidelines in relation to cold sprayable particulate feedstock, nanoindentation was employed herein as a means of identifying an appropriate hold time at 400 °C for Al 5056 powder. To that end, Figure 17 presents the nanoindentation hardness of gas-atomized Al 5056 as a function of degassing time at 400 °C, which was performed using a DSC.
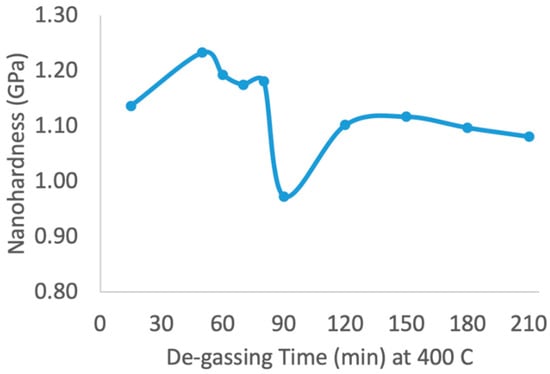
Figure 17.
The hardness of Al 5056 gas-atomized powder as a function of degassing hold times at 400 °C is presented graphically herein.
Within the realm of cold spray materials consolidation, research has established the fact that an increased concentration of oxygen in a given aluminum powder is indictive of an increased critical impact velocity () required for particle/substrate bonding [85]. As noted by Kang et al., “the critical velocity linearly increases with feedstock oxygen content” for Al particles [85]. Since the is known to increase with increased Al powder oxygen content, one may invoke the relationship between and the ultimate tensile stress () of a powder particle identified in [86] as follows, where:
such that
In the equation, and are empirical factors, is the density, is the reference temperature at 293 °K, is the melting temperature, is the specific heat, and is the impact temperature. Alternatively, the could also be expressed as a function of the particle yield strength as follows, for a reference material, such that:
according to [86]. Consequently,
In accordance with the fact that the may be defined as a function of the of a material, it stands to reason that:
which implies that the
too, since
where
for Al alloys according to [87].
From the proportionality just established, the sudden decrease and occurrence of a local minima at 90 min in Figure 17 suggests that the gas-atomized Al 5056 can be degassed in a relatively short amount of time at 400 °C. As for the sudden increase in hardness at 120 min and acute decrease thereafter suggests that secondary phase coarsening and formation within the gas-atomized Al 5056 powder was beginning to mostly harden the powder as an unintended consequence of thermally degassing the Al 5056 powder for an undesirable length of time.
Consideration of Table 2 as well as Figure 18 substantiates the prospective growth and coarsening of secondary intermetallic precipitates after 90 min of degassing Al 5056 at 400 °C. Specifically, given the composition provided in Figure 2, the equilibrium phase weight and volume fractions were computed using Thermo-Calc and detailed in Table 2 for Al 5056 at room temperature. At the same time, consideration of the equilibrium phase diagram as a function of temperature for said Al 5056 composition was also formulated and given in Figure 18. As such, one may observe Al6Mn and Al13Fe4 as having an increased tendency of chemical reactivity within Al 5056 at 400 °C for prolonged exposure times. From the standard condition data presented in Table 2 and the equilibrium phase diagram as a function of temperature, particularly 400 °C, the proposed explanation assigned to the increase in gas-atomized Al 5056 hardness after 90 min is consistent with Yamasaki and Kawamura’s warning presented herein [84].
Table 2.
Gas-atomized Al 5056 powder equilibrium phases from Thermo-Calc analysis at 20 °C.
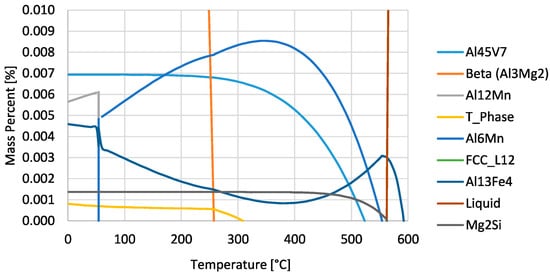
Figure 18.
Mass percentage of predicted equilibrium phases from Thermo-Calc for gas-atomized Al 5056 as a function of temperature.
3.10.2. Nanoindentation of Copper Powder
Under standard ambient conditions, previous work has demonstrated that the solubility of pure Cu is less than 2 ppm in weight percent. When the concentration of oxygen is found to be greater than the 2 ppm threshold in weight percent, the oxygen will have reacted with the copper to favorably form Cu2O along the grain boundaries as well as a Cu2O non-passivating surface film. According to a technical report by Magnusson and Frisk [88], the diffusion of oxygen as an impurity in pure copper can be expressed as a function of temperature such that:
where the expression of is given with units of m2·s−1. That being said, the favorability of Cu2O formation may be partly attributed to the greater thermodynamic stability of cuprous oxide in comparison with CuO, which is known to undergo reduction more readily at lower temperatures (such as those associated with ambient standard storage conditions) than that of Cu2O. Considering the relative implications of this subsection of the present manuscript, a simple 2D adaptation of the atomic oxygen diffusion distance within copper as a function of time may be given as:
when Brownian atomic motion is assumed. Accordingly, once a cold sprayable copper feedstock is either manufactured and then exposed to ambient environmental conditions or thermally preprocessed via degassing, or thermal softening prior to deposition, and stored under similar conditions until use, one can assess the oxygen impurity penetration profile for cold sprayable copper. The oxide shell thickness for copper is known to be at least 3 to 5 nm according to work performed by White and Germer in [89], wherein the authors found the “surface oxide thickness as a function of time at room temperature” via empirical analysis.
Nevertheless, for copper powder with a diameter of between 15 and 53 m, oxide layer thickness was approximately 15 and 20 nm, respectively, according to [90]. By way of analyzing the relationship between particle size, oxide film thickness and internal particle oxygen content remaining, the determination of a mathematical relation between and oxygen content can be related back to the mechanical properties of copper particulates, among other matters of importance to the cold spray community. To achieve the unification of these properties with one another let us consider the case where the diameter of a given pure gas-atomized copper powder particle is 15 m with a critical velocity of 610 m/s, as reported by Sousa et al. in [23]. At the same time, a survey of the relevant literature relating pure copper powder oxygen weight percent to critical velocity in order to formulate a mathematical relationship between the two properties. Upon surveying said literature [91], a logarithmic expression with an value of 0.9419 was obtained from the data presented in Figure 19.
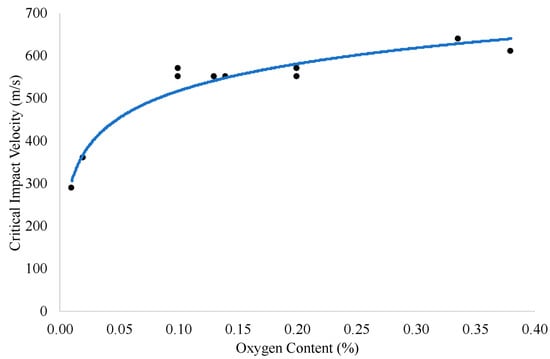
Figure 19.
Unlike Al powder, which has been shown to yield a linear relationship between the critical impact velocity and oxygen content, we have graphically illustrated the logarithmic relation identified in this figure for gas-atomized commercially pure copper powder oxygen content and the critical impact velocity.
The logarithmic expression associated with the data graphically presented in Figure 19 resulted in the following equation:
where is oxygen content expressed in terms of weight percent (wt %). Using the critical velocity of 610 m/s, solving for resulted in an oxygen content of 0.2717 wt %. In order to truly asses the validity of the extended effort to explicitly connect oxygen content with critical velocity and critical velocity with the strength or hardness of the powder from an additionally explicit relation between strength/hardness and oxide content, consideration must be given to the location associated with the element oxygen present.
In other words, if all of the oxygen content was associated with the surface film, then the link between the oxygen content and hardness would be superficial given nanoindentation’s applicability to measuring the properties interior to a powder particle (unless modified for particle compression testing, which shall be discussed shortly hereafter). If, however, the oxide film thickness does not consume 100% of the oxygen content, the utility and validity of the present exploration stands. Therefore, the following analysis was performed to determine the oxygen content within the surface film, the oxygen content in solid solution, and the oxygen content remaining that would have to be located along the grain boundaries as nano-scale Cu2O secondary phases using the oxygen wt % for a particle with a diameter of 15 μm.
Assuming a Cu2O surface film with a layer thickness of 15 to 20 nm, and the oxygen content derived from the logarithmic expression provided above:
such that
where is the mass of oxygen, is the density of Cu2O, is the molecular weight of oxygen, is the molecular weight of Cu2O, is the volume of the oxide shell, Cu2O film, on the pure copper powder particle perimeter, is volume of the entire particle, is the volume without the oxide surface film, is the film thickness, and is the particle diameter. That being said, once is obtained, the wt % of oxygen on the surface may be calculated from:
Calculations using these equations and material densities resulted in a value of 0.008 wt % oxygen within the 15 nm thick surface film. Coupling this value with the fact that the solubility of oxygen in solid solution within the 15 m powder particle is 0.0002 wt %, the remaining oxygen dispersed throughout the interior of the powder along the grain boundaries in the form of Cu2O, which harden the particles as well, must be 0.2635 wt %, which is extremely significant and speaks to the validity of relating particle oxygen content with hardness/strength and the critical impact velocity.
Future work will therefore center upon the use of nanoindentation to measure particle strength/hardness and utilize the measured values from nanoindentation as the in the following equation for the critical impact velocity such that oxygen content can be obtained from setting the critical velocity equal to the logarithmic expression and solving for accordingly. During the course of such future work, this approach would be applied to commercially available gas-atomized pure copper powders with varied oxygen content for verification of the logarithmic expressions’ accuracy and suitability:
3.10.3. Cooling Rate, Grain/Particle Size and Hardness
In keeping with the cold sprayable copper particulate feedstock for the time being, nanoindentation can serve as a tool for inspecting the effects of rapid solidification upon the resultant gas-atomized microstructure in accordance with the processing-properties-structure-performance paradigm of materials science and engineering. Using a previously developed cooling rate model for gas-atomization to predict the secondary dendrite arm spacing (SDAS) that is expressed as a function of the gas-atomized powder particle diameter according to [7],
where the left-hand side of the mathematical relation is the cooling rate, Cp is the specific heat of the droplet, Td is the droplet temperature, Tg is the gas-atomizing temperature, is the droplet density, kg is the thermal conductivity of the gas, and d is the droplet diameter. Given the fact that Company C utilized argon gas during the gas-atomization process for pure copper powder production, the cooling rate was able to be calculated using the thermal conductivity of Ar gas. Subsequently, the SDAS was able to be expressed as a function of cooling rate and therefore powder particle diameter via the following range of values according to:
where was clearly identified as the cooling rate defined in the previous equation [92].
Due to the highly non-equilibrium conditions associated with the process of gas-atomization, as well as the degree of undercooling associated with crystallite nucleation and formation upon rapid solidification, the SDAS microstructural feature size corresponds with the sub-grain size correlated with the powder and has been found to act as an effective grain size dictating mechanical behavior. By way of coupling the prior solidification model detailed in relation to the particle size and SDAS, we may utilize the Hall–Petch relationship for copper wherein:
such that is the yield strength, and are material-specific constants, and is the grain size. From the work of Gertsman et al. we know that , in MPa, is 92 ± 12, , in MPa μm0.5, is 399 ± 61, and is in units of μm [93].
As a result, we may compare the nanoindentation hardness-based yield strength, derived using Tabor’s relation, with the yield strength obtained from the Hall–Petch relation. Due to the ISE, it was unsurprising to find that the hardness derived yield strength was 422.58 MPa, for the gas-atomized powder, which was slightly greater than the upper bound (412.04 MPa) associated with the Hall–Petch relation given above. Nevertheless, the slight difference with the upper bound of the Hall–Petch yield strength and the hardness-derived value is commendable given the limited nanoindentation depth that can be achieved when testing a stiff particle mounted in a compliment mounting material before the mounting material begins to influence the measured properties.
Even with the aforementioned difficulties surrounding a one-to-one comparison between the predicted strength and measured mechanical response for rapidly solidified gas-atomized particles, as exemplified in the case of copper above in Figure 20, the degree of agreement was encouraging. That is to say, the proximal agreement between the prediction and experimentation serves to validate the use of computational models, like the additive yield strength model, for property inspection and evaluation in-silico. In turn, gas-atomized Al 6061 from Company B was tested via nanoindentation and plotted against the JMatPro mechanical property model as well as an early rendition of the additive yield strength model in Figure 21. By way of comparing the computed and measured hardness values as a function of particle diameter and in turn cooling rate-dependent grain size associated with gas-atomization processing conditions, the utility of nanomechanical inspection and assessment became apparent with respect to verification and validation of models associated with cold spray material consolidation.
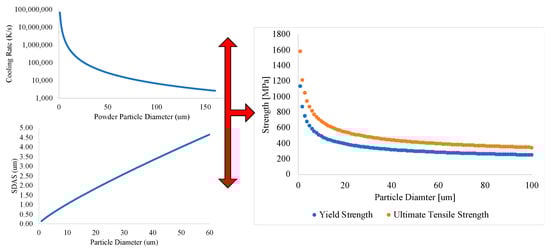
Figure 20.
The upper left-hand plot presents the cooling rate as a function of powder particle diameter. The secondary dendrite arm spacing (SDAS) is given as a function of particle diameter on the lower left-hand plot. Finally, the strength as a function of particle diameter is plotted for pure copper on the right-hand side. The cooling rate is able to discern the SDAS size as a function of particle diameter, such that the Hall–Petch relation can unveil the strength-particle behavior. The multiple red arrow tips were imposed upon the figure to highlight the interplay between the y-axis variables.
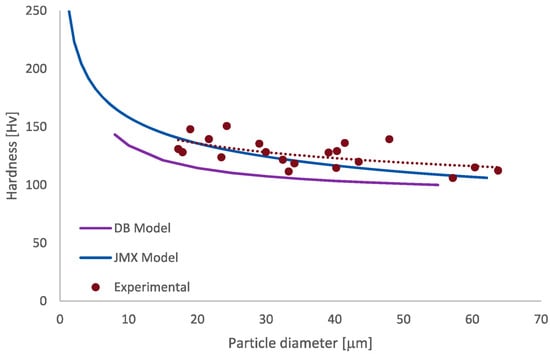
Figure 21.
Hardness as a function of powder particle diameter associated with an earlier version of the additive yield strength model and the JMatPro mechanical property model, identified in the legend of the graph as “JMX,” hardness model compared to experimentally measured nanoindentation and microscopy informed data.
From a cursory view of Figure 21, one will note good agreement between the JMatPro mechanical property model and the experimental hardness’s as a function of particle diameter. However, at the time that the “DB Model” version of the additive yield strength model was employed, only semi-coherent and fully coherent precipitates were considered in the precipitation strengthening contribution term. Furthermore, in the “DB Model” state, only one precipitate was included for the alloy and a preliminary dislocation density was assumed, all of which speak to the difference between the JMatPro mechanical property model output, identified as the “JMX Model” in Figure 21, the DB Model and nanoindentation-derived hardness values presented in the respective graph. Hence, when the most current iteration of the additive yield strength model is employed, as detailed earlier in the article, one would find even greater agreement with the JMX Model and “experimental” data points.
Within the present subsection of the Results and Discussion, nanoindentation has been utilized as a tool that readily compliments theoretical/computational viewpoints surrounding the relationship between cooling rate and particle/grain size. While particle sizes were derived in-silico for Figure 20, and the experimental particle size was derived through etched grain size analysis, as detailed in the caption associated with Figure 21, an explicit effort was taken to confirm the (general) prospective dependence of hardness upon particle/grain size. The explicit experimental approach was achieved by way of applying nanoindentation testing to gas-atomized Al 6061 powder from Company B after the powder was mechanically sieved to different size ranges. The average nanoindentation hardness values as a function of sieve size range are presented in Table 3.
Table 3.
The average nanoindentation hardness values as a function of sieve size range are presented for Al 6061. gas-atomized powder herein. Note that the decreased hardness associated with particle size for Al 6061 is not universal since other microparticles undergo solidification-based undercooling, for example, which effects the resultant microstructure of a material.
3.10.4. Thermal Processing Design and Prototyping
Part of the powder processing stage of the through-process model established by Belsito et al. [7,94,95] for cold spray is the use of the previously introduced additive yield strength model. Accordingly, the validation of the additive yield strength model by way of comparison with nanomechanical assessments achieved via nanoindentation of powder particles enables a greater degree of confidence when applying the additive yield strength model during through-process modeling research and development. Extending the validation and verification achieved when Figure 21 is considered, one may continue by iterating through varied powder processing conditions to compute the contribution of the microstructural grain size to the additive yield strength expression for numerable pre-processing conditions.
As such, Figure 22 and Figure 23 demonstrate the utility of using grain size as a function of particle size and thermal processing condition and the microstructural contribution to the particle strength. By way of extending the validation of the additive yield strength model achieved through dynamic CSM-based nanoindentation in particular, one may pursue rapid iterative and automated analysis of varied powder compositions and thermal pre-processing parameters for a target cold spray application. This could be achieved, for example, by way of utilizing the Python-based API associated with Thermo-Calc for automating and encoding routines for in-silico identification of thermal pre-processing times and temperatures as a function of composition for cold spray materials consolidation.
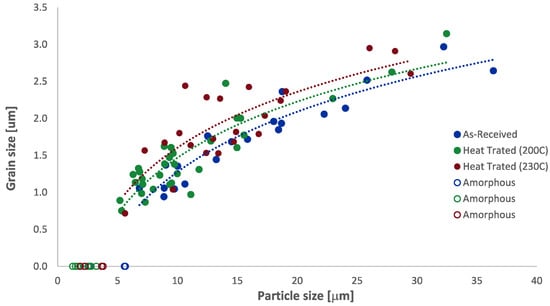
Figure 22.
Grain size as a function of particle size for gas-atomized powder in the as-atomized condition and two thermally processed conditions, which were achieved after 24 h of hold time at 200 and 230 °C and labeled as such in the graphs key.
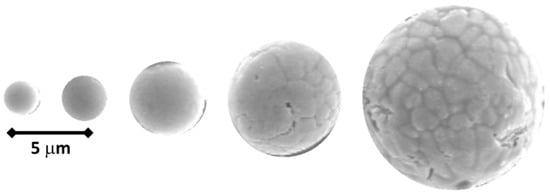
Figure 23.
SEM micrographs of gas-atomized Al 6061 particles (to scale) depicting the microstructural variation function of the powder particle size. SEM micrographs corroborate the experimentally observed amorphous structure at particle sizes that are at least less than 10 μm, and generally less than 5 μm, in Figure 22.
The effect of heat treatment was studied for two heat treatment conditions in an experimental nature only. Grain size as a function of powder particle size was measured for as-received powder and powder heat treated for 24 h at 200 and 230 °C. There was a 5% to 10% grain size increase between the as-received at 200 °C treated and between the 200 and 230 °C treated. From the grain sizes associated with the gas-atomized and heat-treated conditions, the microstructural contribution to the additive yield strength can then be confidently integrated into the validated additive yield strength thereafter.
Beyond copper and aluminum, we previously reported the way in which thermal processing hold times can be tailored to the kinetics associated with stainless-steel gas-atomized powder at the micrometer scale via dynamic nanoindentation testing. As we stated in our recent open-access research article:
“Nanoindentation performed using the continuous stiffness measurement approach was employed as a methodology for evaluating the success achieved via austenitization of the powders as a function of holding time at the prescribed austenitization temperature… nanoindentation of the processed powders revealed a nearly continuous decrease in hardness as the hold time was increased… A decrease in hardness was found to correlate with an increase in the amount of austenite present and therefore a decrease in the amount of ferrite within the powder” [18].
The results of this effort are presented in Figure 24.
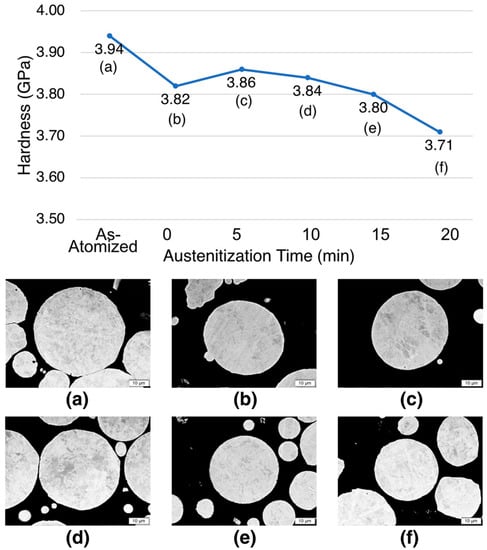
Figure 24.
Hardness of the stainless-steel powder particles as a function of austenitization time are presented herein [18]. (a–f) present cross-sectional SEM micrographs of the powder for each austenitization time. The as-received gas-atomized powder is presented in (a); (b) depicts the powder after reaching 840 °C and being immediately cooled thereafter. At the same time, (c) depicts the powder after reaching 840 °C and being held for 5 min, while (d) depicts the powder after reaching 840 °C and being held for 10 min. Similarly, (e) depicts the powder after reaching 840 °C and being held for 15 min, whereas (f) depicts the powder after reaching 840 °C and being held for 20 min.
3.11. Dynamic Single Particle Compression
Having provided a detailed discussion and analysis surrounding the use of nanoindentation for the purpose of evaluating the mechanical properties of a given cold sprayable feedstock material (or powder particle generally), additional findings that are under continued refinement and development are provided within this section of the paper. As shown in the aforementioned sections of the manuscript, the application and proper extension of nanoindentation to the realm of single powder particle characterization requires sensitive consideration of a number of indentation test parameters. Regardless, in so far as the property of hardness is concerned, Tuckerman said it best when he stated that hardness is “a hazily conceived conglomeration or aggregate of properties of a material, more or less related to each other”. In other words, hardness is not an innate material property and does not provide fundamental insights into a materials behavior under tensile and compressive stresses and strains. Since cold spray is readily entering the structural materials domain, properties such as yield strength, creep, and strain-rate sensitivity, for example, must be evaluated for both the consolidated materials as well as the particulate feedstock.
3.11.1. Powder Prior to Compression Testing
To overcome this dilemma surrounding the determination of structural properties from nanoindentation for particulate cold sprayable feedstock, a dynamic single particle compression test was devised, by way of building upon a method originally presented by Nanomechanics, Inc., in an application note accessible through their website, to determine the compressive stress–strain relation as a function of particle diameter. Since the contact area of a flat-platen is constant and does not change with indentation depth like that of a Berkovich or spherical tip there was no need for contact area function calibration via the Oliver-Pharr method. The 75 μm diamond flat-punch tip was purchased from Synton-MDP. The alloyed aluminum powder studied herein was that of Al 5056 from Company E, given the idealized sphericity their process for manufacturing powder achieves. Figure 25 depicts the Al 5056 powder from Company E prior to particle compression testing.
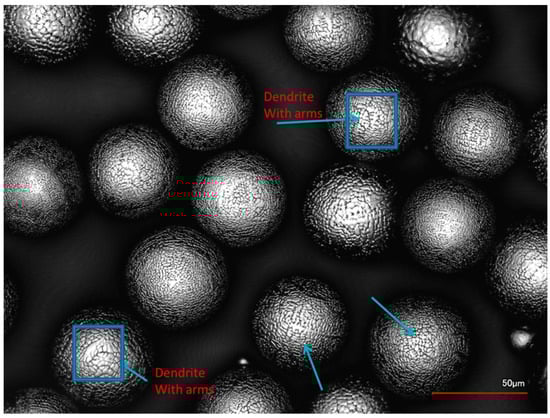
Figure 25.
Three-dimensional (3D) laser scanning confocal micrograph of rapidly solidified Al 5056 powder from Company E. The dendritic solidification microstructures can be directly obtained in the micrograph.
To disperse powder onto a hard surface for single particle compression testing, a glass microscope slide was broken to a suitable surface area and fixed to the sample holder using crystal bond. A paint brush was used to place the particles onto the glass slide and compressed air removed excess powder. Figure 26 depicts a powder particle following compression testing.
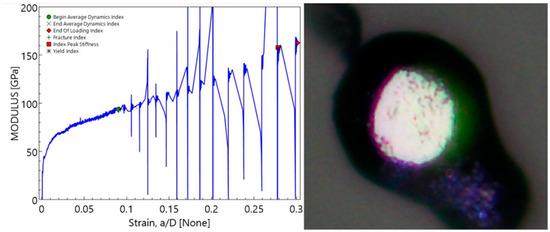
Figure 26.
versus strain as well as a particle post compression.
3.11.2. Modulus of Elasticity vs. Strain
Analysis of the data at first concerns the elastic modulus of a given powder particle versus the nominal compressive strain associated with compressing the material. For a powder particle with an approximately 32 μm diameter, more than 10 μm particle compression displacement was achieved with strains upwards of 0.30. From Hertzian contact theory, a sphere being compressed between two flat planer surfaces achieves an elastic modulus that may be expressed as:
where is the compressive force applied, is the particle diameter, is the Poisson’s ratio of the powder particle, and is the compressive displacement. Since the InForce 1000 mN actuator also has dynamic oscillatory abilities, i.e., CSM capabilities, the modulus may be alternatively expressed as a function of stiffness, given as the derivative of load with respect to , such that:
3.11.3. Compressive Particle Strength
According to [96,97], the nominal fracture strength of a single particle can be expressed as:
where is the recorded force associated with the onset of fracture, is the diameter of the particle prior to compression and is the nominal fracture strength. Alternatively, the nominal compressive stress () can be obtained by way of the formulation proposed in [98], which is expressed as follows:
That being said, there are no shortage of different definitions of stress that need to be explored, and will be explored in future work, to fine-tune the particle compressive stress–strain curves extraction approach. For example, [99] proposed the following definition of tensile stress () associated with particle compression such that
By employing various definitions of stress, as defined above, or defined by others such as [100], where
and is the micro yield strength, is the average modulus of elasticity, is the displacement at the yield point and is the radius of the particle, different values of strength will be obtained accordingly. This speaks to the need for continued testing and evaluation of the particle strength from this newly developed method. Nevertheless, in so far as an initial “back of the envelope” calculation is concerned, the yield strength of an Al 5056 particle with a diameter of 32 μm was approximately 385.33 MPa.
3.12. Crystallographic Dependancy of Nanoindentation
The affiliation between a particulate’s crystallographic orientation of individual grains and the resultant nanoindentation hardness was explored herein. Specifically, the objective of this section was to build upon the noteworthy set of prior papers that have shown a relationship between the grain-orientation informed nanomechanical response observed for polycrystalline materials during depth-sensing nanoindentation. As initially discussed in [2], which was produced by the authors of the present manuscript, this was done by looking at a metal alloyed powder with smaller grains relative to those already researched. EBSD coupled with field-emission SEM was used to quantify grain orientations. EBSD of gas-atomized metallic powder revealed a large angled grain size of 1 to 5 μm that was highly variable from particle to particle, which is consistent with [14,15,16]. EBSD and nanoindentation were used to evaluate the effects of grain orientation on the response to nanoindentation of gas-atomized Al 6061 powder from Company B.
3.12.1. Orientation-Dependent Powder Properties
EBSD informed nanoindentation analysis found that the orientation aligned with the [111] direction had a hardness of 1.25 GPa while the [101] direction had a hardness of 0.73 GPa, as shown in Figure 27. The average hardness was determined to be 1.17 GPa for the powder which is consistent with gas-atomized Al 6061 powder as reported in [7,38,77]. Additionally, the nanoindentation modulus of elasticity of the powder grains as a function of crystallographic orientation was measured. The grain aligned with the [111] direction had a modulus of 74.12 GPa while the grain aligned with the [101] direction had an elastic modulus of 65.34 GPa.
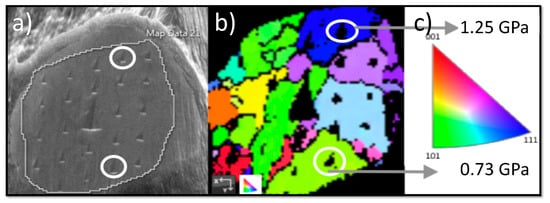
Figure 27.
(a) SEM micrograph of a particle post-nanoindentation, (b) electron back scatter diffraction (EBSD) image showing inverse pole figure (IPF) direction X orientation, and (c) color map of Miller indices and hardness of adequate indents.
3.12.2. Prospective Implications for Cold Spray
The effect of grain orientation as well as grain orientation related mechanical properties within a feedstock particulate as it relates to cold spray hasn’t received thoughtful analysis to date. Little has been reported with regard to grain orientation informed mechanics of grains and sub-grains within a powder particle as it concerns the prompt incidence of impact induced particle deformation and dynamic recrystallization of the initial polycrystalline microstructure. Rather, when grain orientations are studied in literature for feedstock particulates as well as the resultant cold spray material consolidations, qualitative and semi-quantitative examination has commonly been restricted to the occurrence of heterogenous and apparently random distribution of grain orientations as a result of severe plastic deformation [101,102,103]. With respect to the relationship between grain orientation and particle impact mediated deformation, one could posit that grains with lower hardness’s would more readily to the onset of dynamic recrystallization. Though the mean pressure during particle impact [104] readily exceeds the mean contact pressure [105], i.e., hardness, associated with each of the grain orientations, the gradient of mechanical properties as a function of grain orientation could cause more prominent grain refinement where [101] orientated grains are located.
Otherwise, an increased concentration of dislocations from severe plastic deformation could also be generated more readily via grains that have a [111] orientation regardless of strength. Dislocation accumulation at prior grain boundaries is alleged to drive the dynamic recrystallization. Therefore, the hardness of a grain may not completely attest to the propensity of a grain to endure more or less prevalent grain modification. When dislocation motion is considered, the [111] orientation is comprised of the closed packed planes within an FCC structure. Thus, a well-defined grain refinement could be propelled by the capacity to transfer dislocations as they accrue and instigate recrystallization rather than the hardness of a given grain. Considering the dynamic recrystallization of the powder’s polycrystalline microstructure during cold spray processing, in contrast with that of the instantaneous incidence of impact induced particle deformation, an additional hypothesis can be expressed. In light of the observations made by [1,68] suggests that certain orientations are favored during recrystallization as a result of severe plastic deformation. Therefore, Figure 28 exemplifies how the grains within deposited particles deform and become refined at particle–particle interfaces.
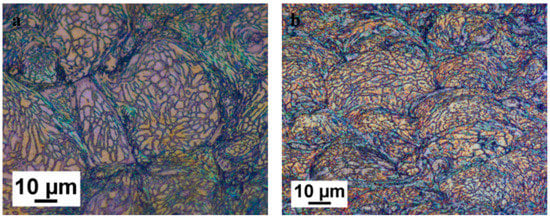
Figure 28.
Optical micrograph of cold spray Al 6061 that was etched using Weck’s reagent and viewed under polarized light. (a) Spray direction is parallel to the orientation shown; (b) cross-section of cold spray sample where the spray direction is perpendicular.
In an FCC structure, the [111] orientation accounts for 100% of the closed packed planes [106]. Earlier work has proven dislocation motion within a cubic crystal system commonly transpires along closed packed planes because the Burgers vectors are minimized along such planes. Dislocation motion tends to occur along the closed packed plane due to the fact that Pierl’s lattice friction stresses are minimal given the minimization of the Burgers vectors and maximization of vertical lattice spacing [107]. With this in mind, the capability to amass dislocation origination and motion within the [111] orientation may function as a mechanistic intellectual scaffolding for understanding why the nanoindentation hardness along the [111] orientation is larger than that of the [101] and [001] grain orientations.
The dislocation hardening within the [111] orientation due to the plastic deformation from nanoindentation assessment may serve as a means of understanding the orientation dependence of hardness. The prevention of dislocation motion along the [101] orientation thus relates to the lesser hardness in the [101] orientation versus that of the [111] orientation. Additional extrapolation of motion dislocations along closed packed planes in cubic crystal systems could also introduce slip systems into a more wide-ranging understanding of the mechanisms responsible for orientation dependency of hardness as some have conveyed elsewhere [107]. These findings are consistent with earlier work that studied orientation-dependent mechanical properties. Pathak et al. studied as-cast and deformed polycrystalline FeSi steel and also detected higher hardness within grains with [111] orientation in [108]. Vachani et al. considered a deformed polycrystalline aluminum and found increased hardness’s associated with the [111] orientation in [109], which also agrees with reference [110].
3.13. Dynamic Spherical Nanoindentation
While single particle compression has briefly been shown to be a versatile tool, an alternative strategy for mechanical characterization surrounds the application of CSM-based spherical nanoindentation stress–strain protocols to particles to obtain their strengths. Synton-MDP was identified as the source for procuring cono-spherical tips of 1, 2, 5 and 10 μm nominal radii were purchased for use in the NanoFlip and iMicro Pro suites.
3.13.1. Tip Geometry and Imperfections
The first diamond spherical nanoindenter tip that was purchased for use within the two nanoindentation testing systems, which were acquired from Nanomechanics, Inc., now a KLA company, showed geometric imperfections moving away from the apex of the nanoindenter tip. This initial tip was purchased from Micro Star Technologies, Inc., which is renowned for their ability to fabricate sharp nanoindenter tips and underwent initial testing on reference samples that showcased the geometrical imperfections associated with the tip given the inconstant data obtained. The data captured with the initial tip prompted inspection of the residual indentation mark that remained upon the reference sample after plastic deformation through confocal microscopy. Additionally, the initial tip was also inspected with an Olympus Corporation confocal microscope that was previously housed within the Surface Metrology Laboratory at WPI and managed by Professor Christopher Brown. As such, the confocal micrograph of the residual imprint is presented in Figure 29 below.

Figure 29.
Residual indentation imprint on a single crystal of commercially pure Al obtained using 3D confocal microscopy-based analysis.
Though qualitative insight can be derived from the inspection of Figure 29, more sophisticated analysis of the diamond nanoindenter tip itself not only enables quantitative evaluation of the tip geometry but also captures the deviation from ideal cono-spherical geometry without external dependence upon the residual indentation imprint remaining on a reference sample. By way of using the same Olympus confocal microscope, analysis of the tip imperfections associated with the initial diamond spherical tip from Micro Star Technologies, Inc., are shown in Figure 30, Figure 31, Figure 32 and Figure 33.
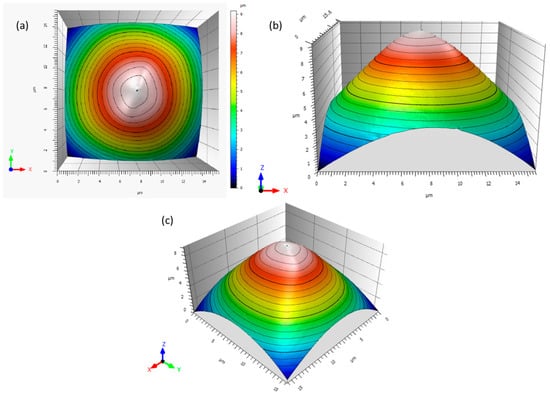
Figure 30.
Renderings of the imperfect tip geometry obtained when a cono-spherical tip was purchased from Micro Star Technologies: (a–c) have been normalized in the x, y, and z directions. (a) Demonstrates the degree of deviation of the actual tip geometry from an ideally spherical tip at the apex of the indenter probe. Notice the scale bar in microns to the right of (a), which topographically signifies the distance from the point of Cartesian coordinate origin parallel to an x-y plane that is orthogonal to the z axis.
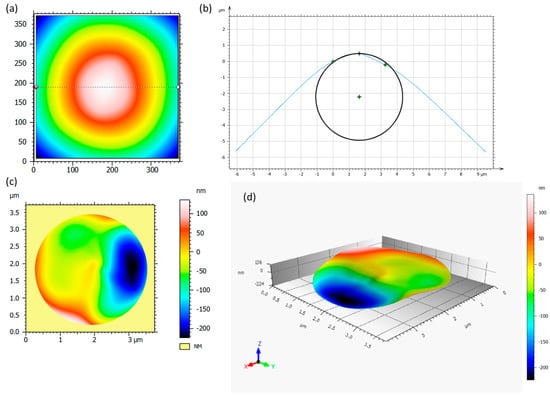
Figure 31.
(a) Depicts the location of the extracted tip profile, which was obtained through the very tip of the probe’s apex. (b) Illustrates a circle with a nominal radius of 2.71 μm fit to the profile presented and obtained in (a). The circle in (b) is positioned such that it is both coincident with the tip of the apex as well as parallel to the z-axis. Notice the deviation from the imposed circle in (b) by the profile between approximately 1.5 and 3.5 μm on the horizontal axis. (c,d) Present the deviation of the true surface from an ideal sphere of a 2.71 μm radius. The rendering’s shown in (c,d) are normalized in the x- and y-directions with vertical distortion in the z-direction to clearly capture the deviation via colored contour plotting.
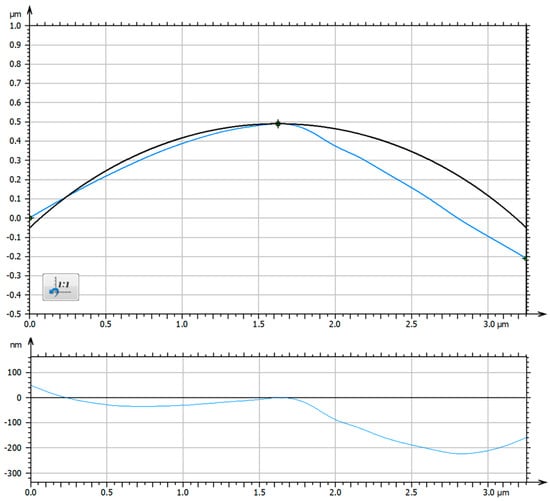
Figure 32.
The upper graphical rendering illustrates the true surface profile at the spherical region in the blue line versus the ideal surface profile for a spherical tip with a 2.71 μm radius in the black line. The figure compliments Figure 31b. The plot introduced at the bottom of this figure clearly captures the surface profile deviation from a circle of the 2.71 μm nominal radius.
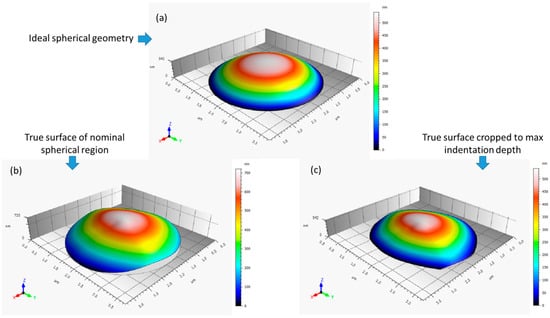
Figure 33.
Even though the maximum indentation depth associated with a nanoindenter tip of 2.71 μm is 794 nm according to , the max cut off depth before the transition from spherical shape to a conical geometry was set at 542 nm to readily showcase the spherical geometric profiles. Therefore, at 542 nm away from the apex of the perfectly spherical tip, the ideal spherical geometry is presented in (a). (b) Unveils the true surface profile associated with the tip from Micro Star Technologies up to 794 nm from the apex. For comparison with (a), (c) captures the actual surface cropped to the same vertical dimension as the ideal surface, highlighting the deviation. Renderings were normalized in the x, y, and z directions.
As can be seen through Figure 30, Figure 31, Figure 32 and Figure 33, the manufacturability of a suitable cono-spherical nanoindenter tip was shown to be a non-trivial task. Numerically, for a tip with a spherical radius of 2.71 μm, an ideal spherical geometry would yield a surface contact area of 8.29 μm2. Unfortunately, the deviation from the ideal geometry of the initial tip acquired resulted in a measured surface contact area of 7.41 μm2, which speaks to the sensitivity of spherical nanoindentation to the tip geometry and quality of the tip used. With the aforementioned in mind, Synton-MDP was identified as a suitable source for more idealized spherical tips. Regardless, the fact that such a divergence of the Micro Star Technologies tip from a suitable spherical geometry speaks in favor of using the Oliver-Pharr contact area function calibration at such shallow depths.
3.13.2. Method of Analysis
In so far as the theory associated with the evaluation of stress–strain curves are concerned, the following definitions associated with a refined protocol are given below.
where is the reduced modulus, is the stiffness and is the contact area. In so far as is concerned, for some reason, contemporary researchers have not recognized the statement by Oliver and Pharr in [41], which states that “The contact area and hardness determined by the two methods will thus be the same as will be the elastic modulus because… [it] applies to any indenter geometry.” Representative indentation strain ( has been defined as either,
or,
depending upon the researcher, where is the displacement, is the radius of contact and is the effective radius. In so far as a representative indentation stress is concerned, Leitner et al. [111] reestablished the link between mean contact pressure or hardness (H) and stress, which was originally established by Tabor, by way of taking a more sophisticated approach to the definition of a constraint factor (). Therefore, if:
then is expressed as a function of the ratio () of contact stiffness (S) to the slope of the load/contact depth curve () such that:
and
where
3.13.3. Resultant Stress–Strain Behavior
Using the aforementioned definitions, the stress–strain curve for Al 6061 powder that was thermally processed at 230 °C is given in Figure 34. An average yield stress for the Al 6061 powder at 230 °C was less than 300 MPa, which is greater than the peak aged yield stress of 240 MPa to 250 MPa) of a bulk Al 6061 counterpart that was precipitation heat treated at 232 °C after solutionization [64]. When compared with the yield stress associated with homogenized Al 6061 powder that was reported by the University of Connecticut in [112], there is good agreement as well, since they measured a yield strength of 216 MPa after solutionization but before precipitation hardening.
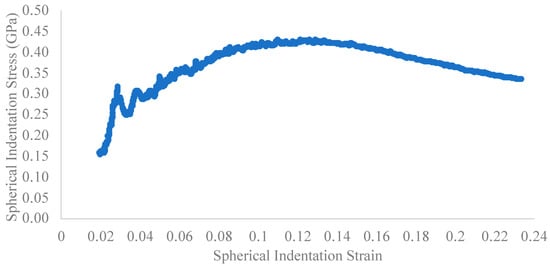
Figure 34.
Spherical nanoindentation stress–strain curve for Al 6061 powder obtained by way of CSM-based analysis.
3.13.4. Additional Validation
To substantiate the claims made regarding the ability to determine stress–strain curves of the feedstock powder presented in Figure 34, spherical nanoindentation of commercially pure bulk polycrystalline aluminum was also studied. To demonstrate the accuracy of the modulus of elasticity measured using a spherical tip, the data was compared with the results obtained when measured with a Berkovich tip. Additionally, the hardness values were also compared. Both showed good agreement as illustrated in Figure 35 and Figure 36. The slightly higher hardness obtained through the use of a spherical indenter tip is expected given the geometry.
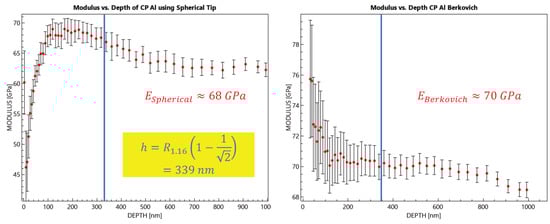
Figure 35.
Comparison of elastic modulus measured using 1.16 μm radius spherical tip as well as Berkovich indenter tip for commercially pure aluminum.
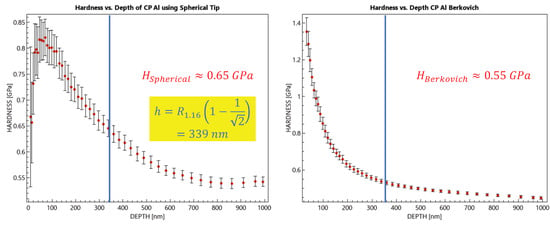
Figure 36.
Comparison of hardness measured using 1.16 μm radius spherical tip as well as Berkovich indenter tip for commercially pure aluminum. The slight difference in hardness is expected, given the fact that “hardness’s measured with a spherical indenter are not necessarily the same as those for the Berkovich”, as established by Oliver and Pharr [41,113].
3.13.5. Relation to Cold Spray Deposition
Within the cold spray community, powder-specific material properties have been sought after for the purpose of performing single and multi-particle impact simulations and computational analysis via finite element analysis (FEA). Whether the Preston–Tonk–Wallace (PTW) approach is taken, or the Johnson–Cook (JC) formulation [114], given below, is entertained, material-dependent input parameters are required. The JC relation is expressed as follows:
Traditionally, these values have been borrowed from bulk alloy data rather than measured powder properties. However, the assumed ability to utilize input parameters from literature data for a bulk material counterpart was definitively shown to underestimate the “temperature distribution during impact of copper particle, calculated using the Eulerian algorithm in Abaqus” by Assadi et al. in [115] when bulk parameters were used instead of JC parameters obtained from single particle compression testing. As pointed out by Assadi et al., “it is conceivable that the difference in temperature levels at the interface could also be relevant in the interpretation of bonding mechanism in cold spray”, even though the “the plastic strain distribution is more or less the same for both cases” and “plastic strain distribution has been considered as a main factor in particle bonding” [115]. Given the fact that A, B and n are related to the flow stress, it stands to reason that the measured and calculated yield strengths obtained herein could be analyzed further for the purpose of determining JC parameters from load-depth nanoindentation data.
Beyond the realm of enhancing particle impact modeling, this work is also relevant to determining cold spray processing parameters. Specifically, the essential parameter known as the critical impact velocity () was formulated as being dependent upon the ultimate tensile strength () of a particle in [86] as follows:
such that:
Previous research has also established a link between and particle diameter. The established link found that the increases as the particle diameter decreases. Since our work presented herein demonstrated a direct link between particle diameter and grain size followed by grain size and strength, the above direct relation between and in terms of particle diameter too and found to also be consistent with the previously established connection. The consistency between the and and and particle diameter dependency corresponds with the fact that smaller particles will have greater since their grain sizes are consequently smaller. Being able to use rapid mechanical and microstructural assessment methods for powder particle evaluation will enable more robust and rapid processing parameter optimization and cold spray performance with minimal trial-and-error. One may thus relate to in accordance with:
where is either obtained from the Tabor relation using the nanoindentation derived value or computed from the Hall–Petch relation.
In addition to the ability to refine the parameters for particle impact modeling as well as the capacity to predict from the mechanical properties and microstructure of a given powder, the kinetics and thermal processing response unique to powders vs. their bulk counterpart can assist in the pursuit of achieving strength-toughness synergy in cold spray. This can be done by way of utilizing the thermal processing knowledge obtained herein and building upon it to achieve a sprayable powder that has greater deposition efficiency, enhanced particle–particle bonding, better particle–substrate adhesion, and greater elongation-to-failure. Furthermore, this can be achieved without postprocessing the consolidated material through powder pre-processing prior to cold spray deposition. By way of assessing the transformation kinetics highlighted herein, one may more easily formulate a heat-treatment protocol that maximizes intermetallic precipitate and compound dissolution while minimizing deleterious coarsening of secondary phases and dispersoids.
3.14. Rapid Prototyping and Assessment of Powder
Within the nanoindentation literature, numerable concepts and parameters have been put forth that extend beyond that of hardness and modulus [116]. Two such properties of potential interest to the cold spray community consist of the “resistance to elastic deformation”, (), and the “ability to dissipate energy during plastic deformation”, (). Both of these parameters have previously been reported upon and utilized elsewhere in the metallurgical research sector [117,118]. In purely mathematical terms, the parameter may be given as:
while the parameter may be given as:
Such parameters have yet to be considered in the context of high-throughput assessment of powder for cold spray applications. In light of recent refinements underpinning our collective understanding of the mechanism associated with particle/substrate bonding [119,120,121], and the material properties associated with a shock-wave mediated critical velocity relation instead of an adiabatic shear instability approach, we hypothesize that the use of these two nanoindentation derived parameters could assist with pre-deposition particulate feedstock analysis and suitability evaluation for cold spray processing.
To initialize consideration of said hypothesis, two material systems that are known to be troublesome with respect to cold spray processing were studied. Specifically, alloyed titanium (non-commercially pure Ti powder) powders (e.g., TiAlV, TiNb, TiNbZr, TiVFeAl, etc.) and alloyed stainless-steel and non-stainless-steel feedstocks were acquired from Company D. Alloyed Ti-based gas-atomized powders as well as steel-based particulate feedstocks were selected for this subsection of the present research due to the fact that Ti64 and 316/304-L stainless-steels have been identified as troublesome and problematic when utilized in cold spray processes. That is not to say that alloyed Ti and steels cannot be deposited via supersonic impact phenomena related to cold spray consolidation. Rather, the focus on these two to three categories of alloys from Company D through the lens of , , and for such challenging feedstocks, coupled with the more recent shock-wave mediated particle/substrate bonding mechanism put forth by Hassani et al. has been found to provide insights that need to explored in greater detail in subsequent research as well.
To substantiate the claim that Ti-based alloyed powders that are produced via atomization prove to be remarkably difficult to deposit as a fully dense consolidated material, consider the fact that the lowest “as-sprayed” porosity observed by Blose et al. was 18% for Ti64 as stated in [122]. Due to such undesirable and structurally compromising alloyed-Ti cold sprayed coatings, numerable researchers have attempted to solve this dilemma by way of laser assistance during the cold spray process [123] and post-processing [124]. While laser assistance and post-processing will remain of interest and of value to the cold spray community at large, we hypothesize that nanomechanical assessment in the context of Hassani et al.’s critical impact velocity framework can be of use in so far as alloyed powder composition and mechanochemical deformation behavior are concerned such that process parameter optimization may also be considered.
Though steel cold spray coatings have been found to typically have porosities that are greater than 1% [125], which is too great to be considered fully dense in the context of structural or load-bearing cold sprayed material applications, the higher hardness and typical modulus ranges as well as the potential inclusion of non-cubic lattice structures (like that found in the alpha/beta arrangement of atomized Ti64) position steel-based particulate feedstocks as being well suited for comparison with alloyed-Ti powders in the context of cold spray-ability. Accordingly, the dynamic nanoindentation derived hardness’s and moduli of elasticity for 6 non-stainless-steel gas-atomized powders, 7 stainless-steel gas-atomized powders and 10 alloyed-Ti powders, which were also gas-atomized, are presented in Figure 37. Note that each of the 23 feedstock powders were sourced from Company D. The iMicro Pro was utilized to collect the data presented in Figure 37 and the only parameter changed during testing was that of the Poisson’s ratio according to the compositional designation of the feedstock.
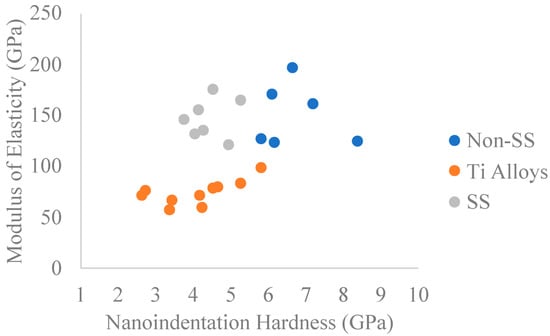
Figure 37.
Modulus of elasticity versus hardness of the three categories of steel and Ti-based gas-atomized powders.
From Figure 37 one observes the case scenario wherein the modulus versus hardness plots reveal noteworthy clustering of the three types of powder with one another. Considering the bulk material modulus of elasticity for Ti64, for example, a nuanced critic of this work would potentially take issue with the Ti-based elastic moduli presented in Figure 37. However, just as it is inappropriate to assume bulk material properties hold for rapidly solidified microparticles in the case of hardness and yield strength, the same may be said about the modulus of elasticity too. The much lower modulus of elasticity associated with the alloyed-Ti powders relative to a wrought Ti64 counterpart is actually consistent with prior work that identified gas-atomized TiAlNbTa powder as having a Young’s modulus of 80 ± 20 GPa [126]. Prior work by Lehtonen et al. detailed the way in which powders are remarkably sensitive to microstructure-dependent Young’s moduli [127]. For example, a small addition of a BCC phase in a gas-atomized CrFeNiMn alloyed powder was shown to decrease the powders’ modulus from 170 GPa to 123 GPa in [127]. Overall, particulate moduli are sensitive to not only modulus mismatch between phases present, but also the lattice distortion and atomic spacing present. Therefore, the range of modulus values in Figure 37 for the Ti-based alloys is certainly within reason and maintains metal physics implications concerning critical impact velocity and cold spray feedstock deformability.
Figure 37 and Figure 38 plot the resistance to elastic deformation and the ability to dissipate energy during plastic deformation alongside one another for the same three clusters of powder. Once again, the alloy-informed clustering of the three powder particle types was apparent, although to a lesser. From Figure 38, we know that the alloyed-Ti powders have a greater resistance to elastic deformation, for the most part, than that of the steel and stainless-steel particulate counterparts. At the same time, the Ti-alloyed powders tend to be able to dissipate energy during plastic deformation slightly better than or just as well as the non-stainless-steel microparticles. In the context of the shock-wave mediated critical velocity framework introduced by MIT researchers, the resistance to elastic deformation associated with the Ti-based powders would suggest that said micro-particulate’s will be better able to dampen the propagating shock wave following impact, indicating that the critical velocity relations from Schuh’s MIT research group as a function of the speed of sound, or bulk modulus of the powder particle deserves series consideration.
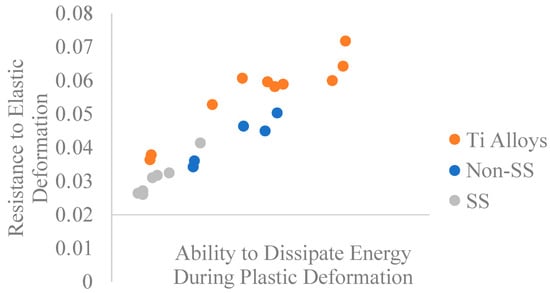
Figure 38.
Plots the resistance to elastic deformation and the ability to dissipate energy during plastic deformation alongside one another for the same three clusters of powder.
In so far as proper attention of the Hassani et al. framework is concerned, for a pure metal, the critical velocity was found to be given as:
where the variables are well defined in [120]. With respect to an alloyed microparticle, Hassani et al.’s mechanistic framework yields:
where the variables are well defined in [120,121]. Since is the bulk modulus and is the spall strength, it may once again be possible to look through the lens of nanoindentation to provide powder specific properties for use in the term for alloyed materials. Recall the fact that:
By way of substitution, it follows that:
Since the hardness and the indentation yield strength are both known to be proportional to one another as well as proportional with tensile strength too, the could be estimated as:
for ductile spall strength [128]. Thus:
such that
Interestingly, prior to the work by Hassani et al., Luo et al. [129] noted that Wu et al., in 2006 [130], postulated that the critical impact velocity should be inversely proportional to the modulus of elasticity such that:
which is consistent with
Since that point in time, Yildirim et al. also found that:
where in is the yield strength of the softer material (either the particle or substrate) and is a function of the modulus of elasticity associated with the substrate as well as the modulus of elasticity associated with the powder in [131]. With the aforementioned in mind, series consideration must continue to be given to the current state of our understanding surrounding critical impact velocity as a function of material properties in alloyed powder particle feedstocks. Nanoindentation appears to be a key tool for such a goal.
3.15. Direct Implications for Cold Spray
Comparative hardness analysis was used to quantitatively show the amount of plastic deformation that occurred during the cold spray process. Figure 39 shows grids of hardness indents on both a cross section of an Al 6061 powder particle and on the spray direction surface of an Al 6061 consolidated coating. The coating was slightly etched with a 0.5% hydrofluoric acid solution for 5 s to reveal powder particle boundaries. A particle boundary is highlighted in blue. The average hardness for all sizes of powder for Al 6061, Al 2024, Al 7075, and Al 5056 is shown by the solid bar in Figure 39, while the average hardness across a consolidated sample is shown by the dashed bar. In almost all alloys, there is a slight increase in hardness after the cold spray process. Al 5056 experiences the largest increase in hardness as it is a strain hardening alloy. Further hardness was done on single particle impacts to compare to the single particle impact model.
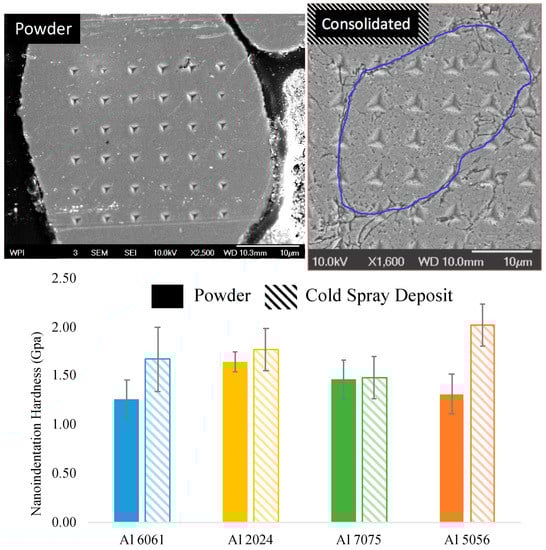
Figure 39.
(Left) SEM image of a grid of hardness indents on a single Al 6061 powder particle. (Right) SEM image of a grid of hardness indents on the spray direction face of a consolidated Al 6061 coating. The coating was etched with 0.5% hydrofluoric acid solution for 5 s to reveal particle boundaries. A blue line highlights one particle boundary. (Bottom) depicts a graph of the average hardness for Al 6061, Al 2024, Al 7075 and Al 5056. The average hardness for all sizes of powder is shown by the solid bar, while the dashed bar represents the consolidated sample.
From the perspective of cold spray-ability it was interesting to observe a greater increase in the hardness of Al 6061 and Al 5056 from the gas-atomized condition to the severely plastically deformed state in contrast with Al 2024 and Al 7075. Of the commercially available alloy aluminum compositions in the powder marketplace, Al 6061 and Al 5056 also appear to have greater ease of deposition relative to Al 2024 and Al 7075. For example, by way of turning to Story’s doctoral dissertation, the apparent inability of Al 7075 and Al 2024 to accommodate continued hardening due to the severe plastic deformation cold spray consolidation process shown in Figure 39 herein appears to correspond well with the only 80% deposition efficiency of Al 7075 and 60% deposition efficiency of Al 2024 reported upon in [132] when 100% of the carrier gas was comprised of He. On the other hand, Al 6061, which clearly maintained a greater capacity for work hardening as indicated by the jump in hardness due to cold spray as shown in Figure 39 reportedly maintained a deposition efficiency of 100% according to Ozdemir et al. in [133]. From such observations and implications, nanoindentation can be incorporated into the typical repertoire for cold spray characterization to evaluate prospective structure–processing–properties–performance relations associated with potential particulate feedstocks.
3.15.1. Mechanical Property Mapping
Cold spray consolidations have previously been shown to be anisotropic relative to the particle impact direction. Anisotropic behavior has been revealed in terms of both the resultant microstructure associated with a given orientation of the consolidated material relative to the spray direction as well as the mechanical properties and performance. Yang et al., among others, substantiated this standing observation by way of carefully analyzing cold sprayed copper deposits throughout a number of publications [23,134,135], while others have studied a subsequently wide range of metallic materials too [18,136].
In general, the cross-sectionally oriented cold spray consolidations are associated with a smaller grain size than that associated with the orthogonal orientation. With respect to the anisotropic tendency related to the mechanical properties of a consolidated cold sprayed material, properties such as the percent elongation to failure, yield strength, hardness, ductility, the modulus of elasticity, and fatigue behavior have been documented. Consequently, it is important that consideration be given to post-processing a deposited material to reduce the resultant anisotropy in accordance with required structural performance specifications. With respect to the grain size as a function of the cold spray consolidations orientation, Figure 40 highlights the resultant aspect ratios in the case of Al 6061 cold spray.
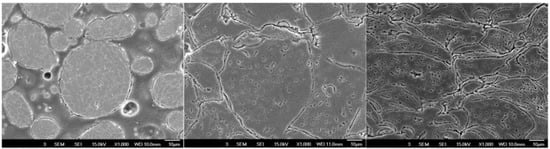
Figure 40.
SEM micrographs (Left) Al 6061 powder, (Middle) orthogonally orientated, relative to the spray direction, Al 6061 cold spray consolidation, and (Right) cross-sectionally oriented Al 6061 cold sprayed material. Each of the samples were etched with 0.5% HF solution for 90 s. Scale bars read 10 μm. The average aspect ratio of the particles and grains within the Al 6061 powder prior to deposition was 1.09 and 1.41, respectively. The cold sprayed Al 6061 coating oriented orthogonally to the spray direction-maintained aspect ratios of 1.44 and 1.40, respectively. Finally, the Al 6061 consolidation orientated cross-sectionally maintained aspect ratios of 2.22 and 2.77, respectively.
Concerning the evaluation and study of the degree of mechanical anisotropy associated with a given cold spray consolidation, mechanical mapping methods were applied over a given area of cold sprayed Al 6061. Figure 41 presents a hardness contour plot, indentation locations, and the polycrystalline microstructure relative to the indentation location when a Nano Indenter XP was applied to the cross-sectional orientation of the cold sprayed consolidation. Interestingly, the hardness contour plot coupled with the etched optical micrograph obtained post-nanoindentation testing also speaks to the local mechanical properties as a function of proximity to a given microstructural constituent. In this case, such constituents include sub-grains within a particle as well as high angled grains within a particle and the borders between neighboring particles that were consolidated with one another via solid-state supersonic high-strain rate deposition and impact.
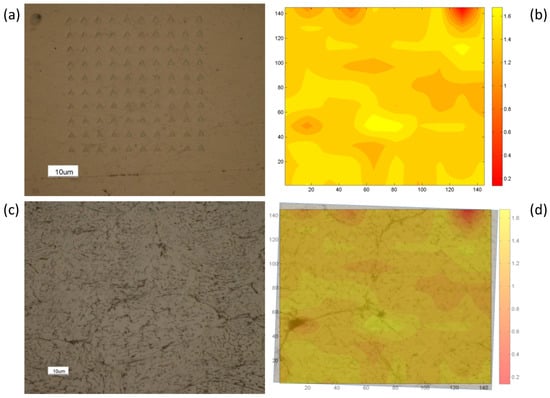
Figure 41.
(a) Captures the optical micrograph of the Al 6061 cold spray consolidation in the cross-sectional orientation relative to the deposition direction. (b) Captures the hardness contour plot using the indentation grid and location-specific 2D data from (a). (c) Depicts the same material region and indents presented in (a); however, the indented material was etched to reveal grain-related microstructural features in relation to their hardness’s depicted in (b). (d) Overlays the contour plot associated with (b) upon the etched micrograph in (c) for explicit microstructure-hardness comparison and inspection.
With respect to the present task of demonstrating the anisotropy associated with orientations of cold sprayed material consolidations relative to the spray direction, Figure 41 compliments Figure 42 by way of showcasing Figure 42’s orthogonal orientation counterpart. Analysis of such data confirms the anisotropic tendencies associated with a given orientation. More to the point, the orthogonal orientation relative to the cold spray direction of supersonic particle deposition was found to have a lower hardness than the cross-sectional orientation. In fact, from Figure 41, a correlation is identified between a lower local hardness at particle–particle boundary intersections, generated from more than two Al 6061 microparticles interfacing with one another following deposition.
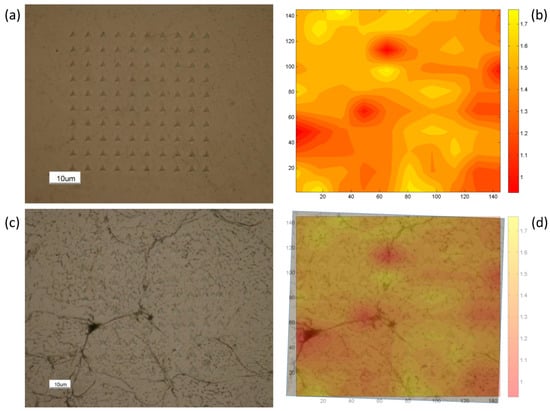
Figure 42.
(a) Captures the optical micrograph of the Al 6061 cold spray consolidation in the orthogonal orientation relative to the deposition direction. (b) Captures the hardness contour plot using the indentation grid and location-specific 2D data from (a). (c) Depicts the same material region and indents presented in (a); however, the indented material was etched to reveal grain-related microstructural features in relation to their hardness’s depicted in (b). (d) Overlays the contour plot associated with (b) upon the etched micrograph in (c) for explicit microstructure-hardness comparison and inspection.
Having showcased the immediate utility of employing mechanical property mapping methods via nanoindentation testing of the cold spray coatings’ orientation-dependent hardness’s in Figure 41 and Figure 42, let us briefly consider the extension of grid analysis to powder particles. Needless to say, the extension of nanoindentation mechanical mapping methods to individual particulates associated with a cold sprayable feedstock powder was not undertaken for the purpose of studying anisotropic tendencies, which was the case in Figure 41 and Figure 42. Rather, the usefulness surrounding the insights associated with findings such as those associated with Figure 43 follows from the location-property information obtained. Note that the powder studied in Figure 43 was the same gas-atomized Al 6061 feedstock used during the consolidated of the Al 6061 cold spray coatings depicted in Figure 41 and Figure 42. Notably, only a few other researchers have attempted to extend mechanical property mapping methods to feedstock particulates associated with cold spray. Such researchers include Birt et al. [137] and Goldbaum et al. [68,137].
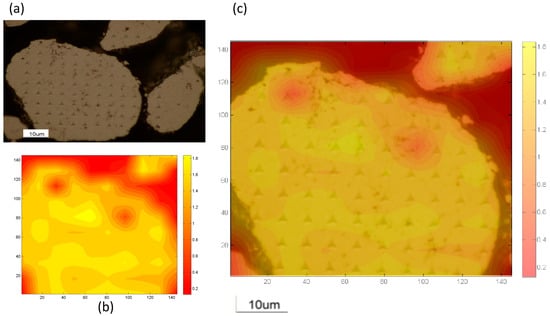
Figure 43.
(a) Optical micrograph of mounted Al 6061 gas-atomized feedstock embedded in an epoxy and characterized using nanoindentation mechanical mapping. (b) Resultant contour plot of hardness relative to the indentation grid and location-specific 2D data from (a). (c) Overlays the contour plot associated with (b) upon the micrograph in (a) for explicit microstructure-hardness comparison.
Returning to the concept of microstructural constituent dependent hardness, subsequent analysis of the measured hardness values relative to indentation locations at a particle–particle boundary/region or the internal microstructure of a deposited particulate, one may consider Figure 44. Figure 44 incorporates and presents the supervised classification of nano-indents as belonging to the boundary or interior category. At the same time, Figure 44 presents another supervised classification scheme within the nano-indent category of regions bordering particle–particle boundaries as well.
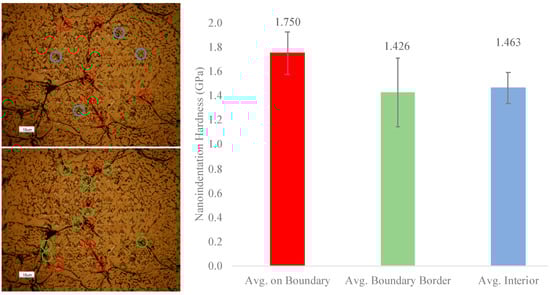
Figure 44.
Microstructurally informed nanoindentation specific hardness in cold sprayed Al 6061.
3.15.2. Cold Sprayed Consolidation Thermal Processing
Due to the degree of severe plastic deformation associated with the process of supersonic particle impact phenomena during cold spray materials consolidation, post-deposition thermal processing of the deposited material may be required. The need for thermal post-processing arises from the required performance specifications associated with a given application. For aerospace and defense applications, the high hardness of a given consolidation is partly able to be scarified in exchange for desirable ductility and toughness. In accordance with such scenarios, thermal post-processing of the consolidated material can be utilized to alleviate the build-up of compressive residual stress, dynamic recrystallization of the microstructure, increased bonding between deposited particulates and dislocation annihilation, among other toughness enhancing measures.
Having established a brief overview of some of the most relevant thermal post-processing associated with cold spray, let us consider Figure 45, which presents the associated with a post-processed Al 6061 cold sprayed material at various times and temperatures. Specifically, cold sprayed Al 6061 samples were thermally post-processed between 100 and 500 °C, at lengths of time ranging from 0 min to 16 min. For comparison, the same processing conditions and parameters were also applied to a wrought Al 6061 counterpart to contrast the hardness variation and significance of the uniqueness of a material in the cold sprayed condition and its respective response to heat treatment versus another sample of the same compositional designation in a conventionally bulk material condition.
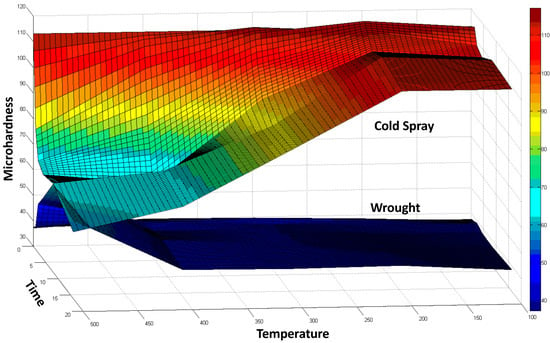
Figure 45.
Vickers hardness as a function of heat treatment processing time and temperature for Al 6061 cold spray and Al 6061 wrought materials.
Beyond the realm of thermally post-processing Al 6061 cold sprayed material consolidations, as had been shown in Figure 45, three-dimensional hardness contour plots for other particle/substrate combinations can be obtained too. While Figure 45 plotted microhardness relative to thermal processing times and temperatures, nanomechanical hardness/modulus contour plots relative to the x- and y-directional regions of the microstructure subjected to indentation grid analysis, which is also known as nanoindentation mechanical/nanomechanical mapping. This enables microstructure-specific mechanical property inspection to understand the mechanical behavior distribution throughout an actual material. For example, in Figure 46 (Left) demonstrates the local moduli of elasticity for a heat-treated copper-aluminum cold spray combination, wherein copper was the powder and alloyed Al was the substrate. Thus, Figure 46, Figure 47 and Figure 48 present microstructure-specific mechanical property maps via nanoindentation nanomechanical mapping.
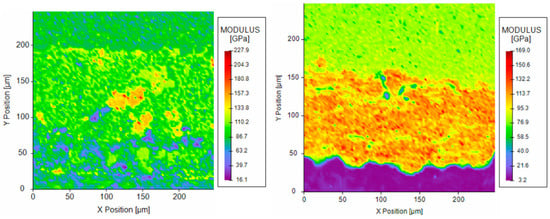
Figure 46.
(Left) Resultant contour plot of the elastic modulus relative to an indentation grid array performed upon a copper-aluminum cold spray coating and substrate combination following thermal post-processing. The degree of atomic diffusion between the Cu and Al that followed from bulk thermal processing conditions is clearly illustrated (Left) relative to the as-sprayed copper-aluminum modulus of elasticity contour plot (Right). A diffusion zone clearly formed and multiple intermetallic compounds developed at the particle/substrate interfacial region (Left). Note that the mounting material is also captured in (Right) as the purple region, whereas the red/orange/yellow region is the copper coating and the yellow/green region is the substrate. Similarly, between the (Left) “Y Position” value of 200 to 250 μm is just the substrate material.
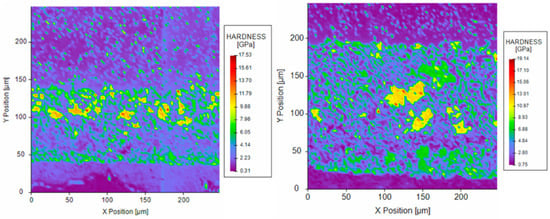
Figure 47.
(Left) Resultant contour plot of the hardness relative to an indentation grid array performed upon a copper-aluminum cold spray coating and substrate combination following thermal solutionization. The degree of atomic diffusion between the Cu and Al that followed from solution heat treating is clearly illustrated on the (Left) contour plot. A diffusion zone clearly formed and multiple intermetallic compounds developed at the particle/substrate interfacial region (Left). As for the (Right), the mechanically mapped contour plot of hardness relative to an indentation grid array performed upon a copper-Al 365 cold spray coating and substrate combination following a T6 heat treatment is presented.
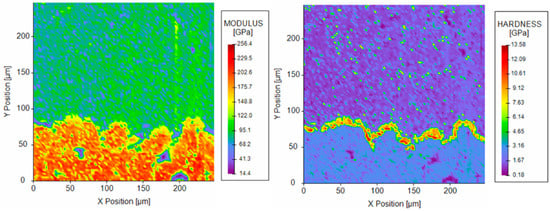
Figure 48.
(Left) resultant contour plot of the elastic modulus relative to an indentation grid array performed upon a nickel-aluminum cold spray coating and substrate combination following solutionization. Much less diffusion occurred in comparison with the Cu-Al combination; however, the particle/substrate interfacial region precipitated a rich layer of (Al,Ni) precipitates of extremely high hardness relative to pure nickel and the aluminum substrate (Right). As for the (Right), the mechanically mapped contour plot of hardness relative to an indentation grid array performed upon a Ni-Al 365 cold spray coating and substrate combination following a solution heat treatment is presented.
3.15.3. Relation to Single Particle Impacts
As previously mentioned, and depicted in part within Figure 49, the through-process model for cold spray materials consolidation was developed as a method of simulating and optimizing cold spray processing parameters for a given application. As part of the through-process model, the particle impact stage employ’s FEA computations via Johnson–Cook or Preston-Tonks-Wallace plasticity models. While many studies have been performed using bulk materials and their respective properties as a substitute for cold sprayable feedstock materials, the uniqueness of our through-process model centers upon the integration of powder properties data from the powder production and powders processing stages, which includes the use of the additive yield strength model previously mentioned herein, as inputs into the FEA simulations.
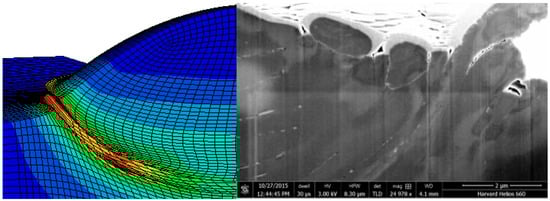
Figure 49.
(Left) Finite element analysis (FEA) plastic equivalent strain plot from single particle impact analysis. (Right) Electron-based micrograph of the upper right corner of a cross-sectioned Al 6061 single particle deposit showcasing jetting at the particle/substrate interface.
While the utility of the additive yield strength model serves as a means of validation and verification of nanoindentation powder particle measurements, the use of nanoindentation to validate the FEA input data from the powder processing stage of the trough-process model also contributes to verifying the veracity of FEA model input data. At the same time, nanoindentation may also be related to the single particle impact modeling stage by way of inspecting the integrity of the Johnson–Cook versus the Preston–Tonks–Wallace model, for example, in terms of replicating the particle impact phenomena in-silico, experimentally by nanomechanical assessment of single particle deposits made using similar particle size, chemistry, condition and cold spray processing parameters. The use of nanoindentation in this fashion is slightly analogous to the application of microscopy-based techniques to inspect FEA predicted concentrations of plastic equivalent strain, which can be linked to microstructural refinement, as highlighted in Figure 49.
The plastic equivalent strain output from the initial formulation of the single particle impact FEA model, established by the Applied Research Laboratory at Pennsylvania State University, and using the Johnson–Cook plasticity model as a framework, is shown on the left hand-side of Figure 49 when bulk Al 6061-O mechanical properties were assumed for both the particle and the substrate. Moreover, the FEA output presented in Figure 49 was based upon a particle with an of 10 μm and an impact velocity of 700 m/s wherein both the particle and substrate were assigned initial temperature of 150 °C. Consistent with prior work, the output from the initial model captures the fact that most of the plastic strain accumulated at the particle–substrate interface, while relatively limited particle deformation at the interior is observable. Such a plastic equivalent strain distribution is also consistent with the micrograph on the right hand-side of Figure 49, wherein the most pronounced microstructural refinement due to the high-strain rate particle impact phenomena is relegated to the particle–substrate interfacial region.
To obtain the micrograph on the right hand-side of Figure 49, a cold spray system was utilized with a sufficient raster velocity such that multiple single particle deposits could be achieved rather than a fully dense and continuous coating. This enabled the post-deposit identification of a single-particle deposit, sometimes referred to within the literature as a single splat, of approximately 40 μm in diameter. Once identified, the single particle deposit was cross sectioned by FIB milling at Harvard University’s Center for Nanoscale Systems. Thereafter, SEM was utilized to obtain the micrograph in Figure 49. With respect to scale, the top right edge of the cross-sectioned Al 6061 single particle deposit, and interfacial region, onto an Al 6061-O substrate is captured in the micrograph.
Returning to the point of view concerned with nanoindentation in relation to experimental/computational single particle impacts, the application of nanomechanical assessment techniques to single particle deposits may be utilized to quantitatively probe the degree of plastic deformation incurred by a given particle upon impact. Using additional single particle deposits produced by way of the same fast raster sample associated with Figure 49, subsequent single particle deposits of similar diameters were identified after being cross-sectionally mounted and polished using appropriate metallurgical and mechanical polishing methods. By way of preparing the additional deposits from the fast raster sample, nanoindentation, at depths of 250 and 500 nm, was applied from the upper particle apexes of the deposited particles, through the particle–substrate interfaces and into the substrate as shown in Figure 50.
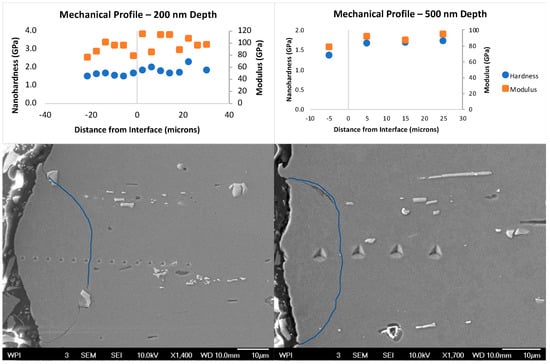
Figure 50.
(Upper Left) hardness and modulus values for the indentation profile captured in the SEM micrograph (Bottom Left). Negative values are within the particle, the (0,y) point is the particle/substrate interface, and positive position values are within the substrate material. The (Upper Right) graph and (Bottom Right) micrograph follows the same reasoning associated with the (Upper Left) and (Lower Left); however, the indentation depths were 500 nm instead of 200 nm.
To clearly identify the particle–substrate interfaces in the two micrographs associated with Figure 50, blue lines were added to the SEM images along parts of the interfacial regions. Additionally, the negative distances from the interfaces indicated along the x-axis of the two graphs in Figure 50 correspond to moduli of elasticity and hardness values at points within the interior of the single particle deposits. While values plotted at negative distances from the interface in Figure 50, the zero point along the x-axis denotes the particle–substrate interface whereas positive values along the x-axis captured the mechanical properties measured within the substrate material.
Interestingly, unlike the particle–particle interfaces measured and presented in Figure 43, the particle–substrate interfacial regions did not demonstrate the same degree of increased hardness within the region as illustrated graphically in Figure 50. That being said, the varied moduli of elasticity at the interfacial region is consistent with Figure 46 (Right), wherein both particle–substrate and particle–particle interfacial regions were found to have lower resistance to elastic deformation than the interior regions within deposited particulates. In so far as the region into the substrate material is concerned, the increase in hardness and modulus at the locations closest to the interface is consistent with the degree of strain hardening experienced upon impact. Said degree of strain hardening experienced upon impact was depicted in terms of the plastic equivalent strain output.
Even though fast raster particle deposition using a cold spray system is generally more accessible to the cold spray research community, since one simply needs access to a cold spray system, more refined quantitative assessment of the FEA implementation and model output can be achieved by way of using a LIPIT system mentioned earlier. Hence, the LIPIT system maintained by Dr. Lee’s research group at the University of Massachusetts, Amherst, was used to generate idealized Al 6061 single particle depositions for subsequent characterization and comparison. Explicitly, quantitative comparison of the FEA outputs with the nanoindentation hardness’s was pursued by way of matching nanomechanical properties taken from a cross-sectionally prepared single-particle deposit with the plastic equivalent strains at the same locations relative to the particle–substrate interfaces in the FEA simulations.
Using the LIPIT system, an Al 6061 particle of 18.9 μm and a particle velocity of 927 m/s, single particle deposits were obtained for experimental analysis. Computationally, Al 6061 mechanical properties, a diameter of 18.9 μm and a particle velocity of 927 m/s was input into the FEA infrastructure for comparison too. Nevertheless, after the LIPIT single particle deposit was obtained, a cross-section of the deposit was prepared by plasma-based FIB milling and polishing at the University of Connecticut. Before FIB sample preparation for nanoindentation was carried out, SEM was employed to capture the deposited particle parallel to the direction of impact. This SEM micrograph was embedded within Figure 51 while the majority of Figure 51 presents the cross-sectionally prepared deposit. From both vantage points, material jetting was observed.
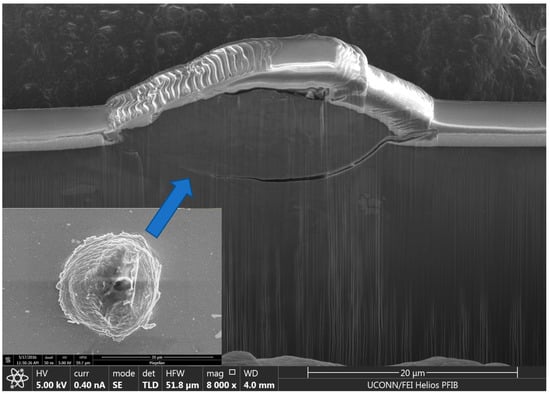
Figure 51.
The embedded SEM micrograph is from the vantage point of the cold spray nozzle exit with respect to the gas-atomized Al 6061 single particle deposit. Otherwise, the figure at large presents the micrograph of the cross-sectioned Al 6061 single particle deposit prepared by way of plasma FIB. Note that the Pt on top of the particle deposit and substrate was applied to defend the sample surface during milling process.
Once the LIPIT-deposited sample’s cross-section was obtained, prospective nanoindentation array of 1 column and 5 rows were conceptualized, as shown in Figure 52. Though three prospective lines were identified, two 1-by-5 arrays were carried out (specifically, lines 1 and 2 in Figure 52). Furthermore, testing was performed starting at the top of the deposited particle, proceeding through the particle–substrate interfacial region and ultimately continuing into the substrate material. The way in which the FIB-prepared sample was removed from the rest of the unaffected substrate material after LIPIT impact can be appreciated through the consideration of Figure 52 as well.
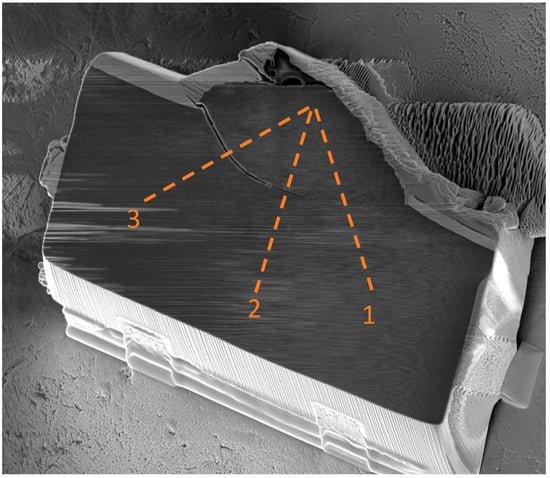
Figure 52.
Once the laser induced projective impact testing (LIPIT)-deposited sample’s cross-section was obtained, prospective nanoindentation array of 1 column and 5 rows were conceptualized, as shown herein.
The residual nanoindentation impressions, identified in terms of the numerated array’s presented in Figure 52, are shown on the left hand-side of Figure 53 as an SEM micrograph. On the right hand-side of Figure 53, the nanoindentation hardness’s along lines 1 and 2 are plotted as a function of their position in a manner similar to that of the graphs associated with Figure 50. The trend in measured hardness presented in Figure 53 was consistent with the observations discussed and depicted in Figure 50. More to the point, the hardness was found to slightly increase in the region of the substrate material immediately after transitioning to the substrate from the particle–substrate interface. Once again, consistency with the degree of strain hardening experienced upon impact and depicted in terms of the plastic equivalent strain output given on the left hand-side of Figure 49 was found, even though the data associated with Figure 49 was derived from fast raster cold sprayed samples and the data associated with Figure 53 was obtained from a LIPIT prepared deposit.
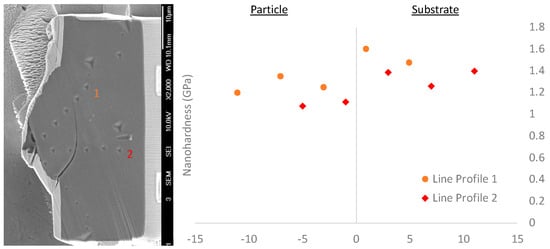
Figure 53.
(Left) SEM micrograph of cross-sectioned Al 6061 single particle deposit depicting the locations targeted during nanoindentation. The residual indentation marks found from (Left) correspond with the plotted data (Right).
Given the consistency associated with the LIPIT and fast raster deposition, in terms of strain hardening related trends are concerned, the single particle impact modeling stage of the through-process model was varied from the Johnson–Cook plasticity model to the Preston-Tonks-Wallace plasticity model. For the purpose of capturing the location-specific hardness’s measured using nanoindentation testing, presented in Figure 53, with the plastic equivalent strain output’s computed using the Plasticity-Tonks-Wallace plasticity model, single particle impacts were simulated at the Applied Research Laboratory of the Pennsylvania State University. In doing so, the FEA simulation was performed using the measured 18.9 μm diameter and a velocity of 927 m/s. Upon successful simulation, the SEM micrograph given in Figure 53 was overlaid with the single particle impact model ascertained in Figure 54.
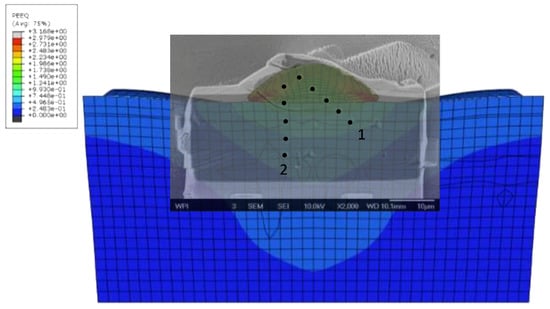
Figure 54.
SEM micrograph of nanoindentation residual indentation marks superimposed upon the equivalent plastic strain (PEEQ) output from the FEA single particle impact computation.
As shown in Figure 55, the plastic equivalent strains were plotted alongside the corresponding nanoindentation hardness’s for the two nanoindentation arrays. Originally, we had hypothesized that both of the nanoindentation arrays would share comparable slopes with one another when the plastic equivalent strains were plotted against nanoindentation hardness’s and subjected to linear regression analysis. However, as clearly shown in Figure 55, a consistent relationship between the computed plastic equivalent strains and measured hardness’s at the same locations, for the two-line profiles given, was not immediately observed. Future work will need to be undertaken to optimize the use of nanoindentation protocols for this task as well as better sample preparation since FIB-induced striations are clearly present. This was unlike other cold sprayed samples subjected to nanoindentation throughout the course of this work, which achieved surfaces with mirror finishes via mechanical polishing methods.
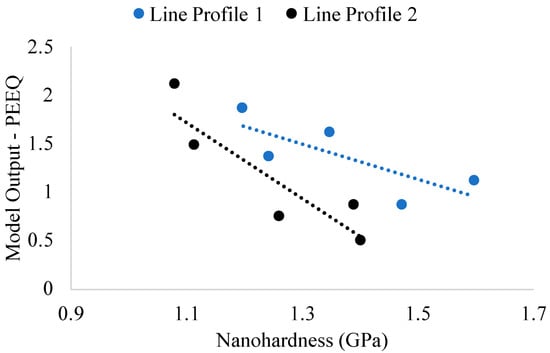
Figure 55.
The PEEQ FEA output for the two profiles identified in relevant figures was plotted herein in relation to the nanoindentation hardness recorded. A linear fit was applied to the profiles.
Similarly, the use and implementation of the Preston–Tonks–Wallace plasticity model instead of the Johnson–Cook model provides another prospective source of deviation from the hypothesized trend. On the other hand, the use of pre-defined bulk Al 6061 mechanical properties during single particle impact simulations instead of particle-specific properties likely contributed to the variations as well. As shown by Assadi et al., and as we have discussed throughout this manuscript, a truly representative impact model will need to use particle specific inputs. Due to the fact that the computations were not performed in such a way, the output plastic equivalent strains may not be comparable until future impact computations are performed with more accurate input data.
Beyond the realm of particle-specific mechanical material properties as FEA inputs, variation between lines 1 and 2 may also have arisen from the fact that the shape of the impact induced deformation zones throughout the particle–substrate deposits are dissimilar from one another. This is depicted in the underlaid FEA output in Figure 54. Therefore, additional measurements in the future ought to be pursued, focusing upon multiple dingle particle impact deposits as well as focusing upon nanoindentation array directions equivalent to line 2, for example.
From the analysis presented within this subsection of the article, the value associated with the integration of nanomechanical assessment as an experimental tool for optimizing and inspecting the integration of the various stages of the through-process model of cold spray has been demonstrated. Accordingly, the powder production stage, powder pre-processing stage, and particle impact stage of the through-process model will achieve validation and optimization through continued consideration and investigation. To visualize the synchronization and implementation of nanoindentation as a benchmark characterization system for cold spray through-process modeling efforts, a simplified and annotated flowchart is subsequently given in Figure 56.
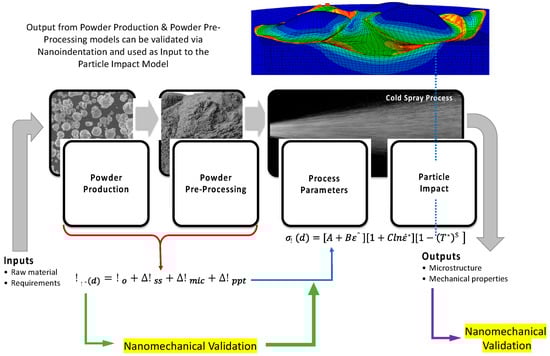
Figure 56.
Simple schematic illustrating through-process modeling of cold spray and areas wherein nanomechanical assessment and model validation can play a role.
4. Concluding Remarks
- Evaluation and consideration of particle-dominated nanoindentation depth models found the Yan et al. model to be well suited as a guiding principle for nanoindentation testing depth limits associated with a particle embedded within a mounting material. However, refinements must be made. Future experimental/computational coupled research will be pursued with collaborators to develop a more refined upper bound of the depth limit such that mounting material effects are more confidently avoided. Alternatives to the Yan et al. model were found to regularly overestimate the upper bound of the particle-dominated indentation depth regimes, especially when the modulus of elasticity needs to be measured.
- Particle immersion into the mounting material was almost universally observed when microindentation loading was applied. Nanoindentation was able to overcome such a testing limitation.
- Microindentation cannot be applied when attempting to measure the hardness of a powder particle for cold spray feedstock evaluation and inspection.
- Prior research has attempted to extend the thin film nanoindentation approach to extracting substrate-independent mechanical properties of hemispherical cross-sectioned particles mounted within a surrounding matrix. However, the geometrical variation behind a planar thin film on a planer compliant substrate is not similar enough to an embedded hemispherical particle surrounded by a compliant mounting material, which is otherwise analogously similar to a complaint substrate.
- Nanomechanical assessment of the effects of thermally processing a bulk counterpart compared with a compositionally equivalent gas-atomized alloyed Al powder corroborated the fact that the kinetics and thermodynamics associated with heat treating rapidly solidified powders are fundamentally different and uniquely distinct from the bulk material condition.
- Static nanoindentation was found to be unable to tease out the aging curves for thermally processed Al cold spray feedstock microparticles. When dynamic/CSM-based nanoindentation was applied to evaluate the aging curve for Al 6061 powder, for example, the change in hardness as a function of processing time was able to be realized. The dynamic nanoindentation hardness was found to be in agreement with the hardness obtained through computational analysis of the hardness as a function of heat treatment hold times.
- The agreement between the computational additive yield strength model and dynamic nanoindentation hardness served to validate the additive yield strength model developed as well as demonstrate the fact that dynamic nanoindentation should be applied to measure the hardness of cold sprayable feedstock instead of the conventionally static nanoindentation approach.
- Implications of indentation size effects were considered herein. Future work will apply the strain-gradient plasticity model to ensure that the hardness obtained is at the limit of infinite indentation depth. In doing so, one must balance the constraints on nanoindentation depth limits imposed by the particle-dominated depth model mentioned and the range of data required for proper analysis.
- Dynamic nanoindentation of microparticulate feedstock has been shown during the course of this work to be an invaluable tool for inspecting the effect of additional thermal pre-processing, such as degassing and austenitization of a 3xx stainless-steel gas-atomized powder, for example. In fact, the use of hardness as an indicator of proper degassing hold times at an evaluated temperature was shown to be an effective tool for Al 5056 so one could minimize the effects of unintended secondary phase ripening and formation.
- Relationships between oxygen content, critical impact velocity, particle yield strength, particle hardness, and particle ultimate tensile strength were established. We also established particle hardness as a function of cooling rate effects during rapid solidification, which dictate particle and grain size.
- A protocol for determining the dynamic mechanical properties via single particle compression testing was established. This enables non-local compressive stress–strain/mechanical flow curves to be determined for a given particle. On the other hand, dynamic spherical nanoindentation was applied to mounted particles, enabling the flow curve to be determined in another fashion as well.
- Crystallographic orientation dependencies of hardness and the modulus of elasticity for individual grains within a gas-atomized polycrystalline cold sprayable feedstock were presented. Implications for cold spray were then considered. Future work will consider the role of dislocation motion against grain orientation hardness upon the affinity to recrystallize during impact. Supplementary work must be pursued in an attempt to discover potential orientation partiality as a result of high strain rate supersonic particle deposition and deformation experienced during cold spray processing.
- A new framework for evaluating the suitability of a prospective powder for cold spray was presented and related to the critical impact velocity mechanistic framework put forth by MIT researchers surrounding shockwave induced particle/substrate bonding. This was achieved through nanoindentation-based assessment.
- Direct implications of all of the presented results and discussions were then entertained and considered for cold spray materials consolidation.
- Mechanical property mapping was applied to a number of consolidated cold spray samples. The mechanical mapping methods using nanoindentation demonstrated consistency with respect to the anisotropy found in cold sprayed materials. Mechanical mapping was also able to demonstrate the effects of thermal post-processing dissimilar particle–substrate combinations. This resolution of the contour plots from the KLA Instruments/Nanomechanics, Inc., protocol is remarkable in and of itself.
- The relationship between the mechanical properties associated with single particle impacts and FEA PEEQ outputs was also pursued. The results were found to corroborate the through-process model developed for cold spray.
Author Contributions
Conceptualization, B.C.S. and D.L.C.; methodology, B.C.S., M.A.G., B.H. and D.L.C.; software, B.C.S.; validation, B.C.S.; formal analysis, B.C.S.; investigation, B.C.S., M.A.G., B.H. and D.L.C.; data curation, B.C.S.; writing—original draft preparation, B.C.S.; writing—review and editing, B.C.S., M.A.G., B.H., V.K.C.J., A.T.N. and D.L.C.; visualization, B.C.S., M.A.G., B.H. and D.L.C.; supervision, V.K.C.J. and A.T.N.; project administration, D.L.C.; funding acquisition, D.L.C. All authors have read and agreed to the published version of the manuscript.
Funding
This research was funded by U.S. Army Research Laboratory (ARL), grant number W911NF-10-2-0098. Additional funding from ARL was also provided through grant number W911NF-15-2-0024 as well as grant number W911NF-19-2-0108.
Acknowledgments
Thank you to past co-authors who elected to publish our earlier work in open access journals, which has enabled us to recall and modify earlier figures for use in this paper.
Conflicts of Interest
The authors declare no conflict of interest.
References
- Villafuerte, J. Modern Cold Spray: Materials, Process, and Applications; Springer International Publishing: New York City, NY, USA, 2015; ISBN 9783319167725. [Google Scholar]
- Bryer, C.S.; Caitlin, E.W.; Victor, K.; Champagne, J.; Danielle, L.C. Initial Observation of Grain Orientation Dependent Nanoindentation Hardness of Al 6061 Gas-atomized Powder. Int. J. Metall. Met. Phys. 2020. [Google Scholar] [CrossRef]
- Yin, S.; Cavaliere, P.; Aldwell, B.; Jenkins, R.; Liao, H.; Li, W.; Lupoi, R. Cold spray additive manufacturing and repair: Fundamentals and applications. Addit. Manuf. 2018, 21, 628–650. [Google Scholar] [CrossRef]
- Sova, A.; Grigoriev, S.; Okunkova, A.; Smurov, I. Potential of cold gas dynamic spray as additive manufacturing technology. Int. J. Adv. Manuf. Technol. 2013. [Google Scholar] [CrossRef]
- Champagne, V.K. The Cold Spray Materials Deposition Process: Fundamentals and Applications; Woodhead Publishing Limited: Boca Raton, FL, USA, 2007; ISBN 9781845691813. [Google Scholar]
- Champagne, V.K. Investigation of the Effect of Oxides on the Critical Impact Velocity during the Cold Spray Process of High Purity Aluminum Powder. Ph.D. Thesis, Worcester Polytechnic Institute, Worcester, MA, USA, 2018. [Google Scholar]
- Belsito, D. Application of Computational Thermodynamic and Solidification Kinetics to Cold Sprayable Powder Alloy Design. Ph.D. Thesis, Worcester Polytechnic Institute, Worcester, MA, USA, 2014. [Google Scholar]
- Walde, C.; Cote, D.; Champagne, V.; Sisson, R. Characterizing the Effect of Thermal Processing on Feedstock Al Alloy Powder for Additive Manufacturing Applications. J. Mater. Eng. Perform. 2019. [Google Scholar] [CrossRef]
- Randaccio, L.E. Pre-Heat Treatment of Gas Atomized Al 2024 Powder and its Effects on the Properties of Cold Spray Coatings. Master’s Thesis, Northeastern University, Boston, MA, USA, 2019. [Google Scholar]
- Walde, C.; Tsaknopoulos, K.; Champagne, V.; Cote, D. The Microstructural Evolution of Rapidly Solidified Powder Aluminum 2024 During Thermal Processing. Metallogr. Microstruct. Anal. 2019. [Google Scholar] [CrossRef]
- Tsaknopoulos, K.; Walde, C.; Champagne, V.; Cote, D. Gas-Atomized Al 6061 Powder: Phase Identification and Evolution During Thermal Treatment. JOM 2019. [Google Scholar] [CrossRef]
- Story, W.A.; Brewer, L.N. Heat Treatment of Gas-Atomized Powders for Cold Spray Deposition. Metall. Mater. Trans. A Phys. Metall. Mater. Sci. 2018. [Google Scholar] [CrossRef]
- Sabard, A.; de Villiers Lovelock, H.L.; Hussain, T. Microstructural Evolution in Solution Heat Treatment of Gas-Atomized Al Alloy (7075) Powder for Cold Spray. J. Therm. Spray Technol. 2018. [Google Scholar] [CrossRef]
- Walde, C. Thermal Processing of Powder Aluminum Alloys for Additive Manufacturing Applications. Ph.D. Thesis, Worcester Polytechnic Institute, Worcester, MA, USA, 2018. [Google Scholar]
- Tsaknopoulos, K. Computational Thermodynamic and Kinetic Modeling and Characterization of Phase Transformations in Rapidly Solidified Aluminum Alloy Powders. Ph.D. Thesis, Worcester Polytechnic Institute, Worcester, MA, USA, 2019. [Google Scholar]
- Ozdemir, I.; Ahrens, S.; Mücklich, S.; Wielage, B. Nanocrystalline Al-Al2O3p and SiCp composites produced by high-energy ball milling. J. Mater. Process. Technol. 2008. [Google Scholar] [CrossRef]
- Woo, D.J.; Sneed, B.; Peerally, F.; Heer, F.C.; Brewer, L.N.; Hooper, J.P.; Osswald, S. Synthesis of nanodiamond-reinforced aluminum metal composite powders and coatings using high-energy ball milling and cold spray. Carbon N. Y. 2013. [Google Scholar] [CrossRef]
- Massar, C.; Tsaknopoulos, K.; Sousa, B.C.; Grubbs, J.; Cote, D.L. Heat Treatment of Recycled Battlefield Stainless-Steel Scrap for Cold Spray Applications. JOM 2020. [Google Scholar] [CrossRef]
- Tsukerman, S.A. Powder Metallurgy, 1st ed.; Elsevier: Oxford, UK, 1965; ISBN 9780080106762. [Google Scholar]
- Samal, P.; Newkirk, J. (Eds.) Powder Metallurgy; ASM International: Cleveland, OH, USA, 2015; ISBN 978-1-62708-175-7. [Google Scholar]
- Antony, L.V.M.; Reddy, R.G. Processes for production of high-purity metal powders. JOM 2003. [Google Scholar] [CrossRef]
- Sundberg, K.; Wang, Y.; Mishra, B.; Carl, A.D.; Grimm, R.L.; Te, A.; Lozeau, L.; Sousa, B.C.; Sisson, R.D.; Cote, D.L. The Effect of Corrosion on Conventional and Nanomaterial Copper Cold Spray Surfaces for Antimicrobial Applications. Biomed. J. Sci. Tech. Res. 2019, 22. [Google Scholar] [CrossRef]
- Sousa, B.C.; Sundberg, K.L.; Gleason, M.A.; Cote, D.L. Understanding the Antipathogenic Performance of Nanostructured and Conventional Copper Cold Spray Material Consolidations and Coated Surfaces. Crystals 2020, 10, 504. [Google Scholar] [CrossRef]
- Sousa, B.; Sundberg, K.; Massar, C.; Champagne, V.; Cote, D. Spherical nanomechanical characterization of novel nanocrystalline cu cold spray manufactured materials. In Proceedings of the APS March Meeting 2019, Boston, MA, USA, 4–8 March 2019. [Google Scholar]
- Barua, R. Study of the Structural Properties and Control of Degradation Rate for Biodegradable Metallic Stents using Cold Spray. Ph.D. Thesis, McGill University, Montréal, QC, Canada, 2015. [Google Scholar]
- Al-Mangour, B. The use of Cold Sprayed Alloys for Metallic Stents. Ph.D. Thesis, McGill University, Montréal, QC, Canada, 2012. [Google Scholar]
- Frattolin, J. A Biomechanical Evaluation of an Iron and Stainless Steel 316L Biodegradable Coronary Stent. Ph.D. Thesis, McGill University, Montréal, QC, Canada, 2019. [Google Scholar]
- Al-Mangour, B.; Vo, P.; Mongrain, R.; Irissou, E.; Yue, S. Effect of heat treatment on the microstructure and mechanical properties of stainless steel 316L coatings produced by cold spray for biomedical applications. J. Therm. Spray Technol. 2014. [Google Scholar] [CrossRef]
- Sevillano, F.; Poza, P.; Múnez, C.J.; Vezzù, S.; Rech, S.; Trentin, A. Cold-sprayed Ni-Al2O3 coatings for applications in power generation industry. J. Therm. Spray Technol. 2013. [Google Scholar] [CrossRef]
- Trexler, M.D.; Carter, R.; De Rosset, W.S.; Gray, D.; Helfritch, D.J.; Champagne, V.K. Cold spray fabrication of refractory materials for gun barrel liner applications. Mater. Manuf. Process. 2012, 27, 820–824. [Google Scholar] [CrossRef]
- Shives, T.; Smith, L. Microindentation Hardness Measurements on Metal Powder Particles. In Microindentation Techniques in Materials Science and Engineering; ASTM International: West Conshohocken, PA, USA, 2008; p. 243. [Google Scholar]
- Yan, W.; Pun, C.L.; Wu, Z.; Simon, G.P. Some issues on nanoindentation method to measure the elastic modulus of particles in composites. Compos. Part B Eng. 2011. [Google Scholar] [CrossRef]
- Cao, Y.; Duan, P.; Chen, J. Modelling the nanomechanical response of a micro particle-matrix system for nanoindentation tests. Nanotechnology 2016. [Google Scholar] [CrossRef]
- Kashani, M.S.; Gilvan, A.A.; Madhavan, V. Volumes sampled for hardness and for modulus of elasticity during nanoindentation testing. J. Mater. Res. 2012. [Google Scholar] [CrossRef]
- Constantinides, G.; Ravi Chandran, K.S.; Ulm, F.J.; Van Vliet, K.J. Grid indentation analysis of composite microstructure and mechanics: Principles and validation. Mater. Sci. Eng. A 2006. [Google Scholar] [CrossRef]
- Mercier, D.; Vanhumbeeck, J.F.; Caruso, M.; Eynde, X.V.; Febvre, M. Microstructural and mechanical characterisation of electroplated nickel matrix composite coatings. Surf. Eng. 2019. [Google Scholar] [CrossRef]
- Chen, Y.C.; Tsao, C.Y.A.; Yang, S.C.; Hsu, C.C. 6061 aluminum powder making and its thermal and mechanical properties. Appl. Mech. Mater. 2012, 152–154, 1215–1220. [Google Scholar] [CrossRef]
- McNally, B. Through-Process Modeling of Aluminum Alloys for Cold Spray: Experimental Characterization and Verification of Models. Ph.D. Thesis, Worcester Polytechnic Institute, Worcester, MA, USA, 2016. [Google Scholar]
- Rokni, M.R.; Widener, C.A.; Ozdemir, O.C.; Crawford, G.A. Microstructure and mechanical properties of cold sprayed 6061 Al in As-sprayed and heat treated condition. Surf. Coat. Technol. 2017. [Google Scholar] [CrossRef]
- Nanoindentation Summer Camp Class Notebook; Texas A&M University & Nanomechanics, Inc.: Oak Ride, TN, USA, 2018.
- Oliver, W.C.; Pharr, G.M. Measurement of hardness and elastic modulus by instrumented indentation: Advances in understanding and refinements to methodology. J. Mater. Res. 2004. [Google Scholar] [CrossRef]
- Hryha, E.; Zubko, P.; Dudrová, E.; Pešek, L.; Bengtsson, S. An application of universal hardness test to metal powder particles. J. Mater. Process. Technol. 2009. [Google Scholar] [CrossRef]
- Low, T.F.; Pun, C.L.; Yan, W. Theoretical study on nanoindentation hardness measurement of a particle embedded in a matrix. Philos. Mag. 2015. [Google Scholar] [CrossRef]
- Schiel, J.F. The cold gas-dynamic spray and characterization of microcrystalline austenitic stainless steel. Master’s Thesis, Naval Postgraduate School, Monterey, CA, USA, 2014. [Google Scholar]
- Pathak, S.; Stojakovic, D.; Doherty, R.; Kalidindi, S.R. Importance of surface preparation on the nano-indentation stress-strain curves measured in metals. J. Mater. Res. 2009. [Google Scholar] [CrossRef]
- Eason, P.D.; Fewkes, J.A.; Kennett, S.C.; Eden, T.J.; Tello, K.; Kaufman, M.J.; Tiryakioĝlu, M. On the characterization of bulk copper produced by cold gas dynamic spray processing in as fabricated and annealed conditions. Mater. Sci. Eng. A 2011. [Google Scholar] [CrossRef]
- Hay, J. Introduction to instrumented indentation testing. Exp. Tech. 2009. [Google Scholar] [CrossRef]
- Moseson, A.J.; Basu, S.; Barsoum, M.W. Determination of the effective zero point of contact for spherical nanoindentation. J. Mater. Res. 2008. [Google Scholar] [CrossRef]
- Pathak, S.; Kalidindi, S.R. Spherical nanoindentation stress–strain curves. Mater. Sci. Eng. R Reports 2015, 91, 1–36. [Google Scholar] [CrossRef]
- Marteau, J.; Mazeran, P.E.; Bouvier, S.; Bigerelle, M. Zero-point correction method for nanoindentation tests to accurately quantify hardness and indentation size effect. Strain 2012. [Google Scholar] [CrossRef]
- Leisen, D.; Kerkamm, I.; Bohn, E.; Kamlah, M. A novel and simple approach for characterizing the Young’s modulus of single particles in a soft matrix by nanoindentation. J. Mater. Res. 2012. [Google Scholar] [CrossRef]
- Yovanovich, M.M. Micro and macro hardness measurements, correlations, and contact models. In Proceedings of the Collection of Technical Papers—44th AIAA Aerospace Sciences Meeting, Reno, NV, USA, 9–12 January 2006. [Google Scholar]
- Song, X. Microstructure and Mechanical Properties of Electrodeposited Copper Films. Ph.D. Thesis, University of Birmingham, Birmingham, UK, 2011. [Google Scholar]
- Salahinejad, E.; Amini, R.; Bajestani, E.A.; Hadianfard, M.J. Microstructural and hardness evolution of mechanically alloyed Fe-Cr-Mn-N powders. J. Alloys Compd. 2010. [Google Scholar] [CrossRef]
- Azevedo, J.M.C.; Serrenho, A.C.; Allwood, J.M. The deformation of metal powder particles: Hardness and microstructure. In Proceedings of the Procedia Engineering, Conference on the Technology of Plasticity, ICTP, Cambridge, UK, 17–22 September 2017. [Google Scholar]
- Sabard, A.; Hussain, T. Inter-particle bonding in cold spray deposition of a gas-atomised and a solution heat-treated Al 6061 powder. J. Mater. Sci. 2019. [Google Scholar] [CrossRef]
- Evans, W. Characterization of Al6061 Splats Cold Spray-Deposited on Al6061-T6 Substrate. Master’s Thesis, Northeastern University, Boston, MA, USA, 2018. [Google Scholar]
- Clifford, C.A.; Seah, M.P. Modelling of surface nanoparticle inclusions for nanomechanical measurements by an AFM or nanoindenter: Spatial issues. Nanotechnology 2012. [Google Scholar] [CrossRef]
- Nemecek, J. Nanoindentation Based Analysis of Heterogeneous Structural Materials. In Nanoindentation in Materials Science; IntechOpen: London, UK, 2012. [Google Scholar]
- Dutta, A. Mechanical Properties of Granular Materials Using Nanoindentation and Modeling with Distinct Element Method. Ph.D. Thesis, University of Tennesse, Knoxville, TN, USA, 2006. [Google Scholar]
- Tan, C.F.; Said, M.R. Effect of hardness test on precipitation hardening aluminium alloy 6061-t6. Chiang Mai J. Sci. 2009. [Google Scholar]
- El-Menshawy, K.; El-Sayed, A.W.A.; El-Bedawy, M.E.; Ahmed, H.A.; El-Raghy, S.M. Effect of aging time at low aging temperatures on the corrosion of aluminum alloy 6061. Corros. Sci. 2012. [Google Scholar] [CrossRef]
- Mane, P.J.; Kumar, K.L.V. Study on ageing behaviour of silicon nitride reinforced Al6061 composites. In Proceedings of the Procedia Engineering, Vellore, India, 8–10 December 2014. [Google Scholar]
- Davis, J.R. ASM Specialty Handbook: Aluminum and Aluminum Alloys. ASM Int. 1993. [Google Scholar] [CrossRef]
- Leitner, A.; Maier-Kiener, V.; Kiener, D. Dynamic nanoindentation testing: Is there an influence on a material’s hardness? Mater. Res. Lett. 2017. [Google Scholar] [CrossRef] [PubMed]
- Haghshenas, M.; Wang, L.; Klassen, R.J. Depth dependence and strain rate sensitivity of indentation stress of 6061 aluminium alloy. Mater. Sci. Technol. 2012, 28, 1135–1140. [Google Scholar] [CrossRef]
- Pöhl, F.; Huth, S.; Theisen, W. Detection of the indentation-size-effect (ISE) and surface hardening by analysis of the loading curvature C. Int. J. Solids Struct. 2016. [Google Scholar] [CrossRef]
- Goldbaum, D. Micromechanical Testing of Cold Sprayed Ti Splats and Coatings. Ph.D. Thesis, McGill University, Montréal, QC, Canada, 2012. [Google Scholar]
- Milman, Y.V.; Golubenko, A.A.; Dub, S.N. Indentation size effect in nanohardness. Acta Mater. 2011. [Google Scholar] [CrossRef]
- Kim, Y.C.; Gwak, E.J.; Ahn, S.M.; Jang, J.I.; Han, H.N.; Kim, J.Y. Indentation size effect in nanoporous gold. Acta Mater. 2017. [Google Scholar] [CrossRef]
- Beake, B.D.; Harris, A.J.; Moghal, J.; Armstrong, D.E.J. Temperature dependence of strain rate sensitivity, indentation size effects and pile-up in polycrystalline tungsten from 25 to 950 °C. Mater. Des. 2018. [Google Scholar] [CrossRef]
- Prasitthipayong, A.; Vachhani, S.J.; Tumey, S.J.; Minor, A.M.; Hosemann, P. Indentation size effect in unirradiated and ion-irradiated 800H steel at high temperatures. Acta Mater. 2018. [Google Scholar] [CrossRef]
- Pharr, G.M.; Herbert, E.G.; Gao, Y. The Indentation Size Effect: A Critical Examination of Experimental Observations and Mechanistic Interpretations. Annu. Rev. Mater. Res. 2010. [Google Scholar] [CrossRef]
- Nix, W.D.; Gao, H. Indentation size effects in crystalline materials: A law for strain gradient plasticity. J. Mech. Phys. Solids 1998. [Google Scholar] [CrossRef]
- Thangaraju, S.; Heilmaier, M.; Murty, B.S.; Vadlamani, S.S. On the estimation of true Hall-Petch constants and their role on the superposition law exponent in al alloys. Adv. Eng. Mater. 2012. [Google Scholar] [CrossRef]
- Tsaknopoulos, D. Optimization of Coupled Computational Modeling and Experimentation for Metallic Systems: Systematic Microstructural Feature—Mechanical Property Correlation for Cold-Sprayable Powders. Ph.D. Thesis, Worcester Polytechnic Institute, Worcester, MA, USA, 2019. [Google Scholar]
- Sato, Y.S.; Urata, M.; Kokawa, H.; Ikeda, K. Hall-Petch relationship in friction stir welds of equal channel angular-pressed aluminium alloys. Mater. Sci. Eng. A 2003. [Google Scholar] [CrossRef]
- Hasegawa, H.; Komura, S.; Utsunomiya, A.; Horita, Z.; Furukawa, M.; Nemoto, M.; Langdon, T.G. Thermal stability of ultrafine-grained aluminum in the presence of Mg and Zr additions. Mater. Sci. Eng. A 1999. [Google Scholar] [CrossRef]
- Anderson, I.E.; White, E.M.H.; Tiarks, J.A.; Riedemann, T.; Byrd, D.J.; Anderson, R.D.; Regele, J.D. Fundamental progress toward increased powder yields from gas atomization for additive manufacturing. In Proceedings of the Advances in Powder Metallurgy and Particulate Materials-2017, Metal PowderIndustries Federation, Princeton, NJ, USA, 3 March 2017; pp. 136–146. [Google Scholar]
- Sabzi, H.E.; Rivera-Díaz-del-Castillo, P.E.J. Defect prevention in selective laser melting components: Compositional and process effects. Materials 2019, 12, 3791. [Google Scholar] [CrossRef] [PubMed]
- Lienhard, J.; Crook, C.; Azar, M.Z.; Hassani, M.; Mumm, D.R.; Veysset, D.; Apelian, D.; Nelson, K.A.; Champagne, V.; Nardi, A.; et al. Surface oxide and hydroxide effects on aluminum microparticle impact bonding. Acta Mater. 2020, 197, 28–39. [Google Scholar] [CrossRef]
- Tweed, J.H.; Chalker, P.R.; Young, R.M.K. Degassing of RS 2014 aluminium. Met. Powder Rep. 1991. [Google Scholar] [CrossRef]
- Yamasaki, M.; Kawamura, Y. Effect of vacuum degassing on surface characteristics of rapidly solidified Al-based alloy powders. Mater. Trans. 2004. [Google Scholar] [CrossRef]
- Kang, K.; Yoon, S.; Ji, Y.; Lee, C. Oxidation dependency of critical velocity for aluminum feedstock deposition in kinetic spraying process. Mater. Sci. Eng. A 2008. [Google Scholar] [CrossRef]
- Schmidt, T.; Gärtner, F.; Assadi, H.; Kreye, H. Development of a generalized parameter window for cold spray deposition. Acta Mater. 2006. [Google Scholar] [CrossRef]
- Metallography: Principles and practice. Metallography 1985, 18, 307–308. [CrossRef]
- Magnusson, H.; Frisk, K. Self-diffusion and impurity diffusion of hydrogen, oxygen, sulphur and phosphorus in copper. Swedish Nucl. Waste Manag. Co. Tech. Rep. 2013, 1–39. [Google Scholar]
- White, A.H.; Germer, L.H. The Rate of Oxidation of Copper at Room Temperature. Trans. Electrochem. Soc. 1942. [Google Scholar] [CrossRef]
- Ledford, C.; Rock, C.; Carriere, P.; Frigola, P.; Gamzina, D.; Horn, T. Characteristics and processing of hydrogen-treated copper powders for EB-PBF additive manufacturing. Appl. Sci. 2019, 9, 3993. [Google Scholar] [CrossRef]
- Li, C.J.; Wang, H.T.; Zhang, Q.; Yang, G.J.; Li, W.Y.; Liao, H.L. Influence of spray materials and their surface oxidation on the critical velocity in cold spraying. Therm Spray Tech. 2010, 19, 95–101. [Google Scholar] [CrossRef]
- Davis, J.R. Solidifcation Structures of Copper Alloy Ingots. In Copper and Copper Alloys; ASM International: Cleveland, OH, USA, 2001; pp. 360–368. [Google Scholar]
- Gertsman, V.Y.; Hoffmann, M.; Gleiter, H.; Birringer, R. The study of grain size dependence of yield stress of copper for a wide grain size range. Acta Metall. Mater. 1994, 42, 3539–3544. [Google Scholar] [CrossRef]
- Belsito, D.; McNally, B.; Bassett, L.; Champagne, V.; Sisson, R.D. Through-process modeling for cold spray alloy optimization. In Proceedings of the Materials Science and Technology Conference and Exhibition 2013, MS & T 2013, Montreal, QC, Canada, 27–31 October 2013. [Google Scholar]
- Belsito, D.; McNally, B.; Bassett, L.; Sisson, R.; Champagne, V. A through-process model for cold sprayed aluminum alloys. In Proceedings of the Thermal Process Modeling—Proceedings from the 5th International Conference on Thermal Process Modeling and Computer Simulation, ICTPMCS 2014, Orlando, FL, USA, 16–18 June 2014. [Google Scholar]
- Adams, M.J.; McKeown, R. Micromechanical analyses of the pressure-volume relationships for powders under confined uniaxial compression. Powder Technol. 1996. [Google Scholar] [CrossRef]
- Henrik, J. Confined Compression of Single Particles: Development of a Novel Triaxial Testing Instrument and Particle-Scale Modelling, Diss. Acta. Ph.D. Thesis, Universitatis Upsaliensis, Uppsala, Sweden, 2018. [Google Scholar]
- Bazilchuk, M.; Pettersen, S.R.; Kristiansen, H.; Zhang, Z.; He, J. Electromechanical characterization of individual micron-sized metal coated polymer particles. J. Appl. Phys. 2016. [Google Scholar] [CrossRef]
- Yoshida, M.; Ogiso, H.; Nakano, S.; Akedo, J. Compression test system for a single submicrometer particle. Rev. Sci. Instrum. 2005. [Google Scholar] [CrossRef]
- Antonyuk, S.; Heinrich, S.; Tomas, J.; Deen, N.G.; Van Buijtenen, M.S.; Kuipers, J.A.M. Energy absorption during compression and impact of dry elastic-plastic spherical granules. Granul. Matter 2010. [Google Scholar] [CrossRef]
- Jakupi, P.; Keech, P.G.; Barker, I.; Ramamurthy, S.; Jacklin, R.L.; Shoesmith, D.W.; Moser, D.E. Characterization of commercially cold sprayed copper coatings and determination of the effects of impacting copper powder velocities. J. Nucl. Mater. 2015. [Google Scholar] [CrossRef]
- Chaudhuri, A.; Raghupathy, Y.; Srinivasan, D.; Suwas, S.; Srivastava, C. Microstructural evolution of cold-sprayed Inconel 625 superalloy coatings on low alloy steel substrate. Acta Mater. 2017. [Google Scholar] [CrossRef]
- Zhang, Y.; Brodusch, N.; Descartes, S.; Chromik, R.R.; Gauvin, R. Microstructure refinement of cold-sprayed copper investigated by electron channeling contrast imaging. Microsc. Microanal. 2014. [Google Scholar] [CrossRef] [PubMed]
- Zou, Y.; Qin, W.; Irissou, E.; Legoux, J.G.; Yue, S.; Szpunar, J.A. Dynamic recrystallization in the particle/particle interfacial region of cold-sprayed nickel coating: Electron backscatter diffraction characterization. Scr. Mater. 2009. [Google Scholar] [CrossRef]
- ISHIBASHI, T.; SHIMODA, S. The Correlation Between Hardness (Mean Contact Pressure by a Spherical Indenter) and Flow Stress. JSME Int. J. Ser. 1 Solid Mech. Strength Mater. 1988, 31, 117–125. [Google Scholar] [CrossRef][Green Version]
- Kelly, P.M.; Ren, H.P.; Qiu, D.; Zhang, M.X. Identifying close-packed planes in complex crystal structures. Acta Mater. 2010. [Google Scholar] [CrossRef]
- Soboyejo, W. Mechanical Properties of Engineered Materials; Marcel Dekker, Inc.: New York, NY, USA, 2002. [Google Scholar]
- Pathak, S.; Michler, J.; Wasmer, K.; Kalidindi, S.R. Studying grain boundary regions in polycrystalline materials using spherical nano-indentation and orientation imaging microscopy. J. Mater. Sci. 2012. [Google Scholar] [CrossRef]
- Vachhani, S.J.; Doherty, R.D.; Kalidindi, S.R. Studies of grain boundary regions in deformed polycrystalline aluminum using spherical nanoindentation. Int. J. Plast. 2016. [Google Scholar] [CrossRef]
- Vachhani, S.J.; Kalidindi, S.R. Grain-scale measurement of slip resistances in aluminum polycrystals using spherical nanoindentation. Acta Mater. 2015. [Google Scholar] [CrossRef]
- Leitner, A.; Maier-Kiener, V.; Kiener, D. Essential refinements of spherical nanoindentation protocols for the reliable determination of mechanical flow curves. Mater. Des. 2018. [Google Scholar] [CrossRef]
- Bedard, B.A.; Flanagan, T.J.; Ernst, A.T.; Nardi, A.; Dongare, A.M.; Brody, H.D.; Champagne, V.K.; Lee, S.W.; Aindow, M. Microstructure and Micromechanical Response in Gas-Atomized Al 6061 Alloy Powder and Cold-Sprayed Splats. J. Therm. Spray Technol. 2018. [Google Scholar] [CrossRef]
- Oliver, W.C.; Pharr, G.M. An improved technique for determining hardness and elastic modulus using load and displacement sensing indentation experiments. J. Mater. Res. 1992. [Google Scholar] [CrossRef]
- Profizi, P.; Combescure, A.; Ogawa, K. SPH modeling of adhesion in fast dynamics: Application to the Cold Spray process. Comptes Rendus Mec. 2016, 344, 211–224. [Google Scholar] [CrossRef]
- Assadi, H.; Irkhin, I.; Gutzmann, H.; Gärtner, F.; Schulze, M.; Villa Vidaller, M.; Klassen, T. Determination of plastic constitutive properties of microparticles through single particle compression. Adv. Powder Technol. 2015. [Google Scholar] [CrossRef]
- Liu, Y.; Zhang, X. Beyond Indentation Hardness and Modulus: Recent Advances in Nanoindentation Techniques: Part II. JOM 2018, 70, 485–486. [Google Scholar] [CrossRef]
- Affonso, L.O.A. Machinery Failure Analysis Handbook: Sustain Your Operations and Maximize Uptime; Gulf Publishing Company: Houston, TX, USA, 2007; ISBN 9781933762081. [Google Scholar]
- Tsui, T.Y.; Pharr, G.M.; Oliver, W.C.; Bhatia, C.S.; White, R.L.; Anders, S.; Anders, A.; Brown, I.G. Nanoindentation and nanoscratching of hard carbon coatings for magnetic disks. Mater. Res. Soc. Symp. Proc. 1995, 383, 447–452. [Google Scholar] [CrossRef]
- Sun, Y.; Veysset, D.; Nelson, K.A.; Schuh, C.A. The Transition From Rebound to Bonding in High-Velocity Metallic Microparticle Impacts: Jetting-Associated Power-Law Divergence. J. Appl. Mech. 2020, 87. [Google Scholar] [CrossRef]
- Hassani-Gangaraj, M.; Veysset, D.; Champagne, V.K.; Nelson, K.A.; Schuh, C.A. Adiabatic shear instability is not necessary for adhesion in cold spray. Acta Mater. 2018. [Google Scholar] [CrossRef]
- Hassani-Gangaraj, M.; Veysset, D.; Champagne, V.K.; Nelson, K.A.; Schuh, C.A. Response to Comment on “Adiabatic shear instability is not necessary for adhesion in cold spray”. Scr. Mater. 2019, 162, 515–519. [Google Scholar] [CrossRef]
- Blose, R.E.; Walker, B.H.; Walker, R.M.; Froes, S.H. New opportunities to use cold spray process for applying additive features to titanium alloys. Met. Powder Rep. 2006, 61, 30–37. [Google Scholar] [CrossRef]
- Birt, A.M.; Champagne, V.K.; Sisson, R.D.; Apelian, D. Statistically Guided Development of Laser-Assisted Cold Spray for Microstructural Control of Ti-6Al-4V. Metall. Mater. Trans. A 2017, 48, 1931–1943. [Google Scholar] [CrossRef]
- Sun, W.; Tan, A.W.-Y.; Wu, K.; Yin, S.; Yang, X.; Marinescu, I.; Liu, E. Post-Process Treatments on Supersonic Cold Sprayed Coatings: A Review. Coatings 2020, 10, 123. [Google Scholar] [CrossRef]
- Wang, Y.; Adrien, J.; Normand, B. Porosity Characterization of Cold Sprayed Stainless Steel Coating Using Three-Dimensional X-ray Microtomography. Coatings 2018, 8, 326. [Google Scholar] [CrossRef]
- Gizynski, M.; Miyazaki, S.; Sienkiewicz, J.; Kuroda, S.; Araki, H.; Murakami, H.; Pakiela, Z.; Yumoto, A. Formation and subsequent phase evolution of metastable Ti-Al alloy coatings by kinetic spraying of gas atomized powders. Surf. Coat. Technol. 2017. [Google Scholar] [CrossRef]
- Lehtonen, J.; Ge, Y.; Ciftci, N.; Heczko, O.; Uhlenwinkel, V.; Hannula, S.P. Phase structures of gas atomized equiatomic CrFeNiMn high entropy alloy powder. J. Alloys Compd. 2020. [Google Scholar] [CrossRef]
- Grady, D.E. The spall strength of condensed matter. J. Mech. Phys. Solids 1988, 36, 353–384. [Google Scholar] [CrossRef]
- Luo, X.-T.; Li, Y.-J.; Li, C.-J. A comparison of cold spray deposition behavior between gas atomized and dendritic porous electrolytic Ni powders under the same spray conditions. Mater. Lett. 2016, 163, 58–60. [Google Scholar] [CrossRef]
- Wu, J.; Fang, H.; Yoon, S.; Kim, H.; Lee, C. The rebound phenomenon in kinetic spraying deposition. Scr. Mater. 2006, 54, 665–669. [Google Scholar] [CrossRef]
- Yildirim, B.; Yang, H.; Gouldstone, A.; Müftü, S. Rebound mechanics of micrometre-scale, spherical particles in high-velocity impacts. Proc. R. Soc. A Math. Phys. Eng. Sci. 2017, 473, 20160936. [Google Scholar] [CrossRef]
- Story, W. Processing-Microstructure-Property Relations in High Pressure Cold Spray Deposition of AA2024 and AA7075. Ph.D. Thesis, University of Alabama, Tuscaloosa, AL, USA, 2018. [Google Scholar]
- Ozdemir, O.C.; Widener, C.A.; Carter, M.J.; Johnson, K.W. Predicting the Effects of Powder Feeding Rates on Particle Impact Conditions and Cold Spray Deposited Coatings. J. Therm. Spray Technol. 2017. [Google Scholar] [CrossRef]
- Yang, K.; Li, W.; Yang, X.; Xu, Y. Anisotropic response of cold sprayed copper deposits. Surf. Coat. Technol. 2018. [Google Scholar] [CrossRef]
- Yin, S.; Jenkins, R.; Yan, X.; Lupoi, R. Microstructure and mechanical anisotropy of additively manufactured cold spray copper deposits. Mater. Sci. Eng. A 2018. [Google Scholar] [CrossRef]
- Seiner, H.; Cizek, J.; Sedlák, P.; Huang, R.; Cupera, J.; Dlouhy, I.; Landa, M. Elastic moduli and elastic anisotropy of cold sprayed metallic coatings. Surf. Coat. Technol. 2016. [Google Scholar] [CrossRef]
- Birt, A.M.; Champagne, V.K.; Sisson, R.D.; Apelian, D. Microstructural analysis of Ti–6Al–4V powder for cold gas dynamic spray applications. Adv. Powder Technol. 2015, 26, 1335–1347. [Google Scholar] [CrossRef]
- Goldbaum, D.; Chromik, R.R.; Yue, S.; Irissou, E.; Legoux, J.-G. Mechanical Property Mapping of Cold Sprayed Ti Splats and Coatings. J. Therm. Spray Technol. 2011, 20, 486–496. [Google Scholar] [CrossRef]


© 2020 by the authors. Licensee MDPI, Basel, Switzerland. This article is an open access article distributed under the terms and conditions of the Creative Commons Attribution (CC BY) license (http://creativecommons.org/licenses/by/4.0/).