Characterizing the Soldering Alloy Type Zn–Al–Cu and Study of Ultrasonic Soldering of Al7075/Cu Combination

Abstract
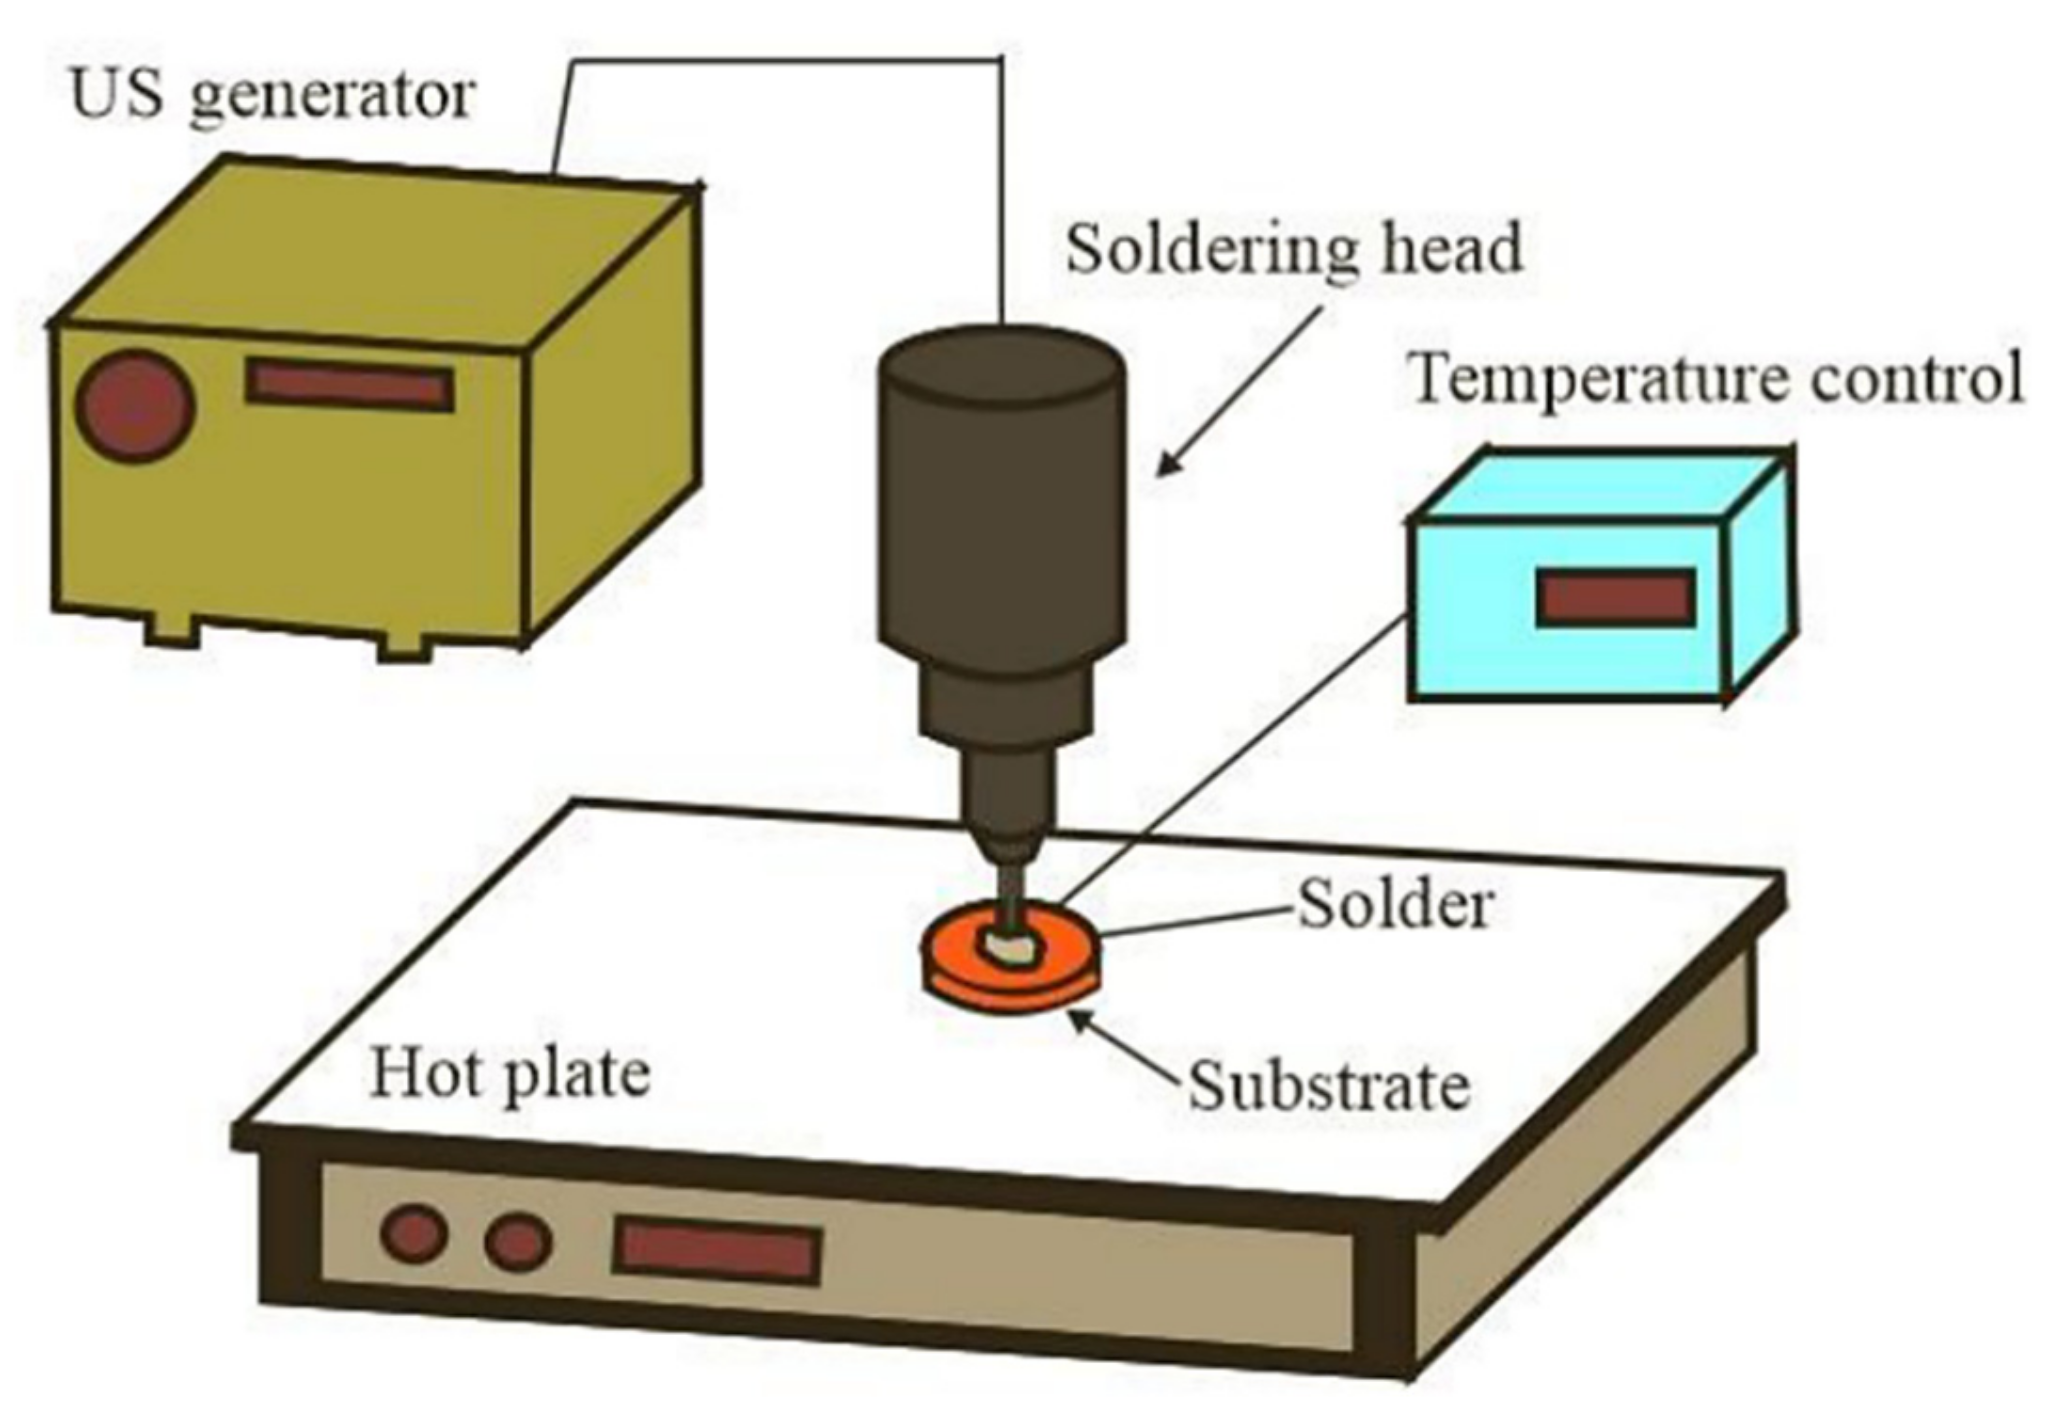
:1. Introduction
2. Materials and Methods
- metallic Cu substrate of 4N purity in the shape of discs with dimensions Ø 15 mm × 2 mm,
- metallic Al7075 substrate in the shape of discs with dimensions Ø 15 mm × 2 mm.
3. Results
3.1. DSC Analysis
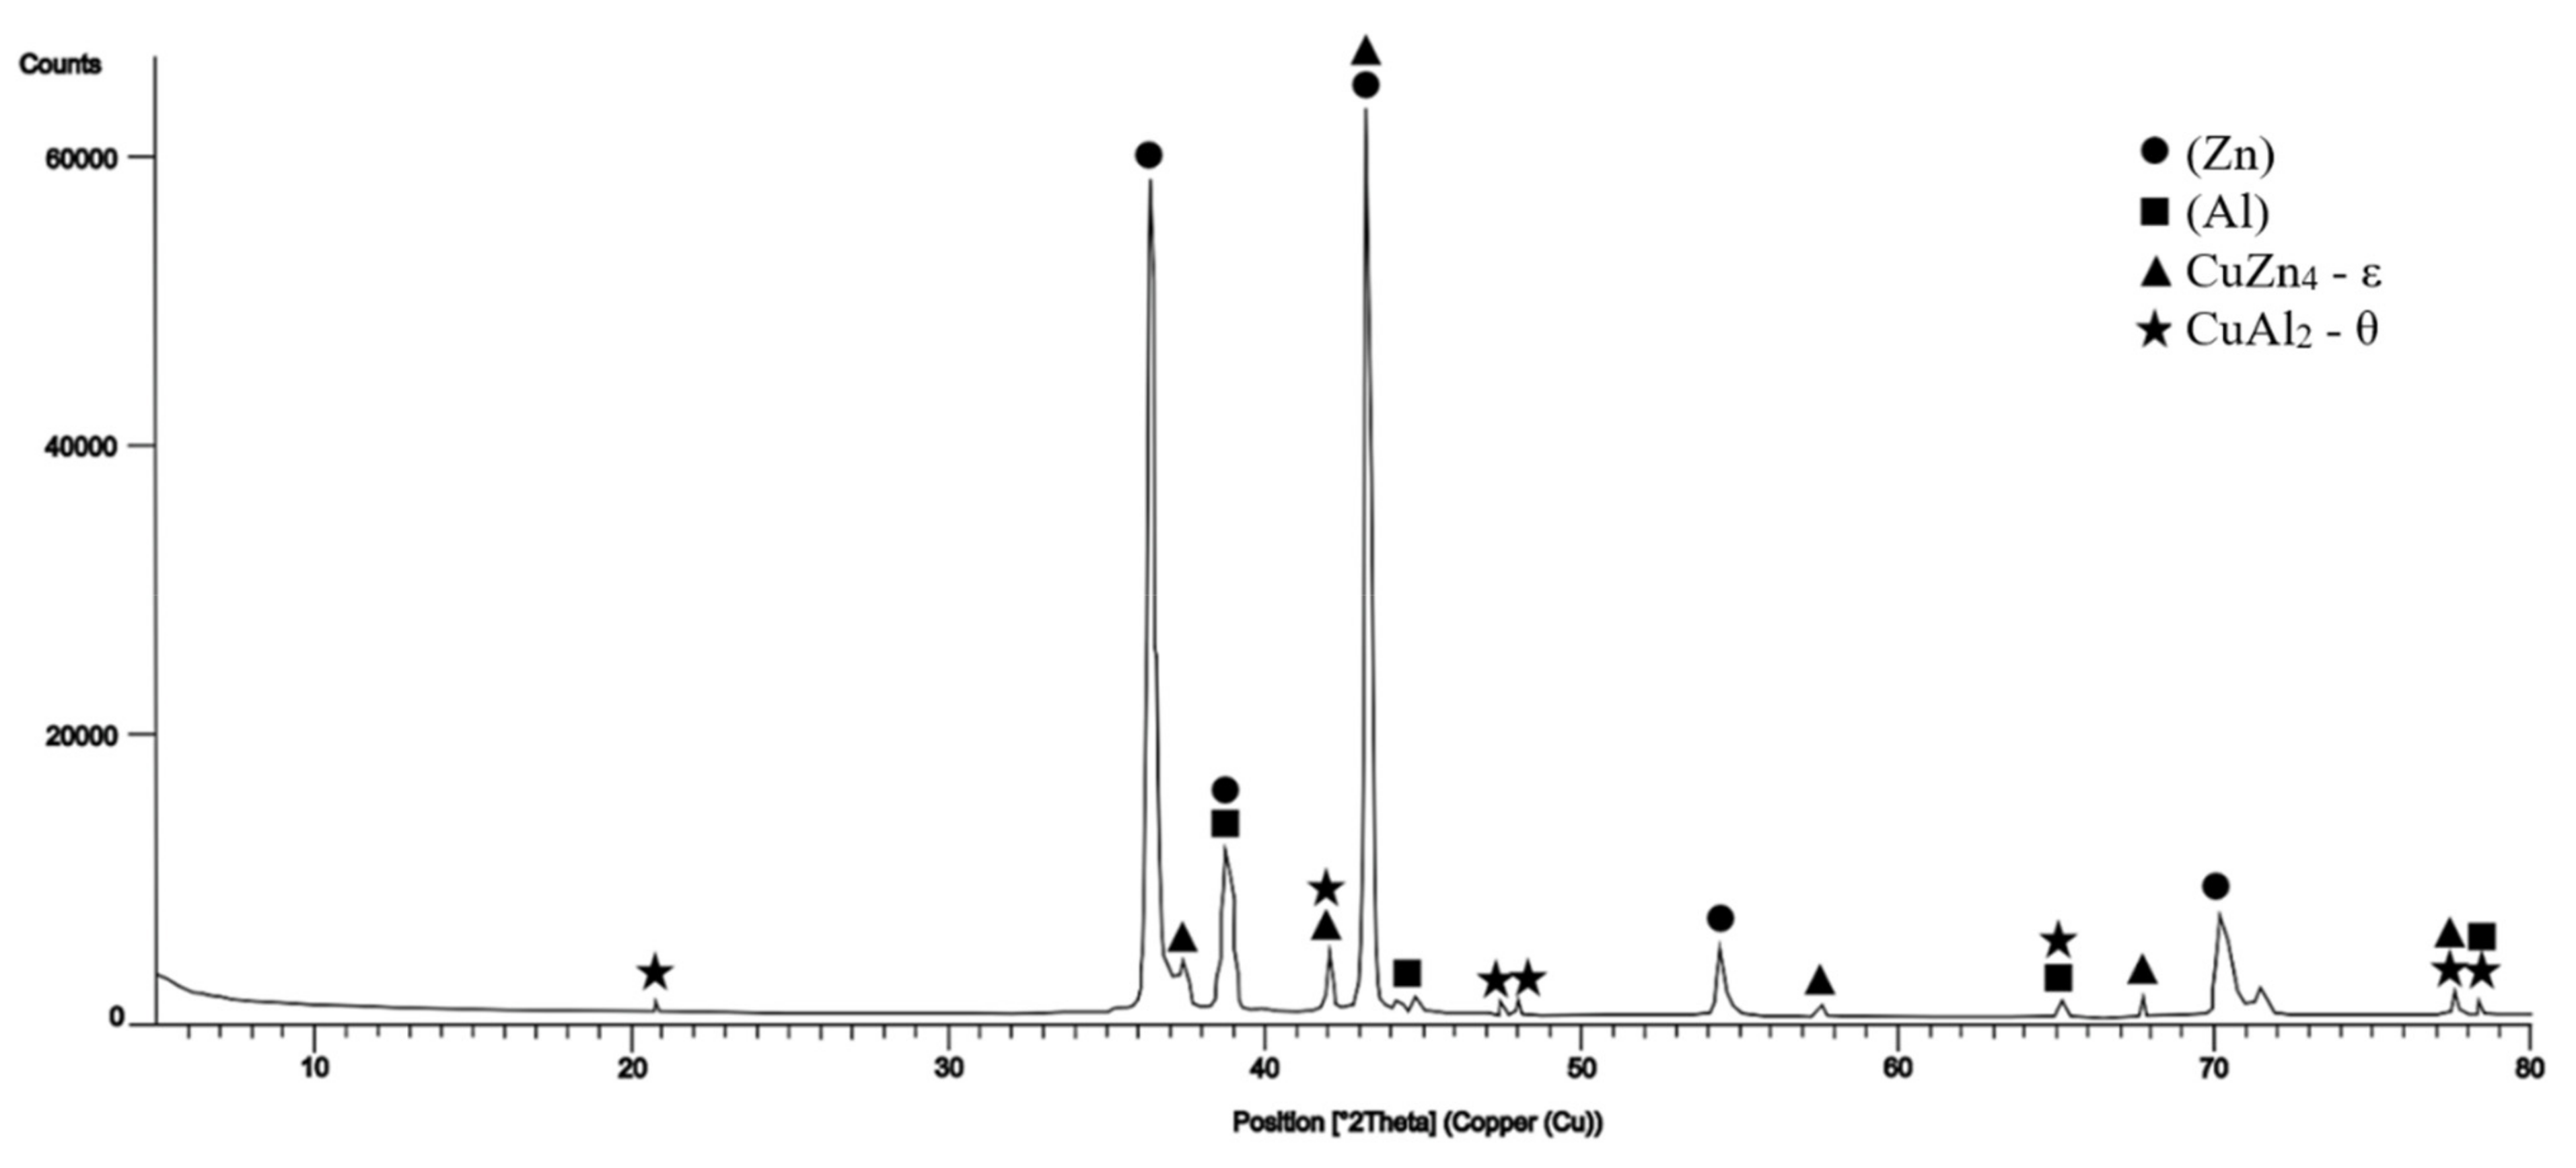
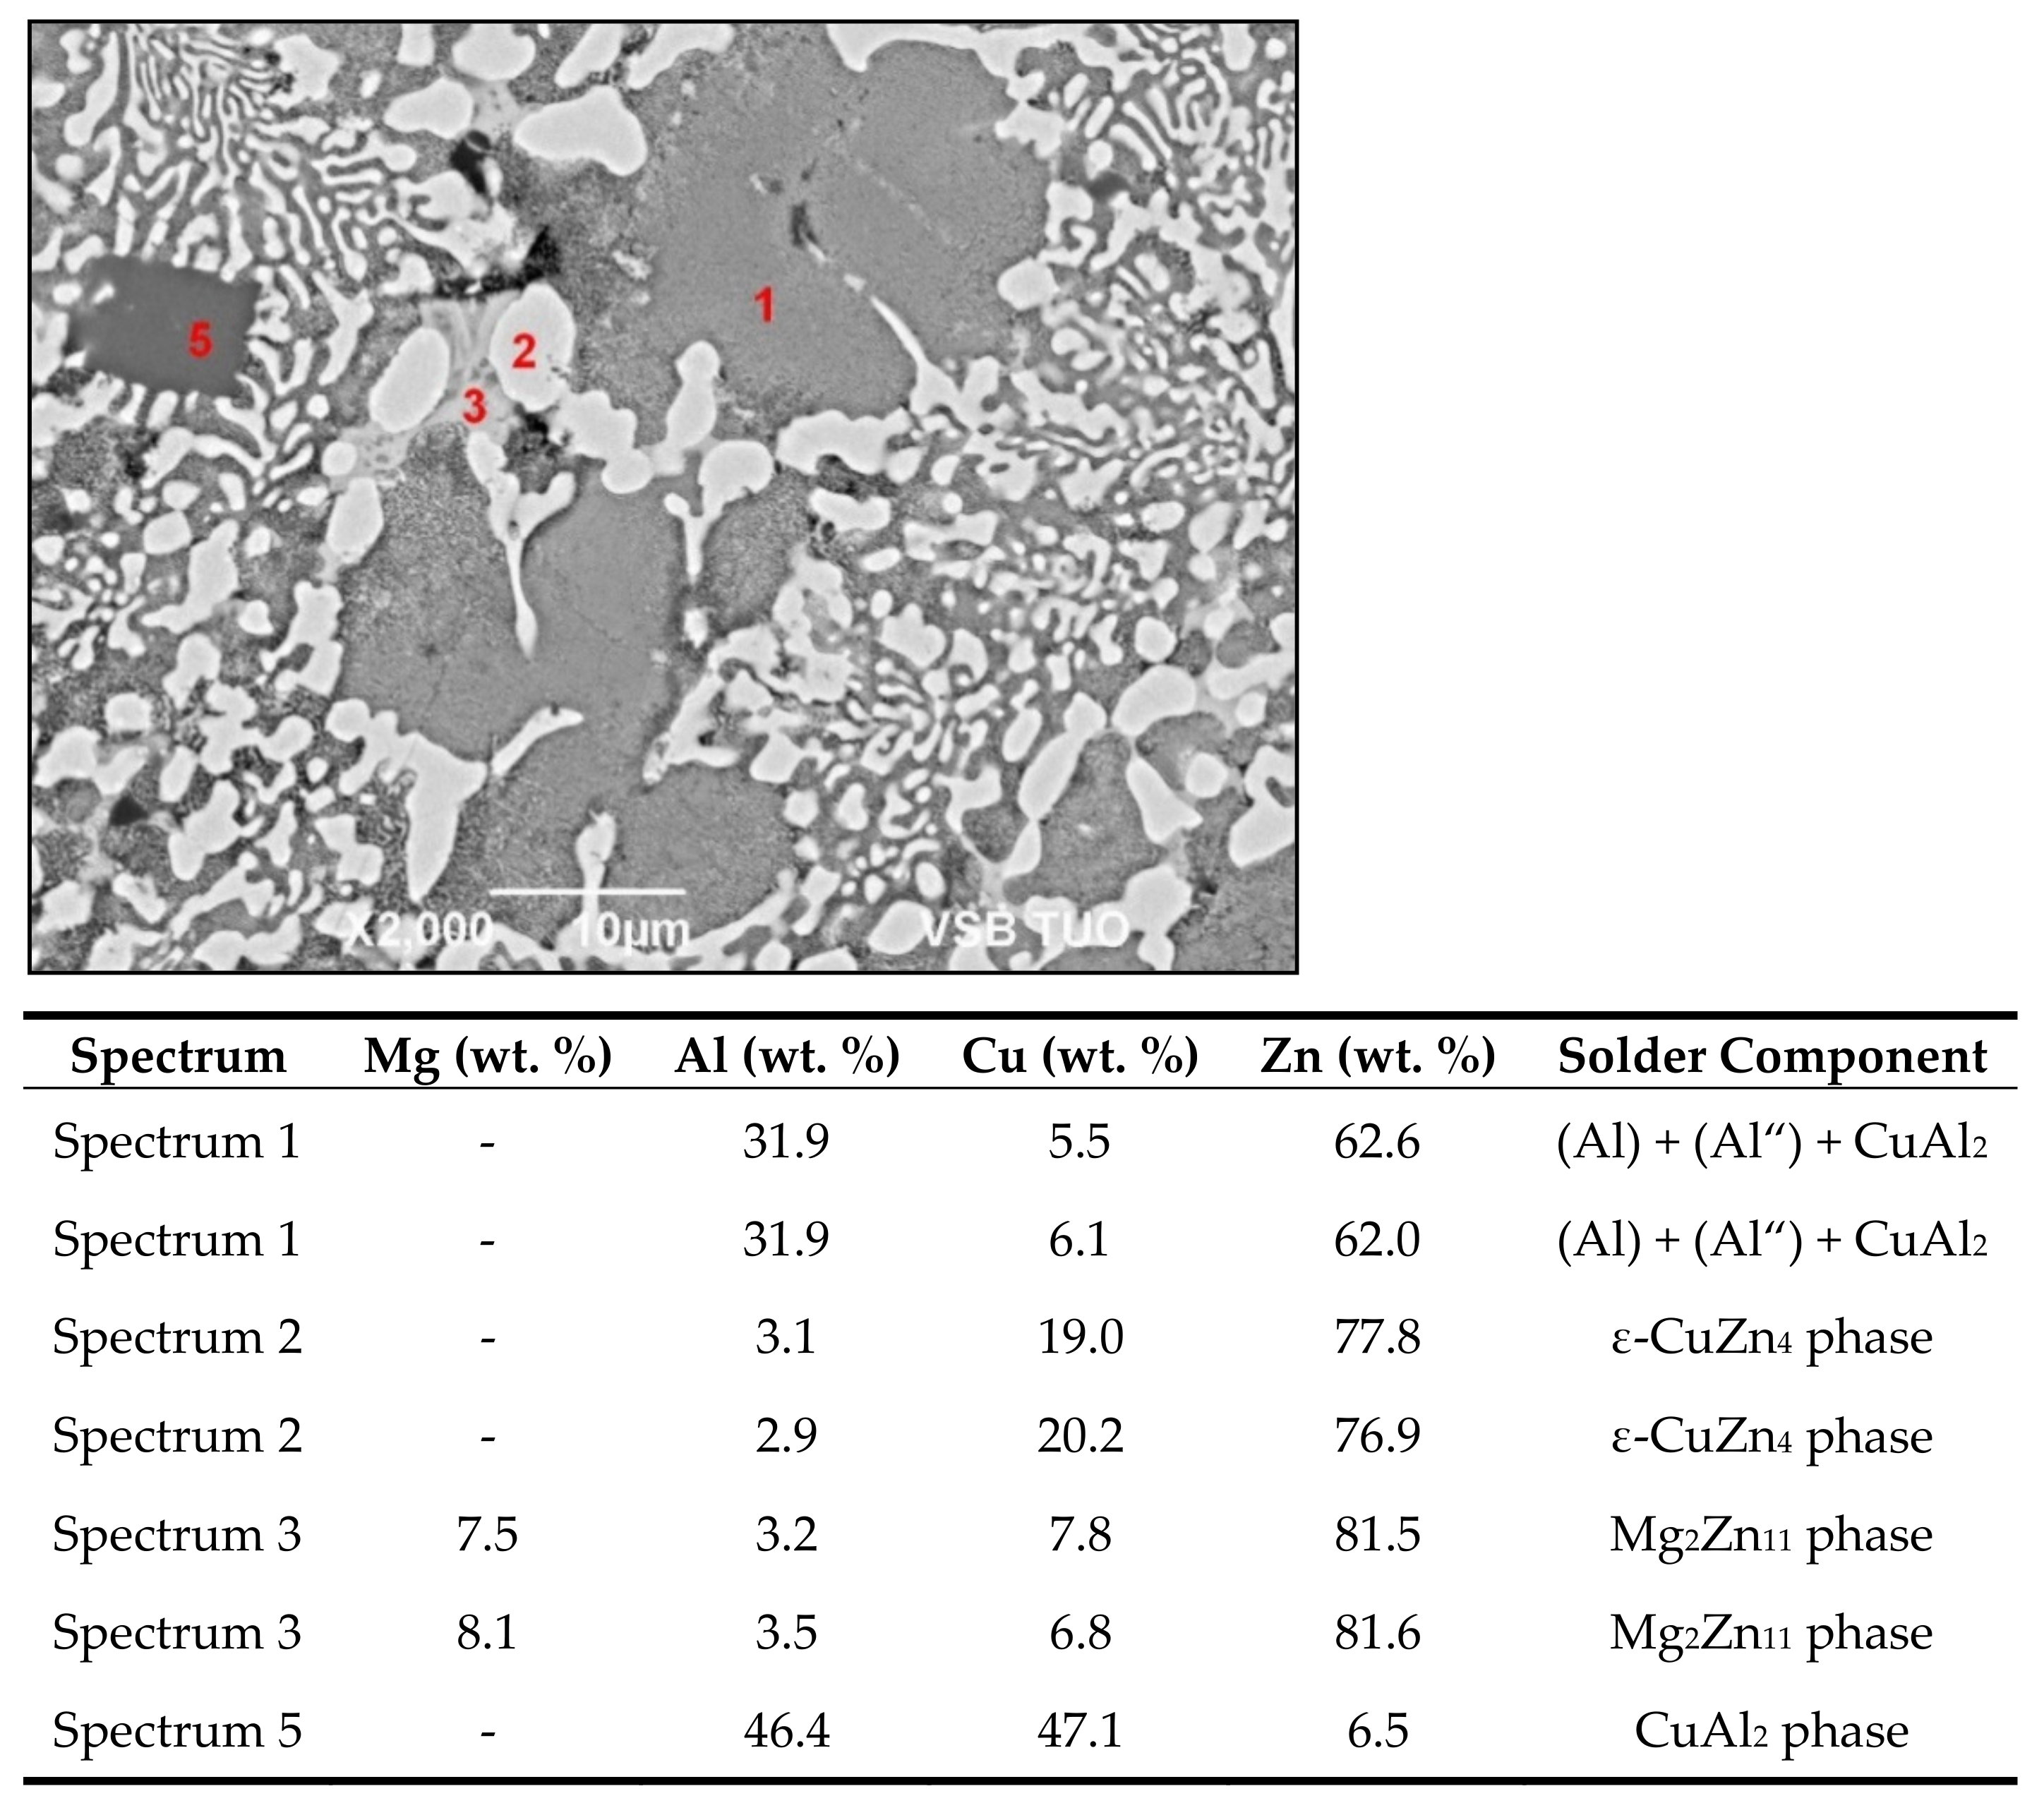
3.2. Microstructure of Solders Type Zn–Al–Cu
3.3. Tensile Strength of Soldering Alloys Type Zn–Al–Cu
3.4. Microstructure of Al7075/Zn–Al–Cu/Cu Joint
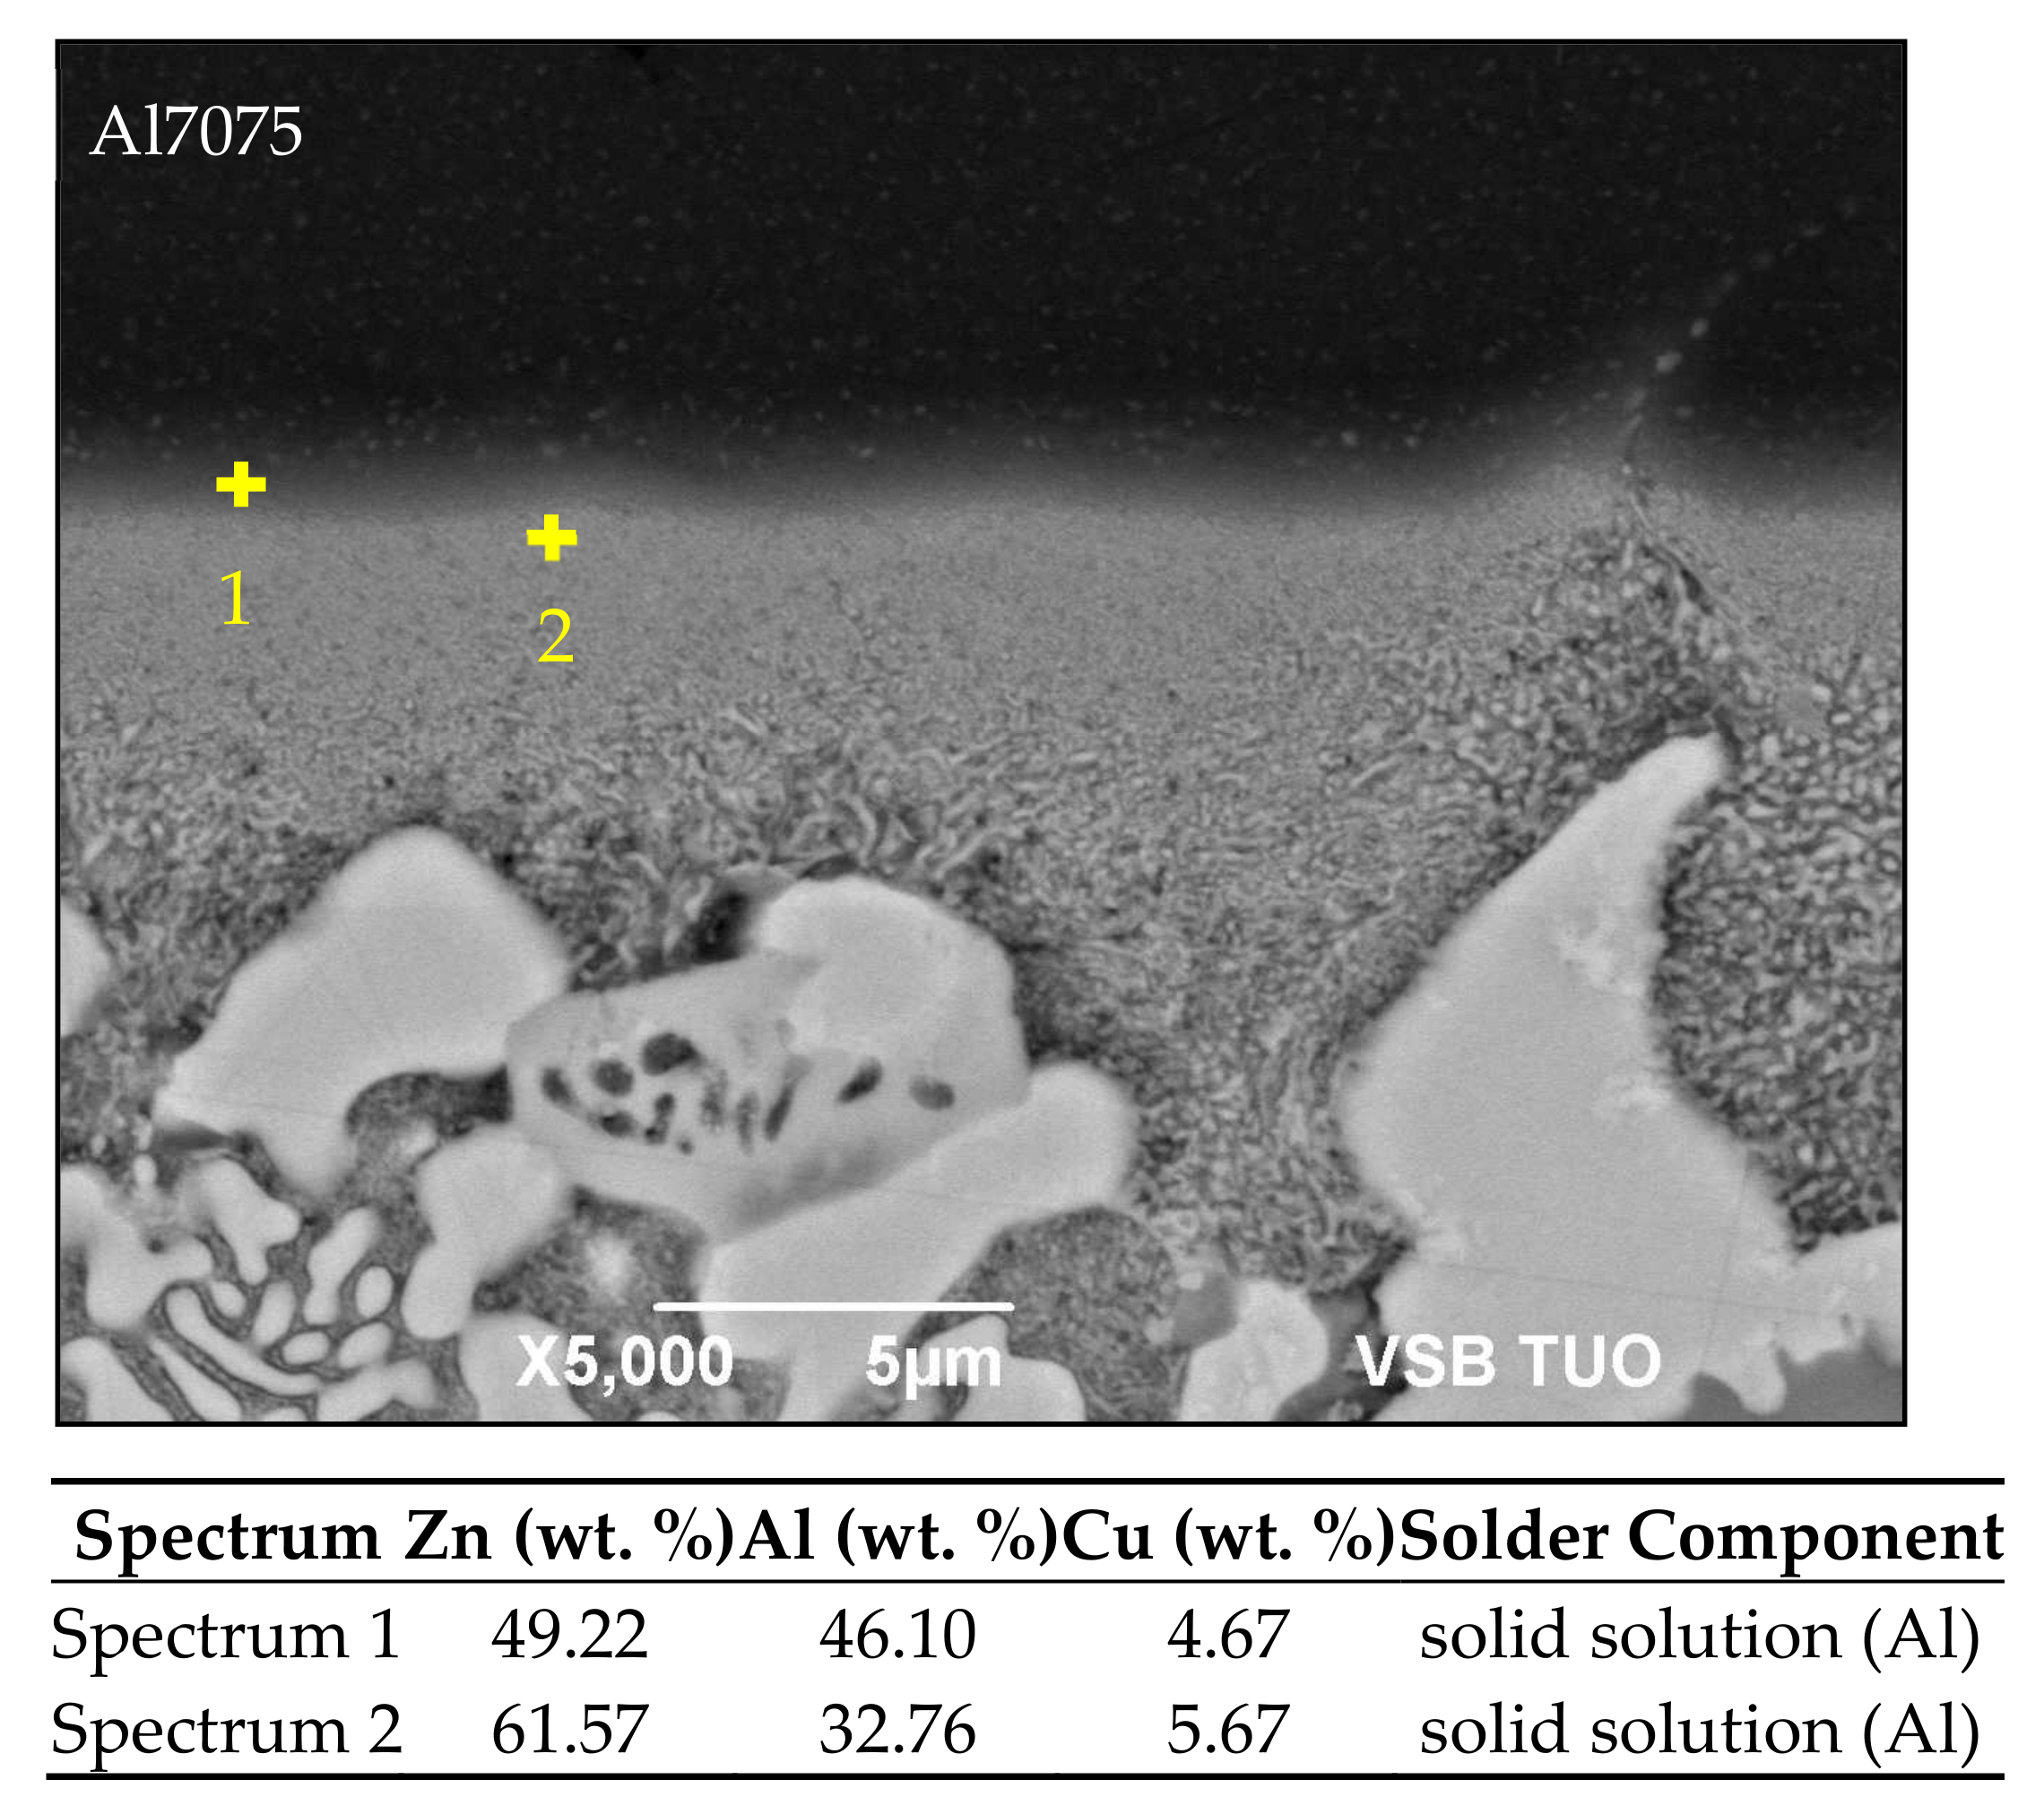
3.5. Microstructure of Boundary in Al7075/Zn5Al3Cu Joint
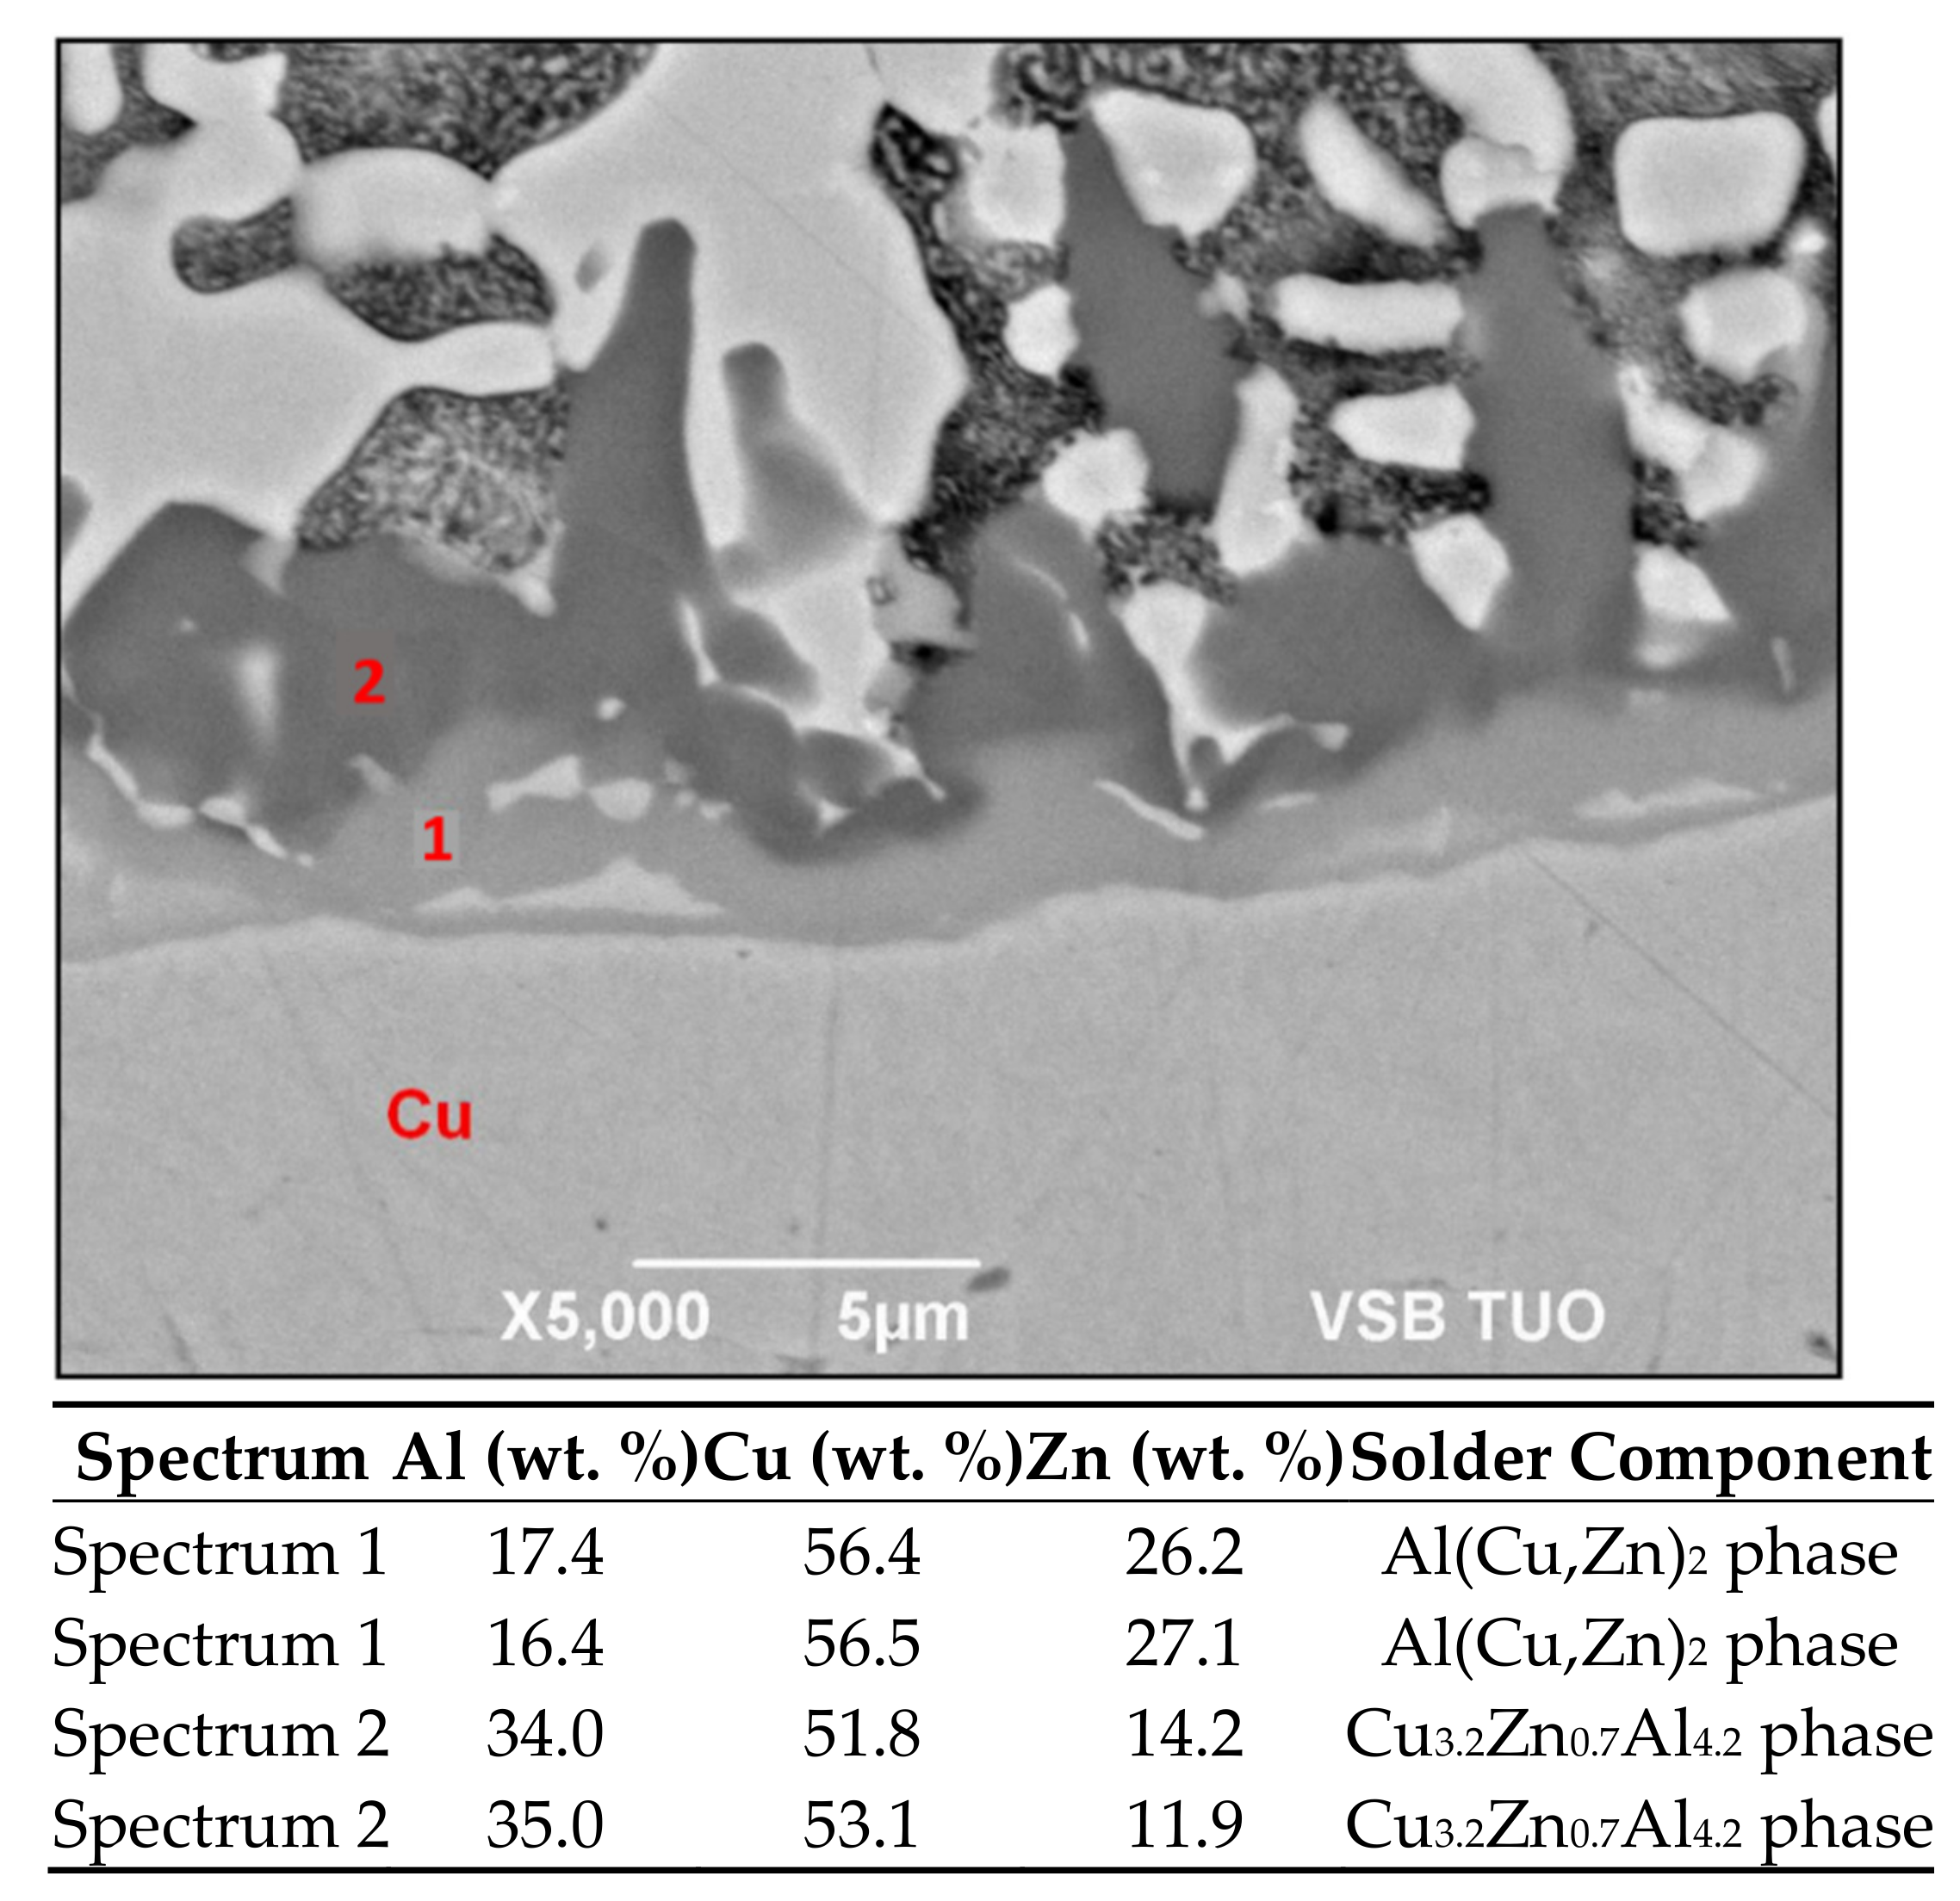
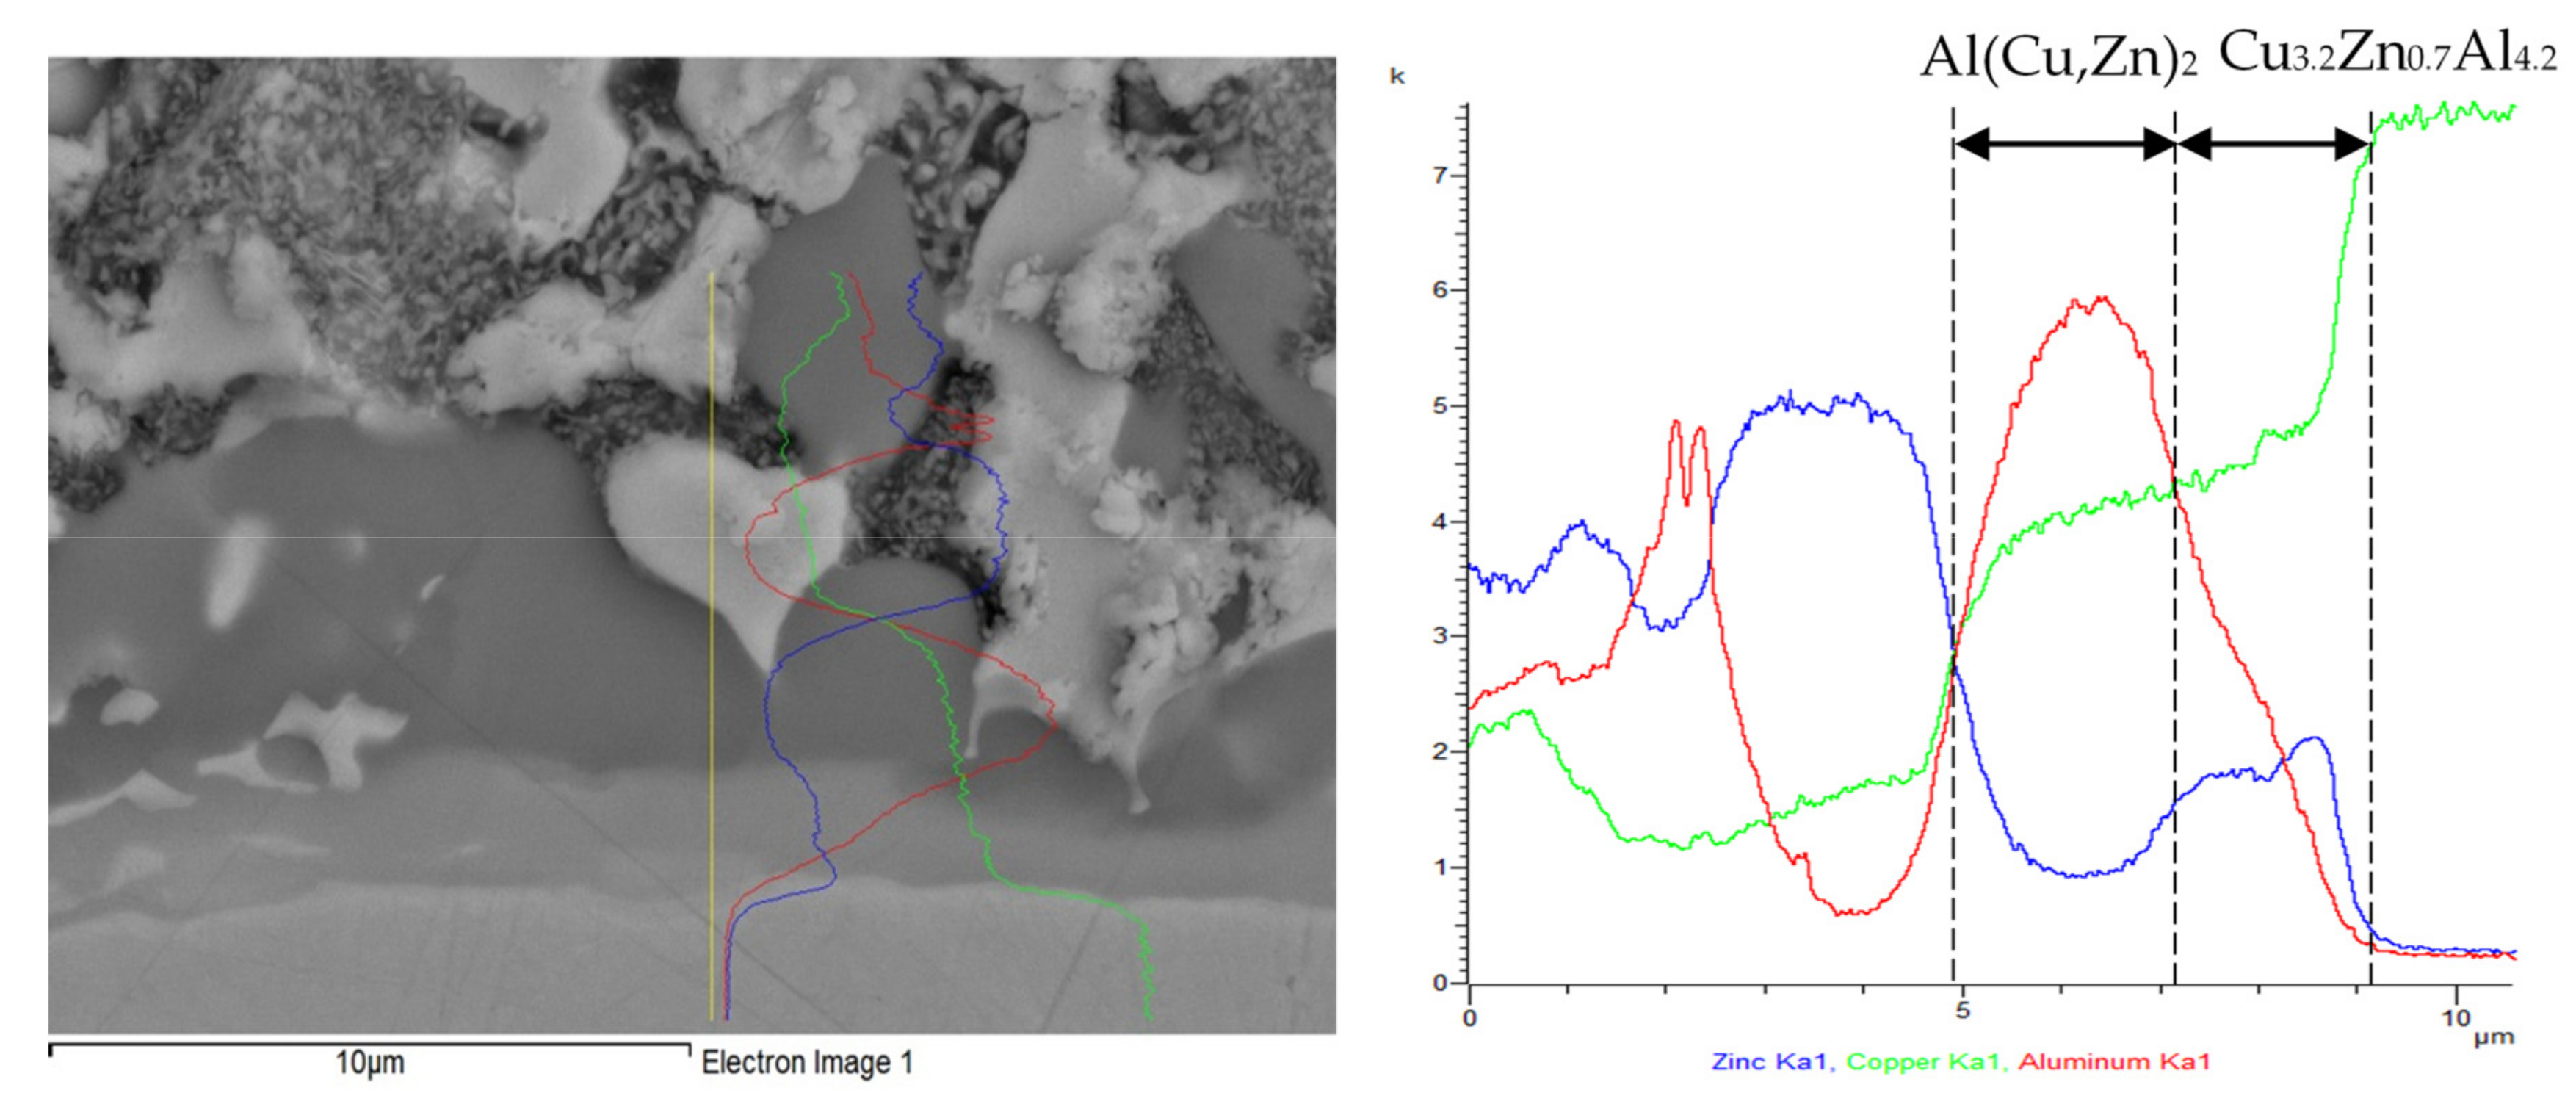
3.6. Microstructure of Boundary in Cu/Zn5Al3Cu Joint
3.7. Shear Strength of Soldered Joints
4. Conclusions
- To determine the melting point of the solder, DSC analysis was applied. The DSC curve contains two basic peaks. The first peak corresponds to eutectoid transformation in the Zn–Al system. The second peak corresponds to eutectic transformation in the same system. It was found that the addition of Cu to the solder increases the temperature of eutectoid transformation to approximately 285 °C and, vice versa, the temperature of eutectic transformation is reduced to 378 °C.
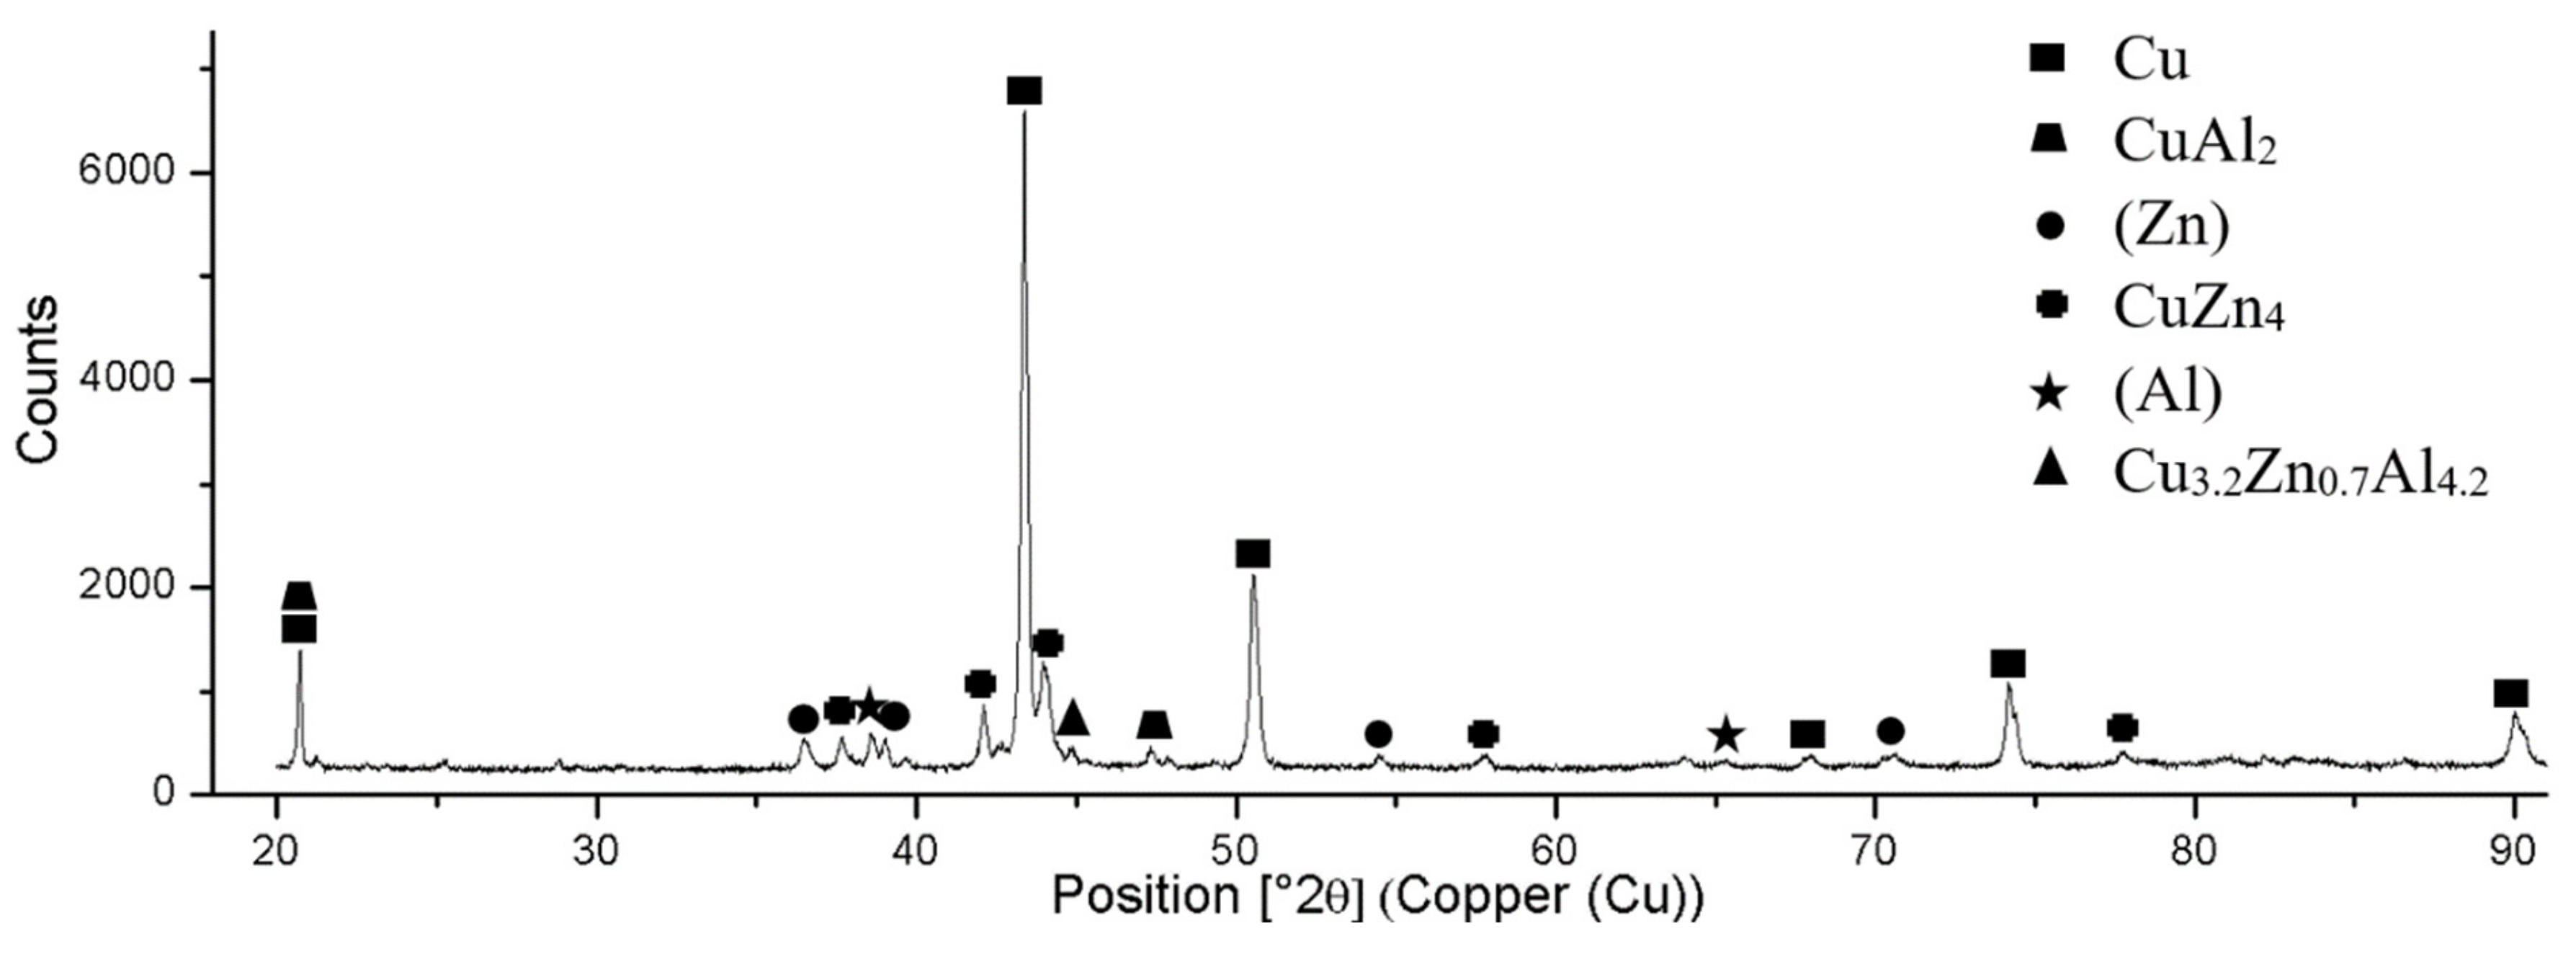
- The microstructure of solder of type Zn–Al–Cu is formed of a eutectic mixture of solid solutions Zn + Al + Al“. Two copper phases, CuZn4 and CuAl2, were identified in the solder matrix.
- The average tensile strength of soldering alloys of type Zn–Al–Cu reaches values from 167 to 187 MPa. It was found that the addition of copper partially reduces the tensile strength of soldering alloys of type Zn–Al–Cu. The addition of 3 wt. % Cu to Zn5Al solder will reduce the average tensile strength by 38 MPa. This is caused by the formation of copper phases of type CuZn4 and CuAl2.
- The bond of aluminum alloy with Zn5Al3Cu solder is formed due to the dissolution of Al in zinc solder at the formation of solid solution Al. The width of the solubility band with the solid solution Al was 5 to 11 µm.
- Two new intermetallic phases, namely Al(Cu,Zn)2 and Cu3.2Zn0.7Al4.2, were identified in the boundary of the Cu/Zn5Al3Cu joint, which are the result of interaction of the zinc solder and copper substrate. Beside the interaction of Zn, also a significant effect of Al on bond formation with the copper substrate was proved.
- The average shear strength of the Al7075/Zn5Al3Cu/Cu joint had a value of 134.5 MPa. For comparison, the Cu/Zn5Al3Cu/Cu joint attained an average shear strength of 136.5 MPa.
Author Contributions
Funding
Acknowledgments
Conflicts of Interest
References
- Lee, W.-B.; Bang, K.-S.; Jung, S.-B. Effects of intermetallic compound on the electrical and mechanical properties of friction welded Cu/Al bimetallic joints during annealing. J. Alloy. Compd. 2005, 390, 212–219. [Google Scholar] [CrossRef]
- Ouyang, J.H.; Yarrapareddy, E.; Kovacevic, R. Microstructural evolution in the friction stir welded 6061 aluminum alloy to copper. J. Mater. Process. Technol. 2006, 172, 110–112. [Google Scholar] [CrossRef]
- Sahin, M. Joining of aluminum and copper materials with friction welding. Int. J. Adv. Manuf. Technol. 2009, 49, 527–534. [Google Scholar] [CrossRef]
- Mai, T.A.; Spowage, A.C. Characterisation of dissimilar joints in laser welding of steel-kovar, copper-steel and copper-aluminium. Mater. Sci. Eng. 2004, 374, 224–233. [Google Scholar] [CrossRef]
- Abbasi, M.; Taheri, A.K.; Salehi, M. Growth rate of intermetallic compounds in Al/Cu bimetal produced by cold roll welding process. J. Alloy. Compd. 2001, 319, 233–241. [Google Scholar] [CrossRef]
- Xia, C.; Li, Y.; Puchkov, U.; Gerasimov, S.; Wang, J. Microstructure and phase constitution near the interface of Cu/Al vacuum brazing using Al–Si filler metal. Vacuum 2008, 82, 799–804. [Google Scholar] [CrossRef]
- Xia, C.Z.; Li, Y.; Puchkov, U.A.; Gerasimov, S.A.; Wang, J. Crack analysis near vacuum brazing interface of Cu/Al dissimilar materials using Al–Si brazing alloy. Mater. Sci. Technol. 2009, 25, 383–387. [Google Scholar] [CrossRef]
- Xu, Z.; Li, Z.; Zhao, D.; Liu, X.; Yan, J. Effects of Zn on intermetallic compounds and strength of Al/Mg joints ultrasonically soldered in air. J. Mater. Process. Technol. 2019, 271, 384–393. [Google Scholar] [CrossRef]
- Lin, J.C.; Liang, C.L.; Lin, K.L. Joint effects of Ti and Cu additions on microstructure and mechanical properties of Zn-25Sn-xCu-yTi high-temperature Pb-free solders. Mater. Sci. Eng. A 2019, 765, 138323. [Google Scholar] [CrossRef]
- Guo, W.T.; Liang, C.L.; Lin, K.L. The effects of Cu alloying on the microstructure and mechanical properties of Zn-25Sn-xCu (x = 0–1.0 wt%) high temperature Pb-free solders. Mater. Sci. Eng. A 2019, 750, 117–124. [Google Scholar] [CrossRef]
- Wu, B.; Leng, X.; Xiu, Z.; Yan, J. Microstructural evolution of SiC joints soldered using Zn–Al filler metals with the assistance of ultrasound. Ultrason. Sonochem. 2018, 44, 280–287. [Google Scholar] [CrossRef] [PubMed]
- Xing, F.; Lu, Y.; Luo, C.; Ruan, Y.; Qiu, X. Coupling modification of microstructure for improving the mechanical properties of Zn-Sn-Cu-Bi high-temperature solder. Mater. Lett. 2016, 181, 42–46. [Google Scholar] [CrossRef]
- Liu, L.; Chen, Z.; Zhou, Z.; Chen, G.; Wu, F.; Liu, C. Diffusion barrier property of electroless Ni-W-P coating in high temperature Zn-5Al/Cu solder interconnects. J. Alloy. Compd. 2017, 722, 746–752. [Google Scholar] [CrossRef] [Green Version]
- Wang, Z.; Chen, C.; Liu, J.; Zhang, G.; Suganuma, K. Corrosion mechanism of Zn-30Sn high-temperature, lead-free solder in neutral NaCl solution. Corros. Sci. 2018, 140, 40–50. [Google Scholar] [CrossRef]
- Feng, J.I.; Xue, S.B.; Lou, J.Y.; Lou, Y.B.; Wang, S.Q. Microstructure and properties of Cu/Al joints brazed with Zn-Al filler metals. Transcations Nonferrous Met. Soc. China 2012, 22, 281–287. [Google Scholar]
- Kang, N.; Na, H.S.; Kim, S.J.; Kang, C.Y. Alloy design of Zn-Al-Cu solder for ultra high temperatures. J. Alloys Compd. 2009, 467, 246–250. [Google Scholar] [CrossRef]
- Mahmudi, R.; Alibabaie, S. Elevated-temperature shear strength and hardness of Zn-3Cu-xAl ultra-high-temperature lead-free solders. Mater. Sci. Eng. 2013, 559, 421–426. [Google Scholar] [CrossRef]
- Takaku, Y.; Felicia, L.; Ohnuma, I.; Kainuma, R.; Ishida, K. Interfacial Reaction Between Cu Substrates and Zn-Al Base High-Temperature Pb-Free Solders. J. Electron. Mater. 2008, 37, 314–323. [Google Scholar] [CrossRef]
- Xing, F.; Yao, J.; Liang, J.; Qiu, X. Influence of intermetallic growth on the mechanical properties of Zn–Sn–Cu–Bi/Cu solder joints. J. Alloys Compd. 2015, 649, 1053–1059. [Google Scholar] [CrossRef]
- Okamoto, H.; Massalski, T.B. Binary Alloy Phase Diagrams; ASM International: Materials Park, OH, USA, 1990. [Google Scholar]


| Sample | Charge (wt. %) | ICP-AES (wt. %) | ||||
|---|---|---|---|---|---|---|
| Zn | Al | Cu | Zn | Al | Cu | |
| Zn5Al1Cu | 94 | 5 | 0.1 | 93.9 ± 0.6 | 4.71 ± 0.3 | 1.1 ± 0.2 |
| Zn5Al2Cu | 93 | 5 | 0.2 | 93.1 ± 0.6 | 4.82 ± 0.4 | 2.01 ± 0.3 |
| Zn5Al3Cu | 92 | 5 | 0.3 | 92.3 ± 0.7 | 4.65 ± 0.4 | 3.08 ± 0.2 |
| Ultrasound power | 400 | (W) |
| Working frequency | 40 | (kHz) |
| Amplitude | 2 | (μm) |
| Soldering temperature | 410 | (°C) |
| Time of ultrasound activation | 5 | (s) |
| Solder | Solidus (°C) | Liquidus (°C) |
|---|---|---|
| Zn5Al1Cu | 377.7 | 383.9 |
| Zn5Al2Cu | 371.8 | 386.1 |
| Zn5Al3Cu | 370.2 | 386.7 |
Publisher’s Note: MDPI stays neutral with regard to jurisdictional claims in published maps and institutional affiliations. |
© 2020 by the authors. Licensee MDPI, Basel, Switzerland. This article is an open access article distributed under the terms and conditions of the Creative Commons Attribution (CC BY) license (http://creativecommons.org/licenses/by/4.0/).
Share and Cite
Kolenak, R.; Kostolny, I.; Drapala, J.; Babincova, P.; Sahul, M. Characterizing the Soldering Alloy Type Zn–Al–Cu and Study of Ultrasonic Soldering of Al7075/Cu Combination. Metals 2021, 11, 27. https://doi.org/10.3390/met11010027
Kolenak R, Kostolny I, Drapala J, Babincova P, Sahul M. Characterizing the Soldering Alloy Type Zn–Al–Cu and Study of Ultrasonic Soldering of Al7075/Cu Combination. Metals. 2021; 11(1):27. https://doi.org/10.3390/met11010027
Chicago/Turabian StyleKolenak, Roman, Igor Kostolny, Jaromir Drapala, Paulina Babincova, and Martin Sahul. 2021. "Characterizing the Soldering Alloy Type Zn–Al–Cu and Study of Ultrasonic Soldering of Al7075/Cu Combination" Metals 11, no. 1: 27. https://doi.org/10.3390/met11010027