Article

Influence of Addition of Al and Ti Solutes and Variable Processing Conditions on Mechanical and Electrical Properties of Cu-Cr Alloys

Shape Manufacturing R&D Department, Korea Institute of Industrial Technology, Incheon 21999, Korea
*
Author to whom correspondence should be addressed.
Metals 2021, 11(1), 39; https://doi.org/10.3390/met11010039
Submission received: 4 December 2020 / Revised: 18 December 2020 / Accepted: 23 December 2020 / Published: 26 December 2020

Abstract

:
To apply the electric component with high efficiency, the softening problem of material should be improved. Cu-Cr alloys are recognized to be proper materials to be applied. However, the softening problem has not been solved yet. In this study, the effect of Ti and Al on mechanical property and electrical conductivity in Cu-Cr alloy was investigated. Cr content is designed to up to 0.25 wt.% in order to be expected to improve electrical conductivity. During fabrication processing, microstructure identification, Cr concentration, lattice parameter, and micro-hardness in copper matrix were measured. Then, aging condition was investigated. Resistance about over-aging is increased compared to Cu-Cr and Cu-Cr-Al alloy added to Ti. The hardness and electrical conductivity are discussed by the working conditions and heat treatment, such as rolling, solid-solution treatment, and aging process, which improve the formability also at the optimum condition. Moreover, the role of Ti contents is studied. In the Cu-Cr alloys, the addition of both Al and Ti contents keeps the hardness from being reduced. As a result, the precipitation of Cr particles and the obstacle by Al and Ti contents to be softened are observed in this study.

1. Introduction

In the electric industries, to apply the electrical parts of electrical appliance and vehicle, which are improving performance, such as electrical power transmission and electrical conductor, both high strength and good electrical conductivity should be achieved [1,2,3,4,5,6,7,8]. The certain required properties can be obtained by controlling the chemical composition in alloys [9,10]. Although there are requirements of electrical industry, these electrical and mechanical properties cannot be achieved generally. If the mechanical strength increases, the electrical conductivity decreases, such as trade-off relationship. Therefore, many researchers have studied to improve both strength and electrical conductivity widely [1,2,3,4,5,6,7,8].
To solve or minimize the problem of trade-off relationship of material, Cu alloys have been used and studied widely, for its high electrical conductivity. Figure 1 shows the variation of Cu alloys by their electrical and mechanical properties. In general, the pure Cu has high electrical conductivity, but low strength and bad resistance of softening at heating condition. Therefore, the Cu-Cr based alloys are recognized as the key to solve the problem. These alloys are widely used to high current connectors and integrated circuit lead frames, because of their outstanding mechanical and electrical properties [11,12,13,14,15]. The Cu-Cr alloys have high strength, because of the precipitation hardening effect [11,12,13,14,15], so the aging time and temperature are important factors to control precipitation. Moreover, the addition of other chemical composition can control the size and fraction of precipitation [16], such as Mg content. The addition of other chemical composition, to improve the softening resistance, is spotlighted. Likewise, controlling the chemical composition of Cu-Cr alloys by addition of other composition can be useful to improve its mechanical and electrical properties.
Cu-Cr alloys exhibit precipitation hardening response, because the supersaturated Cr in the Cu-matrix creates a high degree of thermodynamic meta-stability. As a result, high strength is obtained by the distribution of nano-sized Cr precipitates in the Cu-matrix. In addition, their electrical conductivities are similar level with pure copper due to the low concentration of Cr in Cu matrix after aging [17]. Severe working environments such as downsizing and thinning are needed to couple high strength with high electrical conductivity. In order to obtain improved properties, there are a lot of investigations on the effects of alloying elements such as Fe, P, Zr, etc. However, Cu-Cr alloy containing Fe shows a small age hardening response compared to Cu-Cr alloy. Additionally, it is reported that P addition retards the growth of precipitates. Additionally, Zr attribute to low stacking fault energy and to improve softening resistance. However, mechanical property and electrical conductivity is similar to Cu-Cr alloy [18,19]. It is reported that Al and Ti can attribute to reducing the concentration of Cr in Cu matrix [20]. Additionally, it is expected to form Al3Ti phase in these quaternary alloy systems. Additionally, while P.C. Zhang’s report is studied only about effect of Ti except to Al, addition of Al and Ti can be expected to improve mechanical properties [21,22]. In this study, the effect of Ti and Al on mechanical property and electrical conductivity in Cu-Cr alloy were investigated. Especially, Cr content is designed to up to 0.25 wt.%, which is lower than previous reported Cr content in order to be expected to improve electrical conductivity.

2. Materials and Methods

For this study, the experimental alloys with the compositions as shown in Table 1 were cast as 59 × 32 × 190 mm3 plate structure with iron mold in a vacuum induction furnace (Ar atmosphere + degree of vacuum: 7.5 × 10⁻²). The cast alloy is scalped, solid solution treated at 1000 ℃ for 6 h in a NaCl salt bath to prevent oxidation and quickly quenched into water. They were cold-rolled to 80% reduction ratio in thickness. Cold-rolled strips were aged at 420, 450 and 480 ℃ for 1, 3 and 5 h in NaNO3 salt bath and then carried out final cold-rolled to a 99.5% reduction. Analysis and evaluations were performed with FactSage program (ThermFact Inc. & GTT-Technologies, Montreal, Canada), Spectrometer (Agilent, Santa Clara, CA, USA), SEM/EDS, XRD, Electron probe micro-analyzer (EPMA, AMETEK, Berwyn, PA, USA), Hardness, Electrical conductivity. Microstructure identification of as-cast and solid solution treated specimens were observed by SEM/EDS (Quanta 200F FE-SEM, FEI, Hillsboro, OR, USA). Lattice parameter is measured by X-Ray Diffraction (D8 Discover, Bruker, Billerica, MA, USA). Measure condition is 20°~90° (2θ angle), 0.06°/s (scan speed) and 1.5406λ (wavelength). The mechanical properties for solid solution and aging treatment were evaluated by hardness test (FM–7E, FUTURE-TECH CORP., Kanagawa, Japan). Micro-hardness in matrix condition is 10 gf, 5 s, and hardness condition is 100 gf, 10 s. Electrical properties were measured by SMP-10 equipment (Fisher Scientific, Schwerte, Germany) after calibration with a pure Cu sample. Specimen for microstructure is polished by sandpaper (#100, #600, #1000, #2000, #2400 grade), 1 µm diamond suspension and 0.05 µm Silica suspension and etched by solution (FeCl3 5 g + HCl 20 mL + H2O 100 mL). The other specimen is polished by SiC paper (#100, #600, #1000, #2000, #2400 grade). Cr concentration using EPMA (SX-100, AMETEK, Berwyn, PA, USA) is conducted on 15 kV, 60 nA, and peak analysis is conducted on 7 points in 2 grains and averaged.

3. Results and Discussions

Experimental Results and Discussions

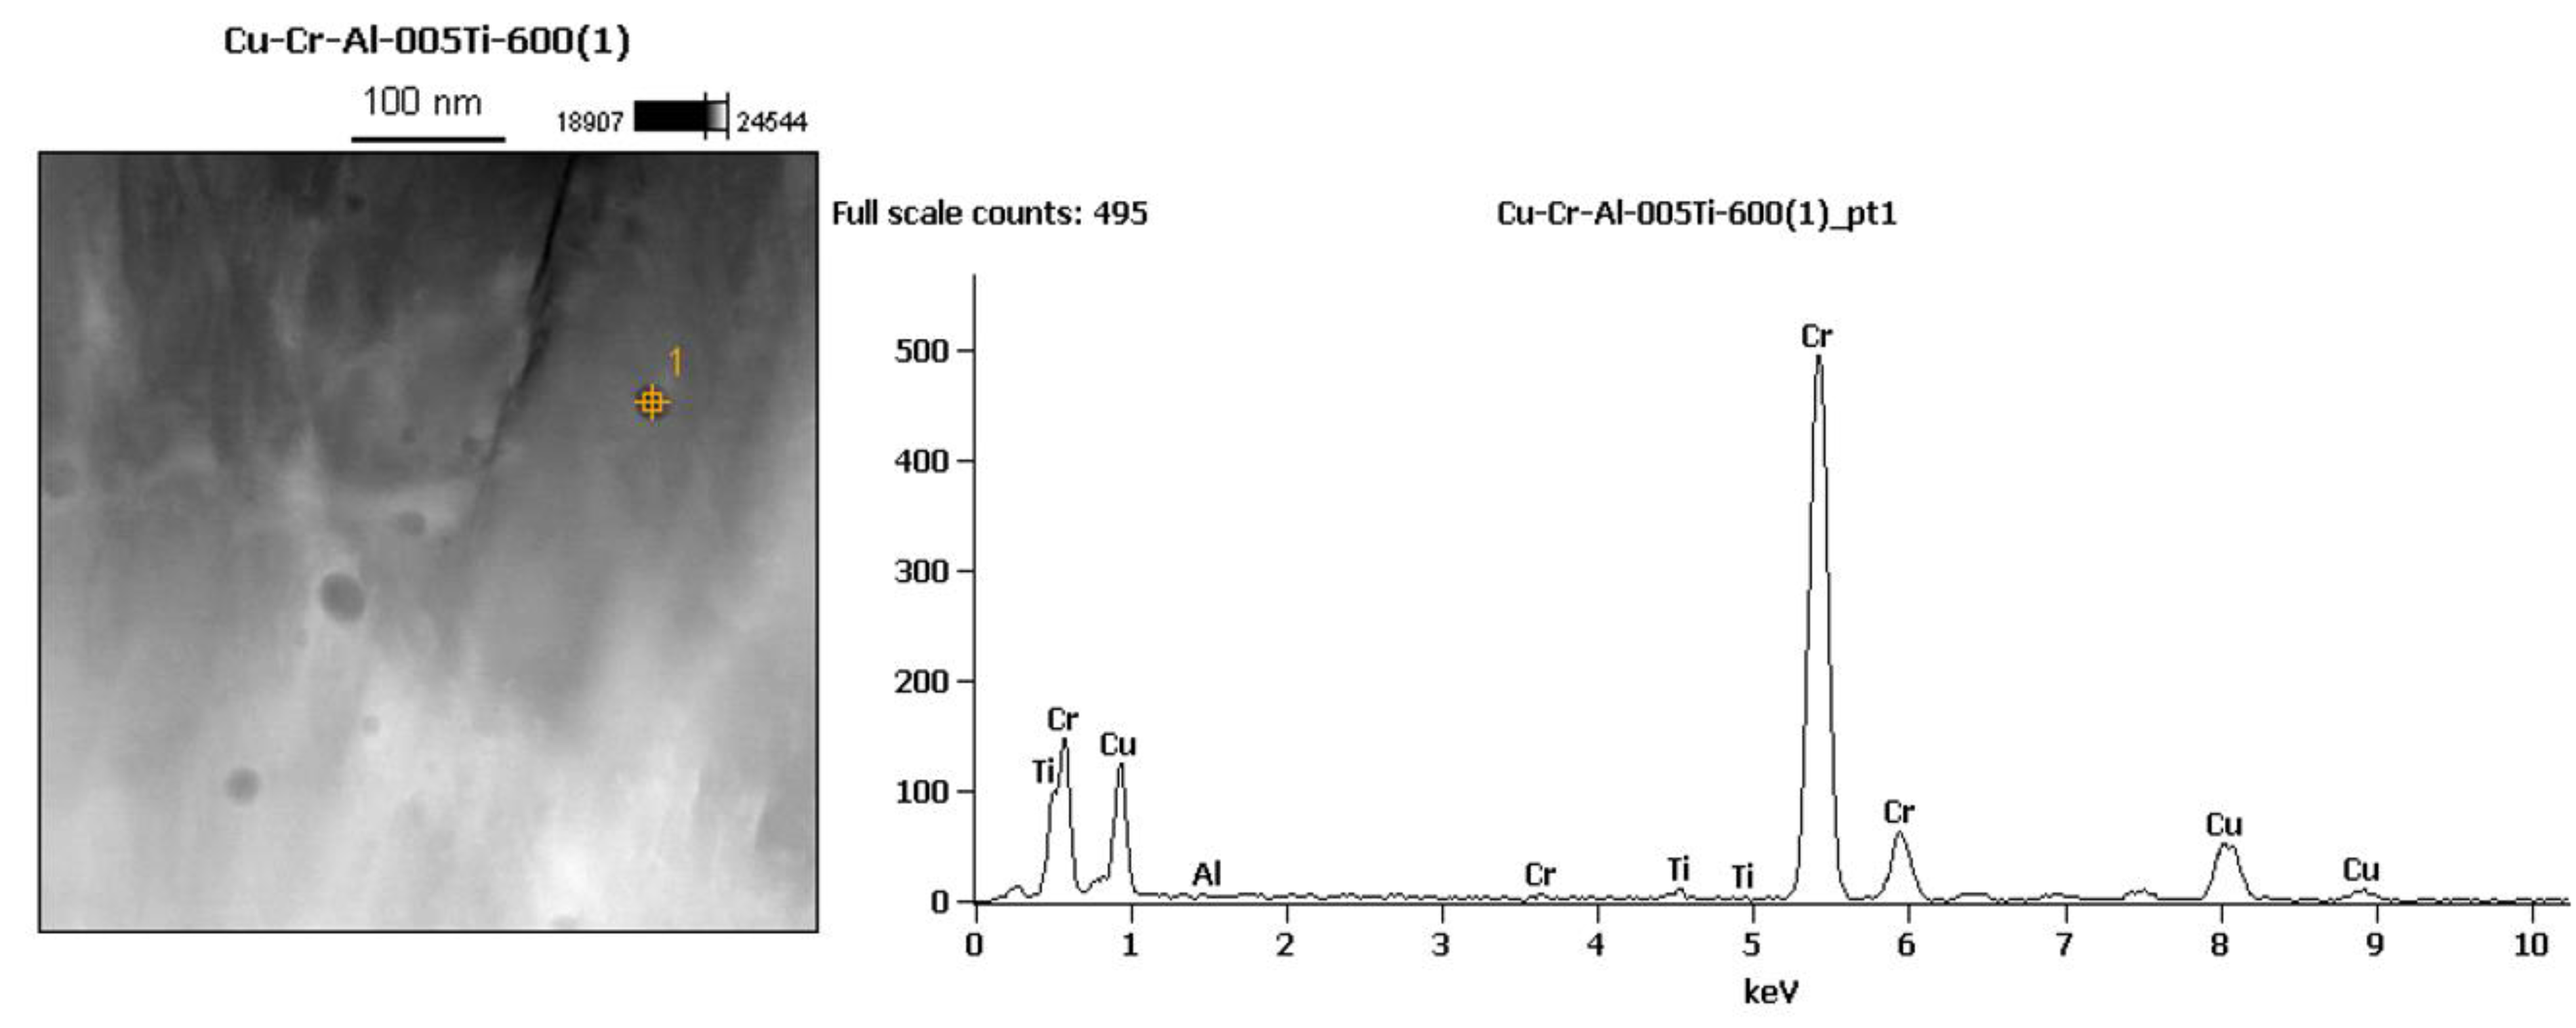
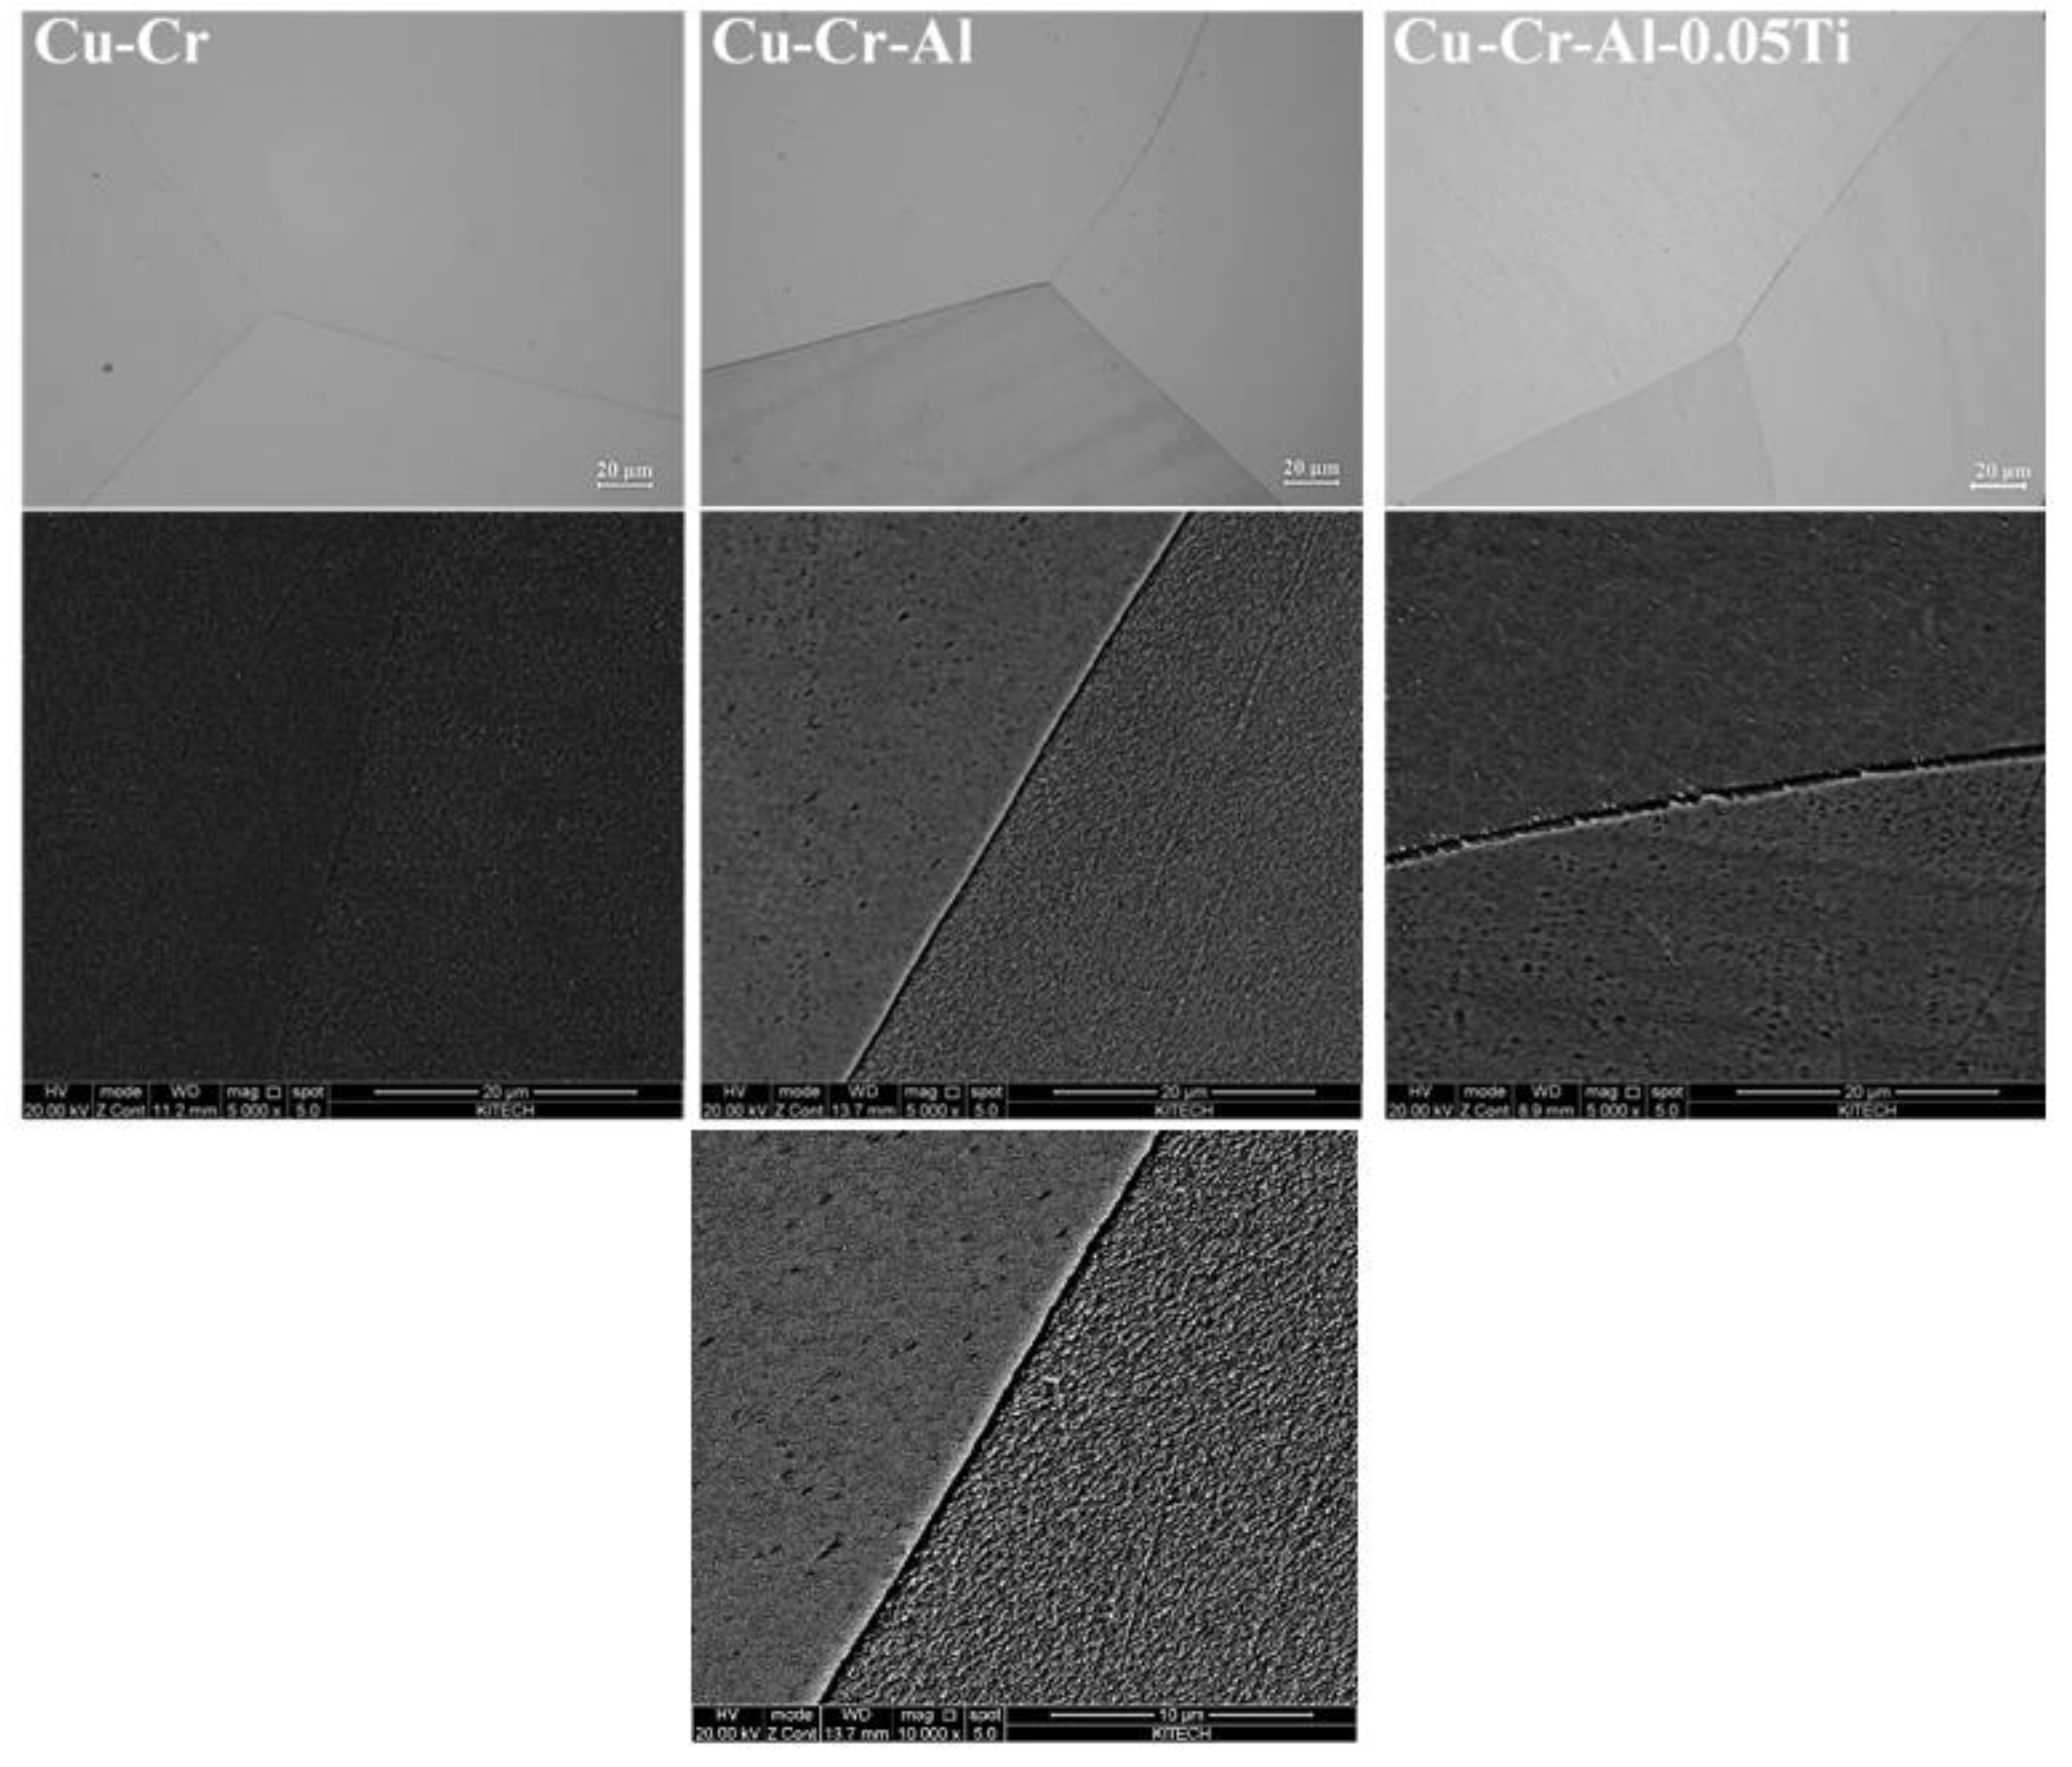
Figure 2 shows the microstructures of Cu-Cr and Cu-Cr-x alloys, which were cast in this study. The dependence of alloying components about microstructure, such as the addition of Ti or Al, is not observed. However, the Cr particles are identified by SEM/EDS result. These particles are distributed to grain boundary. Moreover, the size of particles is less than 1 μm. The shape of particles is formed spherically, but not uniformly. The EDS result of Cr particle is examined by TEM analysis in Figure 3. The Cr solubility in Cu matrix decreases with temperature. Therefore, it seems that the excessive Cr atoms are precipitated from Cu matrix. The Cr-rich particles are formed, due to relative slow cooling rate during solidification. However, the solid solution treatment affected the microstructure and formed Cr particles of Cu-Cr alloys. This effect is shown as Figure 4. The solid solution treatment affects grain size higher. Moreover, the size and distribution of Cr particles change. Comparing with Figure 2 and Figure 4, the contrast decreases. In other words, the distribution of particles decreases. It seems that the Cr particles are solutionized in Cu matrix.
To observe the effect of solid solution treatment for mechanical and electrical properties of Cu-Cr alloys, the micro-hardness and electrical conductivity of alloys, which are cast and solid solution treated, are shown as Figure 5. At the as-cast state, the Cr particles are detected (Figure 2), so micro-hardness, lattice parameter and electrical conductivity are affected by the behavior of Cr particles. The precipitated Cr particles obtain the strength and hardness of material higher, following the precipitation hardening effect, in general [23]. At the as-cast state, because of the Cr particles and their distribution, the hardness is high, and the electrical conductivity is high. The hardness was detected by Rockwell hardness. At this state, the micro-hardness is low, and the lattice parameter is low. However, after solid solution treatment, the tendency becomes reversed. The solutionized Cr particles affect the increase in the lattice parameter, so that the stress field by precipitation decreases, but the stress field by solid atoms increases. Moreover, in case of Rockwell hardness, the decrease in hardness in solid solution treatment is seemed to be affected by the high temperature heat treatment and measurement of grain and grain boundary. The measurement of micro-hardness is examined at the grain and matrix, not particle existence. Therefore, the micro-hardness is caused by solutionizing effect more. However, macroscopically, the Rockwell hardness is caused by all microstructure changing effects, such as solutionizing and decrease in precipitation particles. Therefore, the hardness decreases, and electrical conductivity decreases also. As a result, although the locally employed Cr atoms show a solid solution strengthening effect, which is shown the micro-hardness change, overall, the solid solution strengthening effect does not seem to exceed the extinguishing the precipitation strengthening effect. Moreover, the electrical conductivity decreases, not trade-off. After solid solution treatment, the solutionized Cr atoms seems to hinder the electron path.
In this result, the Al and Ti contents reduce the electrical conductivity, but these contents keep the hardness from high decrease. Additionally, other solid solution effect is minimized by the addition of Al and Ti contents. The addition of Al and Ti contents keeps the mechanical properties from being poor, but the solid effect to reduce the electrical conductivity cannot be controlled.
Figure 6 shows the electrical conductivity and lattice parameter and hardness of solid solution treated and cold-rolled Cu-Cr alloys. The cold-rolled specimen with 80% reduction ratio (from 30 to 6 mm) has higher value of hardness, but the lattice parameter and electrical conductivity value remain similar. The electrical conductivity is little lowered than solid solutionized state. It seems that the work hardening effect increases the hardness of the cold-rolled state. The formed dislocations by rolling process strengthen the Cu-Cr alloys. However, the lattice parameter is not affected by formation of dislocations. It seems that the dislocation density is not the main factor to decrease electrical property than Cr particles, which are precipitated. In these Cu-Cr alloys, the Cr particles are the main factor to control the electrical conductivity.
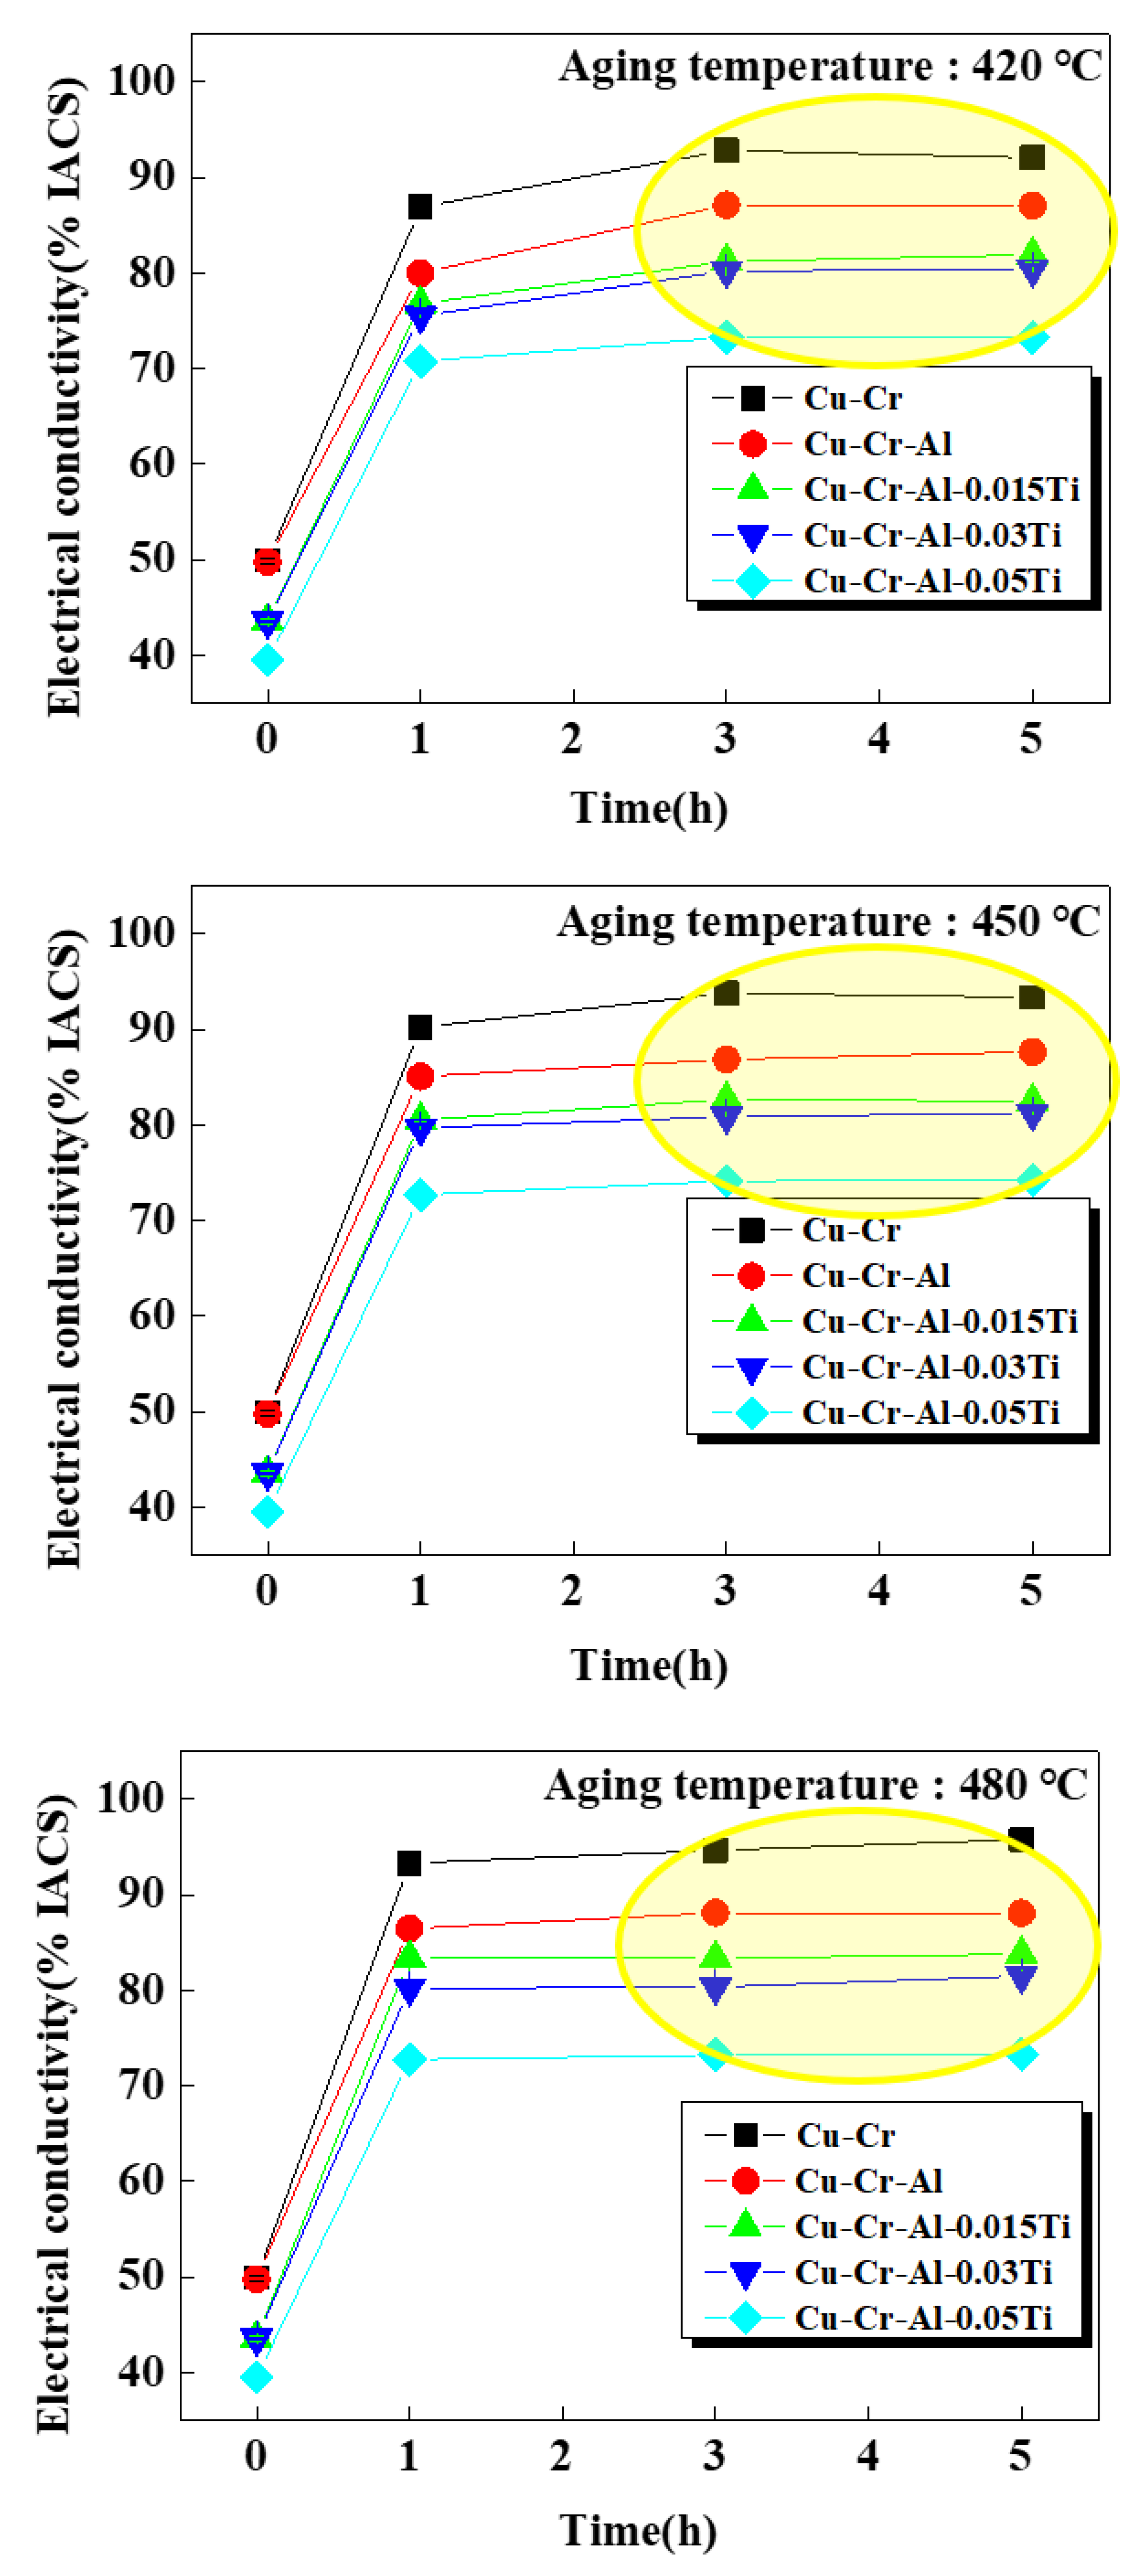
Figure 7 shows the variation of electrical conductivity of Cu-Cr alloys after aging treatment. As the aging time is longer, the electrical conductivity value gets higher, in all Cu-Cr alloys. Moreover, the electrical conductivity increases, as aging temperature increases. Especially, as the aging temperature increases, the time to reach the peak point decreases. However, the hierarchy of each alloys is maintained. The alloy, which has a higher content of alloying component, such as Al and Ti, has a lower value of electrical conductivity value. After 3 h of aging time, the electrical conductivity is maintained to be the highest value. In this result, it can be figured out that the precipitation rate and amount are the main factors to control the electrical conductivity; for the high aging, time and temperature make the electrical conductivity high.
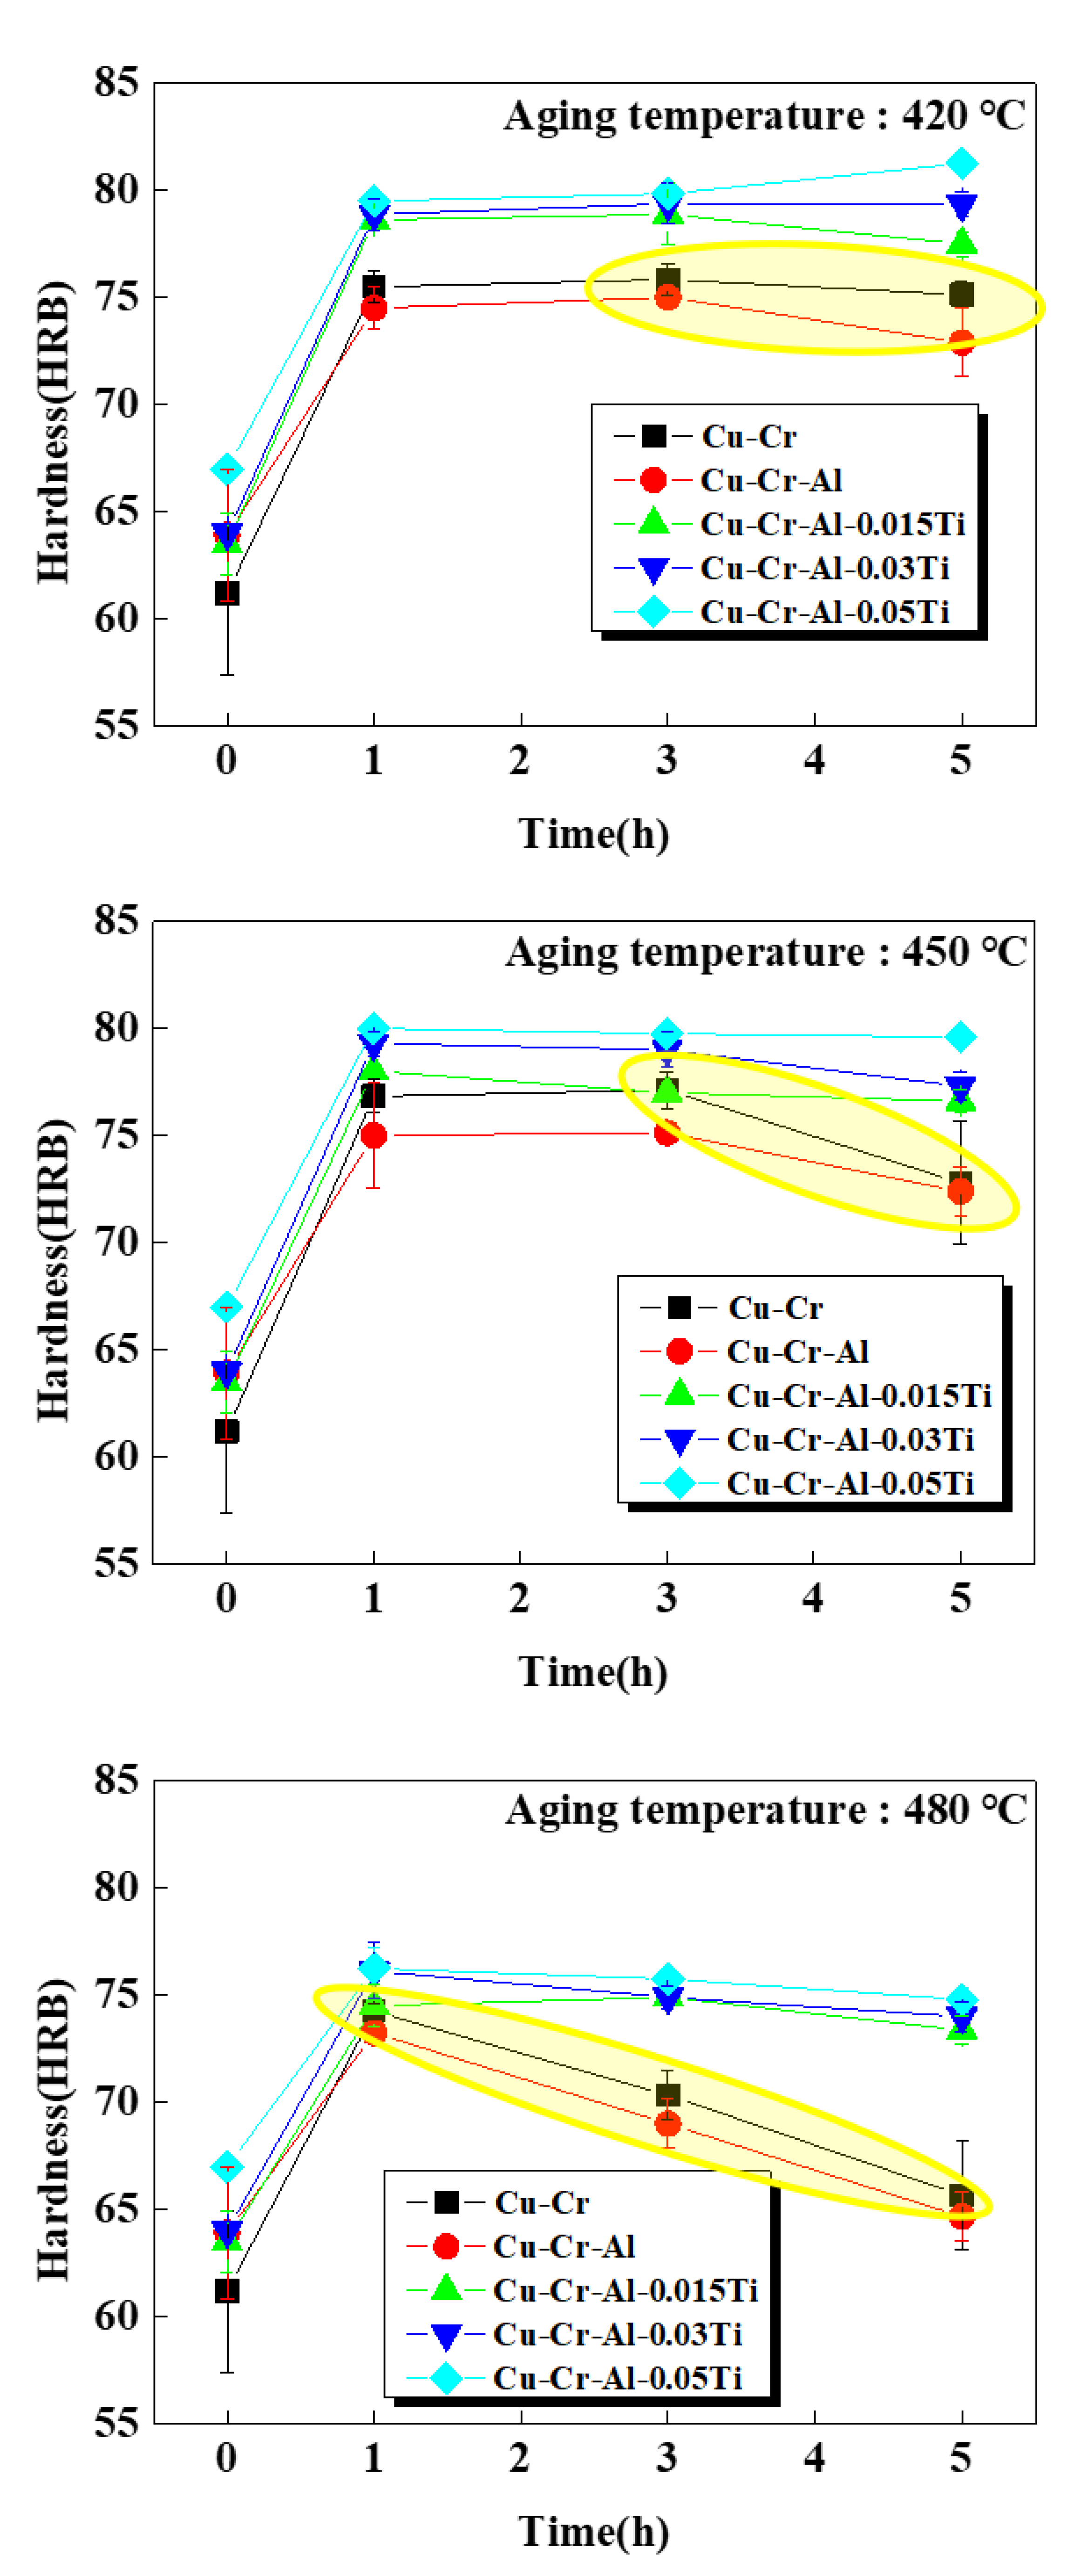
However, the hardness tendency by aging time and temperature is different. Figure 8 shows that the decrease in hardness of Cu-Cr alloys is observed at 480 °C of aging temperature. Furthermore, in Cu-Cr and Cu-Cr-Al alloys, the decreased rate of hardness is sharp at the aging temperature of 480 °C, then the Cu-Cr-Al alloys added the Ti content. It seemed that Cr precipitates are coarsened by over-aging. The decrease amount of hardness value in Cu-Cr-Al-Ti alloys is little; whether the Ti content is small or high. Even at 420 °C of aging temperature, the hardness value of Cu-Cr-Al-0.05Ti increases. As a result, when the results of Figure 7 and Figure 8 are discussed, the Cr precipitates size and amounts improve the electrical conductivity, but the coarsened Cr precipitates reduce the hardness of material, so that the softening effect occurs.
The tendency of the processes of all Cu-Cr alloys, which are investigated in this study, is shown as Figure 9. In this Figure 9, the dramatic increase in hardness is shown, while the first cold-rolling process (80% reduction ratio) is conducted. The work hardening effect is more powerful to make hardness higher than precipitation hardening effect. However, at the viewpoint of electrical conductivity, the precipitation effect is stronger than other effects, such as the solid solution effect and work hardening. Though the electrical conductivity of Cu alloys decreases by solid solution hardening and work hardening effect, the increase in conductivity by precipitation effect is more powerful, and the increment of electrical conductivity value is much larger at the aging treatment. In these alloys, the dislocation formation and its density are main factors to make the hardness high, but the electrical conductivity is highly affected by precipitation proportion and rate. As a result, both of the electrical and mechanical properties can be adopted by controlling the processes, such as rolling and aging condition.
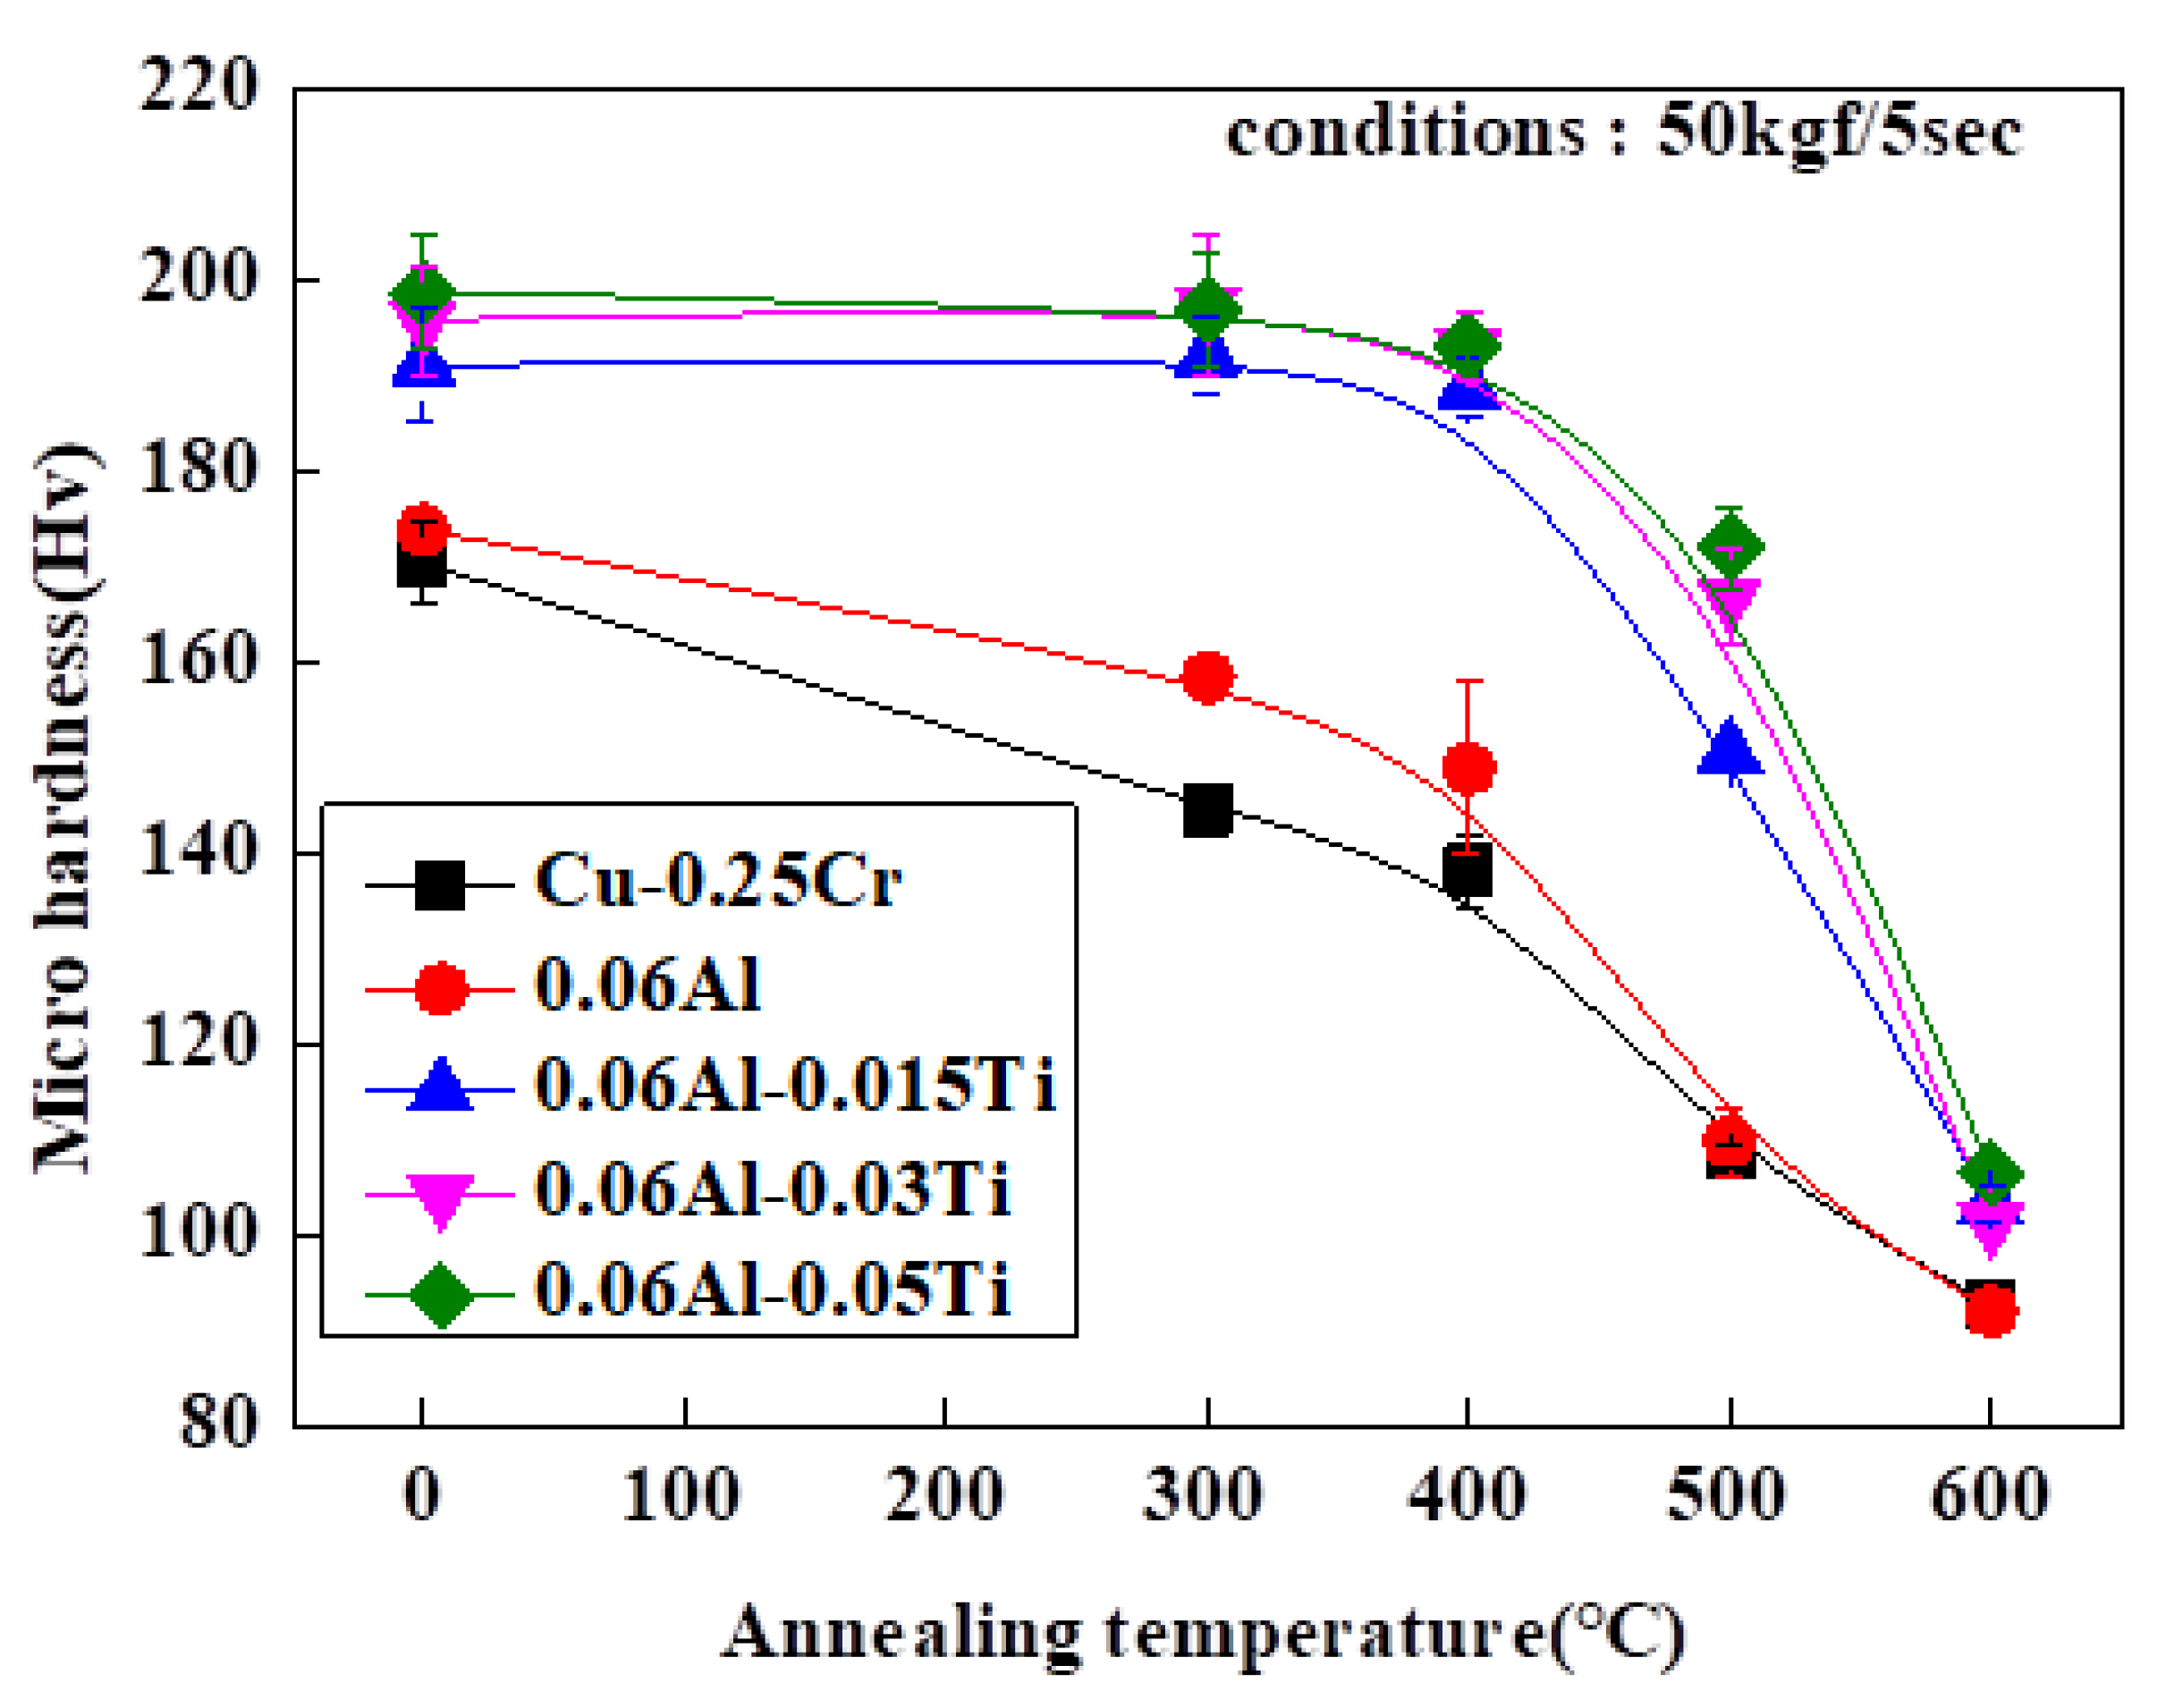
Figure 10 indicates the variation of resistance to softening effect by the alloy’s components. The Cu alloys with higher other alloying components have higher value of micro hardness, in general, because of the solid solution and precipitation hardening effects. However, as the annealing temperature increases at the annealing processes, after second rolling process (99% reduction ratio), the hardness decreases, and softening occurs. The decrease in hardness of Cu-0.25Cr and Cu-0.25Cr-0.06Al alloys occurs linearly. However, the value of hardness of Cu-0.25Cr-0.06Al with Ti contents alloys is maintained to 400 °C of the annealing temperature and decreases from that temperature to 600 °C. In other words, the addition of both Al and Ti contents is important to make the maintenance of hardness at the annealing process (~400 °C).
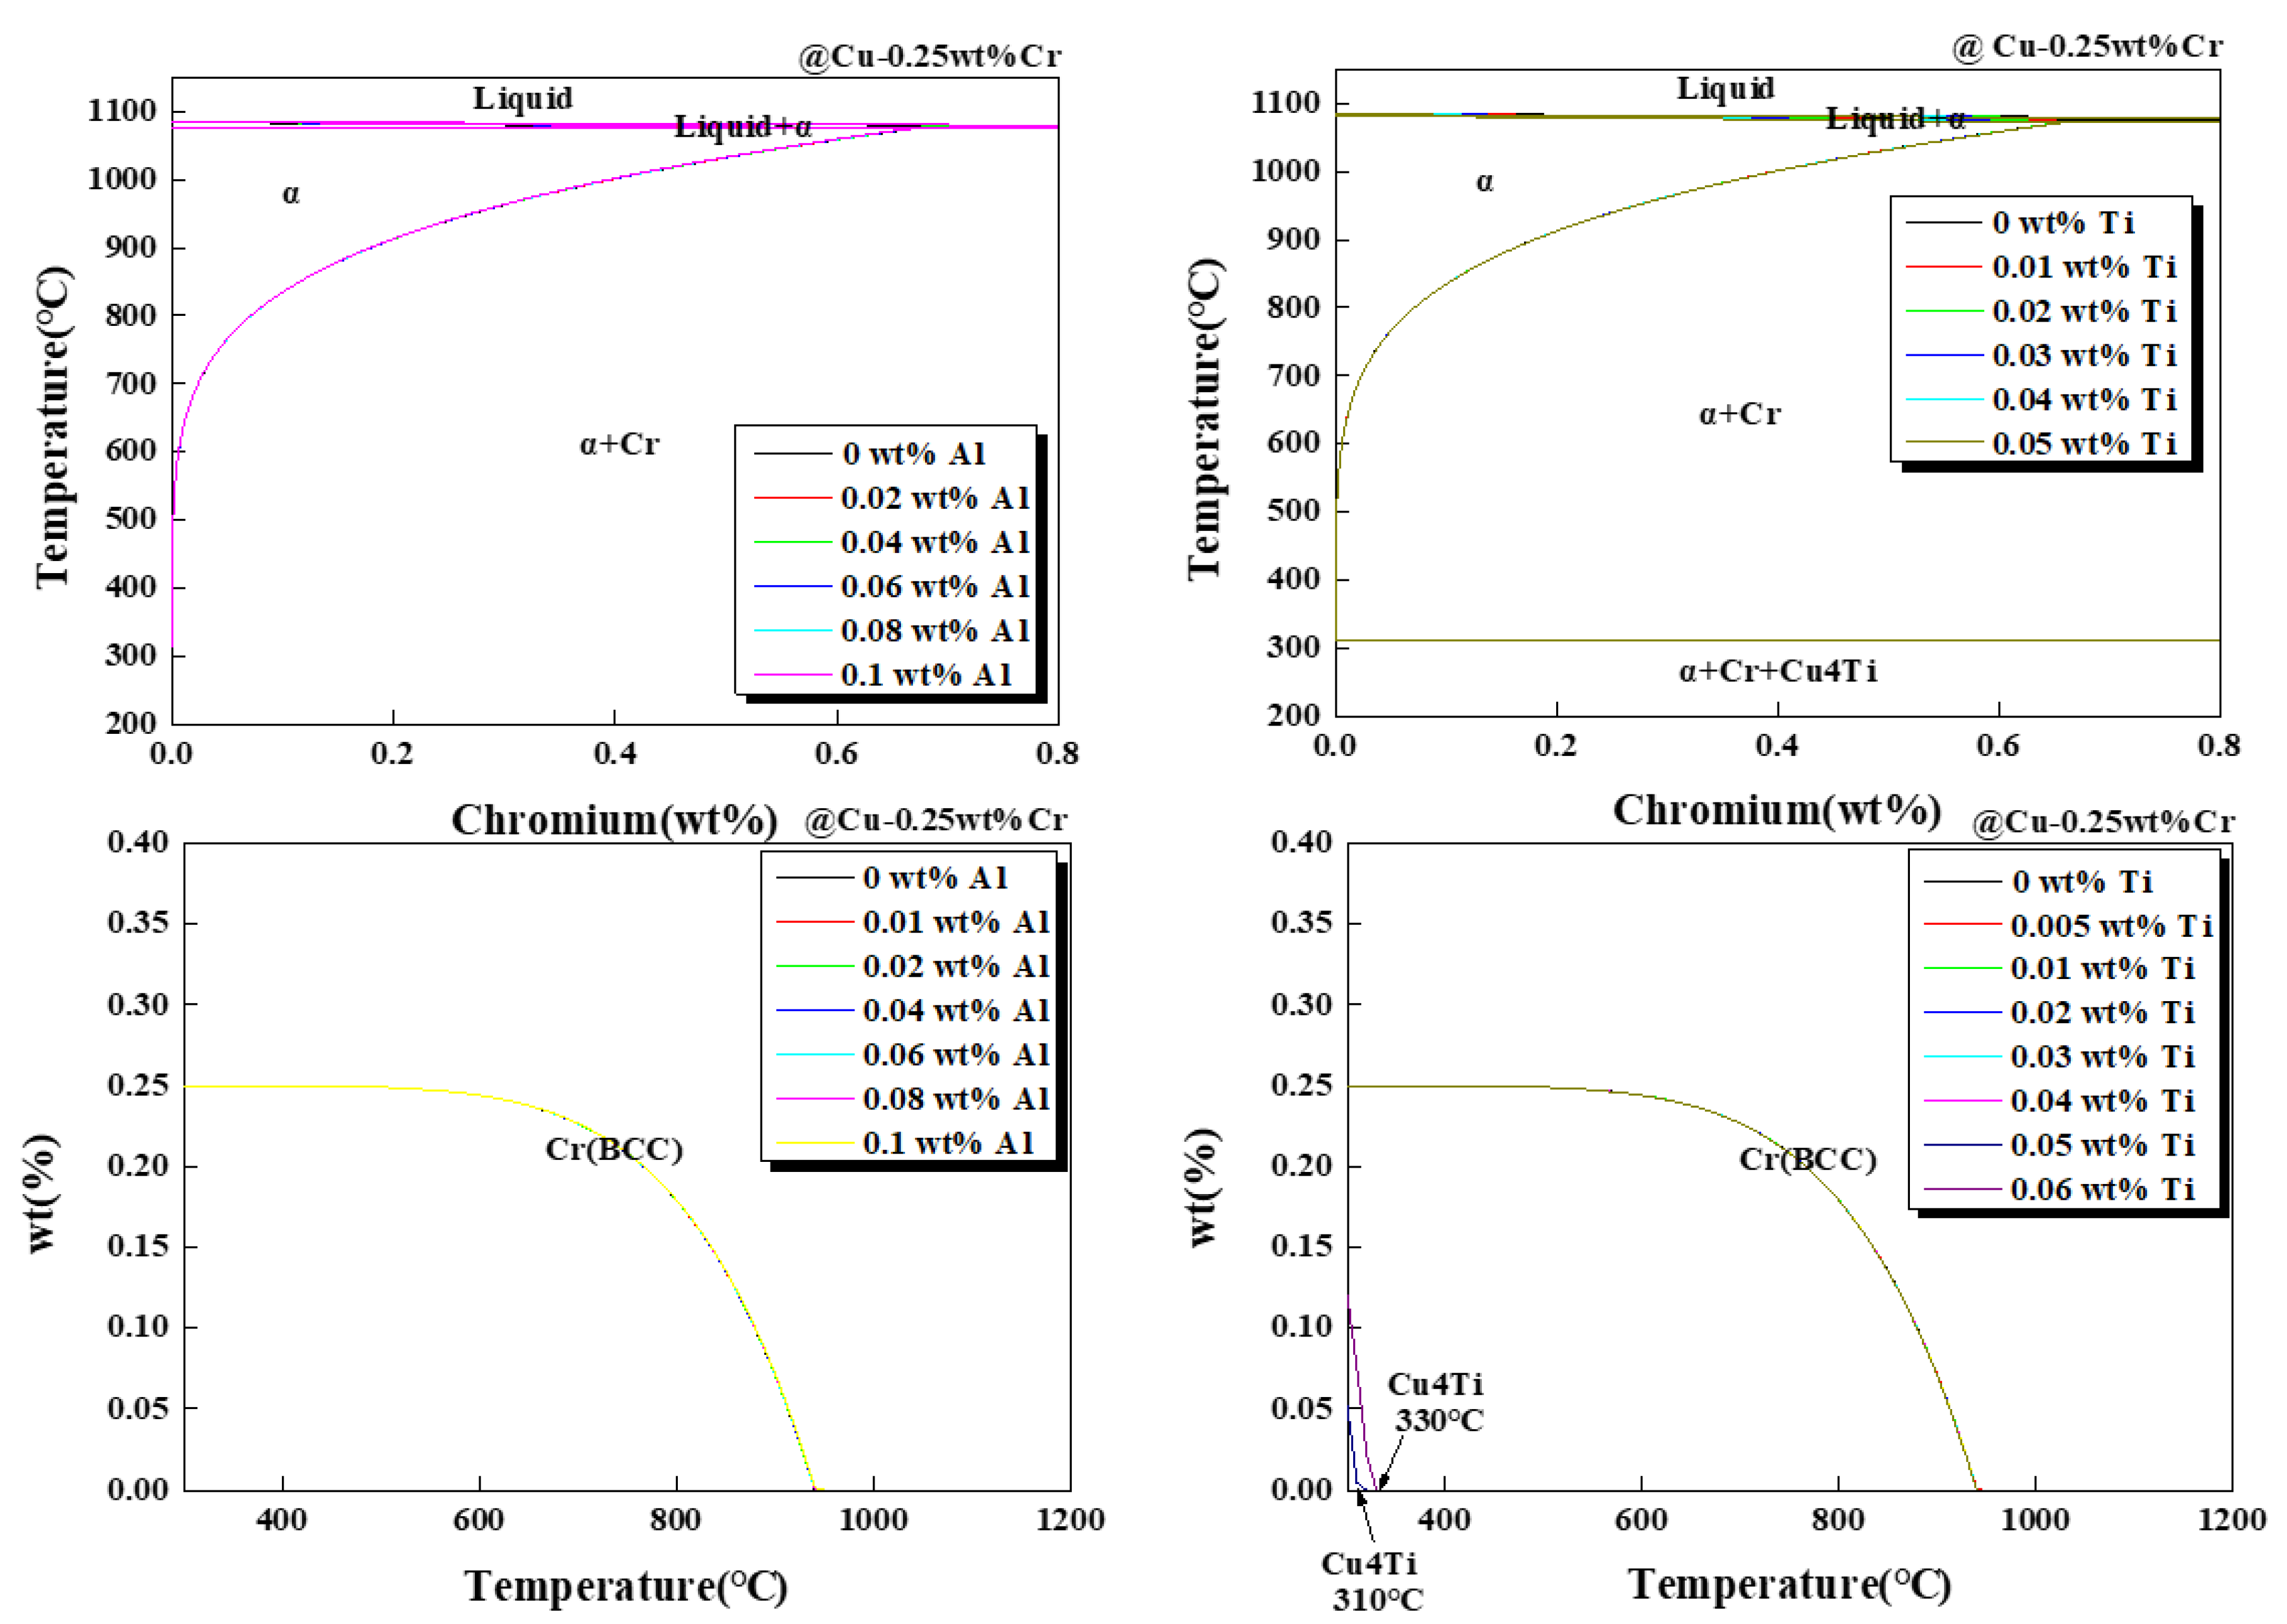
The prediction of solubility and crystallization phase of Cu-Cr alloys by FactSage is expressed as Figure 11. In Figure 11, the change in solvus line is insignificant, depending on the increase in Al and Ti contents. Moreover, the crystallization phase cannot be found, except the formation of Cu4Ti at 310 and 330 °C. These results can help to understand the behavior of alloying elements and improving resistance to softening effect.
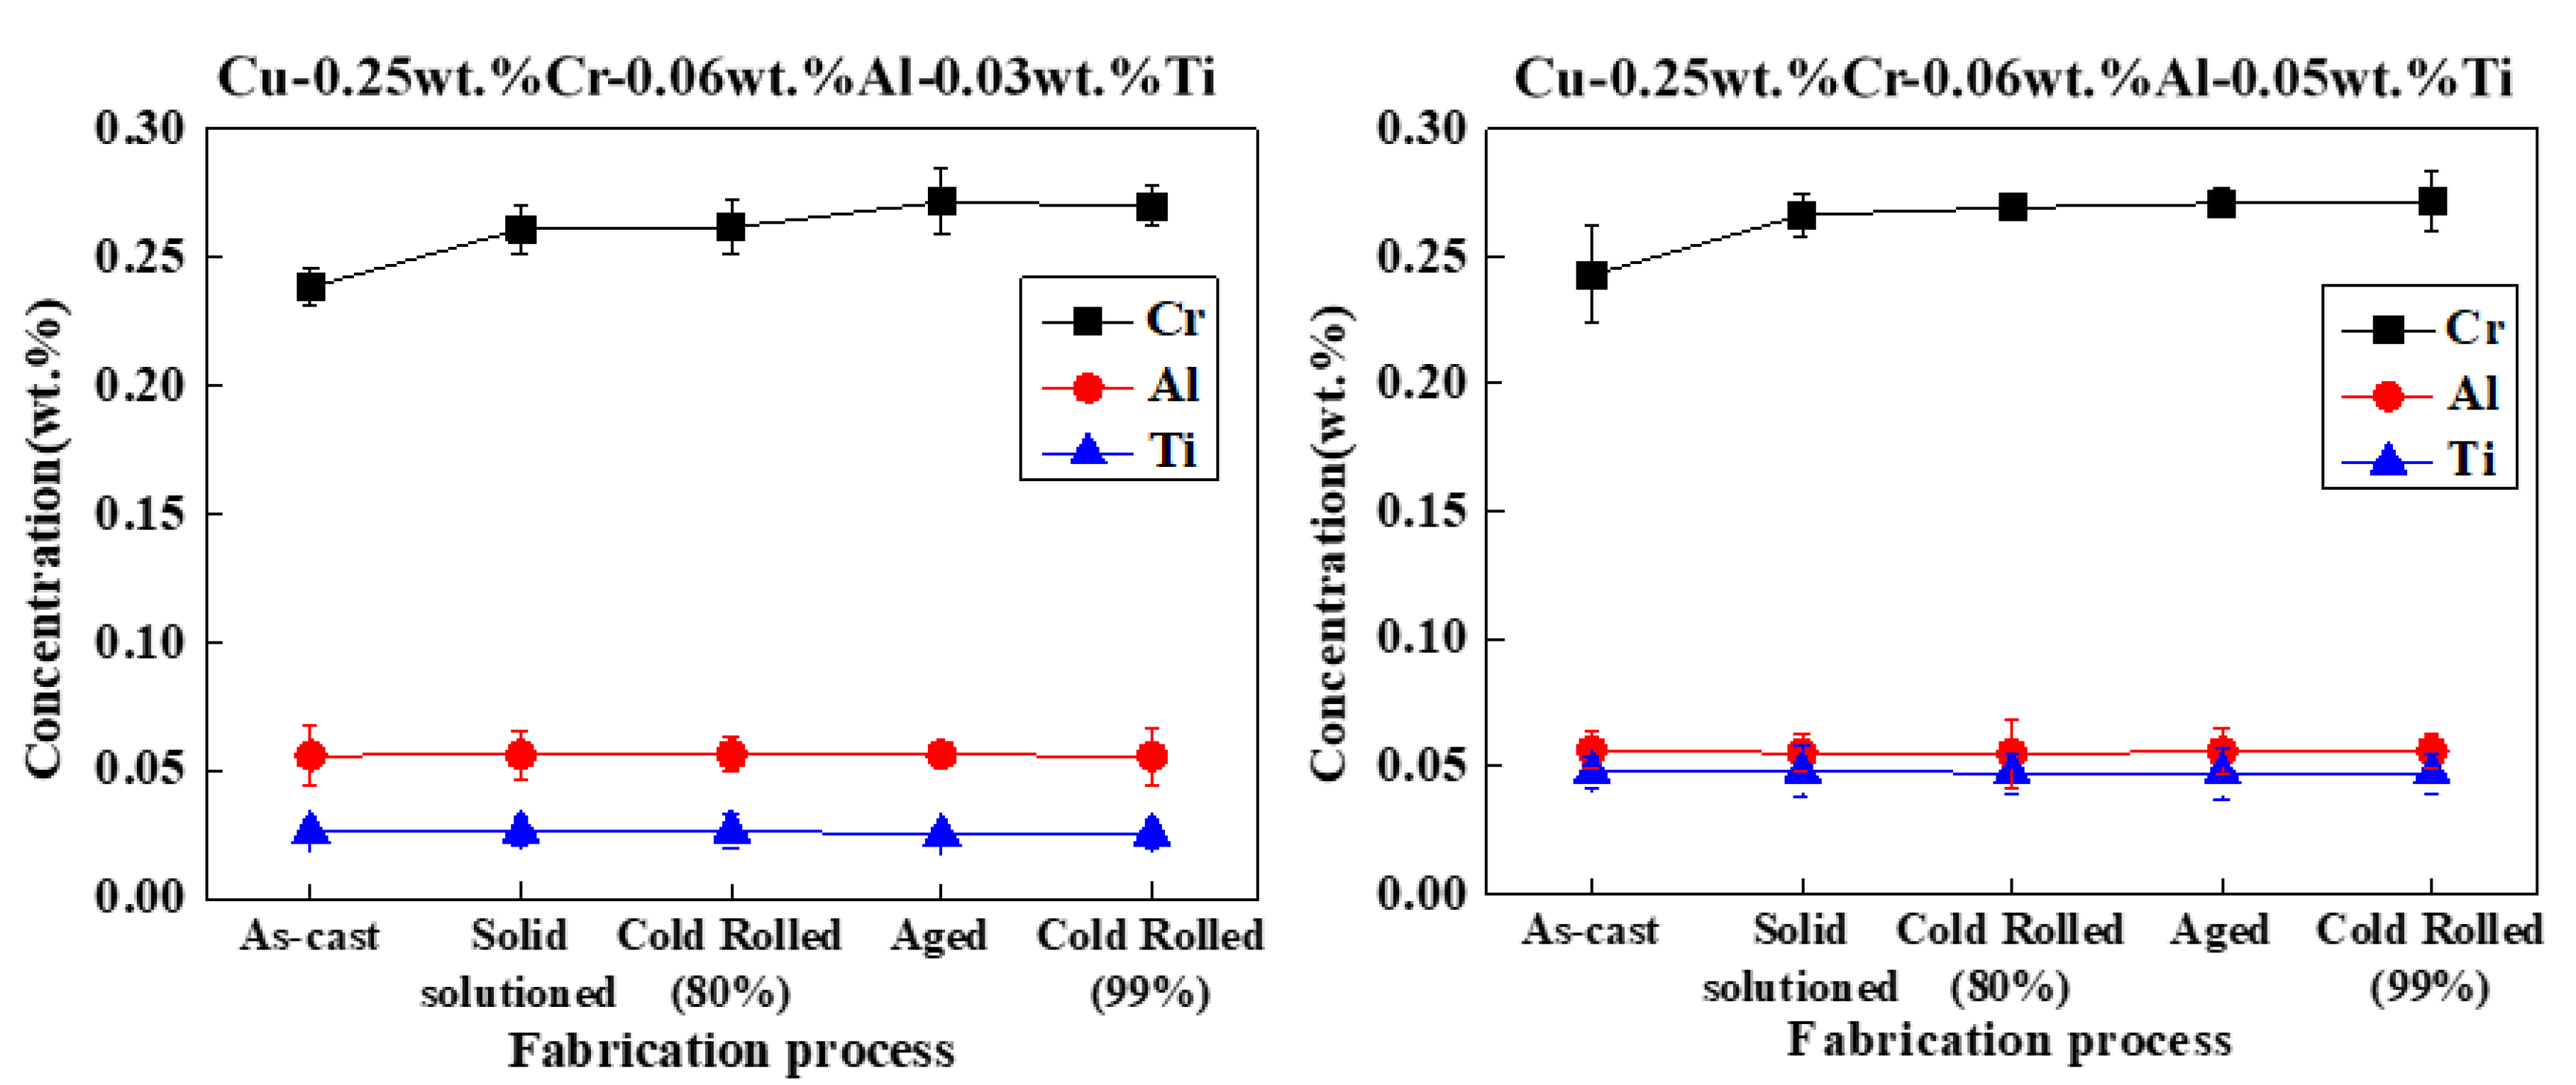
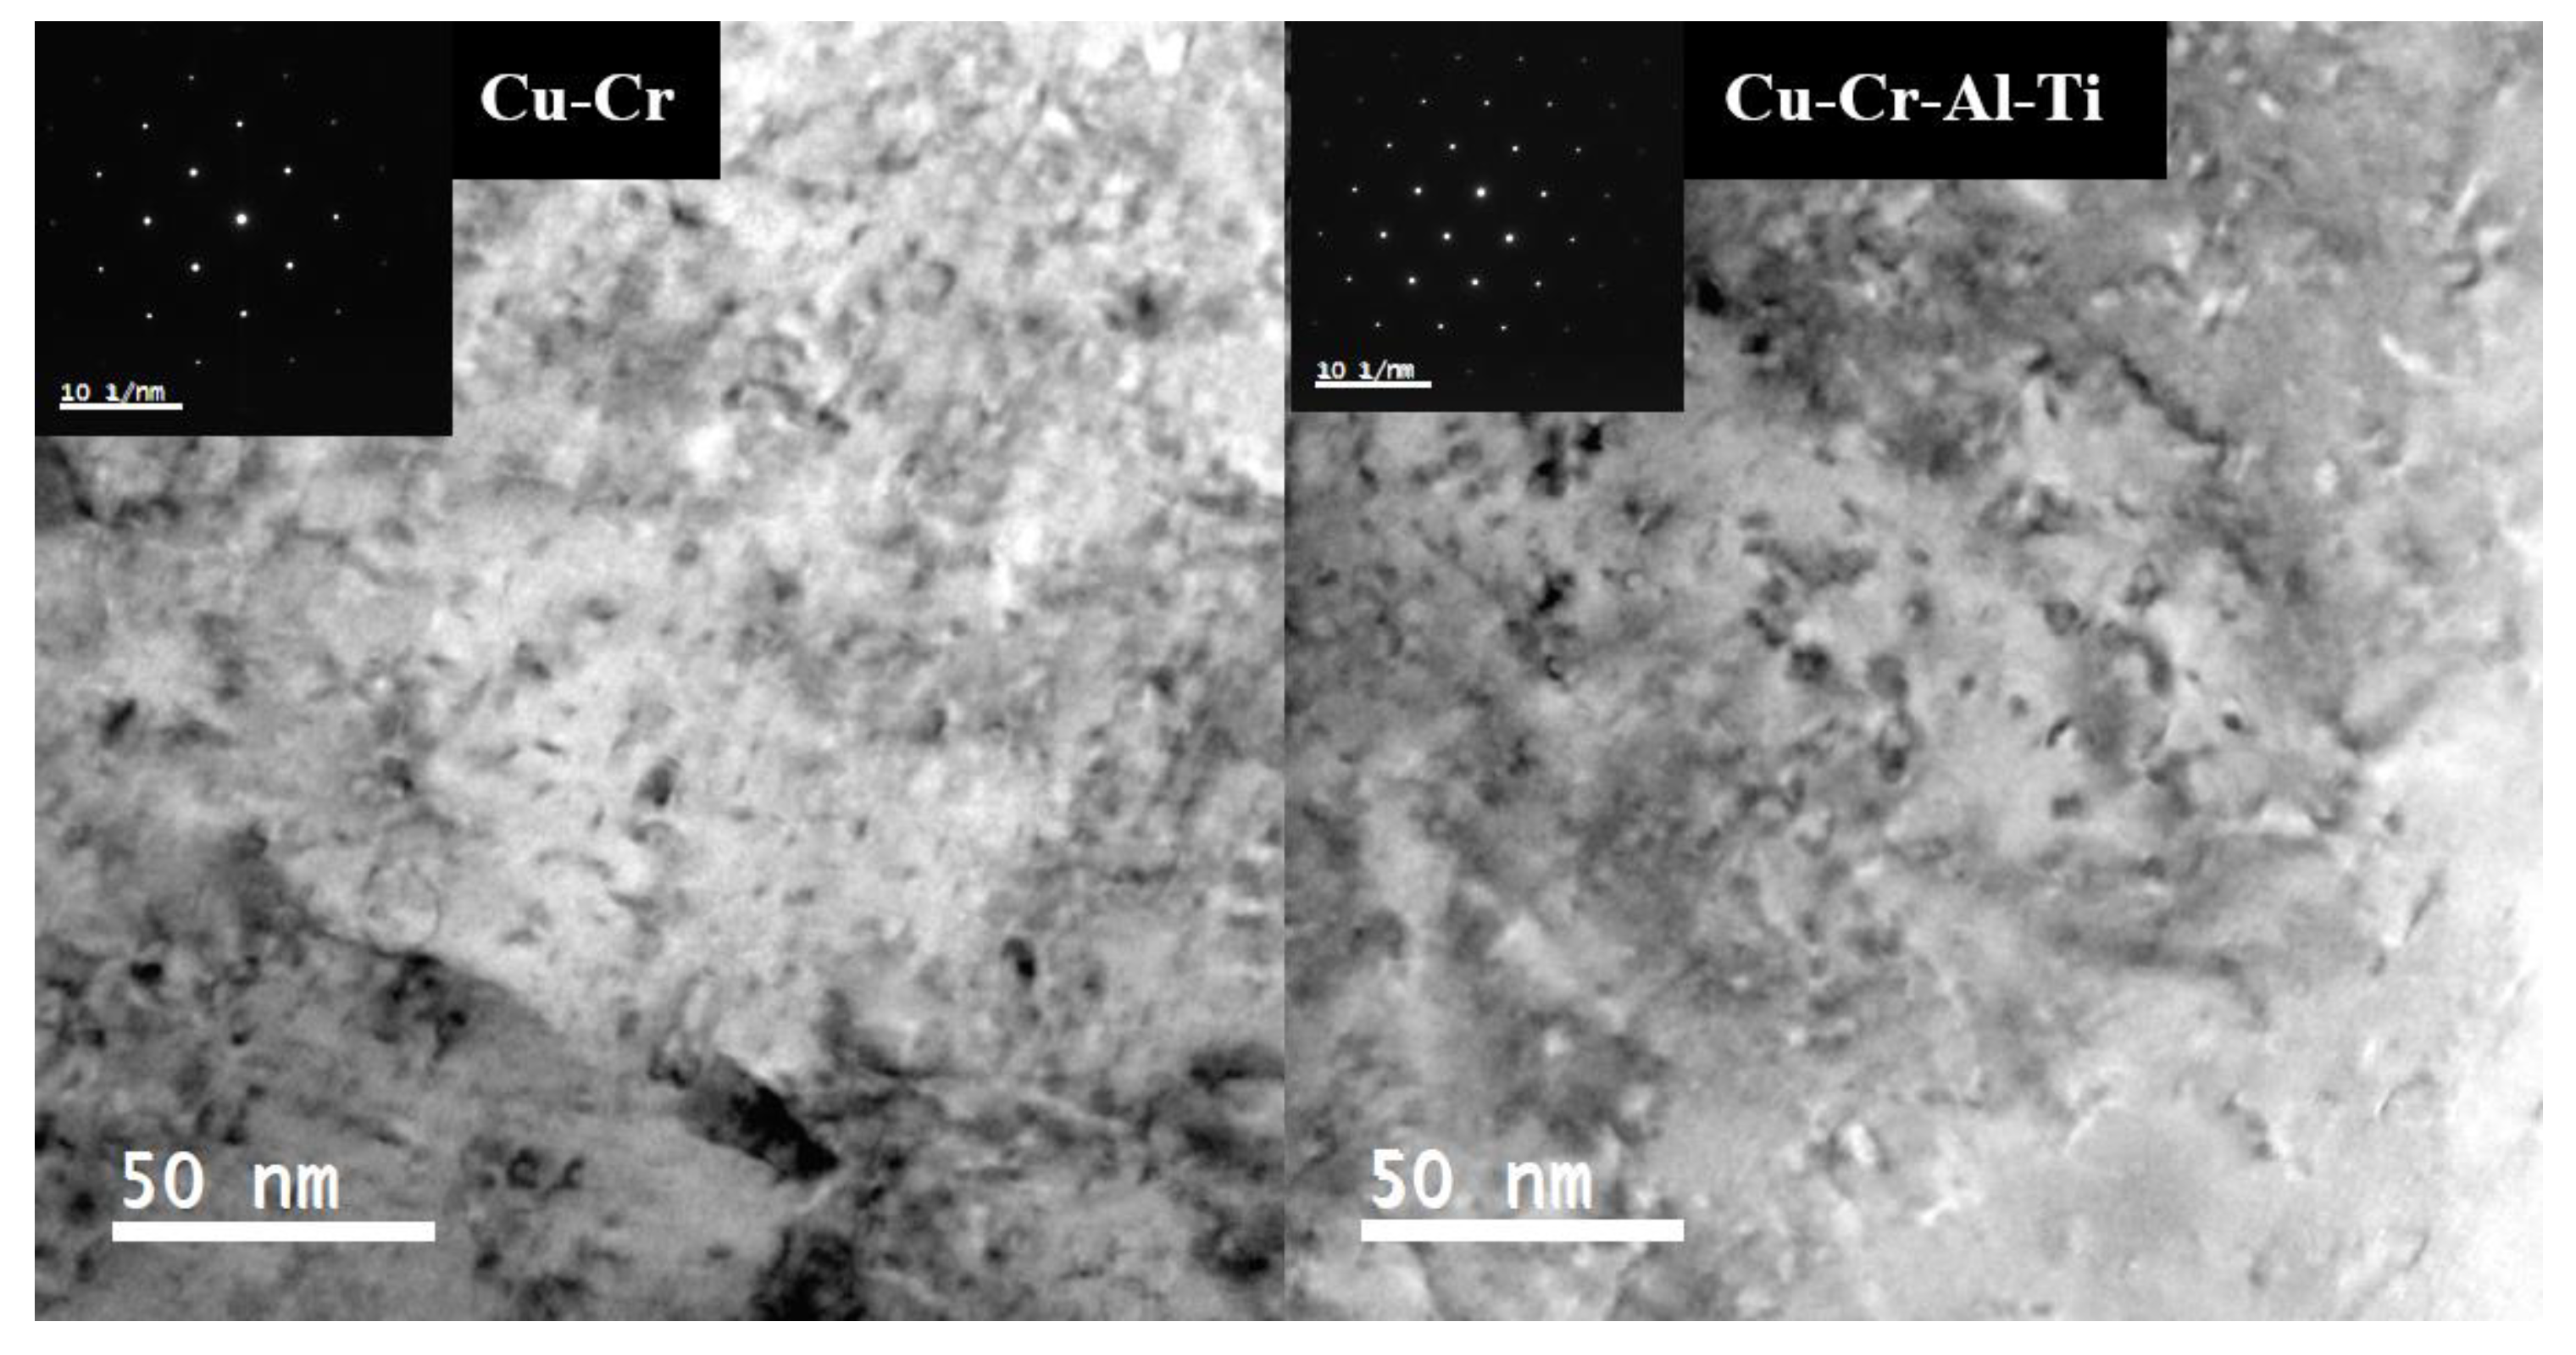
To compare Figure 11, the solute concentration variation in Cu matrix is detected by EPMA analysis (Figure 12). Figure 12 represents the concentration of alloying elements at all processing conditions. In this result, the amount of Al and Ti in matrix does not change in all process. In other words, at all processes, the loss or addition of certain elements is not shown, except the Cr amount increase after solid solution treatment. This tendency does not change, whether the chemical composition changes, such as the Ti contents increase. This result is supported by the FactSage result, which is shown in Figure 11. Figure 13 also supports these results (Figure 11 and Figure 12). In the Cu-Cr-Al-Ti alloys, at the heat treatment, the Cr particle size is examined as 5.24 nm, smaller than 8.41 nm of the Cu-Cr alloy. Moreover, the displacing in the diffraction pattern of Cu-Cr alloy (0.19) is smaller than one (0.21) of the Cu-Cr-Al-Ti alloy. This result indicates that the addition of Al and Ti in Cu-Cr alloy makes the lattice parameter lower. The addition of Al and Ti elements seems to affect the precipitation and release of strain by observing the diffraction pattern changes. In other words, the loss or addition of the Cr amount is the evidence of the precipitation amount.
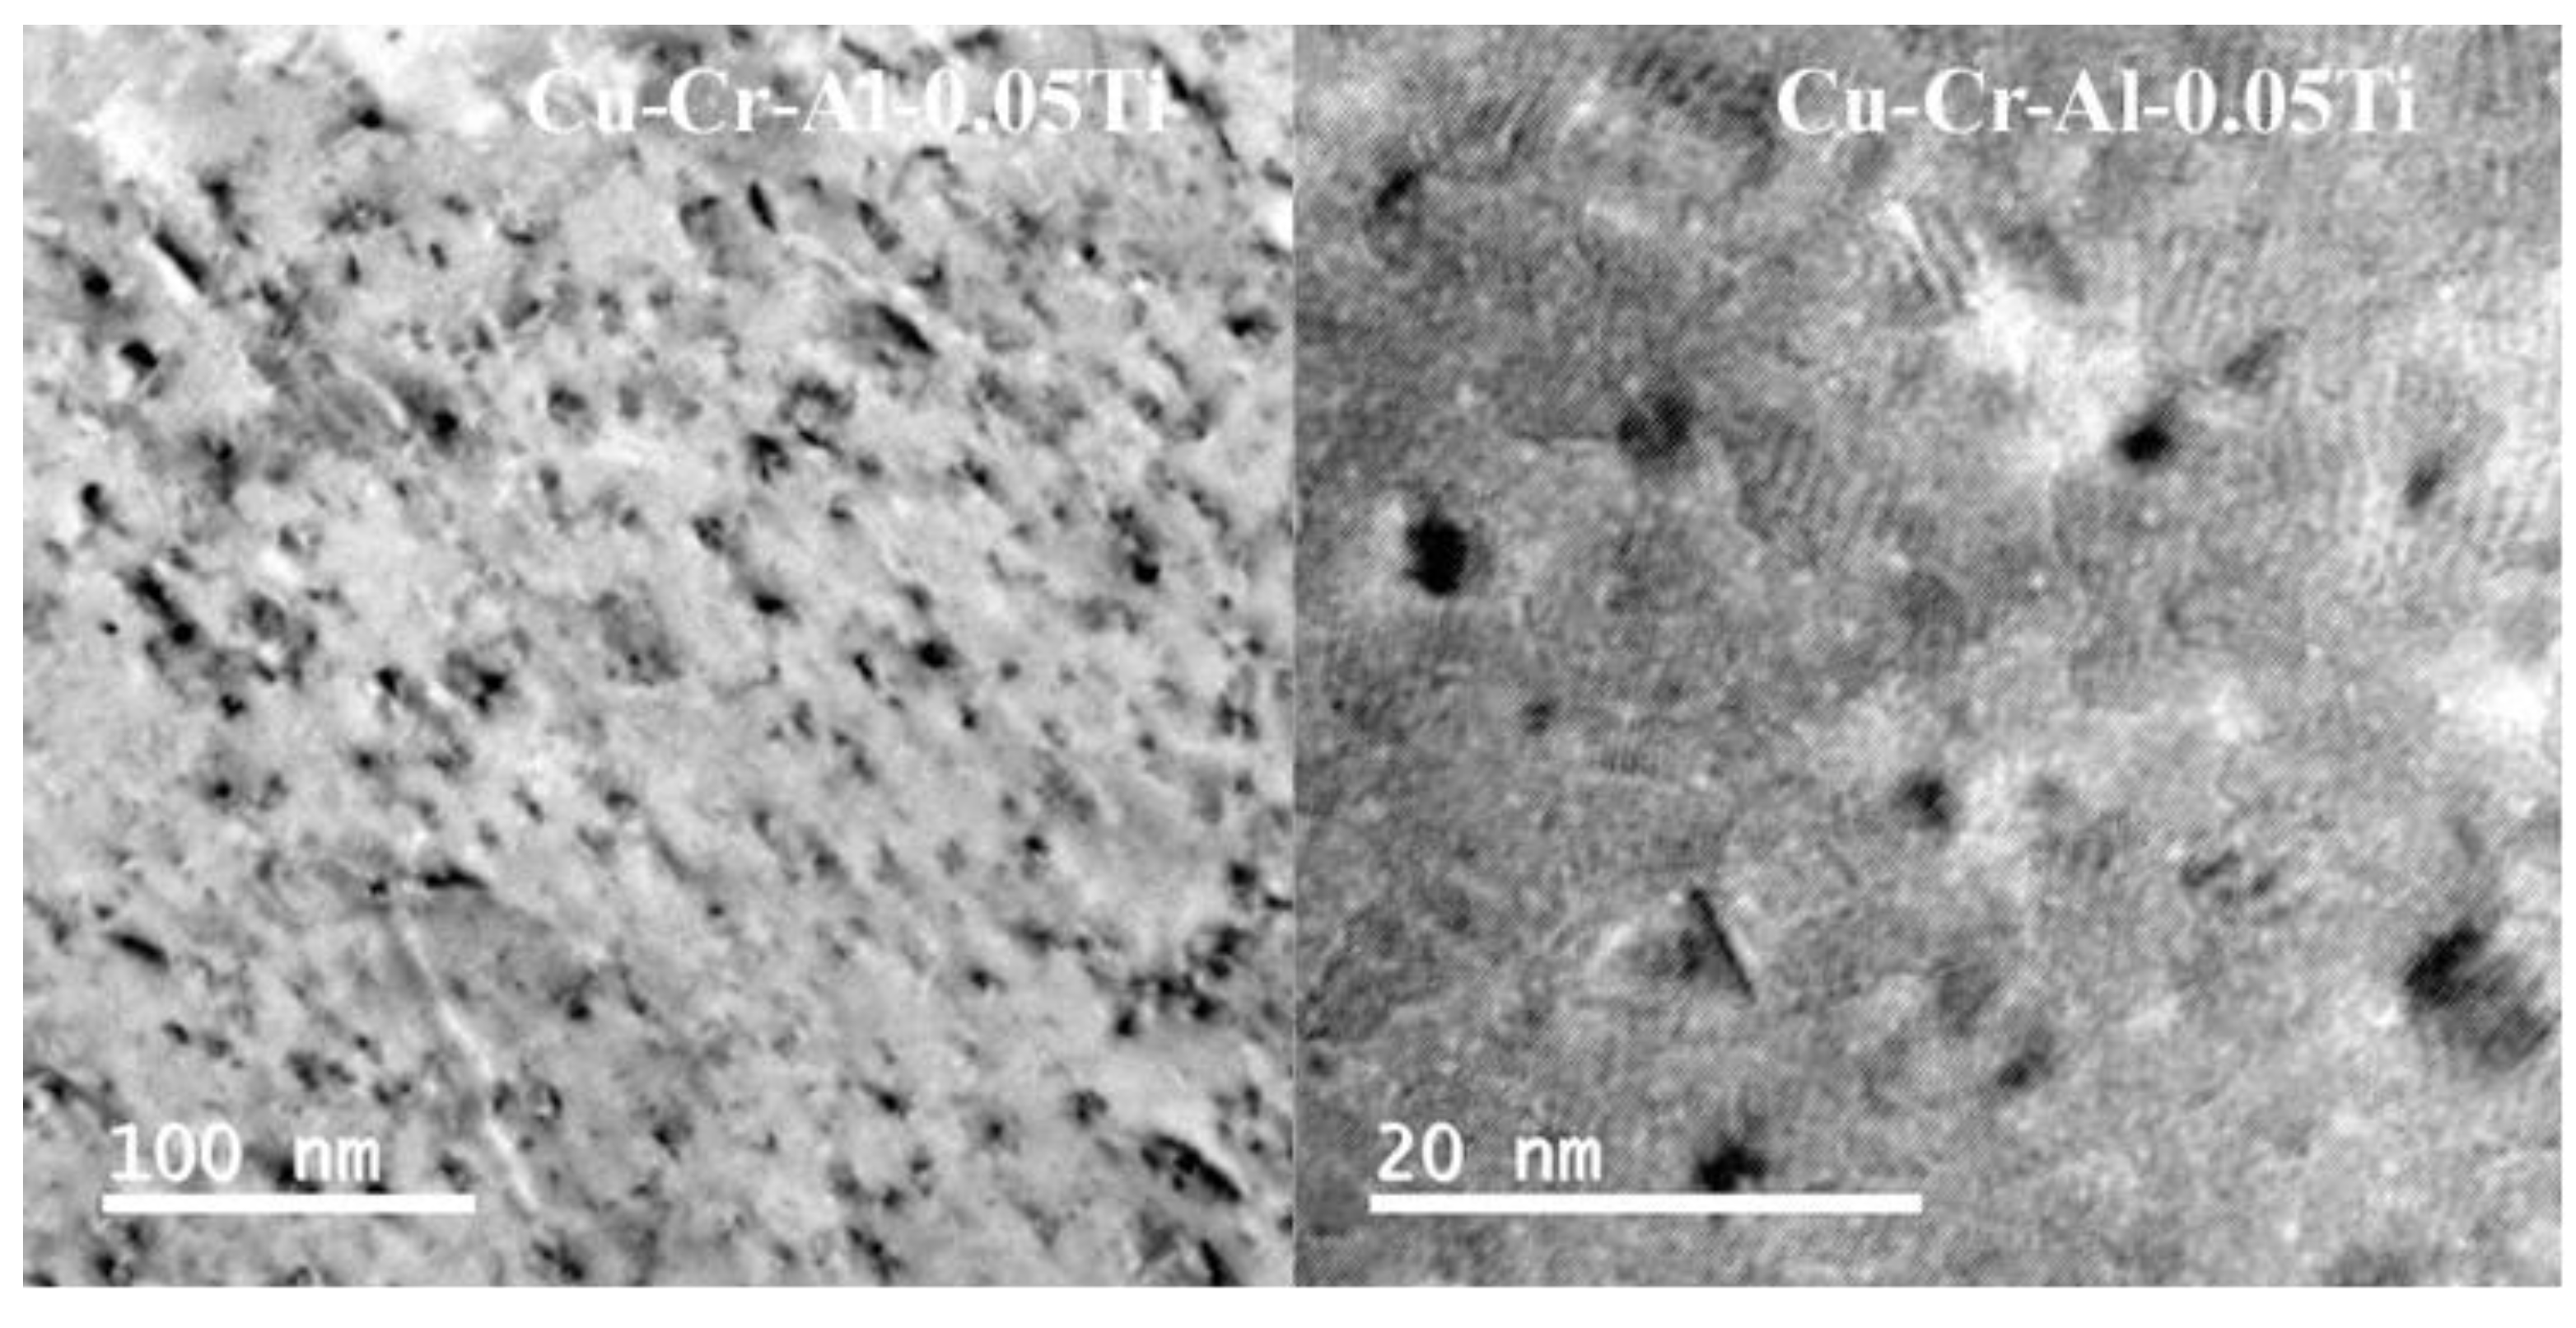
To visualize the distribution of Cr particles, TEM analysis was conducted. Then, this result is shown as Figure 14. The black region of TEM images indicates the Cr particles. The Cu-Cr alloy added to the Al and Ti contents has a lot of nano-sized Cr particles (<10 nm), and the particles are randomly distributed. It seems that the addition of Ti contents on Cu-Cr-Al alloys affects to block the release of strains, so that the softening effect is not efficient at aging process (Figure 7). However, the further research should be processed more to confirm the Ti addition effect on Cu-Cr alloys.
In this study, the alloying components and its amount effects are discussed in Cu-Cr alloys. Then, the processing condition effects on electrical and mechanical properties are discussed. In all processing conditions, the solid solution treatment, cold-rolling, aging processes increase the hardness by their strengthening mechanisms, such as work-hardening, solid solution-hardening, and precipitation-hardening effects. However, in these conditions and strengthening mechanisms, the precipitation hardening effect increases the electrical conductivity, only. The Cr particles have a role to improve both mechanical and electrical properties. Even, the softening occurs at the annealing process. In this process, the Ti alloying component acts as the obstacle to be softened to maintained the lattice parameter. These results can help the electrical industries needing to apply high-efficient electric components, which should have both the high strength and electrical conductivity.

4. Conclusions

In this study, Cu-Cr alloy with Al and Ti is investigated by microstructure identification, electrical and mechanical properties, and lattice parameter.
(1) Solid solution treatment is proper at 1000 ℃ for 6 h through analysis such as SEM/EDS microstructure identification, Cr concentration through EMPA, and variation of lattice parameter and micro-hardness.
(2) The optimizing aging condition differs for each alloy. Cu-Cr, Cu-Cr-Al, Cu-Cr-Al-Ti (0.015,0.03, and 0.05 wt.%) alloy is, respectively, 450 ℃ for 3 h, 450 ℃ for 2 h, 420 ℃ for 3 h, 420 ℃ for 5 h, and aging condition at 480 ℃ more than 1 h is over-aged.
(3) Cu-Cr alloy with Al observe a slight increase in mechanical properties, but electrical properties also decrease fairly. Cu-Cr-Al alloys with Ti observe a proper increase in mechanical properties and a severe decrease in electrical properties. Cu-Cr-Al alloys with Ti are shown resistance to over-aging compared to Cu-Cr and Cu-Cr-Al alloy.

Author Contributions

Conceptualization, C.-H.C. and H.C.; methodology, C.-H.C. and H.C.; validation, C.-H.C., J.S. and D.K.; investigation, C.-H.C., J.S. and D.K.; resources, C.-H.C., J.S., D.K. and H.C.; writing—original draft preparation, C.-H.C.; writing—review and editing, H.C.; visualization, C.-H.C.; supervision, H.C.; project administration, H.C. All authors have read and agreed to the published version of the manuscript.

Funding

This research was supported by the Korea Evaluation Institute of Industrial Technology (KEIT) and funded by the Ministry of Trade, Industry and Energy (project no.20013652).

Institutional Review Board Statement

Not applicable.

Informed Consent Statement

Not applicable.

Data Availability Statement

Data available in a publicly accessible repository.

Conflicts of Interest

The authors declare no conflict of interest.

References

  1. Valiev, R.Z.; Murashkin, M.Y.; Sabirov, I. A nanostructural design to produce high-strength Al alloys with enhanced electrical conductivity. Scr. Mater. 2014, 76, 13–16. [Google Scholar] [CrossRef]
  2. Sauvage, X.S.; Bobruk, E.V.; Murashkin, M.Y.; Nasedkina, Y.; Enikeev, N.A.; Valiev, R.Z. Optimization of electrical conductivity and strength combination by structure design at the nanoscale in Al–Mg–Si alloys. Acta Mater. 2015, 98, 355–366. [Google Scholar] [CrossRef]
  3. Zhang, P.; Jie, J.; Gao, Y.; Li, H.; Wang, T.; Li, T. Influence of cold deformation and Ti element on the microstructure and properties of Cu–Cr system alloys. J. Mater. Res. 2015, 30, 2073–2080. [Google Scholar] [CrossRef]
  4. Fernee, H.; Nairn, J.; Atrens, A. Precipitation hardening of Cu-Fe-Cr alloys part I Mechanical and electrical properties. J. Mater. Sci. 2001, 36, 2711–2719. [Google Scholar] [CrossRef]
  5. Watanabe, C.; Monzen, R.; Tazaki, K. Mechanical properties of Cu–Cr system alloys with and without Zr and Ag. J. Mater. Sci. 2008, 43, 813–819. [Google Scholar] [CrossRef] [Green Version]
  6. Gao, N.; Tiainen, T.; Huttunen-Saarivirta, E. Influence of Thermomechanical Processing on the Microstructure and Properties of a Cu-Cr-P Alloy. J. Mater. Eng. Perform. 2002, 11, 376–383. [Google Scholar] [CrossRef]
  7. Kim, K.T.; Cho, H. Cu-Cr-Mg-P-Zr Alloys with High Electrical Conductivity and High Tensile Strength. Republic of Korea 10-2012-0097748, 5 September 2012. [Google Scholar]
  8. Kim, D.H.; Lee, D.W.; Kim, I.D.; Choi, S.Y.; Lee, J.H.; Jeon, B.M. Copper Alloy Having High Strength and High Conductivity, and Method for Manufacture the Same. Republic of Korea 10-2011-0096941, 31 August 2011. [Google Scholar]
  9. Shapiro, S.; Shapiro, E.; Mravic, B.; Watson, W.G. Copper Base Alloys with High Strength and High Electrical Conductivity. U.S. Patent No. 4007039A, 8 February 1977. [Google Scholar]
  10. Li, R.; Kang, H.; Chen, Z.; Fan, G.; Zou, C.; Wang, W.; Zhang, S.; Lu, Y.; Jie, J.; Cao, Z.; et al. A promising structure for fabricating high strength and high electrical conductivity copper alloys. Sci. Rep. 2016, 6, 20799. [Google Scholar] [CrossRef] [PubMed] [Green Version]
  11. Zhang, Y.; Sun, H.L.; Volinsky, A.A.; Tian, B.H.; Chai, Z.; Liu, P.; Liu, Y. Characterization of the Hot Deformation Behavior of Cu–Cr–Zr Alloy by Processing Maps. Acta Metall. Sin. 2016, 29, 422–430. [Google Scholar] [CrossRef] [Green Version]
  12. Li, R.; Guo, E.; Chen, Z.; Kang, H.; Wang, W.; Zou, C.; Li, T.; Wang, T. Optimization of the balance between high strength and high electrical conductivity in CuCrZr alloys through two-step cryorolling and aging. J. Alloy. Compd. 2019, 771, 1044–1051. [Google Scholar] [CrossRef]
  13. Xu, G.-L.; Peng, L.-J.; Huang, G.-J.; Xie, H.-F.; Yang, Z.; Feng, X.; Yin, X.-Q.; Yang, Z. Microstructural evolution and properties of a Cu–Cr–Ag alloy during continuous manufacturing process. Rare Met. 2019, 1–8, 1–8. [Google Scholar] [CrossRef]
  14. Guo, X.; Zhu, X.; Qiu, W.; Zhou, L.; Zhao, Z.; Wang, X.; Jiang, Y. Microstructure and properties of Cu-Cr-Nb alloy with high strength, high electrical conductivity and good softening resistance performance at elevated temperature. Mater. Sci. Eng. A 2019, 749, 281–290. [Google Scholar] [CrossRef]
  15. Peng, L.; Xie, H.; Huang, G.; Xu, G.; Yin, X.; Feng, X.; Mi, X.; Yang, Z. The phase transformation and strengthening of a Cu-0.71 wt% Cr alloy. J. Alloy. Compd. 2017, 708, 1096–1102. [Google Scholar] [CrossRef]
  16. Sun, Y.; Peng, L.; Huang, G.; Feng, X.; Xie, H.; Mi, X.; Liu, X. Effect of Mg on the stress relaxation resistance of Cu–Cr al-loys. Mater. Sci. Eng. A 2020, 799, 140144. [Google Scholar] [CrossRef]
  17. Jovanovic, M.T.; Rajkovic, V. High Electrical Conductivity Cu-Based Alloys; Part1; Association of Metallurgical Engineers of Serbia: Belgrade, Serbia, 2009. [Google Scholar]
  18. Pang, Y.; Xia, C.; Wang, M.; Li, Z.; Xiao, Z.; Wei, H.; Sheng, X.; Jia, Y.; Chen, C. Effects of Zr and (Ni, Si) additions on properties and microstructure of Cu–Cr alloy. J. Alloy. Compd. 2014, 582, 786–792. [Google Scholar] [CrossRef]
  19. Gao, N.; Tiainen, T.; Laakso, L.; Ji, Y. Control of Microstructures and Properties of a Phosphorus-Containing Cu-0.6 Wt.% Cr Alloy through Precipitation Treatment. J. Mater. Eng. Perform. 2000, 9, 623–629. [Google Scholar] [CrossRef]
  20. Han, S.J.; Ahn, J.H. A Copper Alloy having High Strength and High Electrical Conductivity. Republic of Korea 10-1468959, 28 November 2014. [Google Scholar]
  21. European Copper Institute. Copper as Electrical Conductive Material with Above-Standard Performance Properties; European Copper Institute: New York, NY, USA, 2020. [Google Scholar]
  22. Zhang, P.C.; Jie, J.C.; Gao, Y.; Wang, T.M.; Li, T.J. Effect of Ti Element on Microstructure and Properties of Cu-Cr Alloy. Mater. Sci. Forum 2015, 817, 307–311. [Google Scholar] [CrossRef]
  23. Ardell, A.J. Precipitation hardening. Met. Mater. Trans. A 1985, 16, 2131–2165. [Google Scholar] [CrossRef]
Figure 1. Conventionally used and recently developed Cu-Cr alloys and their properties.
Metals 11 00039 g001
Figure 2. Microstructures of Cu-Cr alloys as cast by SEM.
Metals 11 00039 g002
Figure 3. Observation and identification of precipitation of Cu-Cr alloys by TEM and EDS (the point indicating “1” means the point to be investigated by EDS).
Metals 11 00039 g003
Figure 4. Microstructures of Cu-Cr alloys after solid solution treatment.
Metals 11 00039 g004
Figure 5. Variation of properties of Cu-Cr alloys as-cast and solid solution treatment.
Metals 11 00039 g005
Figure 6. Electrical and mechanical properties and lattice parameter variation after 1st cold-rolled Cu-Cr alloys.
Metals 11 00039 g006
Figure 7. Variation of electrical conductivity of Cu-Cr alloys after aging treatment.
Metals 11 00039 g007
Figure 8. Variation of hardness of Cu-Cr alloys after aging treatment.
Metals 11 00039 g008
Figure 9. Variation of mechanical and electrical properties of Cu-Cr alloys.
Metals 11 00039 g009
Figure 10. Variation of resistance to softening characteristics of Cu-Cr alloys.
Metals 11 00039 g010
Figure 11. Prediction of solubility and crystallization phase of Cu-Cr alloys by FactSage®.
Metals 11 00039 g011
Figure 12. Solute concentration variation of Cu matrix by EPMA analysis.
Metals 11 00039 g012
Figure 13. TEM images and diffraction pattern of Cu-Cr and Cu-Cr-Al-Ti alloys after solid solution heat treatment.
Metals 11 00039 g013
Figure 14. Observation and identification of precipitation of Cu-Cr alloys by TEM.
Metals 11 00039 g014
Table 1. List of chemical compositions of Cu-Cr alloys by using spectrometer.
Wt.%CrAlTiCu
Cu-0.25Cr0.26770.00110.0004Bal.
Cu-0.25Cr-0.06Al0.26550.0548<0.0004Bal.
Cu-0.25Cr-0.06Al-0.015Ti0.2530.05650.0189Bal.
Cu-0.25Cr-0.06Al-0.03Ti0.26040.05770.0264Bal.
Cu-0.25Cr-0.06Al-0.05Ti0.24380.06200.0507Bal.
Publisher’s Note: MDPI stays neutral with regard to jurisdictional claims in published maps and institutional affiliations.