
Quantitative Examination of the Inclusion and the Rotated Bending Fatigue Behavior of SAE52100


Abstract
:1. Background
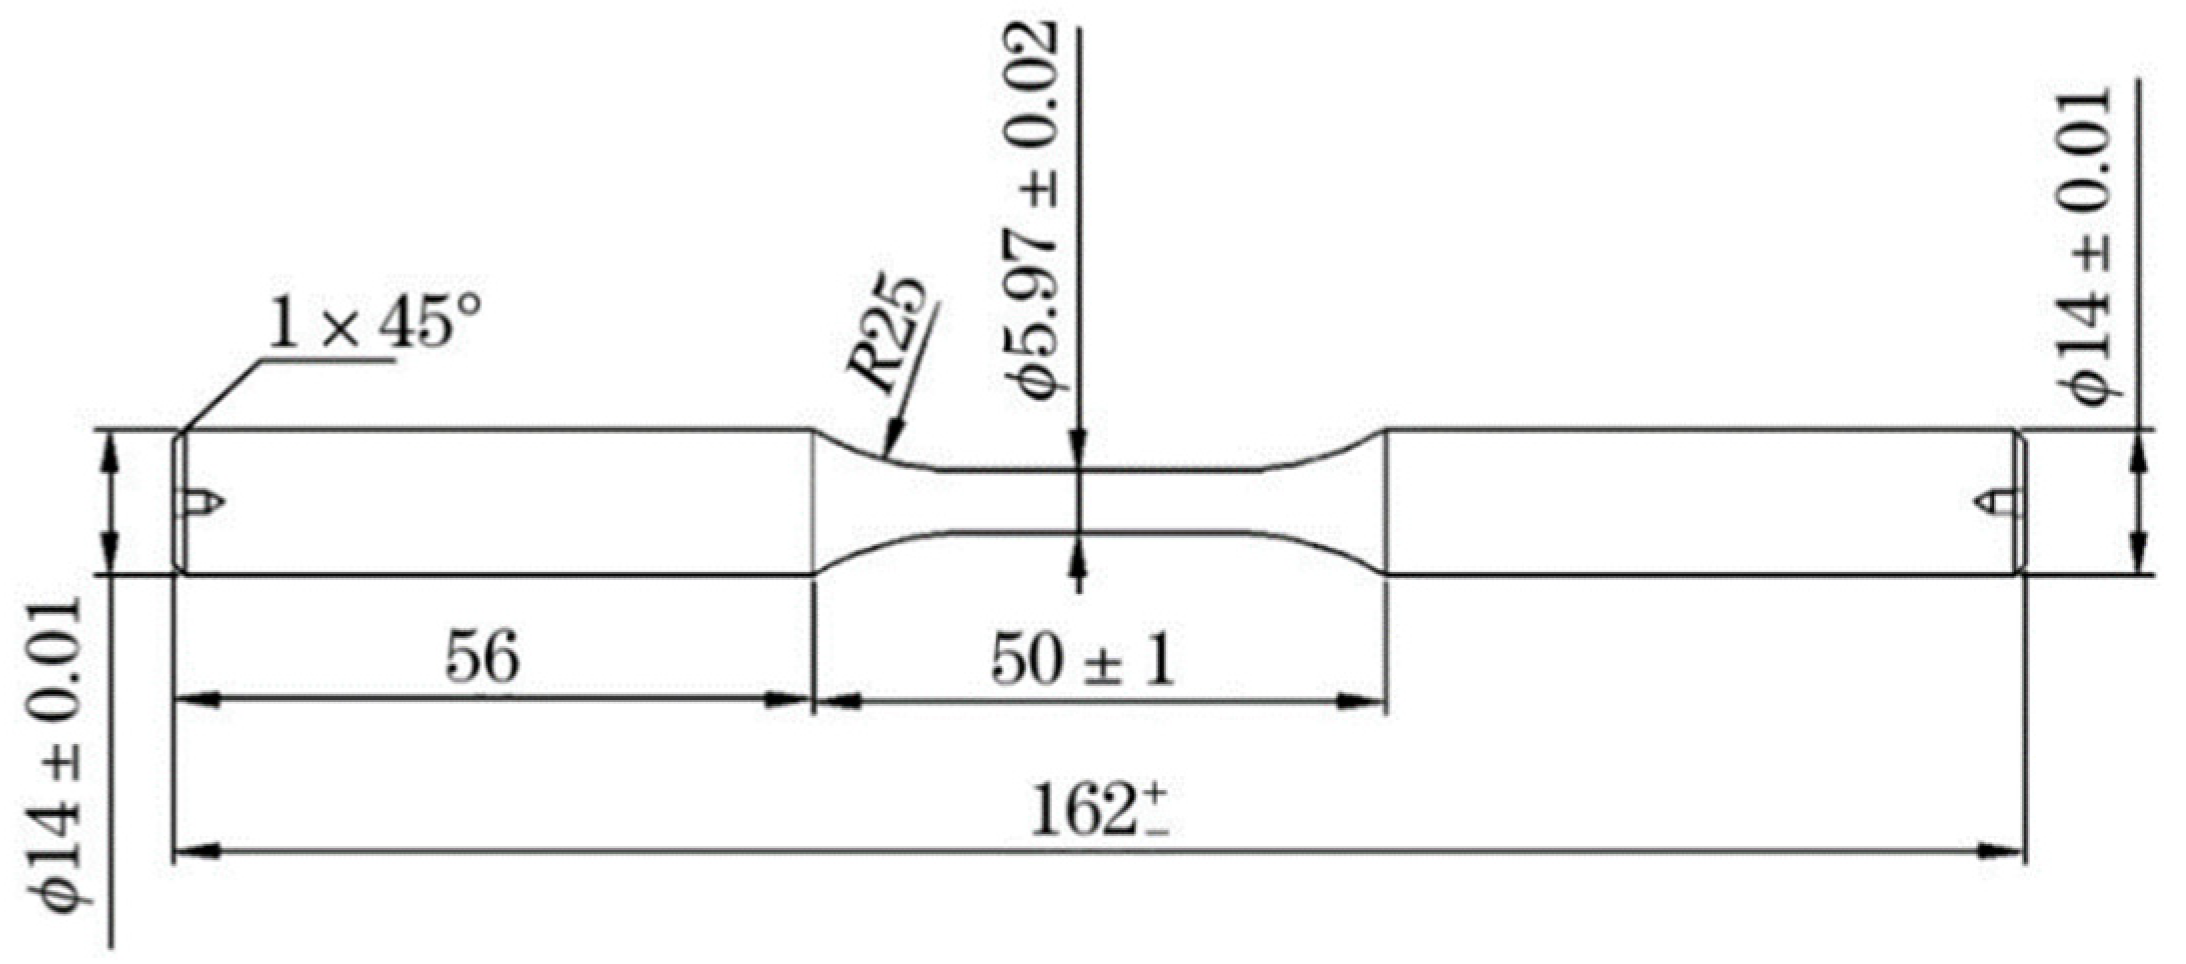
2. Experimental
3. Experimental Results
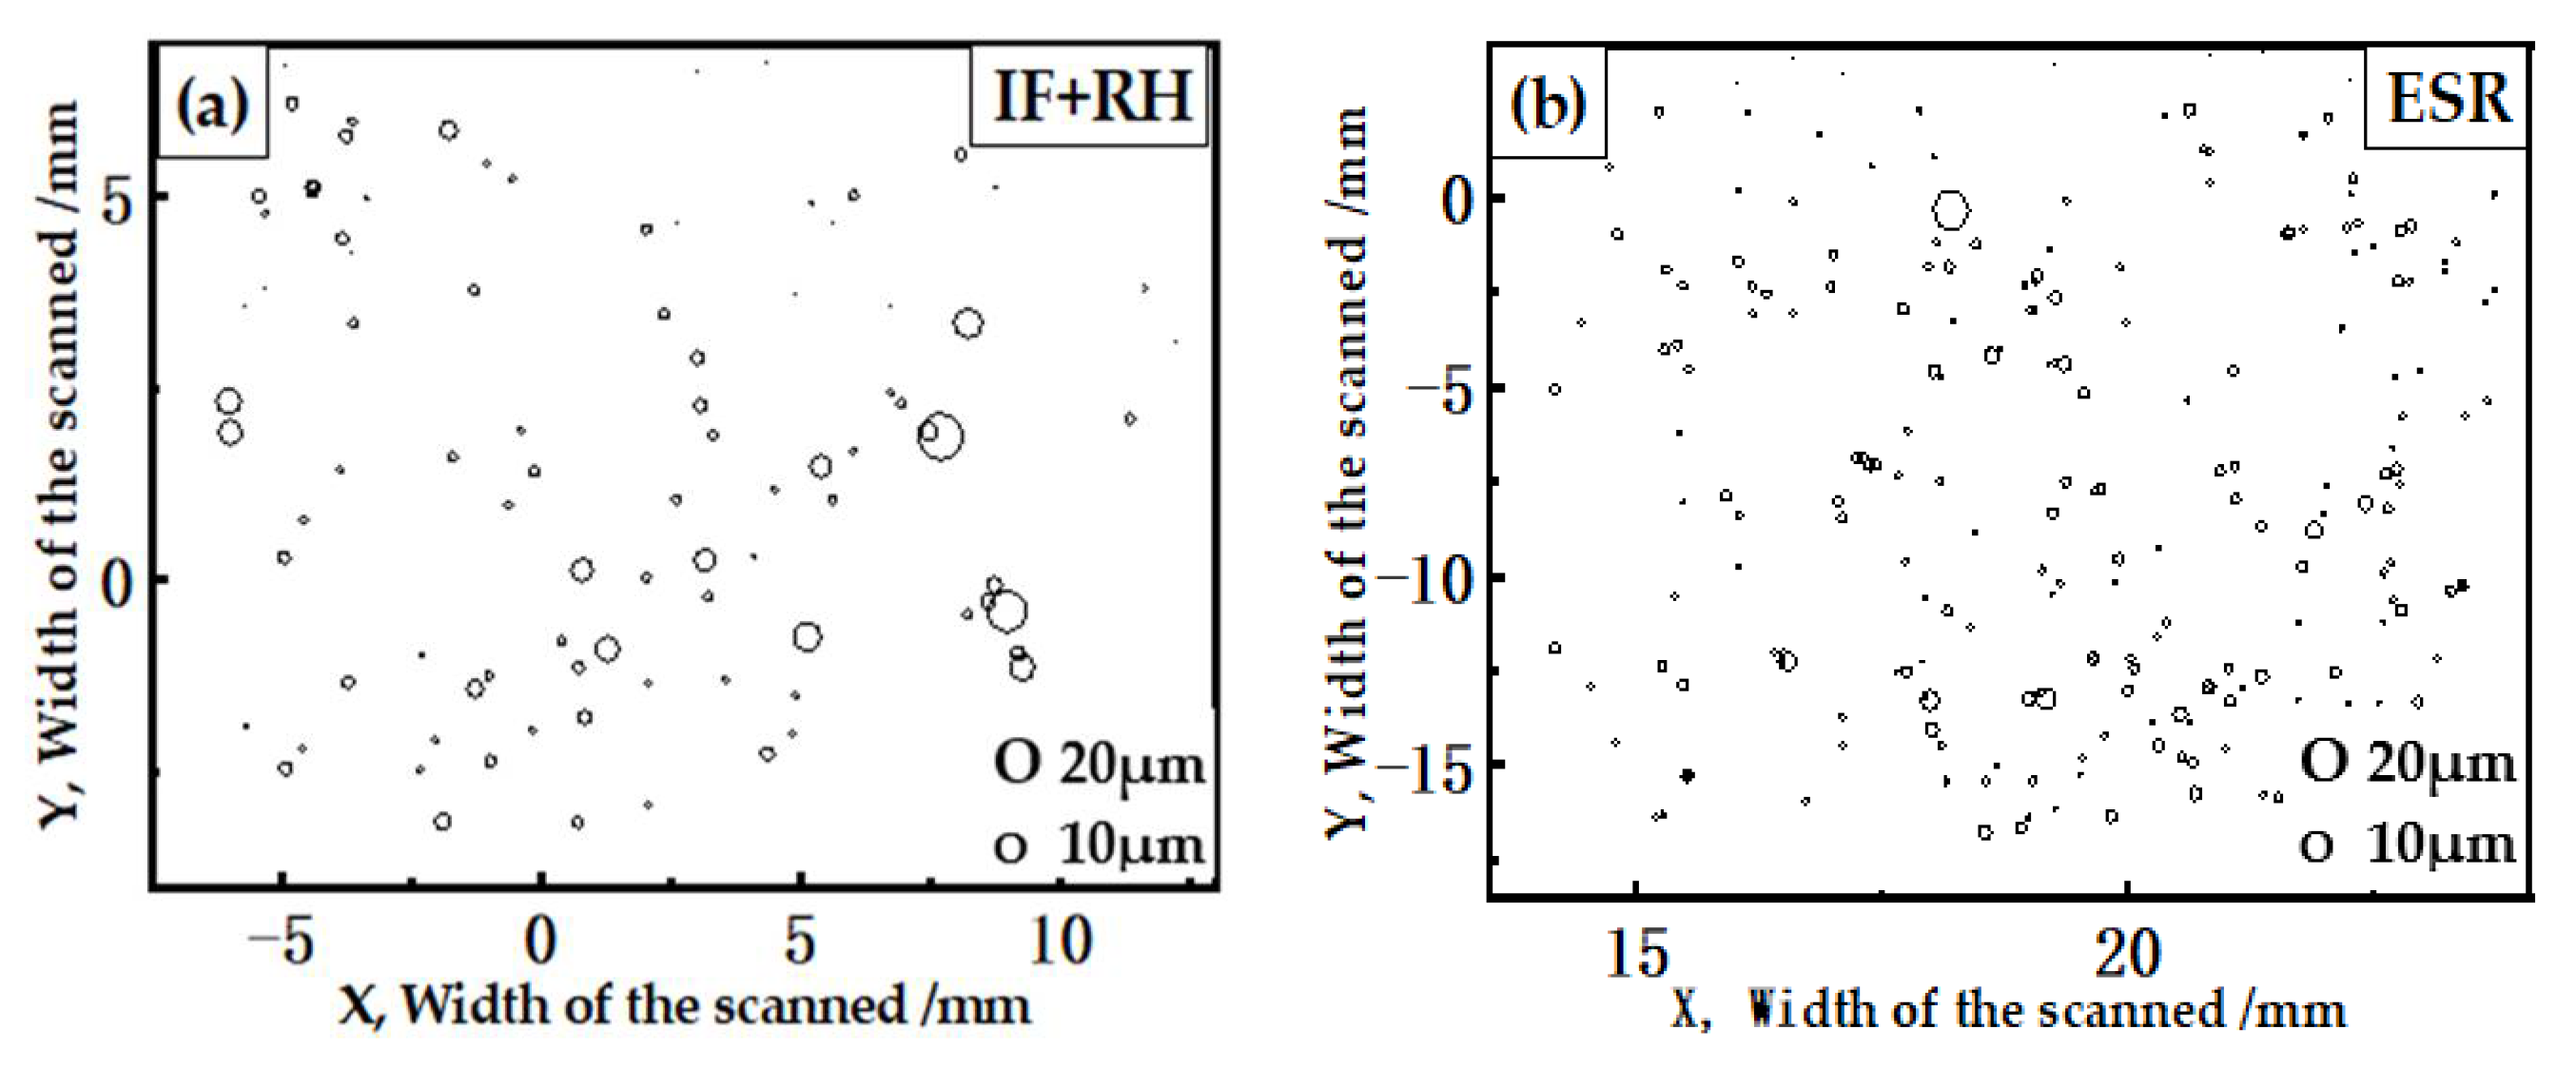
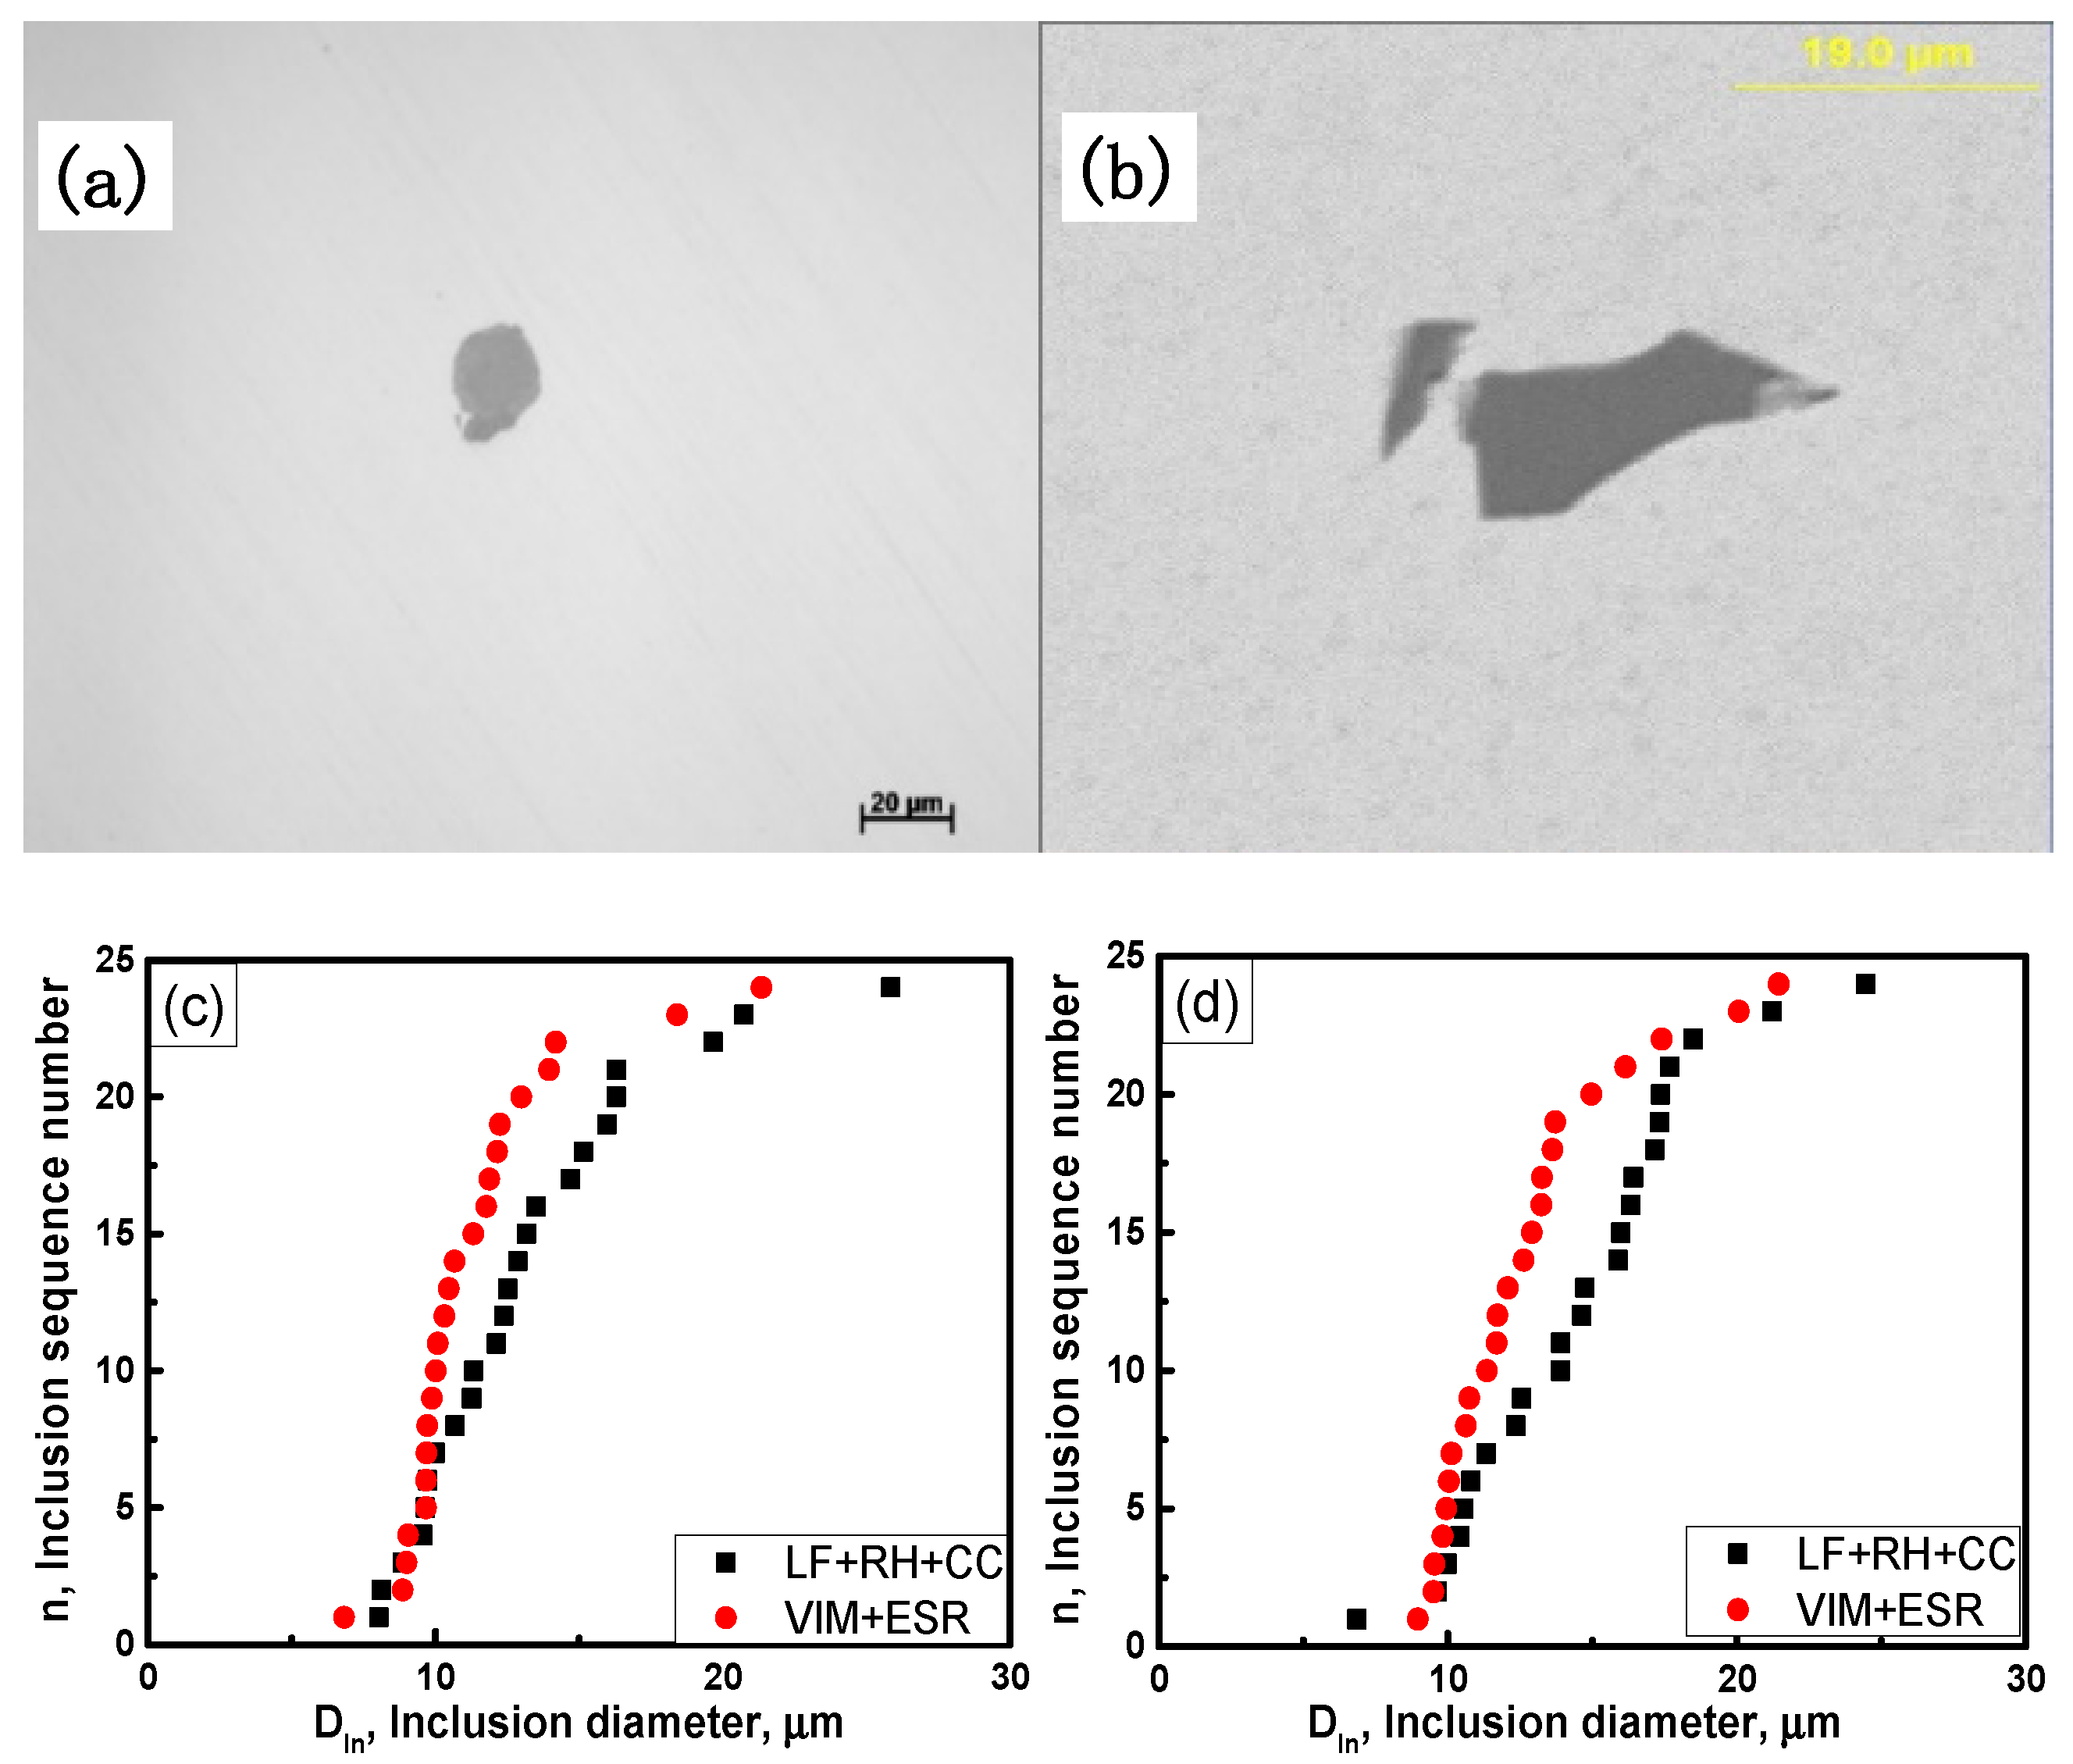
3.1. Inclusions Evaluated by Metallography and Aspex Explorer
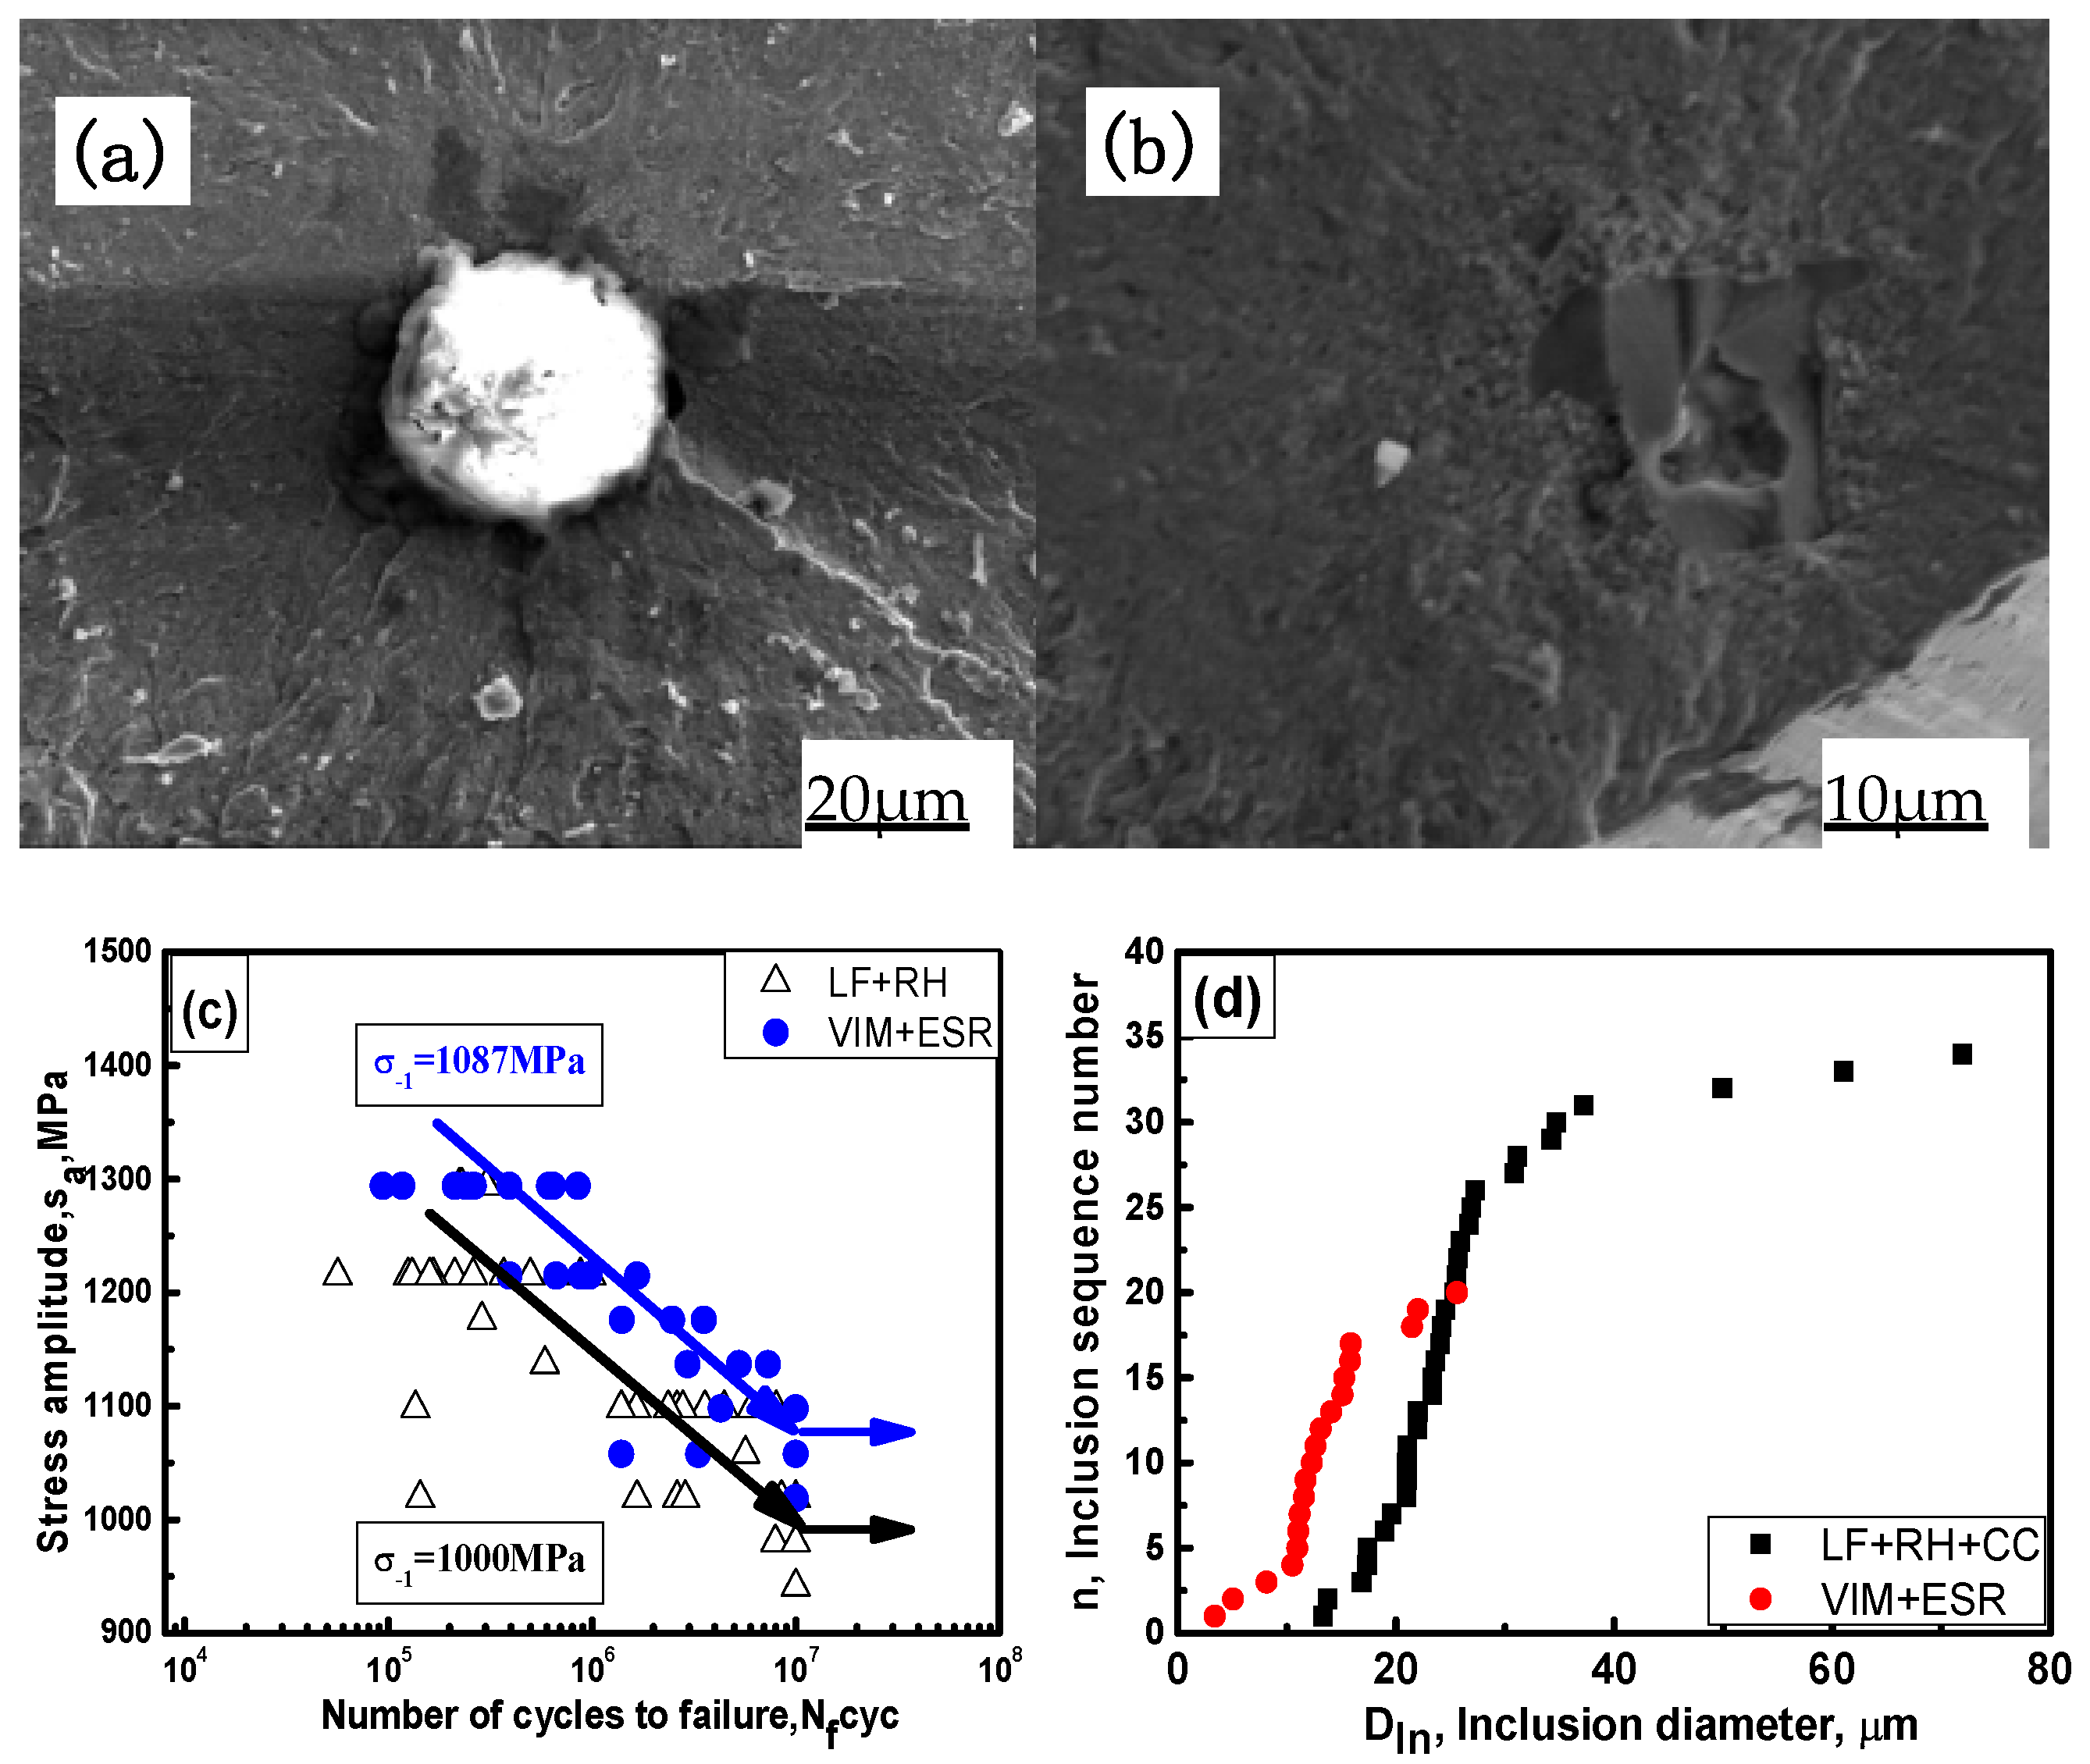
3.2. Rotated Bending Fatigue Experiment Results
4. Discussion
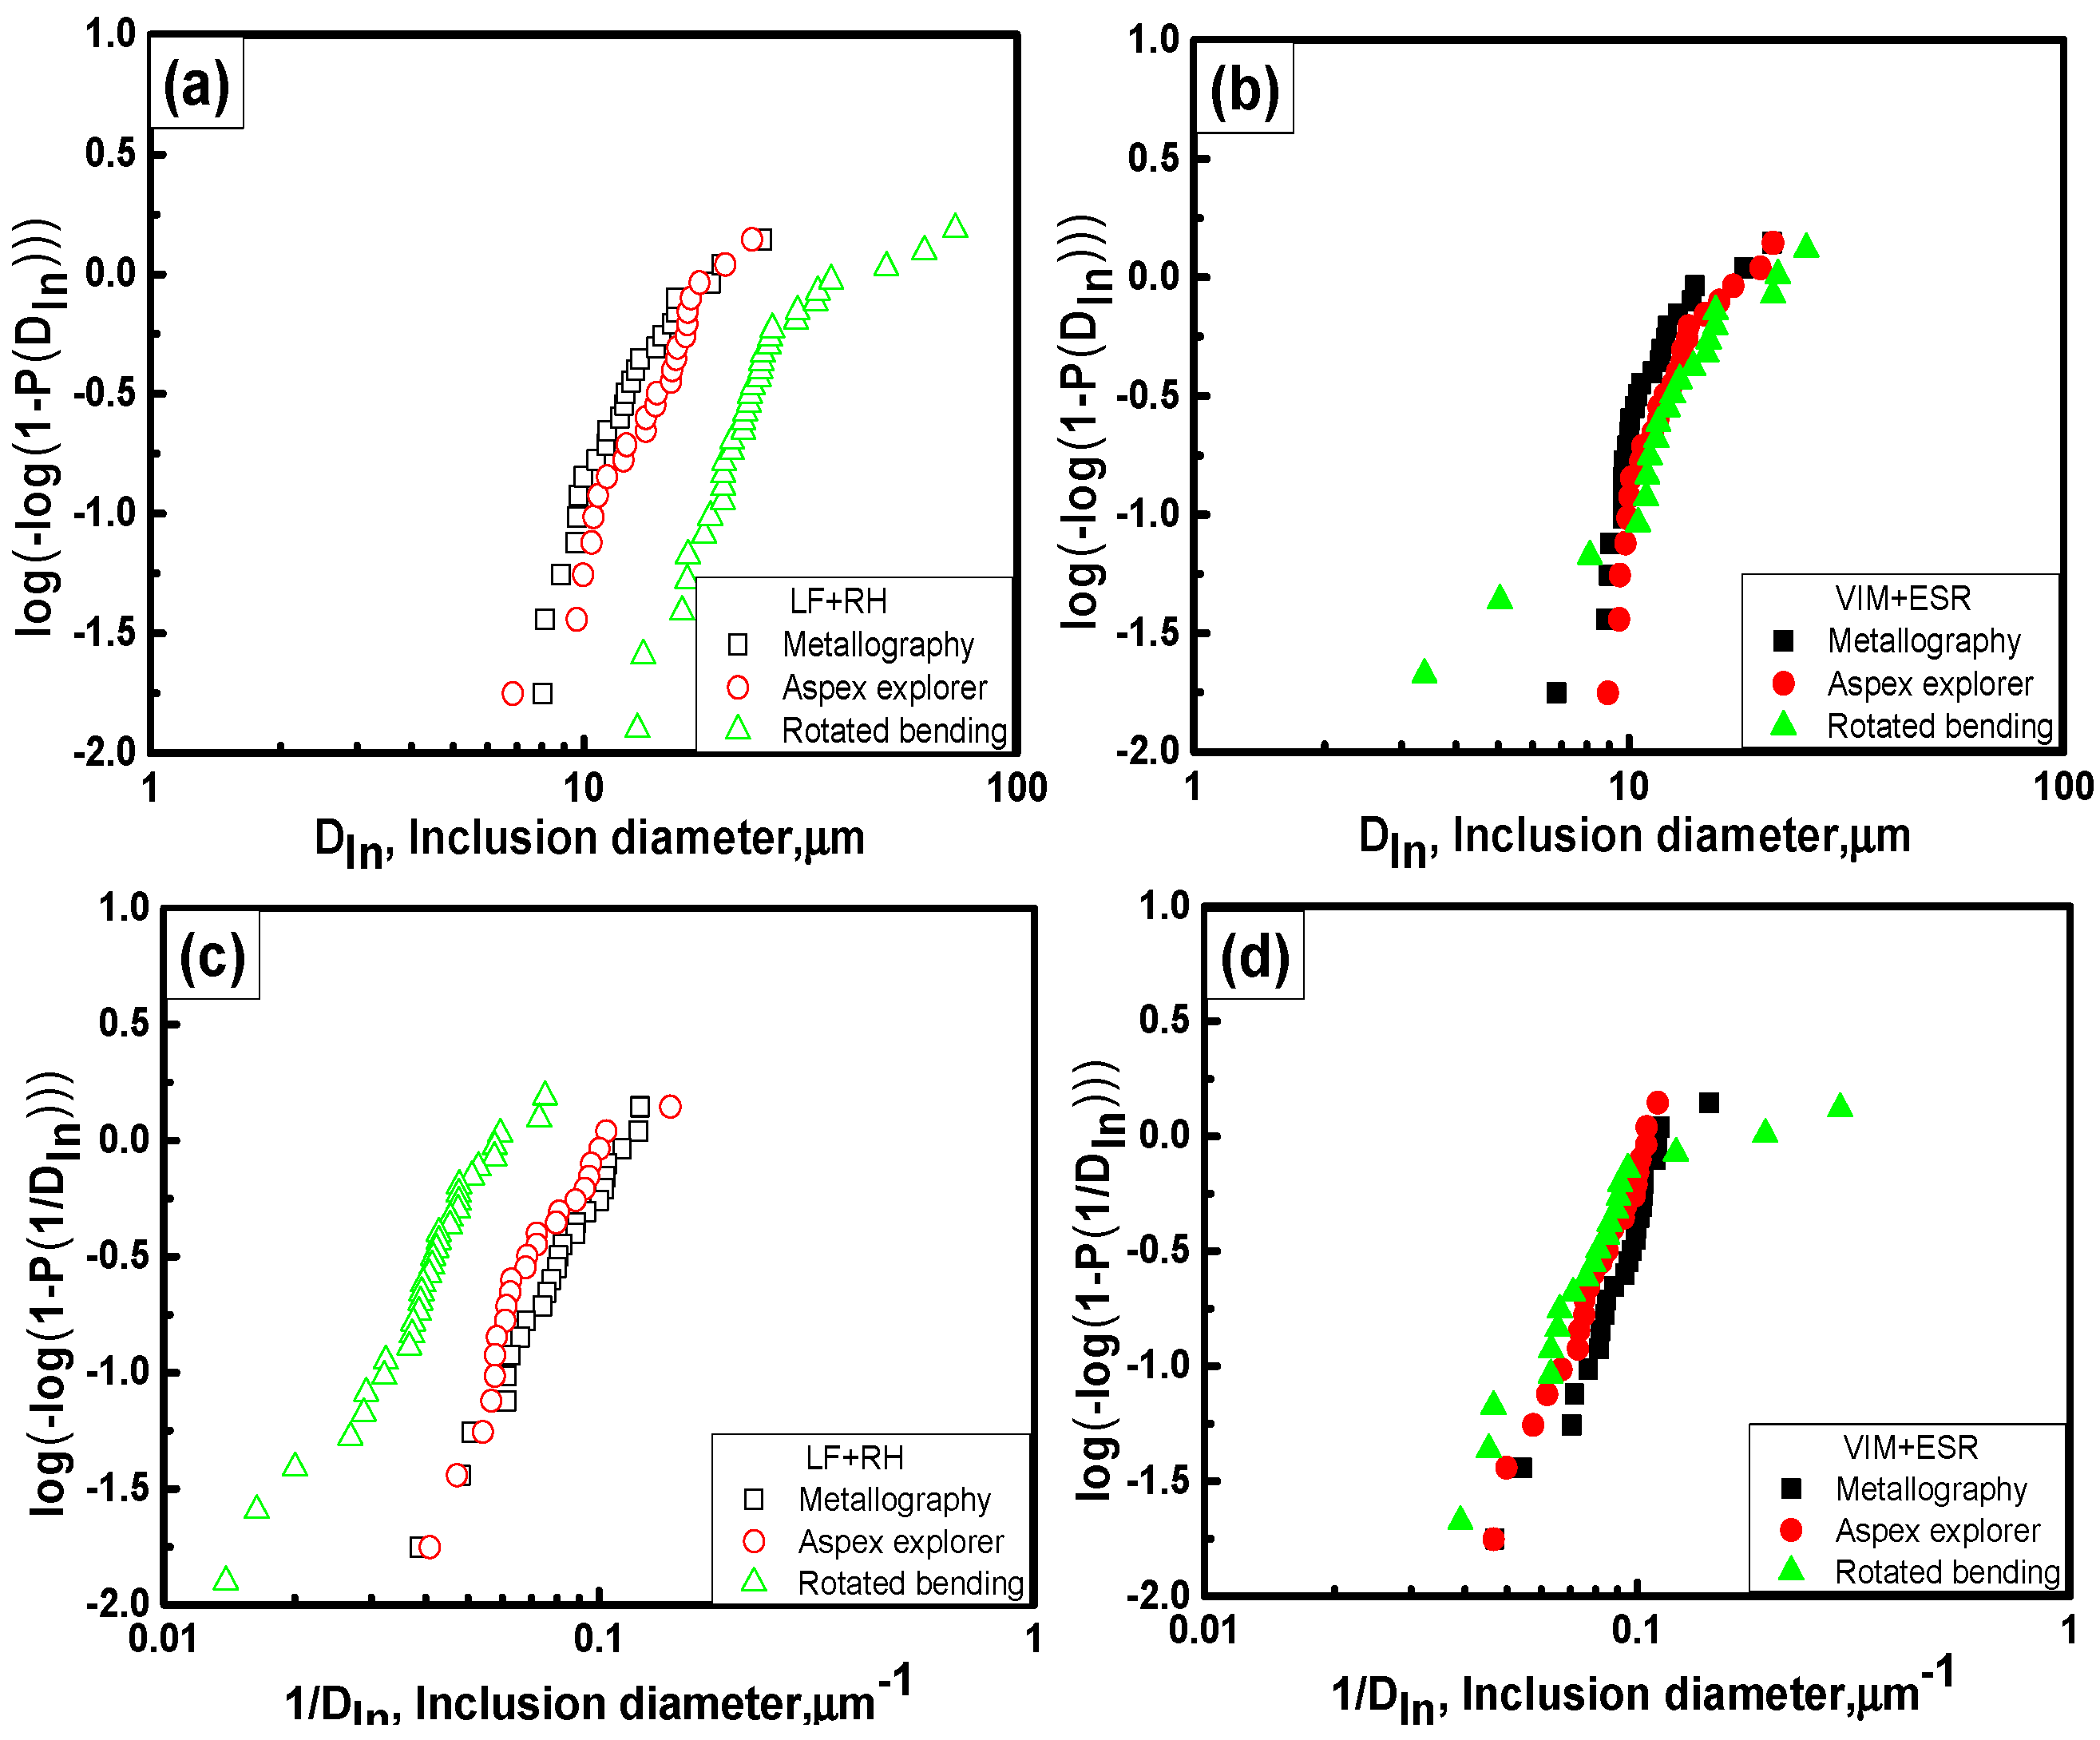
4.1. Accuracy Evaluation of Inclusion Distribution by Different Characterization Methods
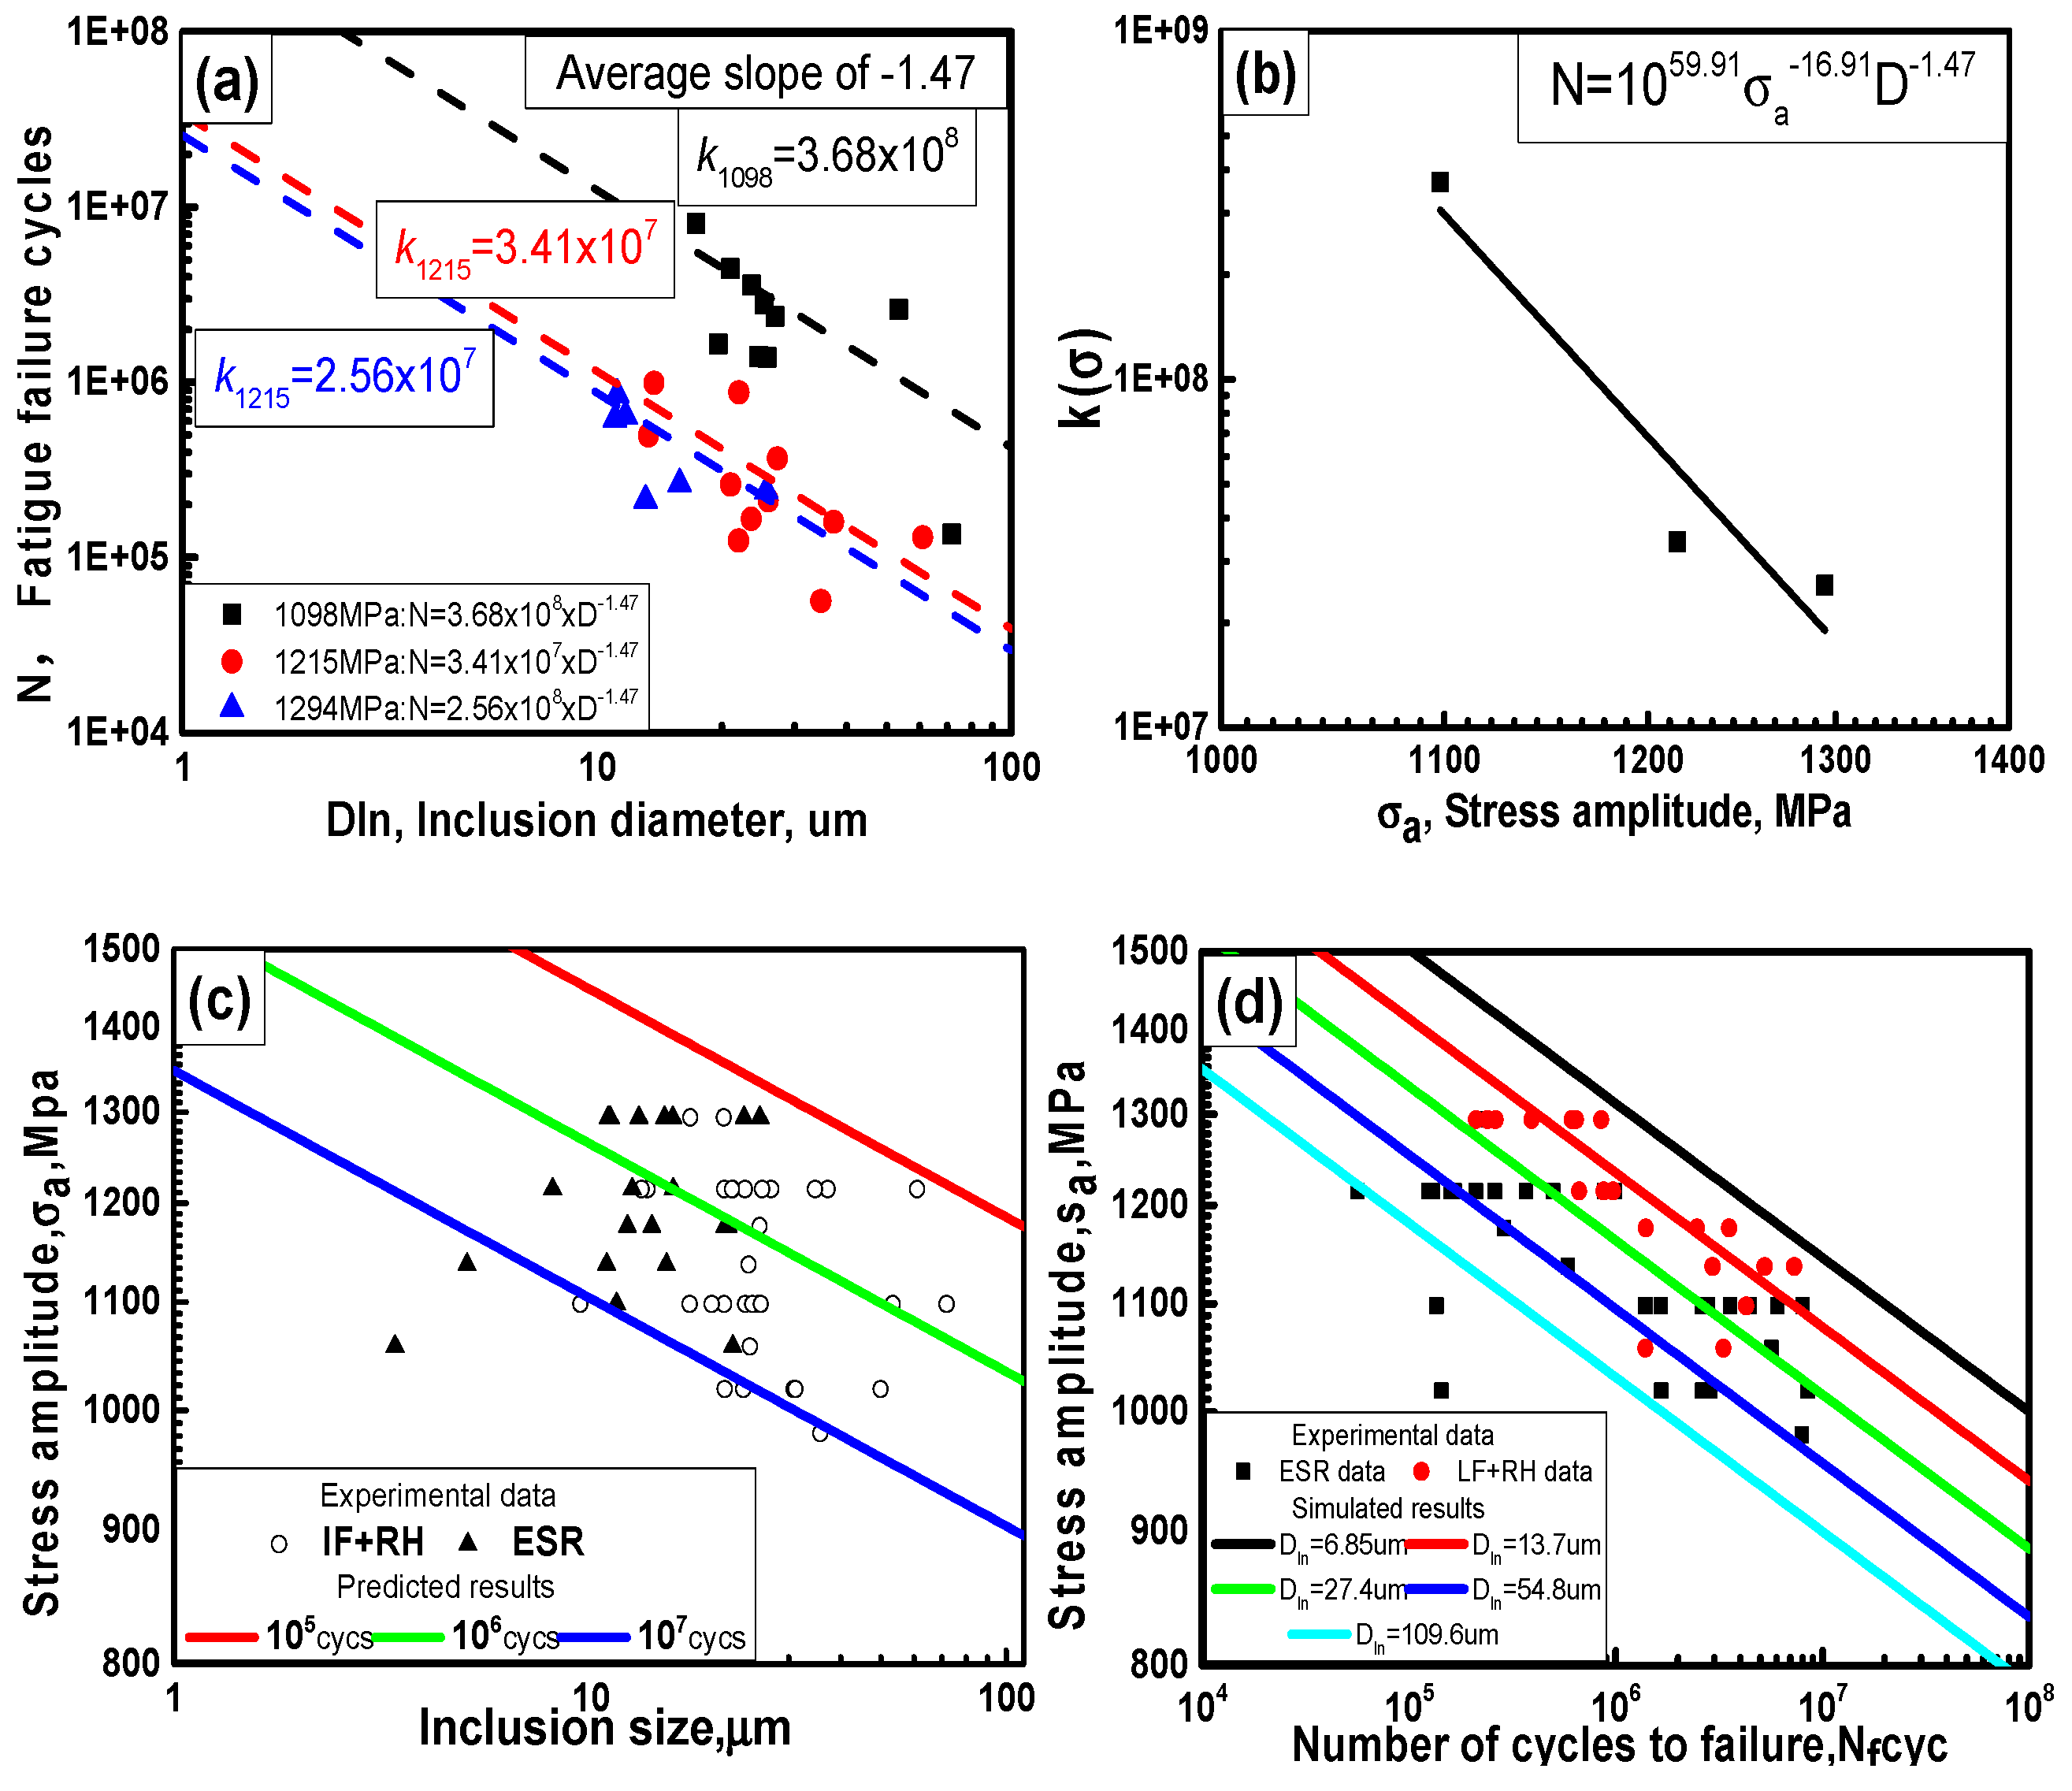
4.2. Relationship among Fatigue Stress Amplitude, Inclusion Size and Fatigue Cycles
5. Conclusions
- (1)
- The non-metallic inclusions in both LF + RH steel and ESR steel were characterized by the metallographic method, Aspex explore, and rotated bending fatigue test, indicating that both the metallographic method and Aspex explorer underestimate the size of the maximum inclusions. However, the rotated bending fatigue method successfully examined the maximum inclusion size.
- (2)
- The distribution of the maximum inclusions could not be described by the classical Weibull distribution based on the inclusion size, whereas the inverse Weibull distribution of the maximum inclusion size could be well applied based on the inverse value of the maximum inclusions.
- (3)
- The rotated bending fatigue life is not only determined by the loading stress amplitude but also by the maximum inclusion size. The relationship between the rotated bending fatigue cycle number, the loading stress amplitude, and the maximum inclusion size was established and shown to accurately predict the dependence among these three parameters.
Author Contributions
Funding
Institutional Review Board Statement
Informed Consent Statement
Data Availability Statement
Acknowledgments
Conflicts of Interest
References
- Yu, F.; Chen, X.P.; Xu, H.F.; Dong, H.; Weng, Y.Q.; Cao, W.Q. Current status of metallurgical quality and fatigue performance of rolling bearing steel and development direction of high-end bearing steel. Acta Metall. Sin. 2020, 56, 513–522. [Google Scholar] [CrossRef]
- Li, Z.K.; Lei, J.Z.; Xu, H.F. Current status and development trend of bearing steel in China and abroad. J. Iron Steel Res. 2016, 28, 12. [Google Scholar] [CrossRef]
- Ai, X.L. A comprehensive model for assessing the impact of steel cleanliness on bearing performance. J. Tribol. 2005, 10, 60–66. [Google Scholar] [CrossRef]
- Lu, L.T.; Shiozawa, K.; Morii, Y.; Nishino, S. Fatigue fracture process of a high-carbon-chromium bearing steel in ultra-long life regime. Acta Metall. Sin. 2005, 10, 66–72. [Google Scholar]
- Liu, Y.Z.; Zhou, L.Y.; Zhang, C.L. Development and quality control of bearing steel for heavy equipment. Iron Steel 2013, 48, 1–8. [Google Scholar] [CrossRef]
- Ciavarella, M.; Papangelo, A. On the distribution and scatter of fatigue lives obtained by integration of crack growth curves: Does initial crack size distribution matter. Eng. Fract. Mech. 2018, 191, 111–124. [Google Scholar] [CrossRef]
- Tian, C.; Liu, J.H.; Dong, H. Comparative study on inclusion characteristic of imported and domestic bearing steel. Hot Work. Technol. 2017, 46, 58–62. [Google Scholar] [CrossRef]
- Tian, C.; Liu, J.H.; Lu, H.C.; Dong, H. Estimation of maximum inclusion by statistics of extreme values method in bearing steel. J. Iron Steel Res. Int. 2017, 24, 1131–1136. [Google Scholar] [CrossRef]
- Li, W.; Sakai, T.; Deng, H. Statistical evaluation of very high cycle fatigue property of high carbon chromium bearing steel under axial loading. Mater. Sci. Technol. 2016, 32, 1094–1099. [Google Scholar] [CrossRef]
- Hashimoto, K.; Hiraoka, K.; Kida, K.; Santos, E.C. Effect of sulphide inclusions on rolling contact fatigue life of bearing steels. Mater. Sci. Technol. 2012, 28, 39–43. [Google Scholar] [CrossRef]
- Wu, H.J.; Li, Q.Q.; Wei, C.Y.; Wang, Z. Study on the behaviour of DS-Class inclusions in advanced bearing steel. Metall. Res. Technol. 2019, 116, 223. [Google Scholar] [CrossRef] [Green Version]
- Yang, G.W.; Wang, X.H.; Huang, F.X.; Wang, W.J.; Yin, Y.Q. Transient inclusion evolution during RH degassing. Steel Res. Int. 2014, 85, 26–34. [Google Scholar] [CrossRef]
- Zhang, J.M.; Zhang, J.F.; Yang, Z.G.; Li, S.X.; Hui, W.J.; Weng, Y.Q. Estimation of maximum inclusion size and fatigue strength in high strength ADF1 steel. Mater. Sci. Eng. A 2005, 394, 126–131. [Google Scholar] [CrossRef]
- Che, X.J.; Yang, M.S.; Tang, H.Y.; Li, J.X.; Pang, X.H.; Yong, S. Inclusion control and fatigue performance in high performance SAE52100 bearing steel. Iron Steel 2018, 53, 76–85. [Google Scholar] [CrossRef]
- Sun, F.L.; Geng, K.; Yu, F.; Luo, H.W. Relationship of inclusions and rolling contact fatigue life for ultra-clean bearing steel. Acta Metall. Sin. 2020, 56, 693–703. [Google Scholar] [CrossRef]
- Cao, Z.X.; Shi, Z.Y.; Yu, F.; Wu, G.L.; Cao, W.Q.; Weng, Y.Q. A new proposed Weibull distribution of inclusion size and its correlation with rolling contact fatigue life of an extra clean bearing steel. Int. J. Fatigue 2019, 126, 1–5. [Google Scholar] [CrossRef]
- Tosha, K.; Ueda, D.; Shimoda, H.; Shimizu, S. A study on P-S-N curve for rotating bending fatigue test for bearing steel. Tribol. Trans. 2008, 51, 166–172. [Google Scholar] [CrossRef]
- Yang, C.Y.; Luan, Y.K.; Li, Y.Y. Very high cycle fatigue properties of bearing steel with different aluminum and sulfur content. Int. J. Fatigue 2018, 116, 396–408. [Google Scholar] [CrossRef]
- Fu, H.W.; Rydel, J.J.; Gola, A.M.; Yu, F.; Geng, K.; Lau, C.H.; Luo, H.W.; Rivera-Diaz-del-Castillo, P.E.J. The relationship between 100Cr6 steelmaking, inclusion microstructure and rolling contact fatigue performance. Int. J. Fatigue 2019, 129, 104899. [Google Scholar] [CrossRef]
- Ganti, S.; Turner, B.; Kirsch, M.; Anthony, D.; Mccoy, B.; Trivedi, H.; Sundar, V. Three-dimensional (3D) analysis of white etching bands (WEBs) in AISI M50 bearing steel using automated serial sectioning. Mater. Charact. 2018, 138, 11–18. [Google Scholar] [CrossRef]
- Shimizu, S. Fatigue limit concept and life prediction model for rolling contact machine elements. Tribol. Trans. 2002, 45, 39–46. [Google Scholar] [CrossRef]
- Zhao, Y.X.; Liu, H.B. Weibull modeling of the probabilistic S-N curves for rolling contact fatigue. Int. J. Fatigue 2014, 66, 47–54. [Google Scholar] [CrossRef]
- Sakai, T.; Lian, B.; Takeda, M.; Shiozawa, K.; Oguma, N.; Ochi, Y.; Nakajima, M.; Nakamura, T. Statistical duplex S-N characteristics of high carbon chromium bearing steel in rotating bending in very high cycle regime. Int. J. Fatigue 2010, 32, 497–504. [Google Scholar] [CrossRef]
- Kun, F.; Carmona, H.A.; Andrade, J.S.; Herrmann, H.J. Universality behind Basquin’s law of fatigue. Phys. Rev. Lett. 2008, 100, 094301. [Google Scholar] [CrossRef] [Green Version]
- Lai, J.B.; Lund, T.; Ryden, K.; Gabelli, A.; Strandell, I. The fatigue limit of bearing steels—Part I: A pragmatic approach to predict very high cycle fatigue strength. Int. J. Fatigue 2012, 38, 155–168. [Google Scholar] [CrossRef]
- Liu, Y.B.; Li, Y.D.; Li, S.X.; Yang, Z.G.; Chen, S.M.; Hui, W.J.; Weng, Y.Q. Prediction of the S-N curves of high-strength steels in the very high cycle fatigue regime. Int. J. Fatigue 2010, 32, 1351–1357. [Google Scholar] [CrossRef]

| Sample | C | Si | Mn | P | S | Cr | Ni | Cu | Mo |
|---|---|---|---|---|---|---|---|---|---|
| LF + RH | 1.05 | 0.29 | 0.31 | 0.014 | <0.005 | 1.42 | 0.014 | 0.058 | <0.010 |
| ESR | 1.02 | 0.25 | 0.35 | 0.009 | <0.005 | 1.50 | 0.027 | 0.042 | 0.020 |
| Sample | Ti | Al | N | O | As | Ca | Pb | Sb | Sn |
| LF + RH | 0.0012 | 0.025 | 0.0019 | 0.0004 | <0.0050 | 0.0006 | 0.0001 | 0.0004 | 0.0004 |
| ESR | 0.0014 | 0.018 | 0.0053 | 0.0010 | <0.0077 | <0.0050 | 0.0001 | 0.0012 | 0.00017 |
| Sample | Level | A | B | C | D | DS | B (TiN) | D (TiN) | DS (TiN) |
|---|---|---|---|---|---|---|---|---|---|
| LF + RH | thin thick | 0.5 0 | 0.5 0 | 0 0 | 0.5 0 | 1.0 | 0.5 0 | 0.5 0.5 | 1.0 |
| VIM + ESR | Thin thick | 0 0 | 0.5 0 | 0 0 | 0.5 0 | 1.0 | 0.5 0 | 0.5 0.5 | 1.0 |
| Constants | α | C1 | β | C2 | δ | γ |
|---|---|---|---|---|---|---|
| −1.47 | 8.13 × 10 59 | −16.91 | 3490 | 0.059 | 0.087 |
Publisher’s Note: MDPI stays neutral with regard to jurisdictional claims in published maps and institutional affiliations. |
© 2021 by the authors. Licensee MDPI, Basel, Switzerland. This article is an open access article distributed under the terms and conditions of the Creative Commons Attribution (CC BY) license (https://creativecommons.org/licenses/by/4.0/).
Share and Cite
An, X.; Shi, Z.; Xu, H.; Wang, C.; Wang, Y.; Cao, W.; Yu, J. Quantitative Examination of the Inclusion and the Rotated Bending Fatigue Behavior of SAE52100. Metals 2021, 11, 1502. https://doi.org/10.3390/met11101502
An X, Shi Z, Xu H, Wang C, Wang Y, Cao W, Yu J. Quantitative Examination of the Inclusion and the Rotated Bending Fatigue Behavior of SAE52100. Metals. 2021; 11(10):1502. https://doi.org/10.3390/met11101502
Chicago/Turabian StyleAn, Xueliang, Zhiyue Shi, Haifeng Xu, Cunyu Wang, Yuhui Wang, Wenquan Cao, and Jinku Yu. 2021. "Quantitative Examination of the Inclusion and the Rotated Bending Fatigue Behavior of SAE52100" Metals 11, no. 10: 1502. https://doi.org/10.3390/met11101502