Abstract
High entropy alloys (HEAs) containing multi-principal metallic constituents have attracted much attention. A good understanding of their hot-deformation behavior and recrystallization mechanism is the prerequisite for microstructures tuning and for optimizing mechanical performance. Here, the flow behavior and recrystallization mechanism of the N-doped and C-doped face-centered cubic phase HEAs are produced at high temperatures by hot-compression at 1123–1273 K, with strain rates of 0.1–0.001 s−1. Constitutive equations were successfully constructed to reveal flow behavior, and stress-strain curves were predicted using strain compensated polynomial functions. Discontinuous and continuous dynamic recrystallization proceeded concurrently when compressed at a low temperature and high strain rate, whereas discontinuous recrystallization, which occurs at primary grain boundaries, became predominant at a high temperature and low strain rate, significantly contributing to the refinement and homogenization of the grains. For this reason, a relatively high temperature and a low strain rate, in which the recrystallized grains exhibit equiaxed morphology and very weak texture, are more suitable for refining grains. The average size of the grains was approximately 10 μm. This study sheds light on grain optimization and mechanical properties through thermomechanical processing.
1. Introduction
Conventional alloys for load-bearing applications are generally designed based on one host metal with the minor addition of other alloying elements to optimize the microstructure and mechanical properties. The concept of high entropy alloys (HEAs) was first proposed in the year 2004 and broadened the realm of possibility for developing novel high-performance metallic materials [1,2]. HEAs contain more than four principal elements, where the atomic percentage of each element is between 5 at% and 35 at% [1,2]. Hereinto, the face-centered cubic (FCC) single-phase CoCrFeMnNi HEA, known as Cantor alloy, is one of the most promising candidates. The Cantor HEA shows an unprecedented combination of strength and ductility as well as excellent fracture toughness, particularly at cryogenic temperatures [2,3,4,5]. This exceptional mechanical performance is attributed to its low stacking fault energy (SFE, 25–30 mJ/m2) [6]. The SFE plays a crucially important role in the regulation of plastic deformation behavior and mechanical performance: a high SFE value (>45 mJ/m2) results in dislocation slip and the formation of dislocation cells during deformation; an intermediate SFE value (15–45 mJ/m2) promotes the activation of deformation twinning, which increases strength and ductility in a process known as twinning-induced plasticity (TWIP); a low SFE value (<15 mJ/m2) stimulates the strain-induced displacive phase transformation from an FCC structure to an HCP (hexagonal close-packed) structure, which elevates the strength and ductility because of the transformation-induced plasticity (TRIP) effect [7,8,9,10,11,12]. For this reason, the Cantor HEA exhibits high strength and large ductility with the assistance of the TWIP effect.
Furthermore, the CoCrNi medium entropy alloy (MEA), a derivative of the Cantor alloy, was proposed soon afterward, which exhibits a further enhanced mechanical performance due to its reduced SFE (18 mJ/m2) [6]. As mentioned above, it is reasonable to optimize the mechanical properties of HEAs and MEAs by regulating the SFE. For this purpose, guidelines for regulating SFE in the Cantor, CoCrFeNi, and CoCrNi alloys have been recently proposed and use the combinatorial methods of first-principle calculations, thermodynamic predictions, and experimental verifications [8,9,10]. The results showed that an increase in the content of Co and Cr at the expense of Mn, Ni, and Fe in the Cantor alloy significantly reduces the SFE [9]. Similarly, the SFE and the stability of the FCC phase decrease when the Co concentration increases, but this also decreases the Fe and Ni concentrations; meanwhile, the elastic modulus, anisotropy, and lattice friction force increased as well [8]. Further, a minor addition of Mo could increase the lattice constant and decrease the SFE and elastic modulus [10]. Based on these findings, a series of novel high-performance Co-rich non-equiatomic HEAs and MEAs were developed and exhibit tensile properties that are superior to other reported FCC single-phase HEAs or MEAs. The Co-rich HEAs/MEAs show an enhanced strain hardening behavior, which can be attributed to either the TWIP effect or the FCC → HCP TRIP effect [8,9,10]. Although hardening is improved, the yield strength of those alloys still needs to be elevated.
One of the more promising strategies is to introduce interstitial non-metal atoms (C, N, O) into the solid solutions of the metals, benefiting from the interstitial solid-solution strengthening and/or the short-range order/ordered complexes [13,14,15,16,17]. Moreover, the yield strength could also be further enhanced by reducing the grain size, wherein fine grains result in a high yield strength, which is known as the Hall–Petch relation [18,19]. Nevertheless, cold processing is not appropriate for alloys with the TRIP effect due to the poor workability of the deformation-induced HCP-phase. For this reason, thermo-mechanical processing, which has been devoted to producing excellent products with precious dimensions and optimal mechanical properties, is an alternative candidate for refining the grain structures of hard materials [20,21,22,23]. In this process, the grains are refined by dynamic recrystallization (DRX) and/or static recrystallization (SRX) [20]. Deep insight into the hot-deformation mechanism, the microstructure evolution, and the DRX mechanism is a prerequisite for optimizing grain structures [20,21,22,23]. It was reported that discontinuous dynamic recrystallization (dDRX) notably contributed to grain refinement during hot-deformation, in which the recrystallized grains tend to nucleate at the primary grain boundaries (GBs) [14,24]. The apparent activation energy of the Cantor HEA is close to that of the diffusion of Ni in the alloy, and the dislocation climb determines the steady-state deformation [25,26,27,28,29,30,31,32]. Even though the DRX behaviors of CoCrNi MEA and the novel Co-rich TRIP HEA were investigated in our previous studies [14,24], the influence of interstitial atoms such as C and N on hot-deformation and grain structure evolution have not been clarified.
In the present study, we aimed to reveal the microstructure evolution, grain refinement, hot-deformation of C-doped and N-doped HEAs/MEAs by conducting hot-compression tests at various conditions and by constructing the corresponding constitutive relationships. The present study will shed light on the thermomechanical processing of interstitial solid-solution strengthened HEAs and MEAs in order to optimize grain structure and mechanical properties.
2. Materials and Methods
In the present study, the quaternary TRIP-HEA with a nominal composition of Co45Cr25Fe15Ni15 (at.%) was selected as the base-alloy, and the alloy was then doped with 0.1 wt.% C and 0.05% wt.% N. Ingots of the C-doped HEA and the N-doped HEA with a diameter of 50 mm were prepared by vacuum induction melting and casting. The as-casted ingots were forged at 1473 K to a cross-section of 30 × 30 mm2. Additionally, the forged samples were then homogenized at 1473 K for 24 h followed by water quenching to room temperature. The chemical composition of the two HEAs was Co44.41Cr23.7Fe14.5Ni17.3C0.09 (wt.%) for the C-doped HEA and Co44.55Cr23.605Fe14.6Ni17.2N0.045 (wt.%) for the N-doped HEA, which are close to the nominal compositions. Cylindrical specimens with a dimension of 8 mm (diameter) ×12 mm (height) were sliced from the ingots by means of electric discharge machining. The hot-deformation mechanism and the DRX behavior of the HEAs were measured by means of hot-compression tests using a Gleeble 1500 machine (Dynamic systems Inc., Poestenkill, New York, USA). During hot-compression, the temperature was monitored by thermocouples, and the friction between the specimens and anvils was minimized by using two thin mica foils. The compression was conducted under an Ar gas atmosphere.
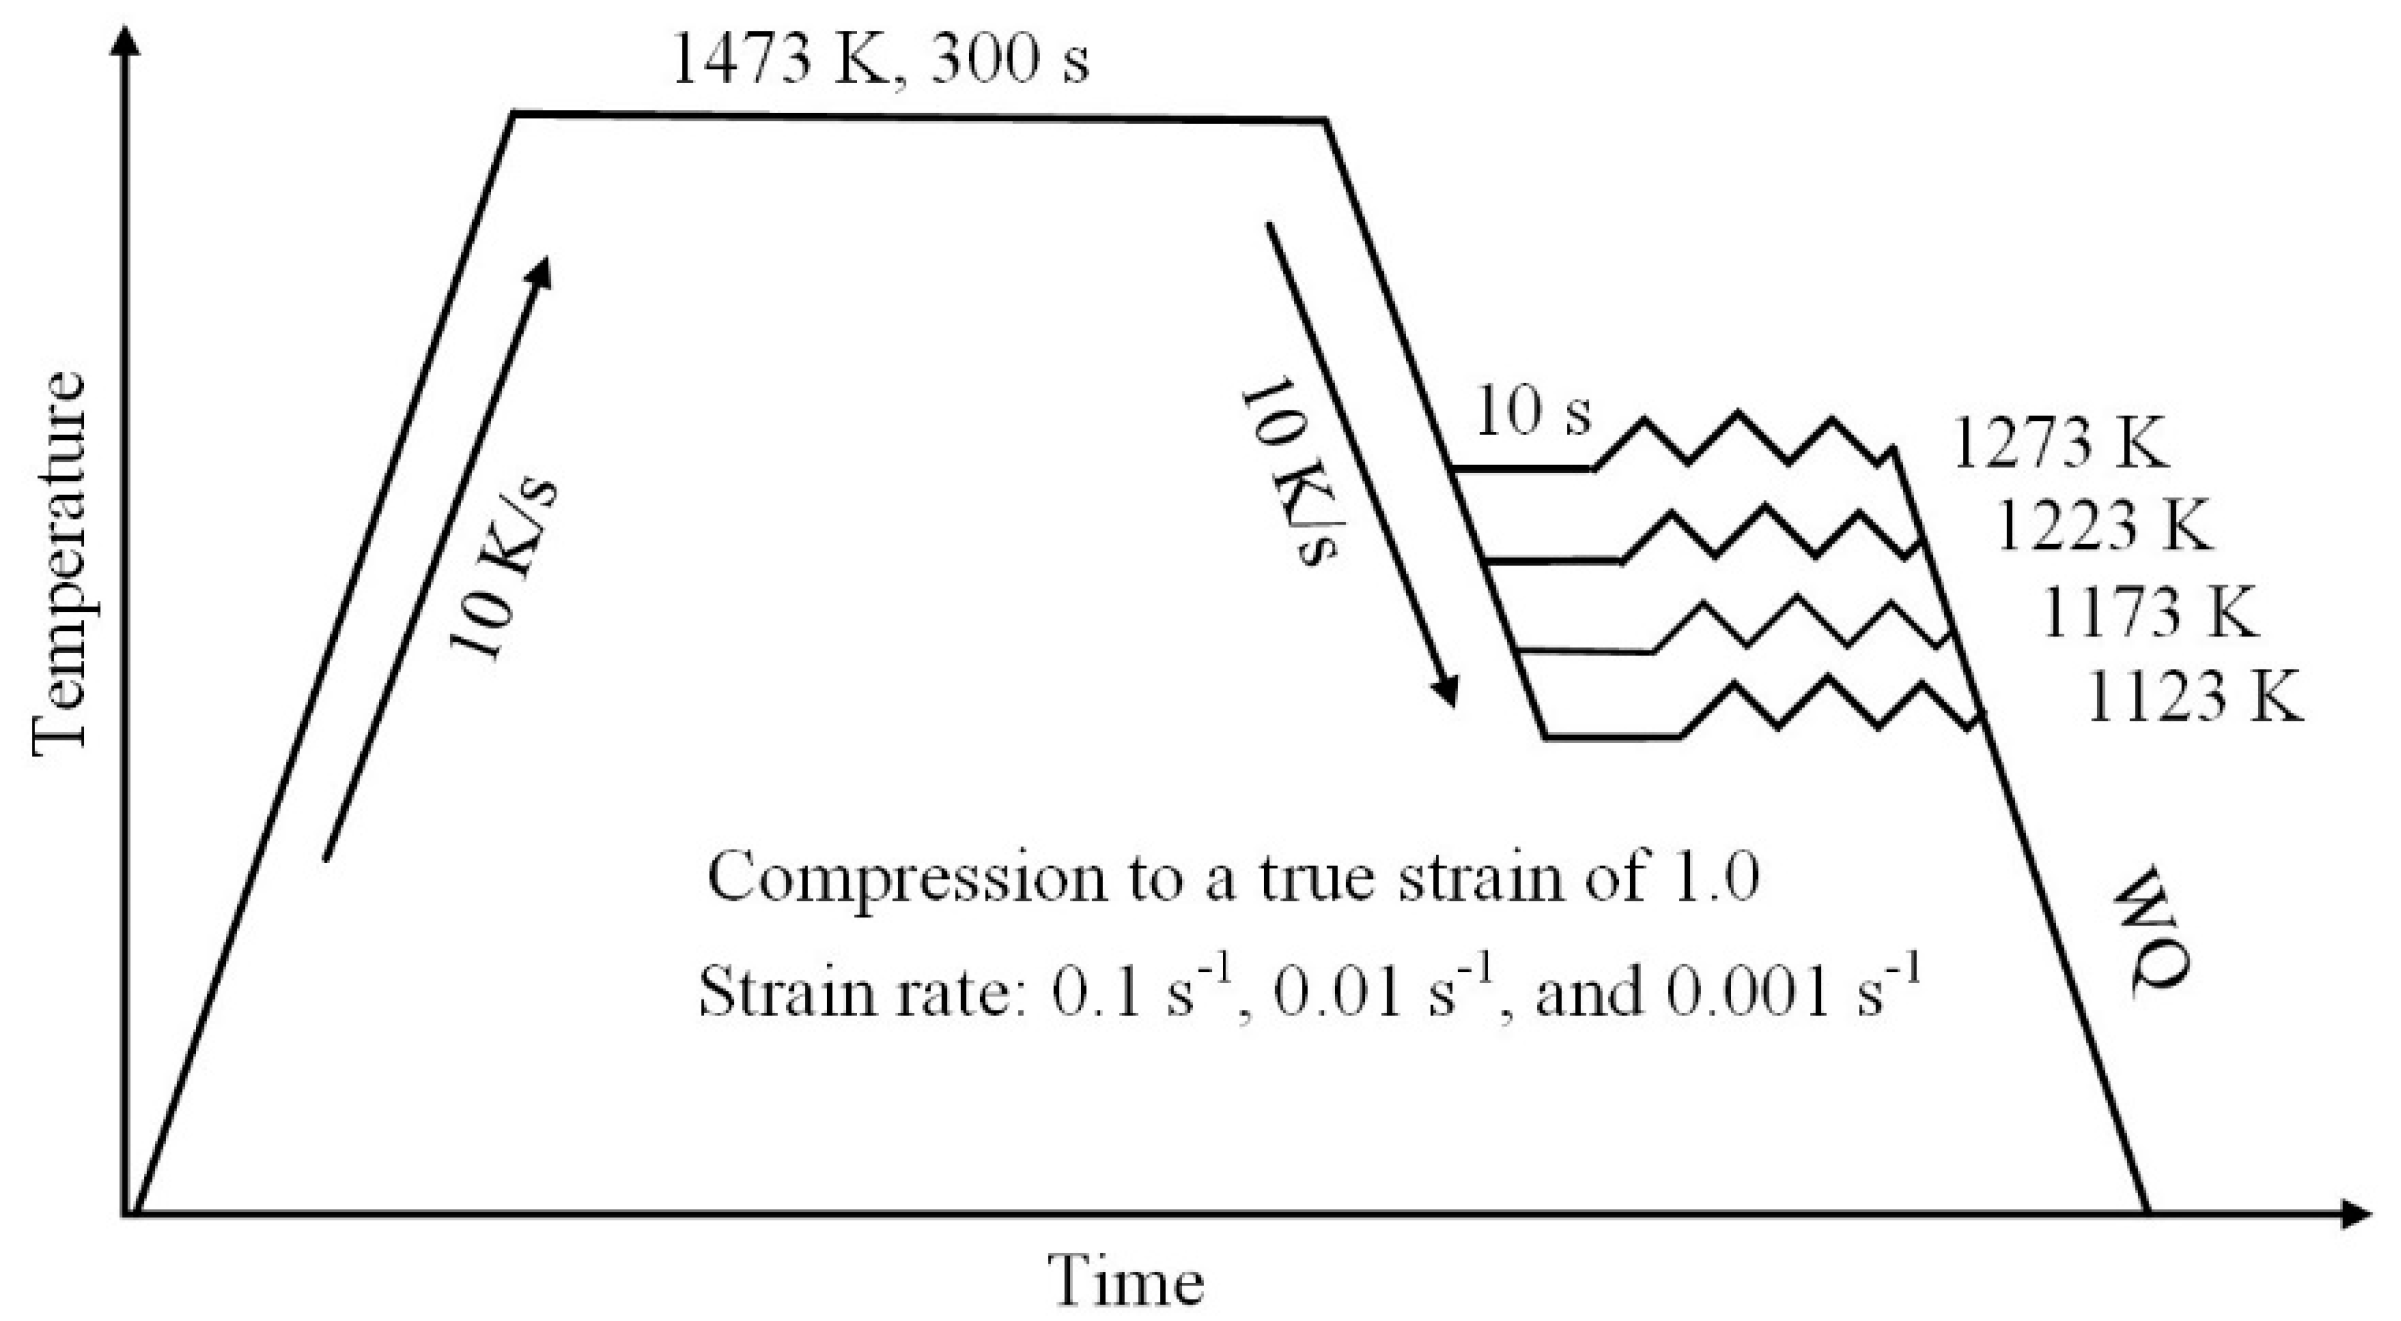
The experimental procedure of the hot-compression used in this research is schematically illustrated in Figure 1. The specimens were first heated up to 1473 K and held for 300 s for homogenization and were then cooled to the compression temperatures of 1123 K, 1173 K, 1223 K, and 1273 K at a cooling rate of 10 K/s. Each specimen was held at the desired temperature for 10 s before compression. After that, the specimens were compressed to a 63% reduction in height (an equivalent true strain of 1.0) at a strain rate of 0.1 s−1, 0.01 s−1, and 0.001 s−1. The compressed specimens were water-quenched immediately to room temperature within 15 s. More than three independent tests were repeated for each compression condition.

Figure 1.
The schematic diagram demonstrating the procedure for hot-compression tests of the C-doped and N-doped TRIP HEAs.
The microstructures of the hot-deformed specimens were characterized using a scanning electron microscope (SEM, Hitachi S-3400N, HITACHI, Tokyo, Japan) equipped with an electron backscatter diffraction (EBSD, OIM Analysis, AMETEK Inc., Berwyn, PA, USA) detector. An acceleration voltage of 20 kV was used for the observations. In the present study, the hot-deformed cylindrical specimens were sliced vertically through the center in a direction parallel to the loading axis. Then, the central regions were observed using SEM-EBSD. The surface of the specimens was polished with abrasive paper and were mirror-finished using a colloidal silica suspension (OP-U).
3. Results
3.1. Flow Behaviors during Hot-Compression
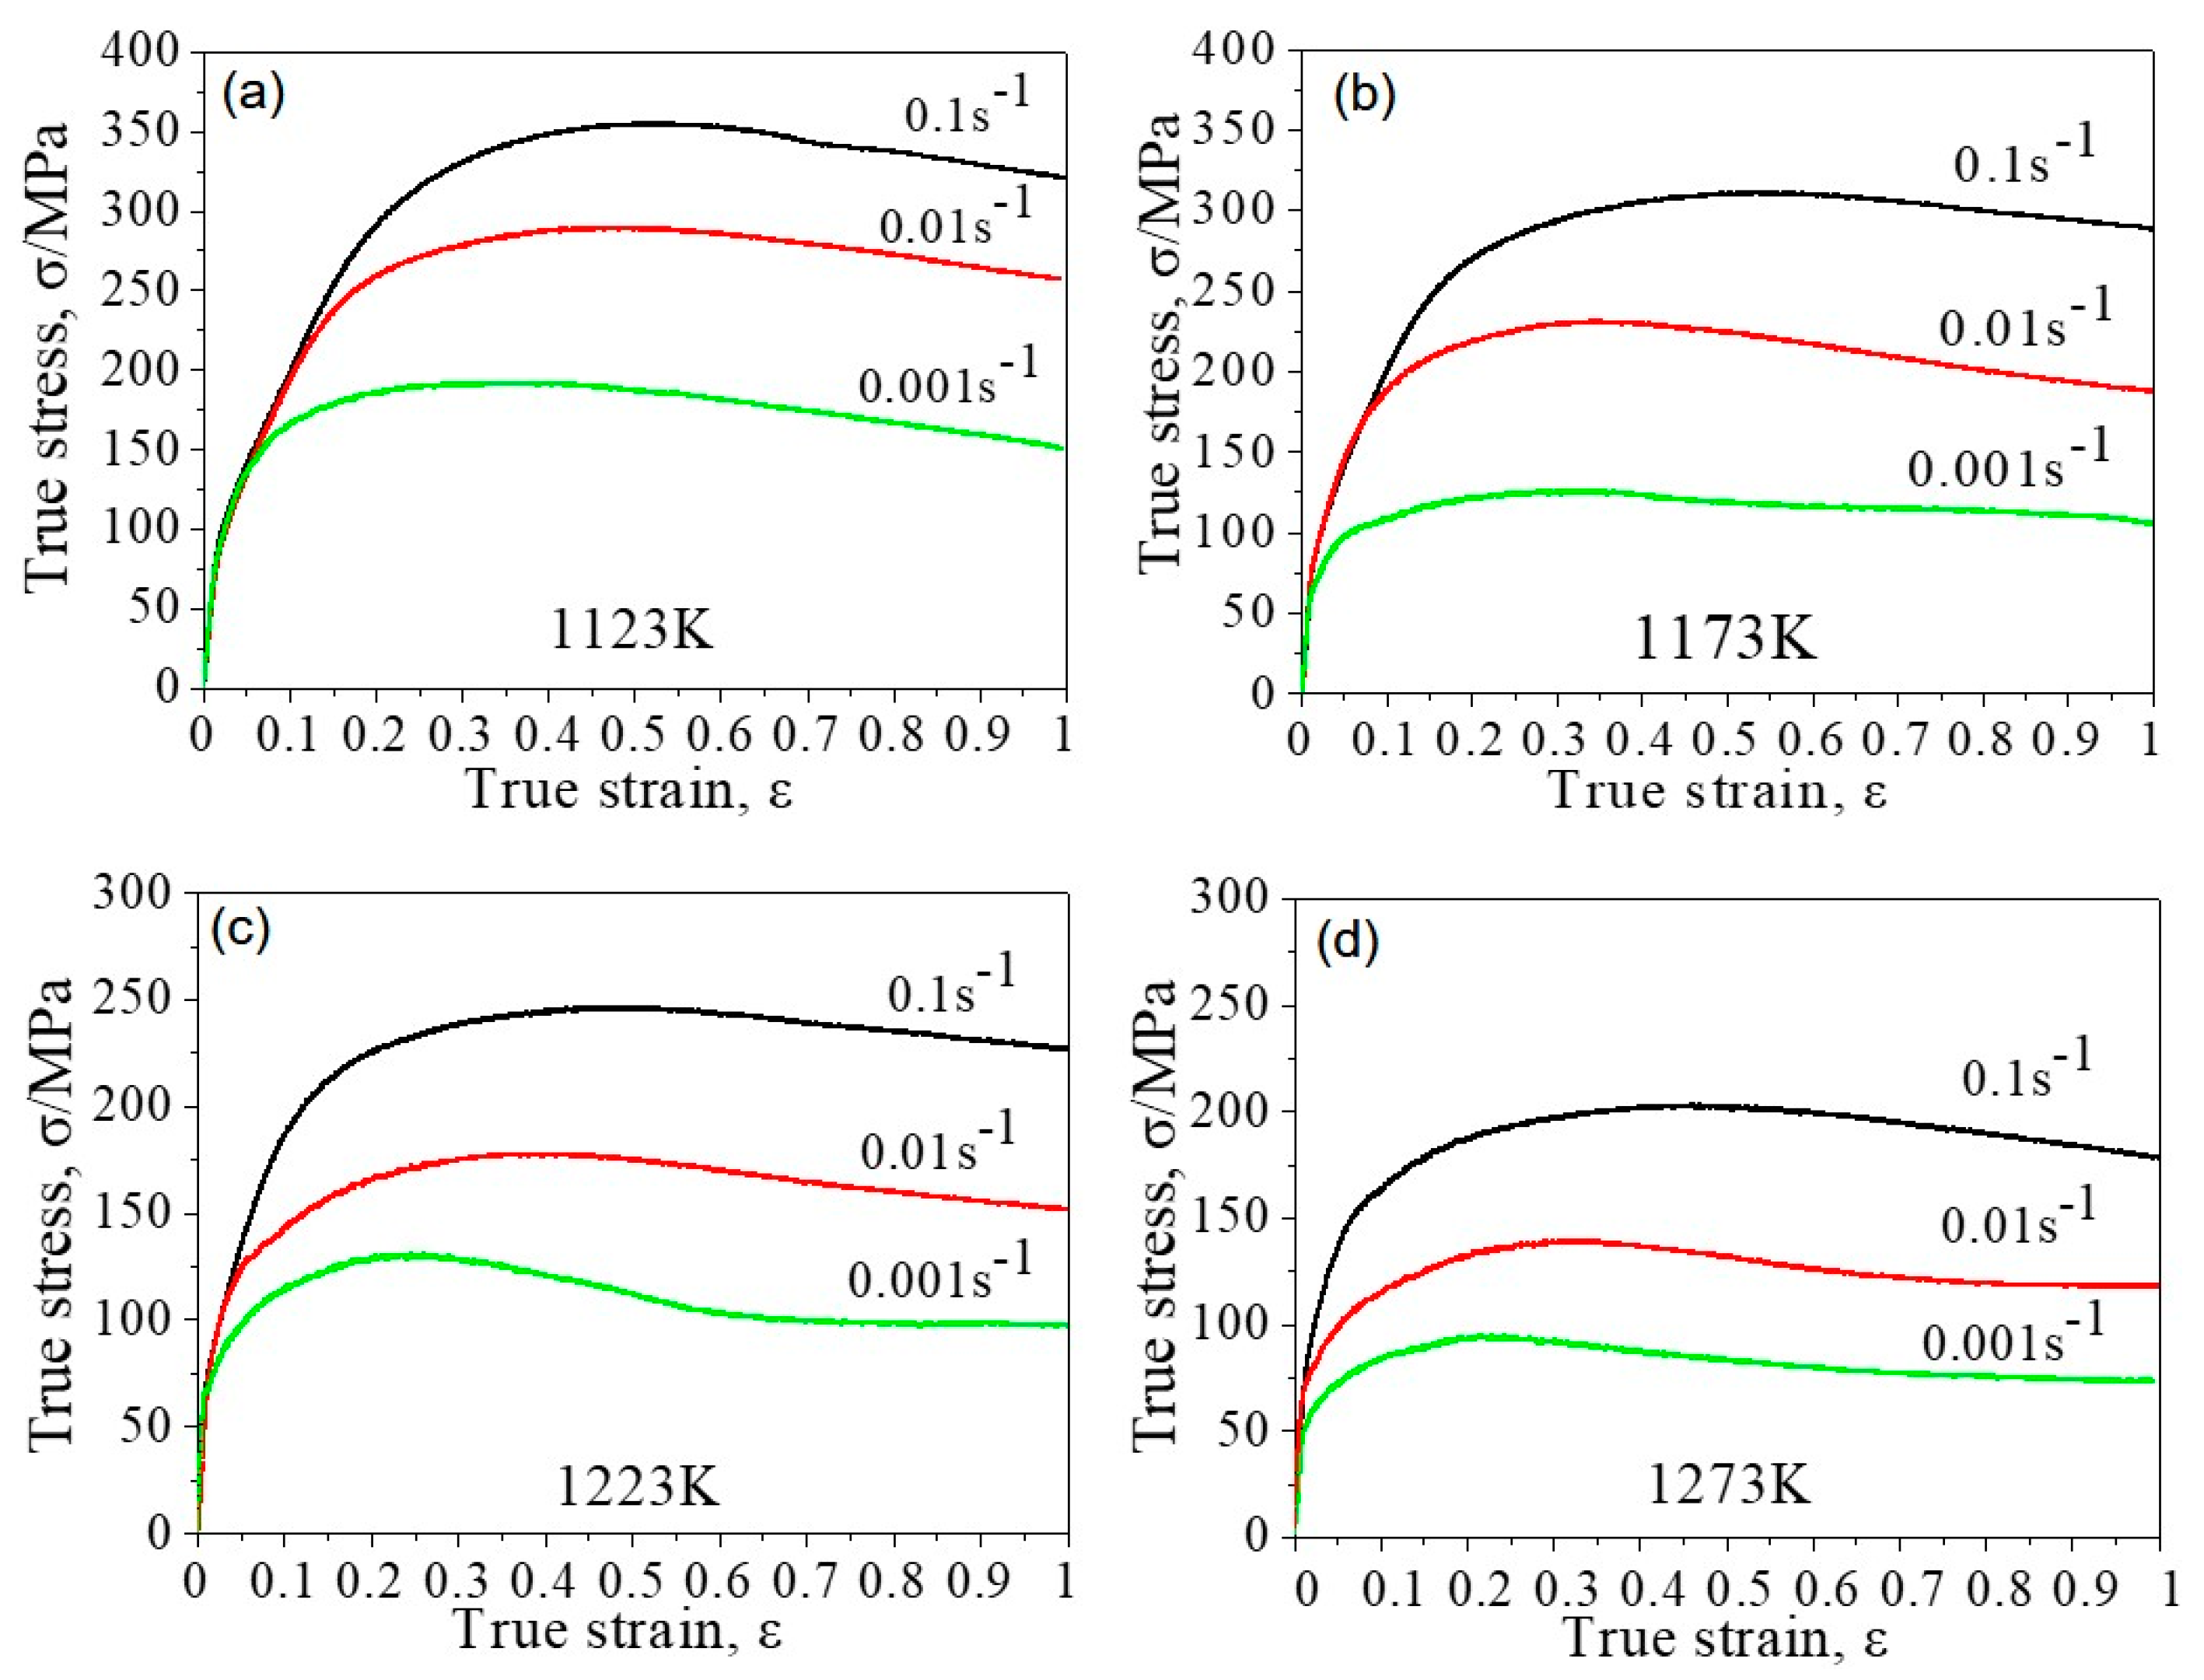
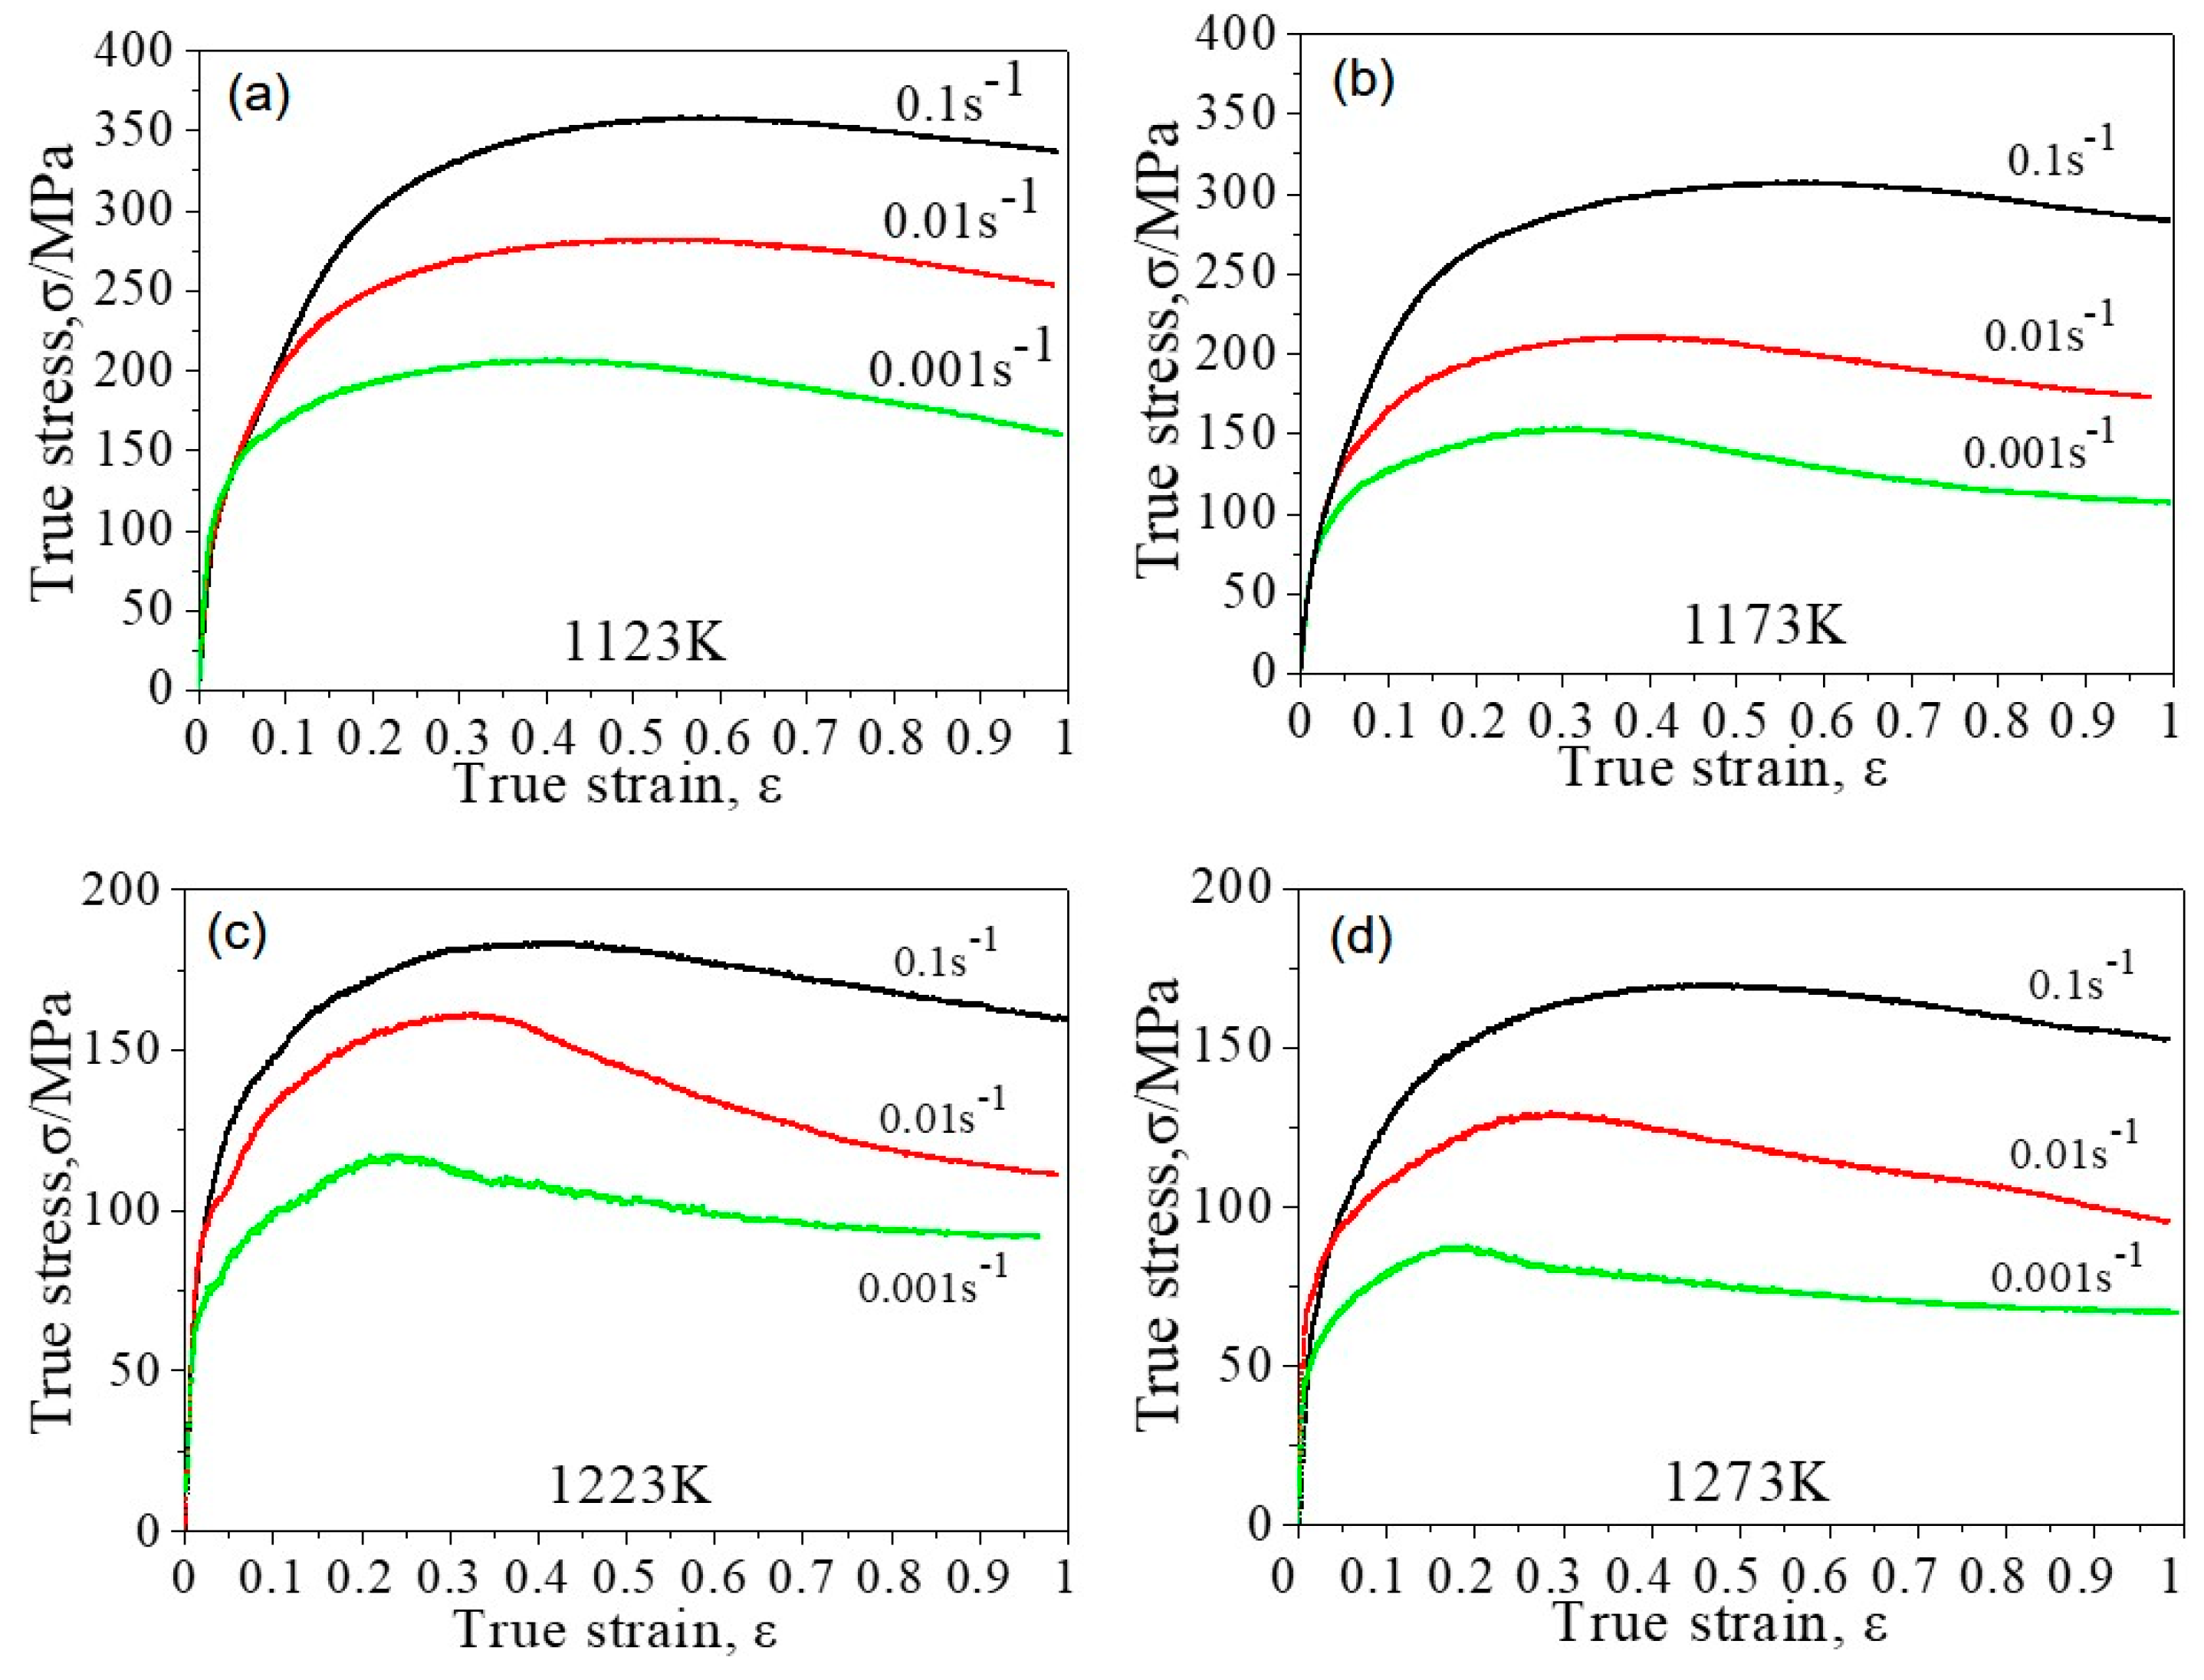
Figure 2 and Figure 3 show the compressive stress-strain (S-S) curves of the N-doped HEA (Figure 2) and the C-doped HEA (Figure 3) compressed at (a) 1123 K, (b) 1173 K, (c) 1223 K, (d) 1273 K with the strain rates of 0.1 s−1, 0.01 s−1, and 0.001 s−1, respectively. All of the S–S curves exhibit an analogous trend, in which the flow stress increases rapidly with the increase of strain at the initial stage of compression (hardening stage), and then the flow stress decreases with the increase of strain (softening stage) after a stress peak. At the hardening stage, the dislocation density increases with the increase of strain because the multiplication rate and dislocations storage are higher than those of the dynamic dislocation recovery. The forest of dislocations formed in the early stage inhibits the nucleation and motion of new dislocation, thus increasing the flow stress for further deformation until reaching a peak value. After the peak, the flow softening with the increase of strain can mainly be attributed to the dynamic recovery (DRV) of dislocations and/or DRX. The discontinuous yield behavior frequently reported in many HCP metals is not observed in the present FCC-phase HEAs [21,22,23]. On the other hand, the value of the peak flow stress tends to be increased by decreasing the temperature and/or by increasing the strain rate. It is because the multiplication of the dislocations competes with the DRV of the dislocations [20]. By decreasing the temperature and/or by increasing the strain rate, the DRV is inhibited because of the low mobility at a low temperature and the less time that is available for their recovery at a high strain rate. This leads to a high density of stored dislocations (high peak stress). In contrast, the DRV of the dislocations becomes more preferred by increasing the temperature (higher mobility of dislocations) and/or by decreasing the strain rate (longer time for recovery), which leads to reduced work hardening and a small peak stress value. it should be noted that the sharpened drops of the flow stress (Figure 3c,d) in the C-doped HEA were not observed in the N-doped HEA (Figure 2a–d).
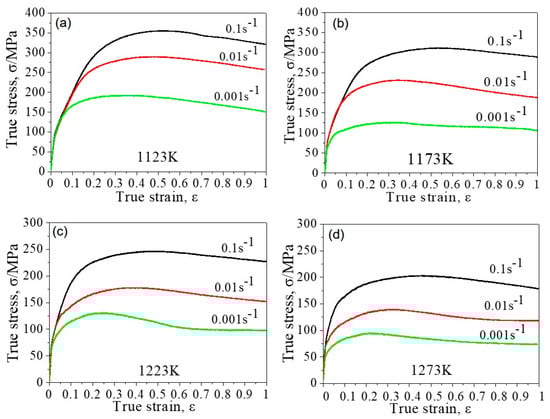
Figure 2.
True stress-strain curves of the N-doped HEA compressed at (a) 1123 K, (b) 1173 K, (c) 1223 K, and (d) 1273 K. The strain rates were 0.1 s−1, 0.01 s−1, and 0.001 s−1.
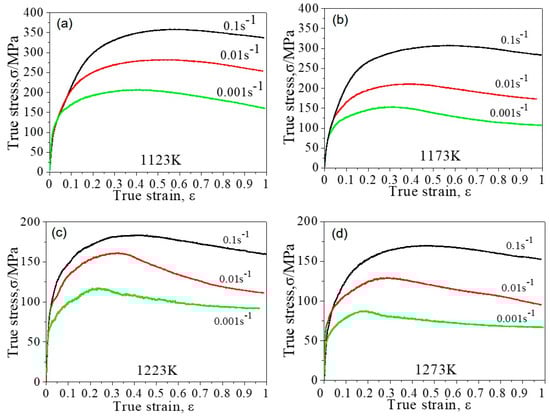
Figure 3.
True stress-strain curves of the C-doped HEA compressed at (a) 1123 K, (b) 1173 K, (c) 1223 K, and (d) 1273 K. The strain rates were 0.1 s−1, 0.01 s−1, and 0.001 s−1.
3.2. Constitutive Analysis
During hot deformation, the flow stress is affected by the temperature, strain rate, and strain. The correlation among these parameters can be expressed by using an appropriate constitutive equation. Here, the well-known Arrhenius type hyperbolic-sine relationship equations were used, which were first proposed by Sellars and Tegart [33,34,35,36]:
where is the strain rate (s−1);, , , (=), , , and . are material constants; σ is the flow stress (MPa); is the apparent activation energy for high-temperature deformation (J·mol−1); R is the gas constant (8.314 J·K−1mol−1); and T is the compression temperature (K). Equation (1) is suitable for low stress, and Equation (2) is applied for high stress. However, Equation (3) can be applied for all the deformation conditions. By taking the log function on both sides of Equations (1)–(3), the expressions become as follows:
According to Equations (4)–(6), the value of is calculated as 0.00581. Additionally, the values of and can then be calculated as follows:
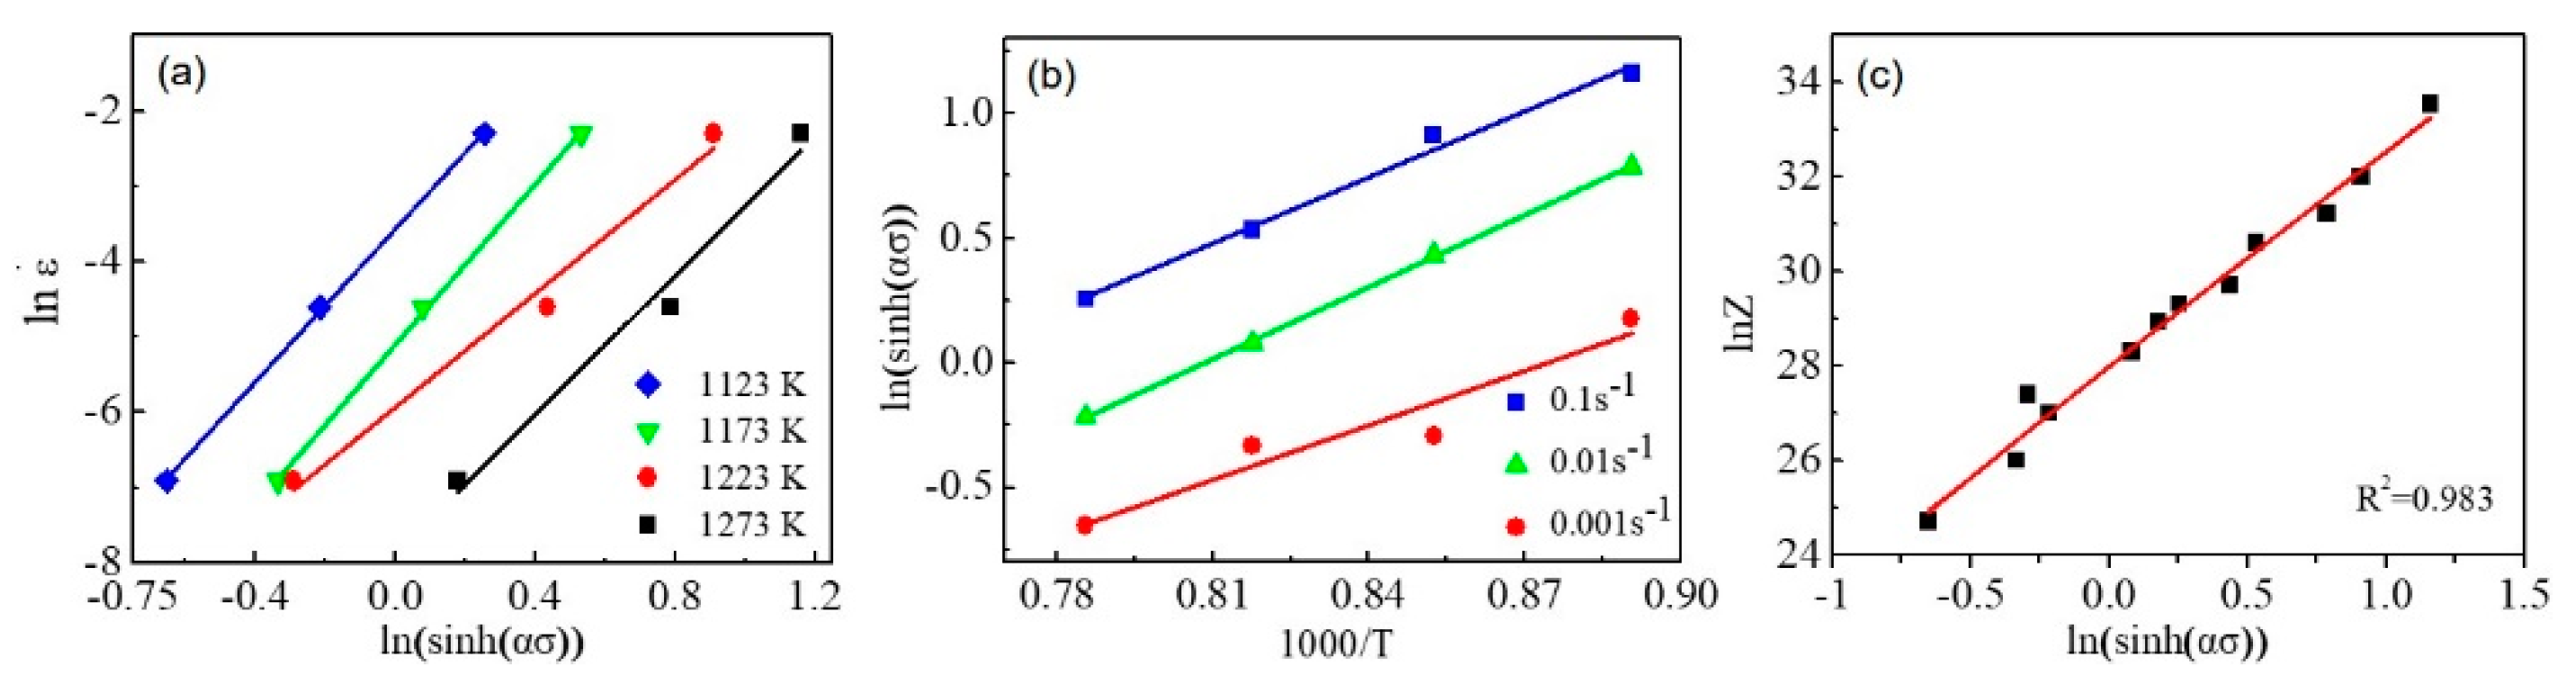
The values of the and at various temperatures are plotted and linearly fitted in Figure 4a, in which the average value of the slopes (n) was measured to be 4.69. Furthermore, the relationship between the value of and 1000/T is described in Figure 4b, in which the value of was determined to be 334685 J/mol.
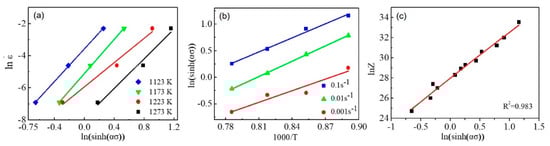
Figure 4.
The correlation of the values of the (a) ln and ln[sinh(ασ)], (b) ln[sinh(ασ)] and 1000/T, and (c) lnZ and ln[sinh(ασ)] of the N-doped HEA, which was compressed at 1123 K, 1173 K, 1223 K, and 1273 K. The strain rates were 0.1 s−1, 0.01 s−1, and 0.001 s−1. The correlations demonstrated in Figure 4a–c, are linearly fitted.
On the other hand, the temperature-compensated can be expressed by the simple Zener–Hollomon parameter (Z) [37,38]:
By comparing Equations (3) and (9) and by taking the log function on both sides, we achieve
The correlation between the values of lnZ and is plotted and linearly fitted, as shown in Figure 4c. The fitting coefficient is 0.983, which reveals a significant linear dependence. Additionally, the value of A was then determined to be 1.42 × 10¹². Finally, the constitutive relationship, which describes the hot deformation behavior of the N-doped HEA at a temperature of 1123–1273 K and a strain rate of 0.001–0.1 s−1, is as follows:
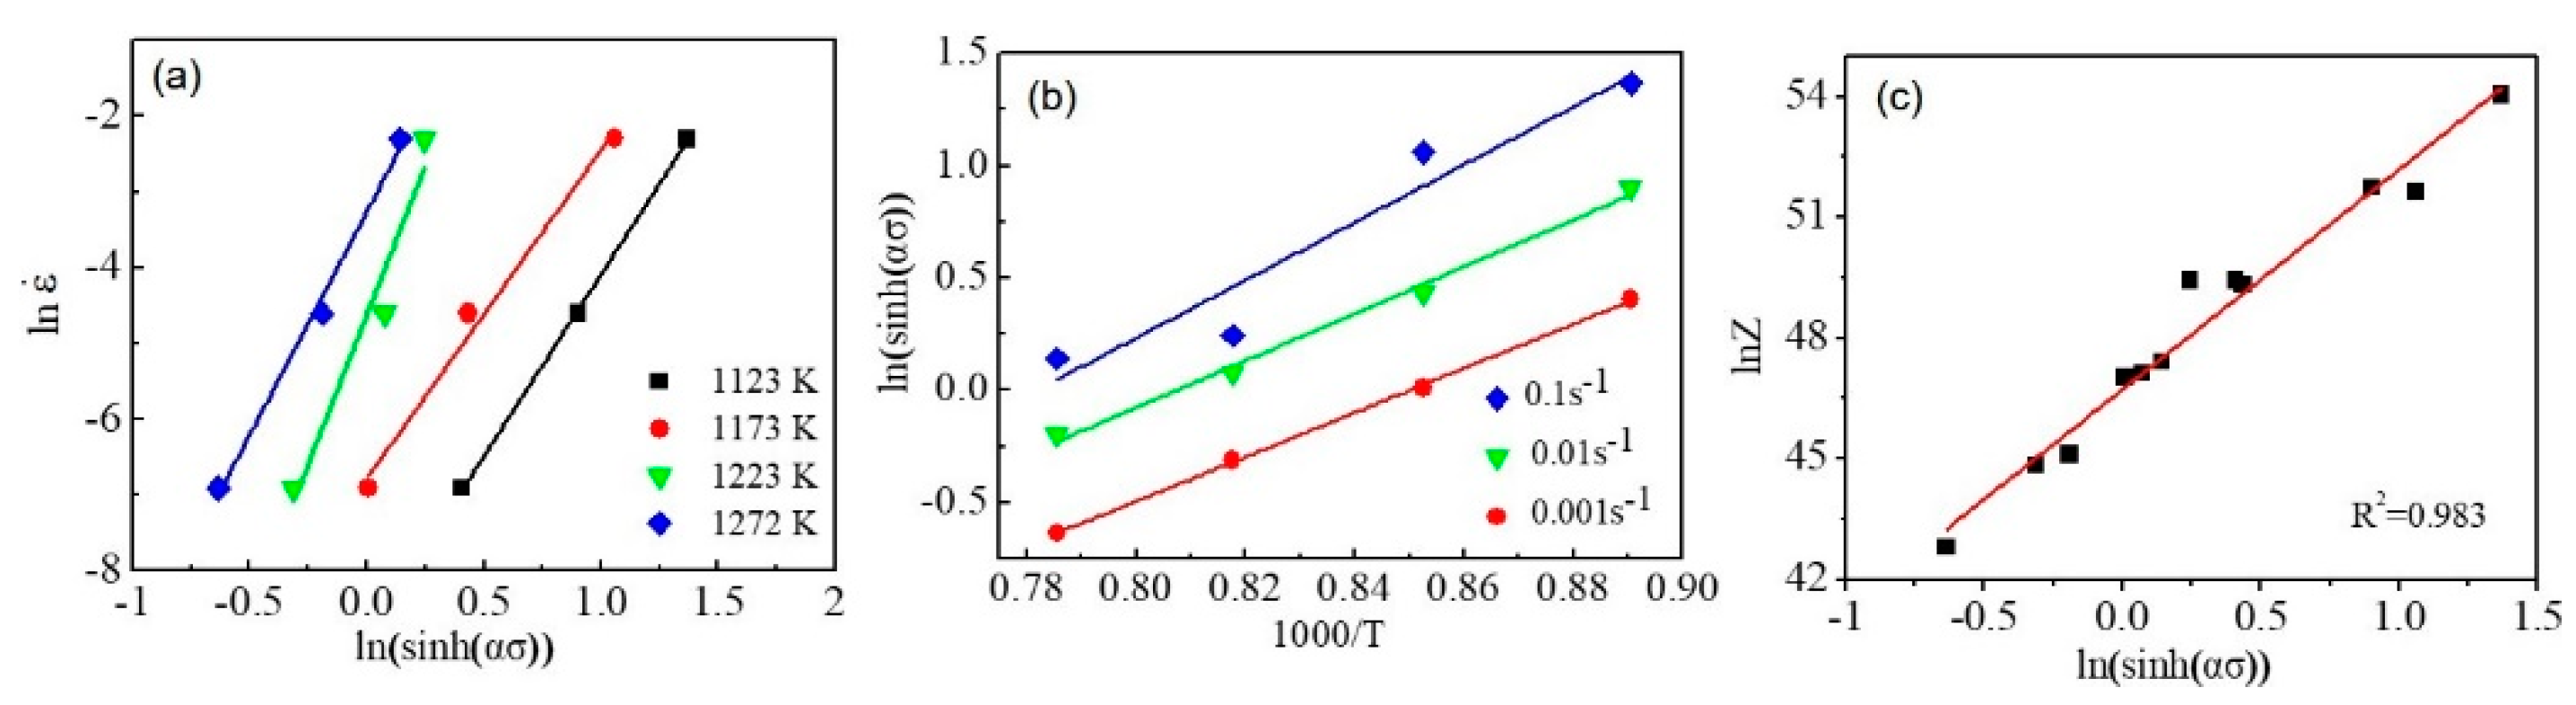
Moreover, we utilized the same procedure to determine the value of , , and A for the C-doped HEA, as demonstrated in Figure 5. After careful plotting and linear-fitting, the average value of the slopes () was measured to be 5.72 (Figure 5a). The correlation of the and 1000/T at different strain rates were plotted and linearly fitted as shown in Figure 5b. The value of was measured to be 526078 J/mol. The linear fitting coefficient between the lnZ and is 0.983, which also demonstrates an obvious linear dependence. The value of A was calculated to be 1.97 × 10²⁰. Eventually, the constitutive relationship, which describes the hot-deformation behavior of the C-doped HEA, can be expressed as follows:
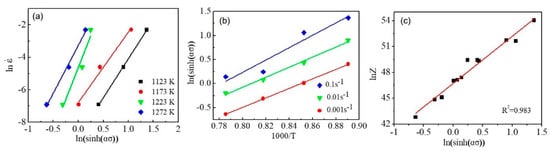
Figure 5.
The correlation of the values of the (a) ln
and ln[sinh(ασ)], (b) ln[sinh(ασ)] and 1000/T, and (c) lnZ and ln[sinh(ασ)] of the C-doped HEA, which was compressed at 1123 K, 1173 K, 1223 K, and 1273 K. The strain rate is 0.1 s−1, 0.01 s−1, and 0.001 s−1. The data exhibit a good linear dependence, which is linearly fitted on the graphs.
The variation of the material constants (, , , and ) with strain could be regressed by polynomial functions, in which the material parameters exhibit a significant dependence on the strain. To accurately predict the flow stress of materials, the strain compensation should be taken into account when evaluating the constitutive equations. For this reason, we utilized fifth-order polynomial functions to fit the experimental data as described in detail in other work [39,40]. Here, the procedure was implemented at a strain of 0.1–0.9 with an interval of 0.05. Once the material parameters with the strain compensation were evaluated, the flow stress at a given strain could be predicted. In the present study, the polynomial functions were obtained and expressed as Equation (13) for the N-doped and as Equation (14) for the C-doped HEAs.
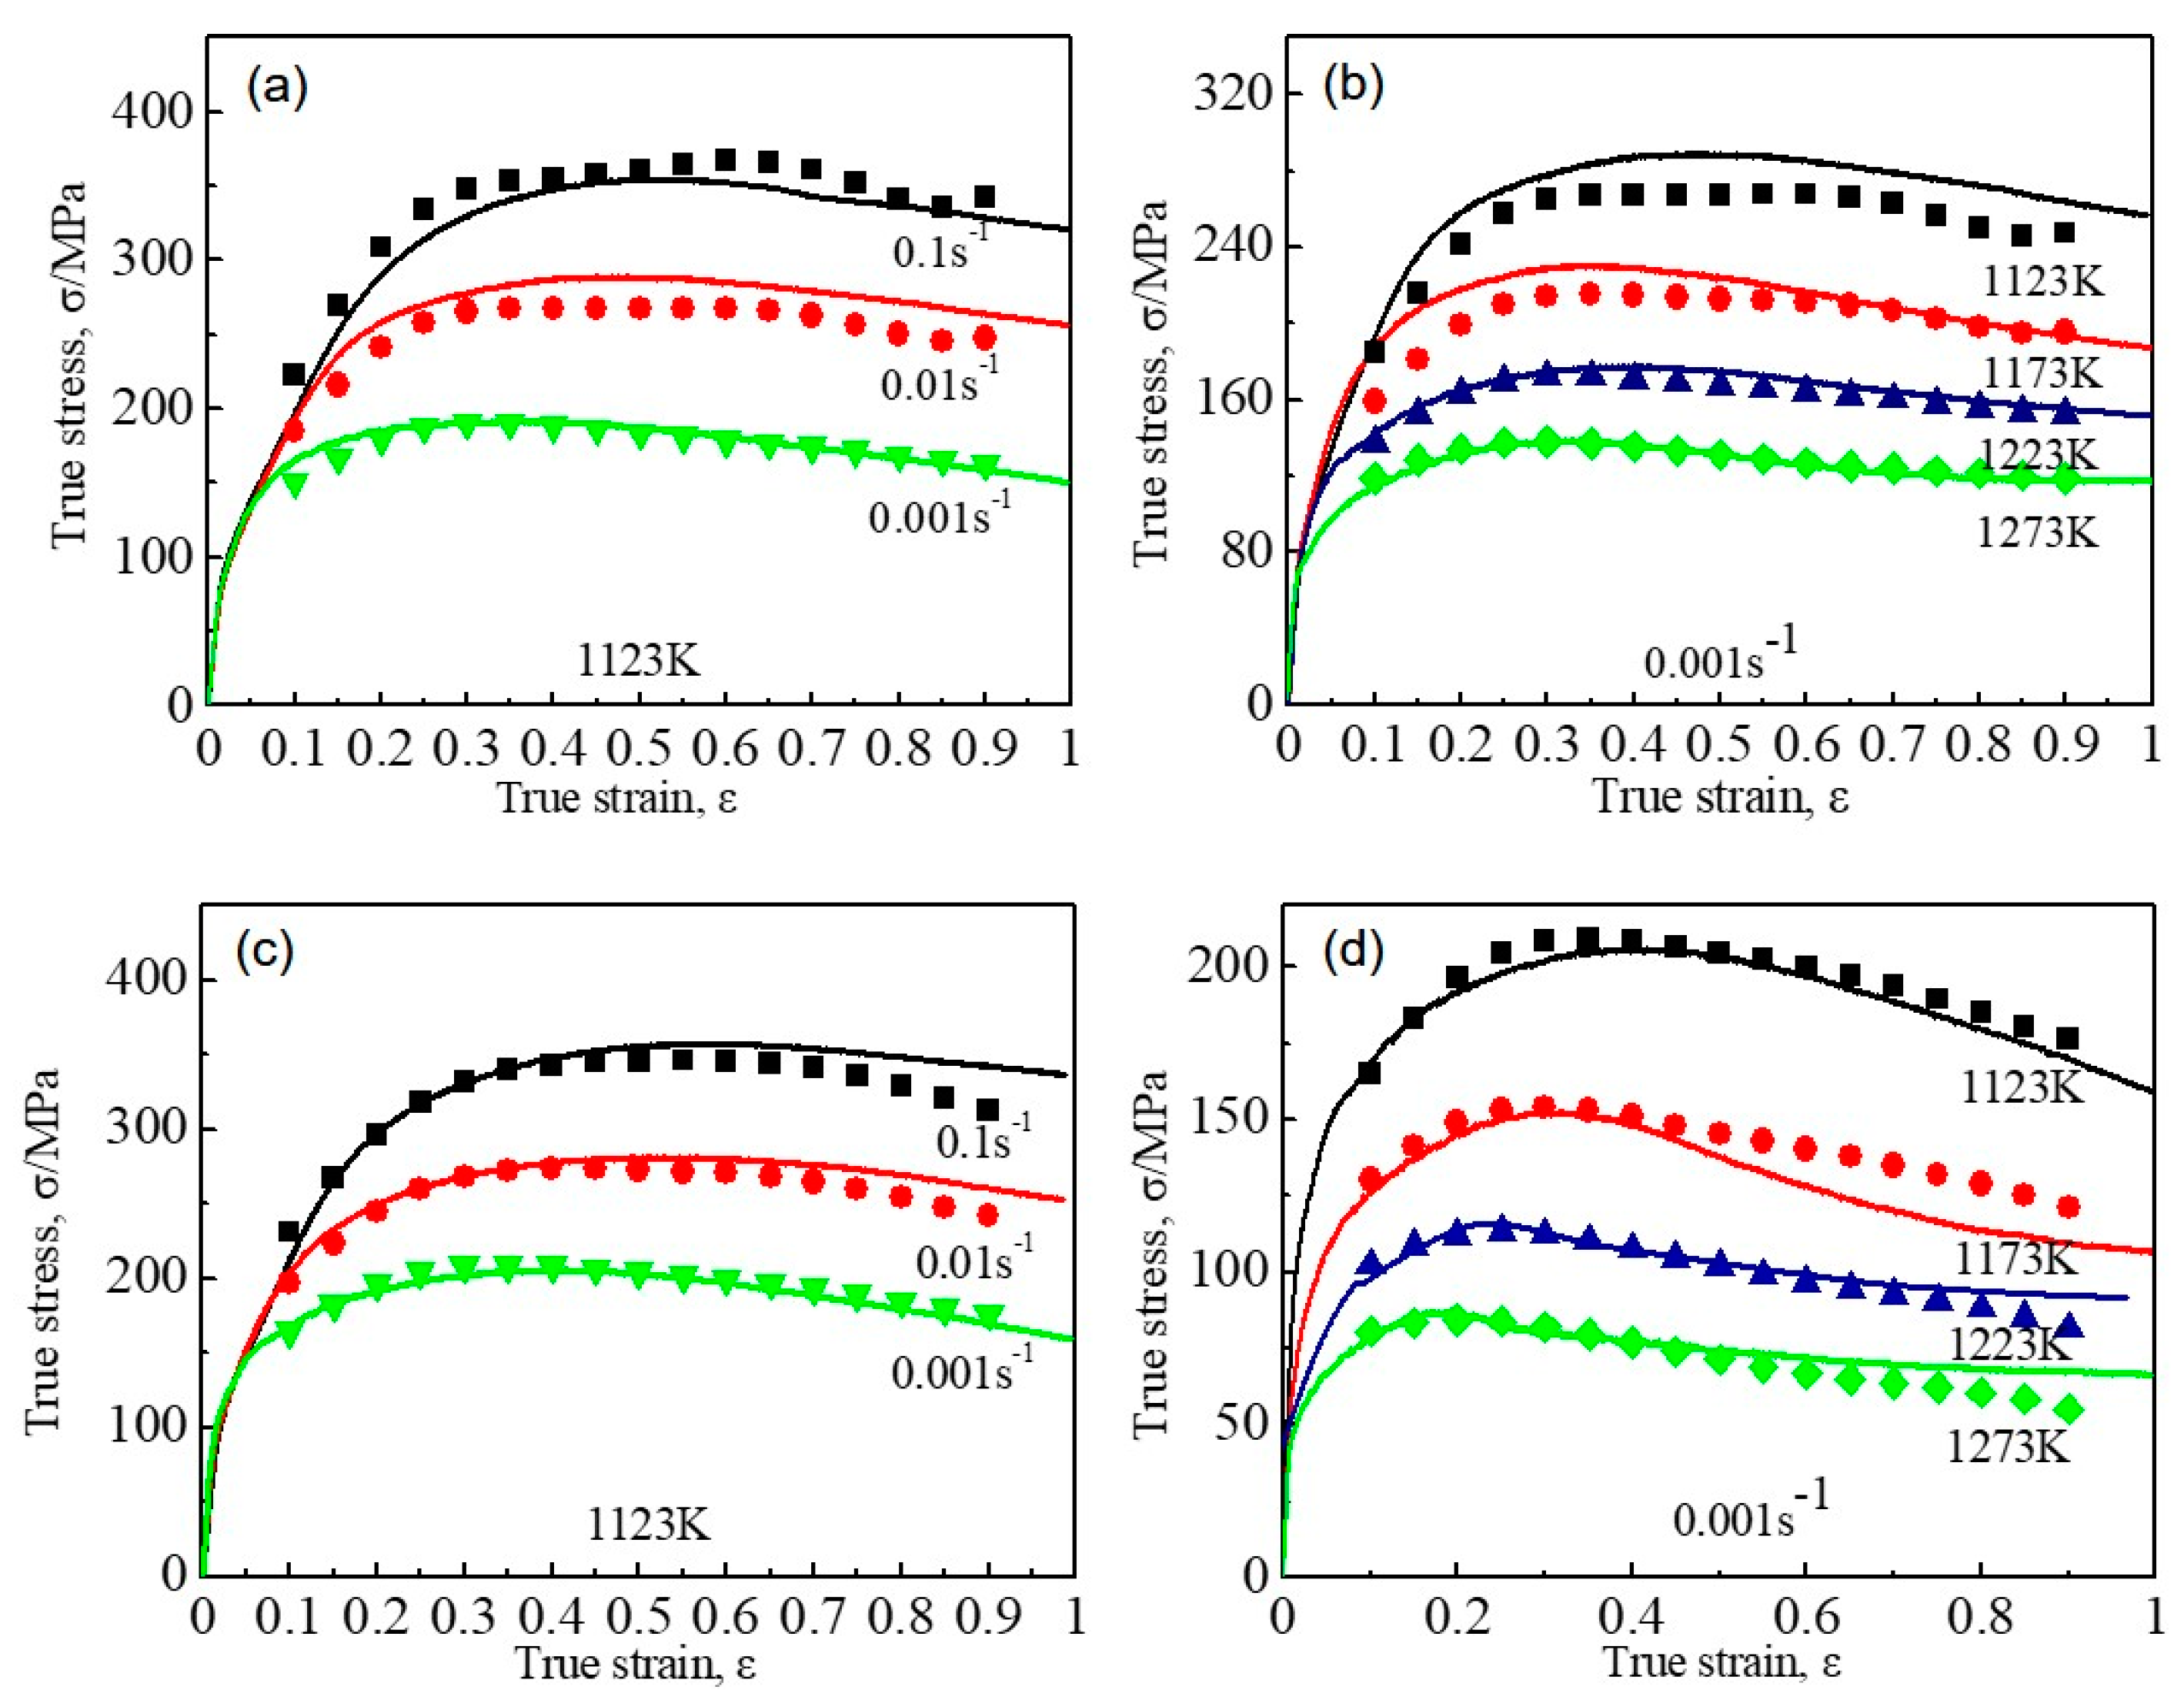
To verify the accuracy of the constructed constitutive models with strain compensation, the experimentally measured flow stress and the predicted flow stress at a wide range of strains were plotted and compared in Figure 6. Figure 6a shows the comparison of the S–S curves of the N-doped HEA at 1123 K and the various strain rates of N-doped HEA, while Figure 6b compares the S–S curves at a strain rate of 0.001 s−1 and a temperature of 1123 K, 1173 K, 1223 K, and 1273 K. Figure 6c,d demonstrate the comparison of the S–S curves of the C-doped HEA under the same conditions as described in Figure 6a,b. All of the results indicate that the constitutive model efficiently predicted the flow stress over the entire range of conditions. The majority of the predicted values lie fairly close to the best regression line, in which the square correlation coefficients () are 0.981 for the N-doped HEA and 0.994 for the C-doped HEA, indicating a good agreement of the predicted and experimental data. The and represent the experimentally measured value and the predicted value obtained from the constitutive models. The and are the mean value of the and . Moreover, the average absolute relative errors () between the predicted and measured values for the entire range of deformation parameters is 4.49% (N-doped HEA) and 5.97% (C-doped HEA), respectively. Therefore, one can conclude that our developed constitutive model can effectively predict the high-temperature flow behavior of both the N-doped HEA and the C-doped HEA.
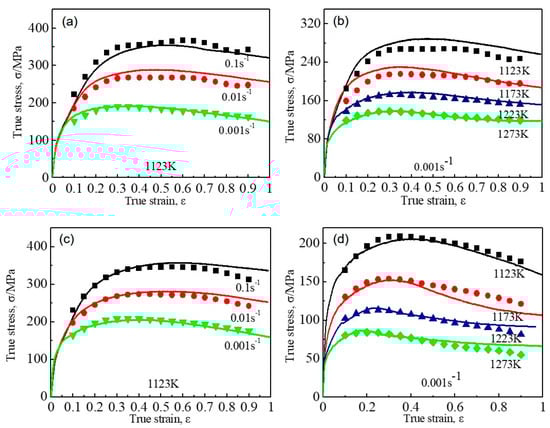
Figure 6.
Comparison of experimentally measured results and the modally predicated (dotted) for the N-doped HEA (a,b) compressed at (a) 1123 K with various strain rates and (b) at a strain rate of 0.001 s−1 under various temperatures. (c,d) The comparison for the C-doped HEA under conditions that are the same as those in (a,b).
3.3. Microstructure after Hot Compression
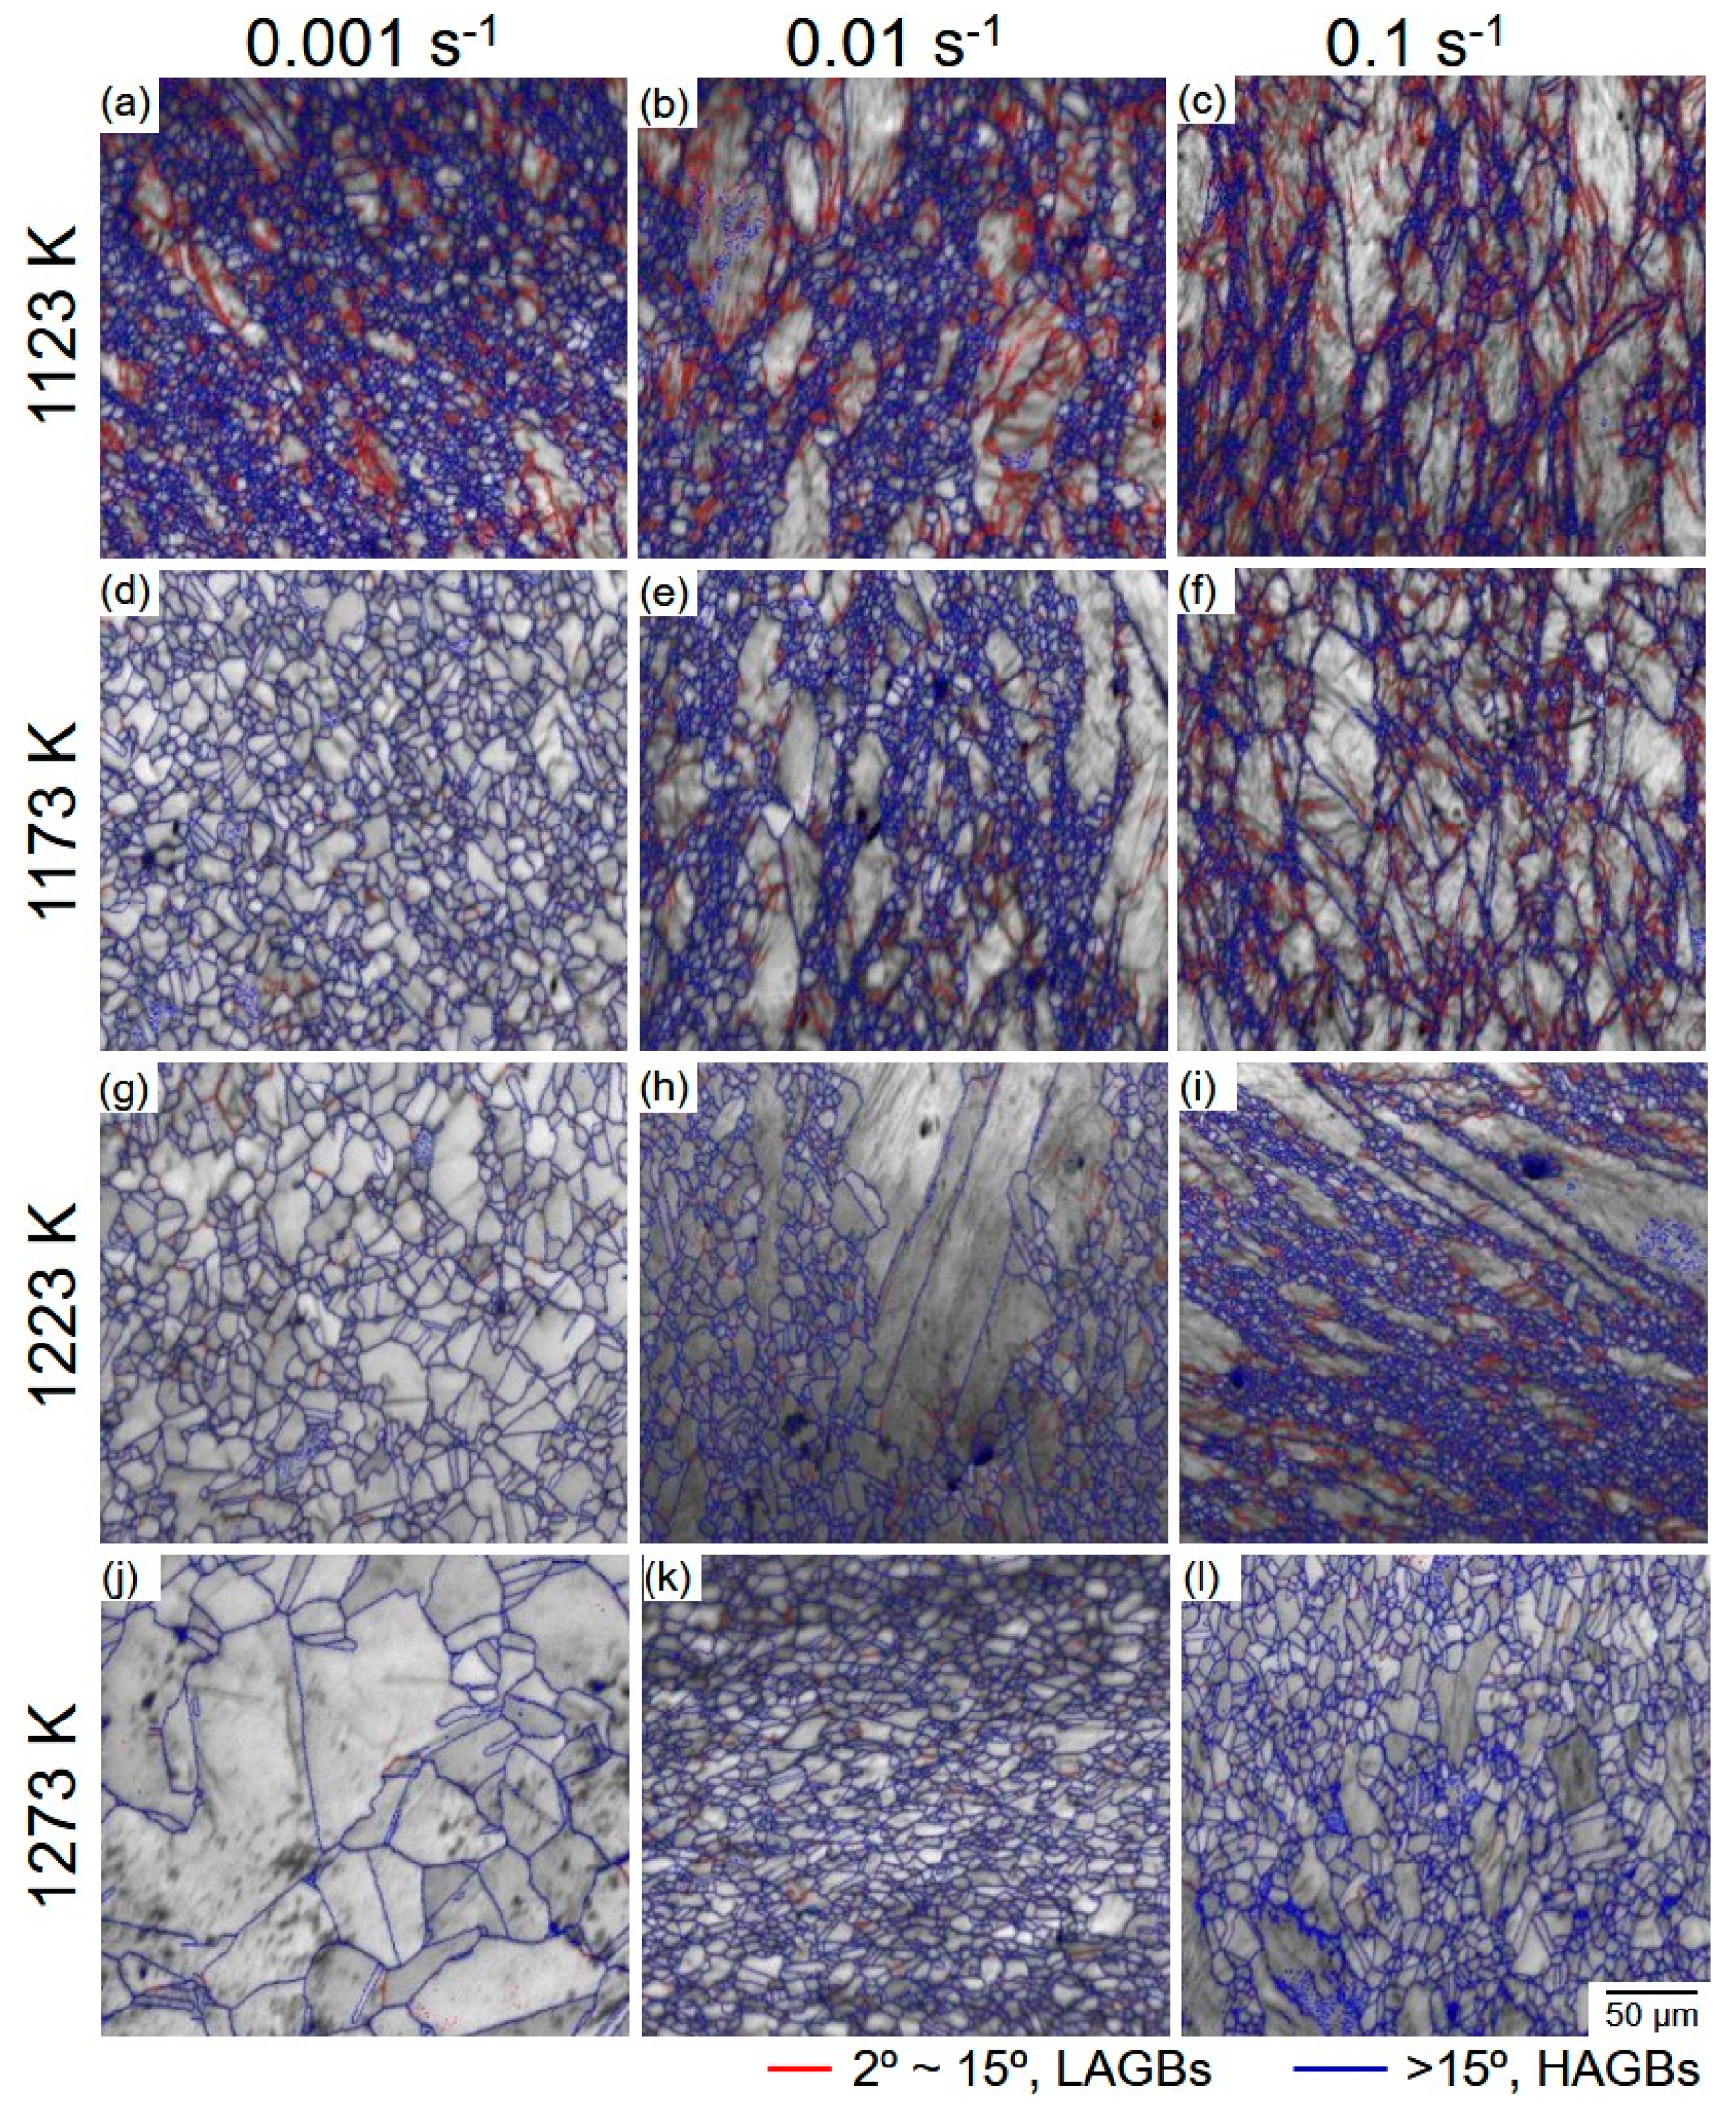
Figure 7 shows the EBSD image quality (IQ) maps of the N-doped HEAs compressed at 1123 K (a–c), 1173 K (d–f), 1223 K (g–i), and 1273 K (j–l), respectively. The blue lines in the maps illustrate the high-angle grain boundaries (HAGBs) with a misorientation angle larger than 15 °; meanwhile, the red lines show the low-angle grain boundaries (LAGBs) with misorientation angles of 2°–15°. When the HEA was compressed at a low temperature and/or at a high strain rate (Figure 7a–d,f,i,l), very fine grains were formed at the GBs of the primary coarse grains. Those fine grains were formed via dDRX, which forms a necklace structure with the primary coarse grains [27]. Further, the primary grains were elongated towards the metal flow direction, and then a large number of deformation-induced LAGBs were formed in the interior of the primary grains. This indicates that partial DRX at the GBs and the plastic deformation of primary grains proceeded at these compression conditions. However, a much larger fraction of the DRXed grains with both an equiaxed shape and fine size were obtained when the HEA was compressed at a higher temperature and/or lower strain rate (Figure 7g,h,j,k). The majority of the DRXed grains were enclosed by HAGBs, and annealing twins were frequently observed within the DRX grains due to the low SFE. In contrast, the fraction of LAGBs is very low at these conditions.
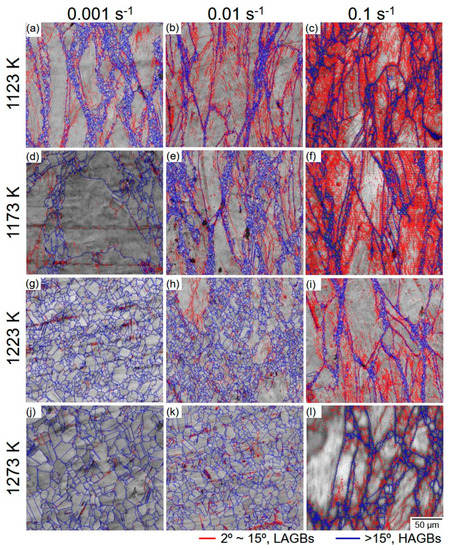
Figure 7.
EBSD image quality (IQ) maps of the N-doped HEA compressed at 1123 K (a–c), 1173 K (d–f), 1223 K (g–i), and 1273 K (j–l) with strain rates of 0.001 s−1 (a,d,g,j), 0.01 s−1 (b,e,h,k), and 0.1 s−1 (c,f,i,l), respectively.
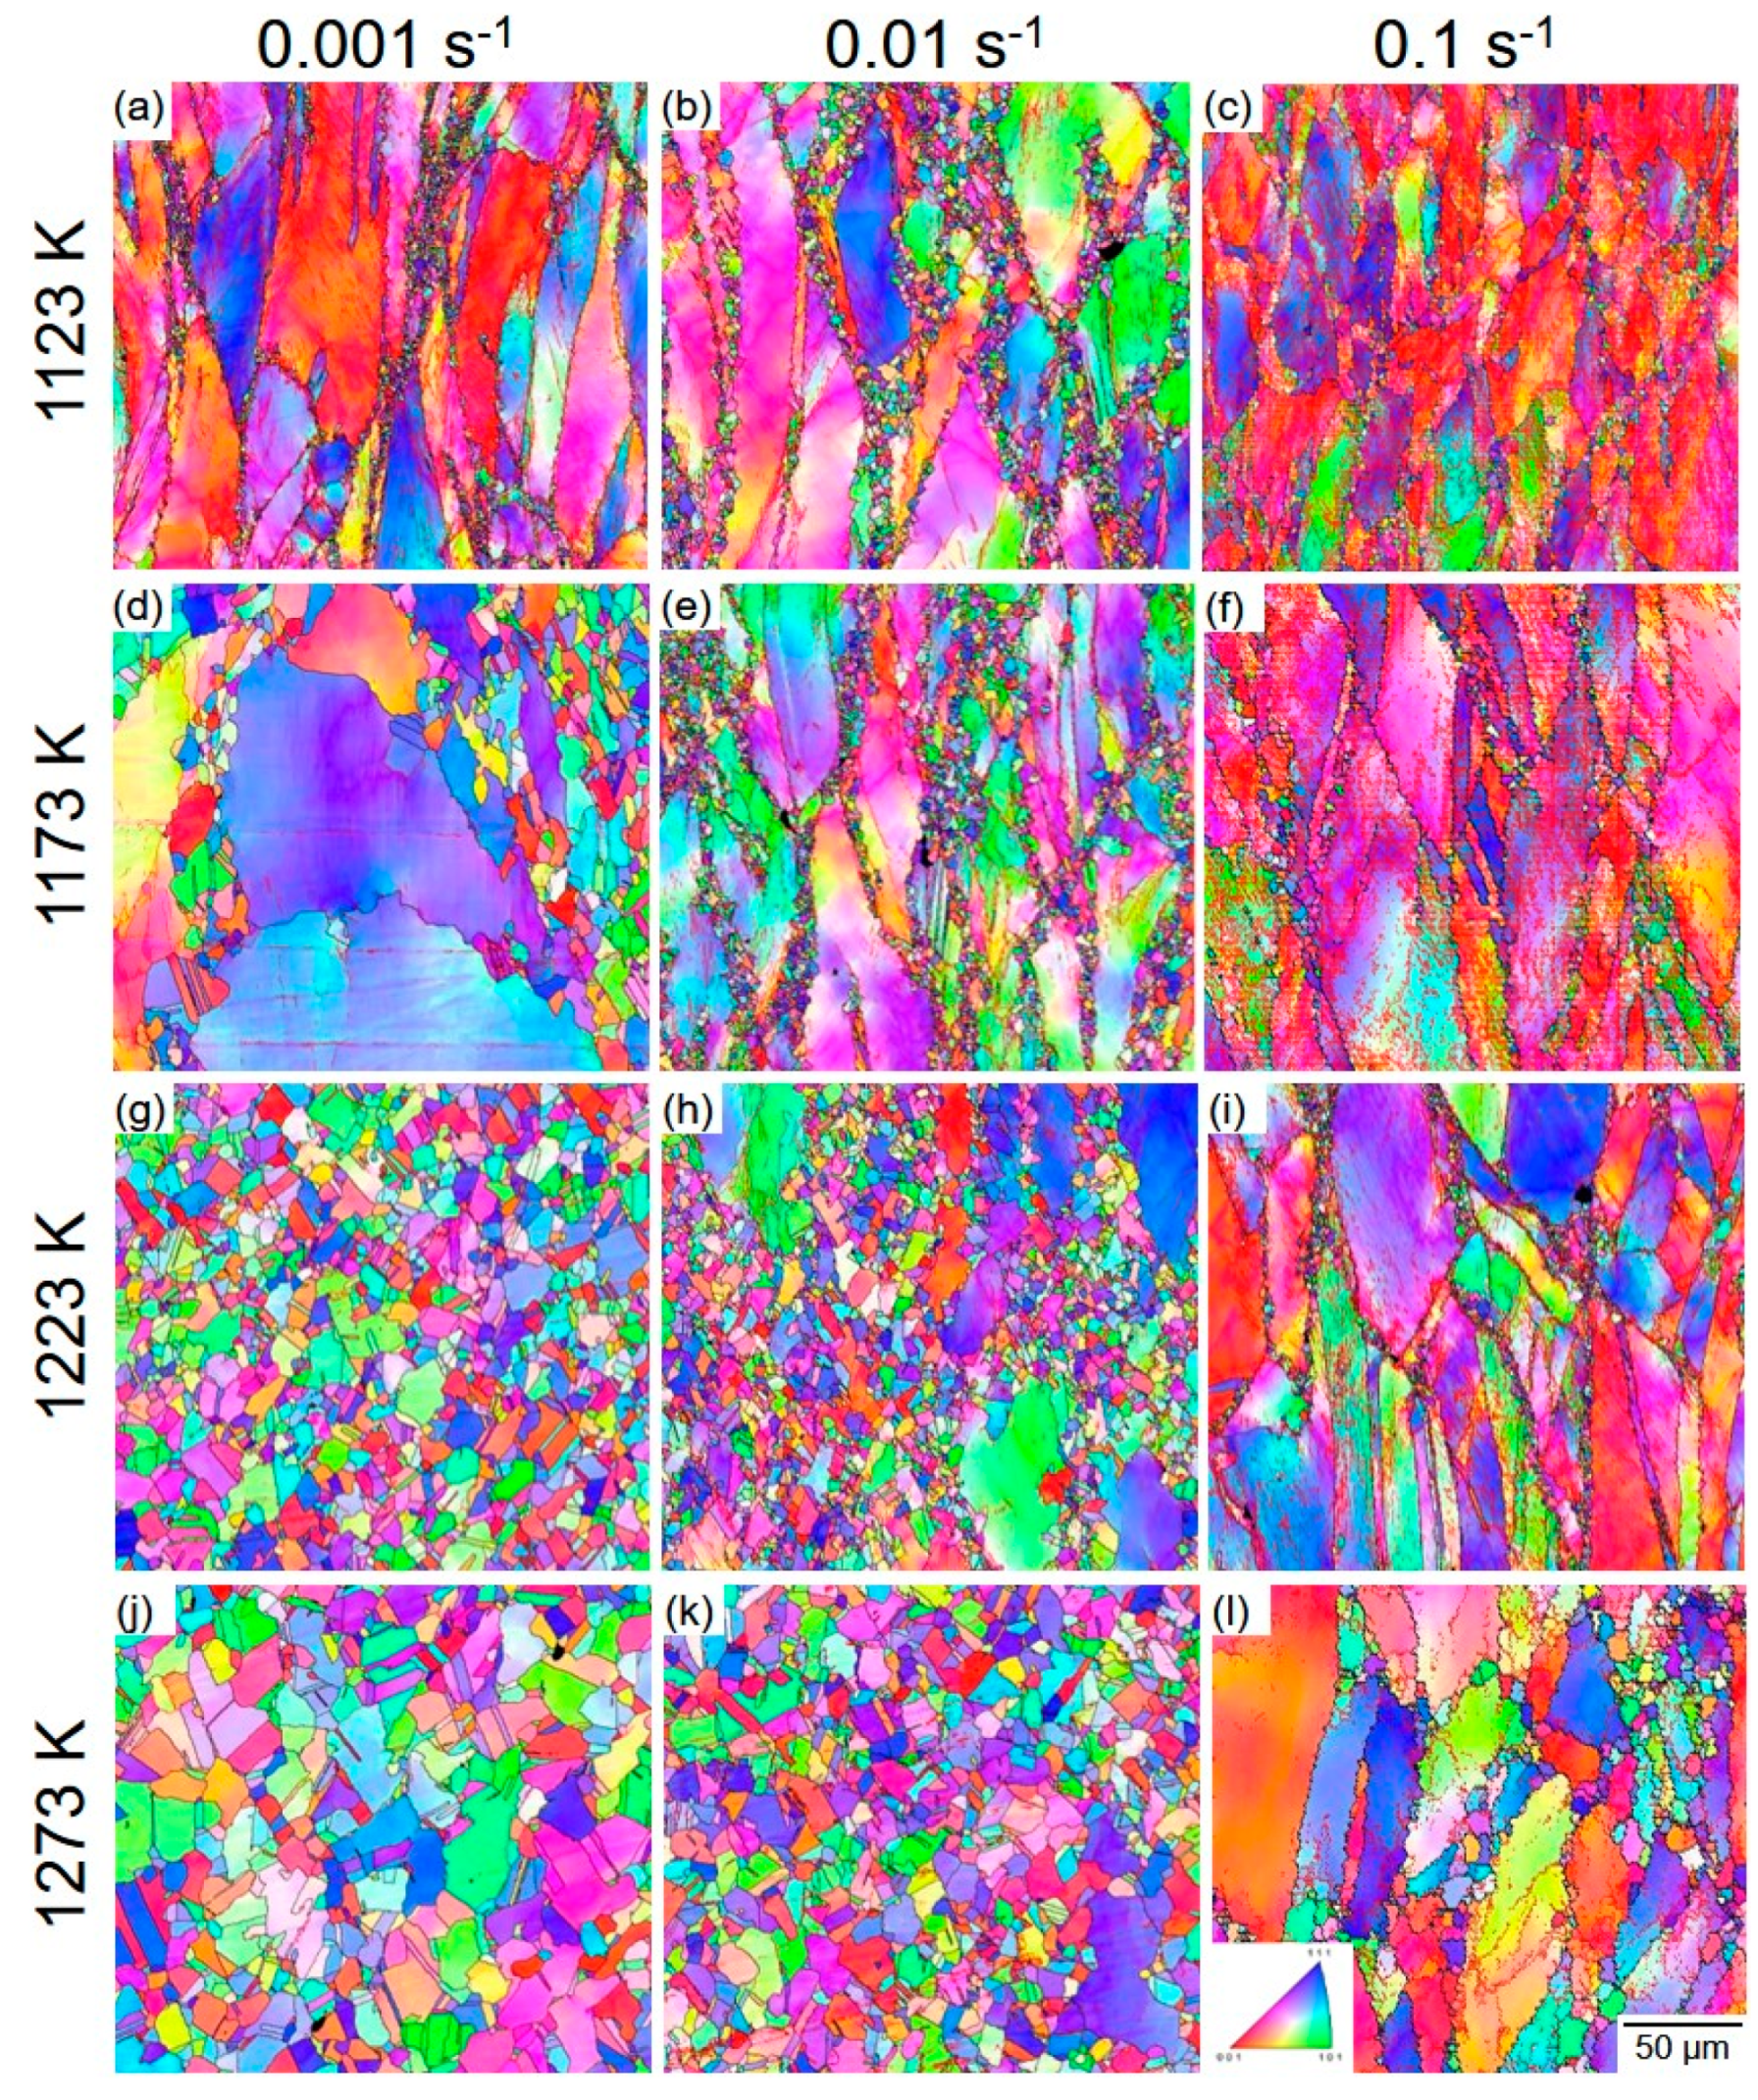
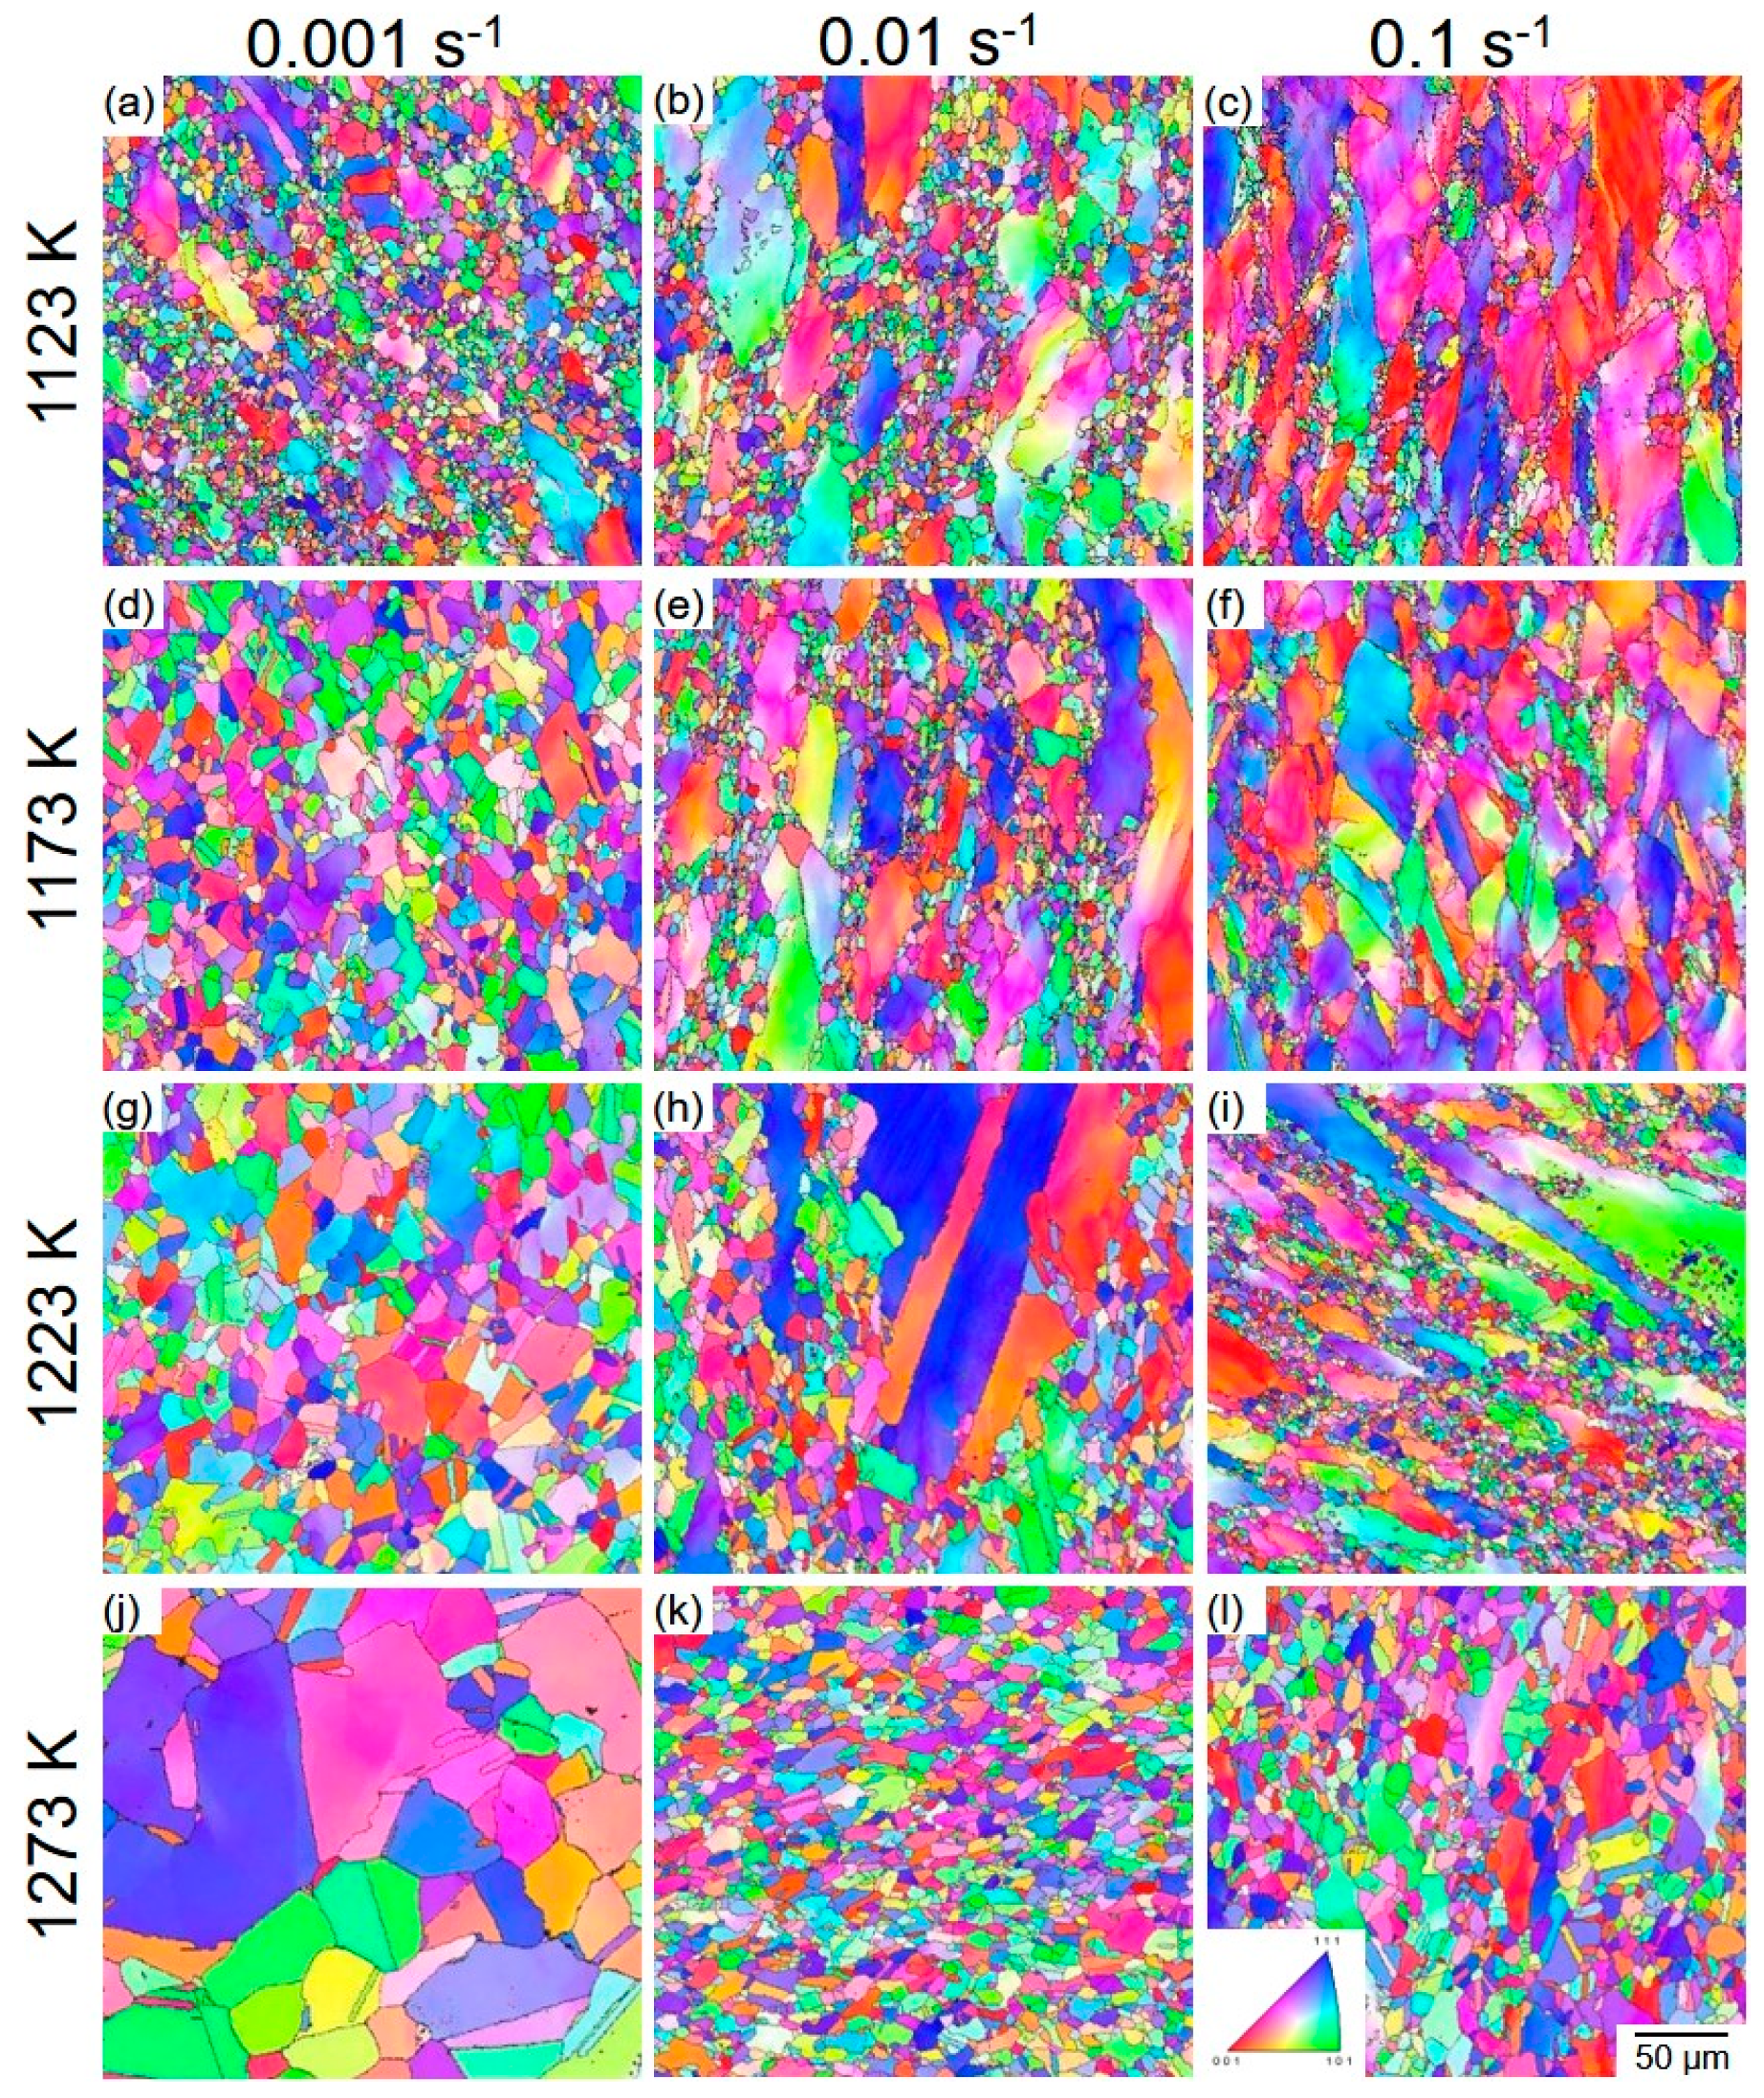
Figure 8 shows the EBSD inverse pole figure (IPF) maps of the C-doped HEA compressed at 1123 K (a–c), 1173 K (d–f), 1223 K (g–i), and 1273 K (j–l) with strain rates of 0.001 s−1 (a,d,g,j), 0.01 s−1 (b,e,h,k), and 0.1 s−1 (c,f,i,l), respectively. The colors in the IPF maps demonstrate the crystal orientation of the grains. It can be seen that the necklace structure consisting of coarse-grain and fine-DRXed grains prefer to form at lower temperatures and/or at higher strain rates (Figure 8a–f,i,l), which is consistent with what can be seen in the IQ maps. The DRX leads to flow softening (a decrease in flow stress with the increase of strain) in the S–S curves in Figure 2. Let us note that the DRXed grains do not exhibit a particular orientation relationship with their adjacent coarse grains. The grain structures were further homogenized and refined with the increase of the temperature and the decrease of the strain rate (Figure 8g,h), in which a larger number of DRXed-grains were produced. This shows that a high temperature with a low strain rate is the optimum condition for obtaining a homogenized grain structure.
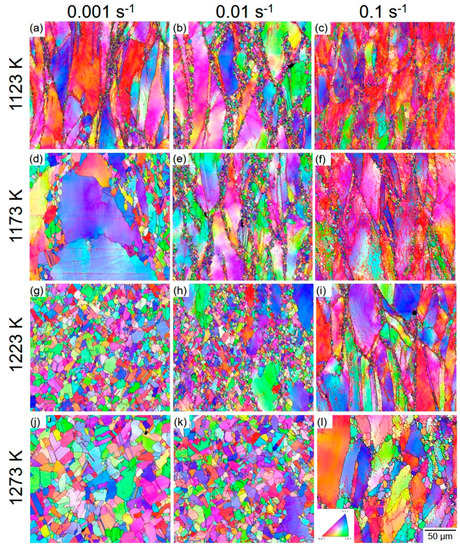
Figure 8.
EBSD IQ maps of the N-doped HEA compressed at 1123 K (a–c), 1173 K (d–f), 1223 K (g–i), and 1273 K (j–l) with strain rates of 0.001 s−1 (a,d,g,j), 0.01 s−1 (b,e,h,k), and 0.1 s−1 (c,f,i,l), respectively.
Figure 9 shows the EBSD IQ maps of the C-doped HEA compressed at 1123 K (a–c), 1173 K (d–f), 1223 K (g–i), and 1273 K (j–l) and at strain rates of 0.001 s−1 (a,d,g,j), 0.01 s−1 (b,e,h,k), and 0.1 s−1 (c,f,i,l), respectively. The corresponding EBSD IPF maps are shown in Figure 10. Compared to the results of the N-doped specimens, the following similarities can be drawn: (ⅰ) a necklace structure revealing partial DRX behavior is observed in both of the samples, which is more preferred at lower temperatures and/or at higher strain rates; (ⅱ) the fine grains in the necklace structure are DRXed grains, which are preferentially formed in the vicinities of the primary grain boundaries, and the fine DRXed grains are enclosed by HAGBs; (ⅲ) the DRXed grains have no preferential orientation, exhibiting very weak texture. However, some differences can also be found between the two HEAs as follows: (ⅰ) a higher fraction of the DRXed grains tend to be formed in the C-doped HEA than in the N-doped HEA after compression in the same conditions; (ⅱ) the grain size of the two samples is different, which will be further discussed in the upcoming section.

Figure 9.
EBSD IQ maps of the C-doped HEA compressed at 1123 K (a–c), 1173 K (d–f), 1223 K (g–i), and 1273 K (j–l) with strain rates of 0.001 s−1 (a,d,g,j), 0.01 s−1 (b,e,h,k), and 0.1 s−1 (c,f,i,l), respectively.
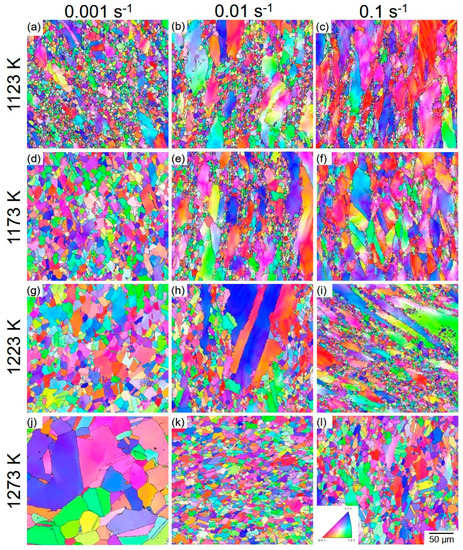
Figure 10.
EBSD IPF maps of the C-doped HEA compressed at 1123 K (a–c), 1173 K (d–f), 1223 K (g–i), and 1273 K (j–l) with strain rates of 0.001 s−1 (a,d,g,j), 0.01 s−1 (b,e,h,k), and 0.1 s−1 (c,f,i,l), respectively.
4. Discussion
In the present study, the mechanical response and microstructure evolution of the N-doped and the C-doped Co45Cr25Fe15Ni15 (at.%) TRIP HEA were investigated. The compressive S–S curves exhibited analogous behavior, in which the flow stress increased with the increased strain at the initial stage up to a flow stress peak due to work hardening, and then the flow stress decreased with the increase of strain attributed to DRX. The observations of the microstructure also demonstrate that DRX preferred to occur at the GBs of the primary grains, forming a necklace structure when the compression was conducted at low temperatures and/or high strain rates. However, homogeneous DRXed grain structures with a refined grain size were produced when the HEAs were compressed at a high temperature and low strain rate.
For single-phase FCC metals, the SFE is a crucially important factor that affects the hot-deformation and DRX mechanisms. In high SFE metals (>160 mJ/m2)), the DRV of the dislocations is preferred to proceed by climbing and cross-slipping [20,41]. The compressive S–S curves often exhibit the following characteristics: strain hardening at a small strain up to a plateau (peak stress), and flow stress is then almost constant even though the strain increases successively [42,43]. In this case, DRX almost does not occur because of the lack of dislocations, which is the prerequisite driving force for the occurrence of DRX, and subgrains with LAGBs are formed due to dislocation multiplication and their DRV [44,45,46,47]. However, the DRV is significantly inhibited by the reduction of the SFE. In pure Ni and Cu with an SFE lower than 90 mJ/m2, DRX occurs after hot-deformation to a critical strain [48,49,50]. The equiatomic CoCrFeNi HEA has an SFE of 25–30 mJ/m2 [6], which is much lower than that of the Ni and Cu. Further, our previous ab initio calculation and thermodynamic predictions revealed that the increase of Co content at the expense of Fe and Ni could notably reduce the SFE of the HEA [8,9,10]. For this reason, the SFE of the Co45Cr25Fe15Ni15 (at.%) TRIP HEA and the C-doped or N-doped derivates is below 25 mJ/m2. The HEAs investigated in the present study exhibited obvious flow softening due to DRX, as indicated in Figure 2 and Figure 3.
The apparent activation energies for the hot-deformation of the N-doped and the C-doped HEAs are 334.7 kJ/mol and 526.1 kJ/mol, respectively. The activation energies of pure Ni, Cu, and Al are 285 kJ/mol, 197 kJ/mol, and 142 kJ/mol, respectively [30,31]. We know that the activation energy of the HEA is much larger than that of pure metals, which indicates the sluggish diffusion of elements in the HEAs containing multi-principal elements. This sluggish diffusion leads to a reduction of the DRV and postpones the occurrence of DRV; as a result, the flow stress of the HEA is higher than that of the pure metals. Moreover, the activation energy of the C-doped HEAs is much larger than that of the N-coped counterpart because a larger amount of C (0.09 wt.%) than what is found in N (0.045 wt.%) was successfully doped in the system. One can deduce that the activation energy of the HEAs would be increased by doping interstitial atoms, and a larger amount of doping yields higher activation energy.
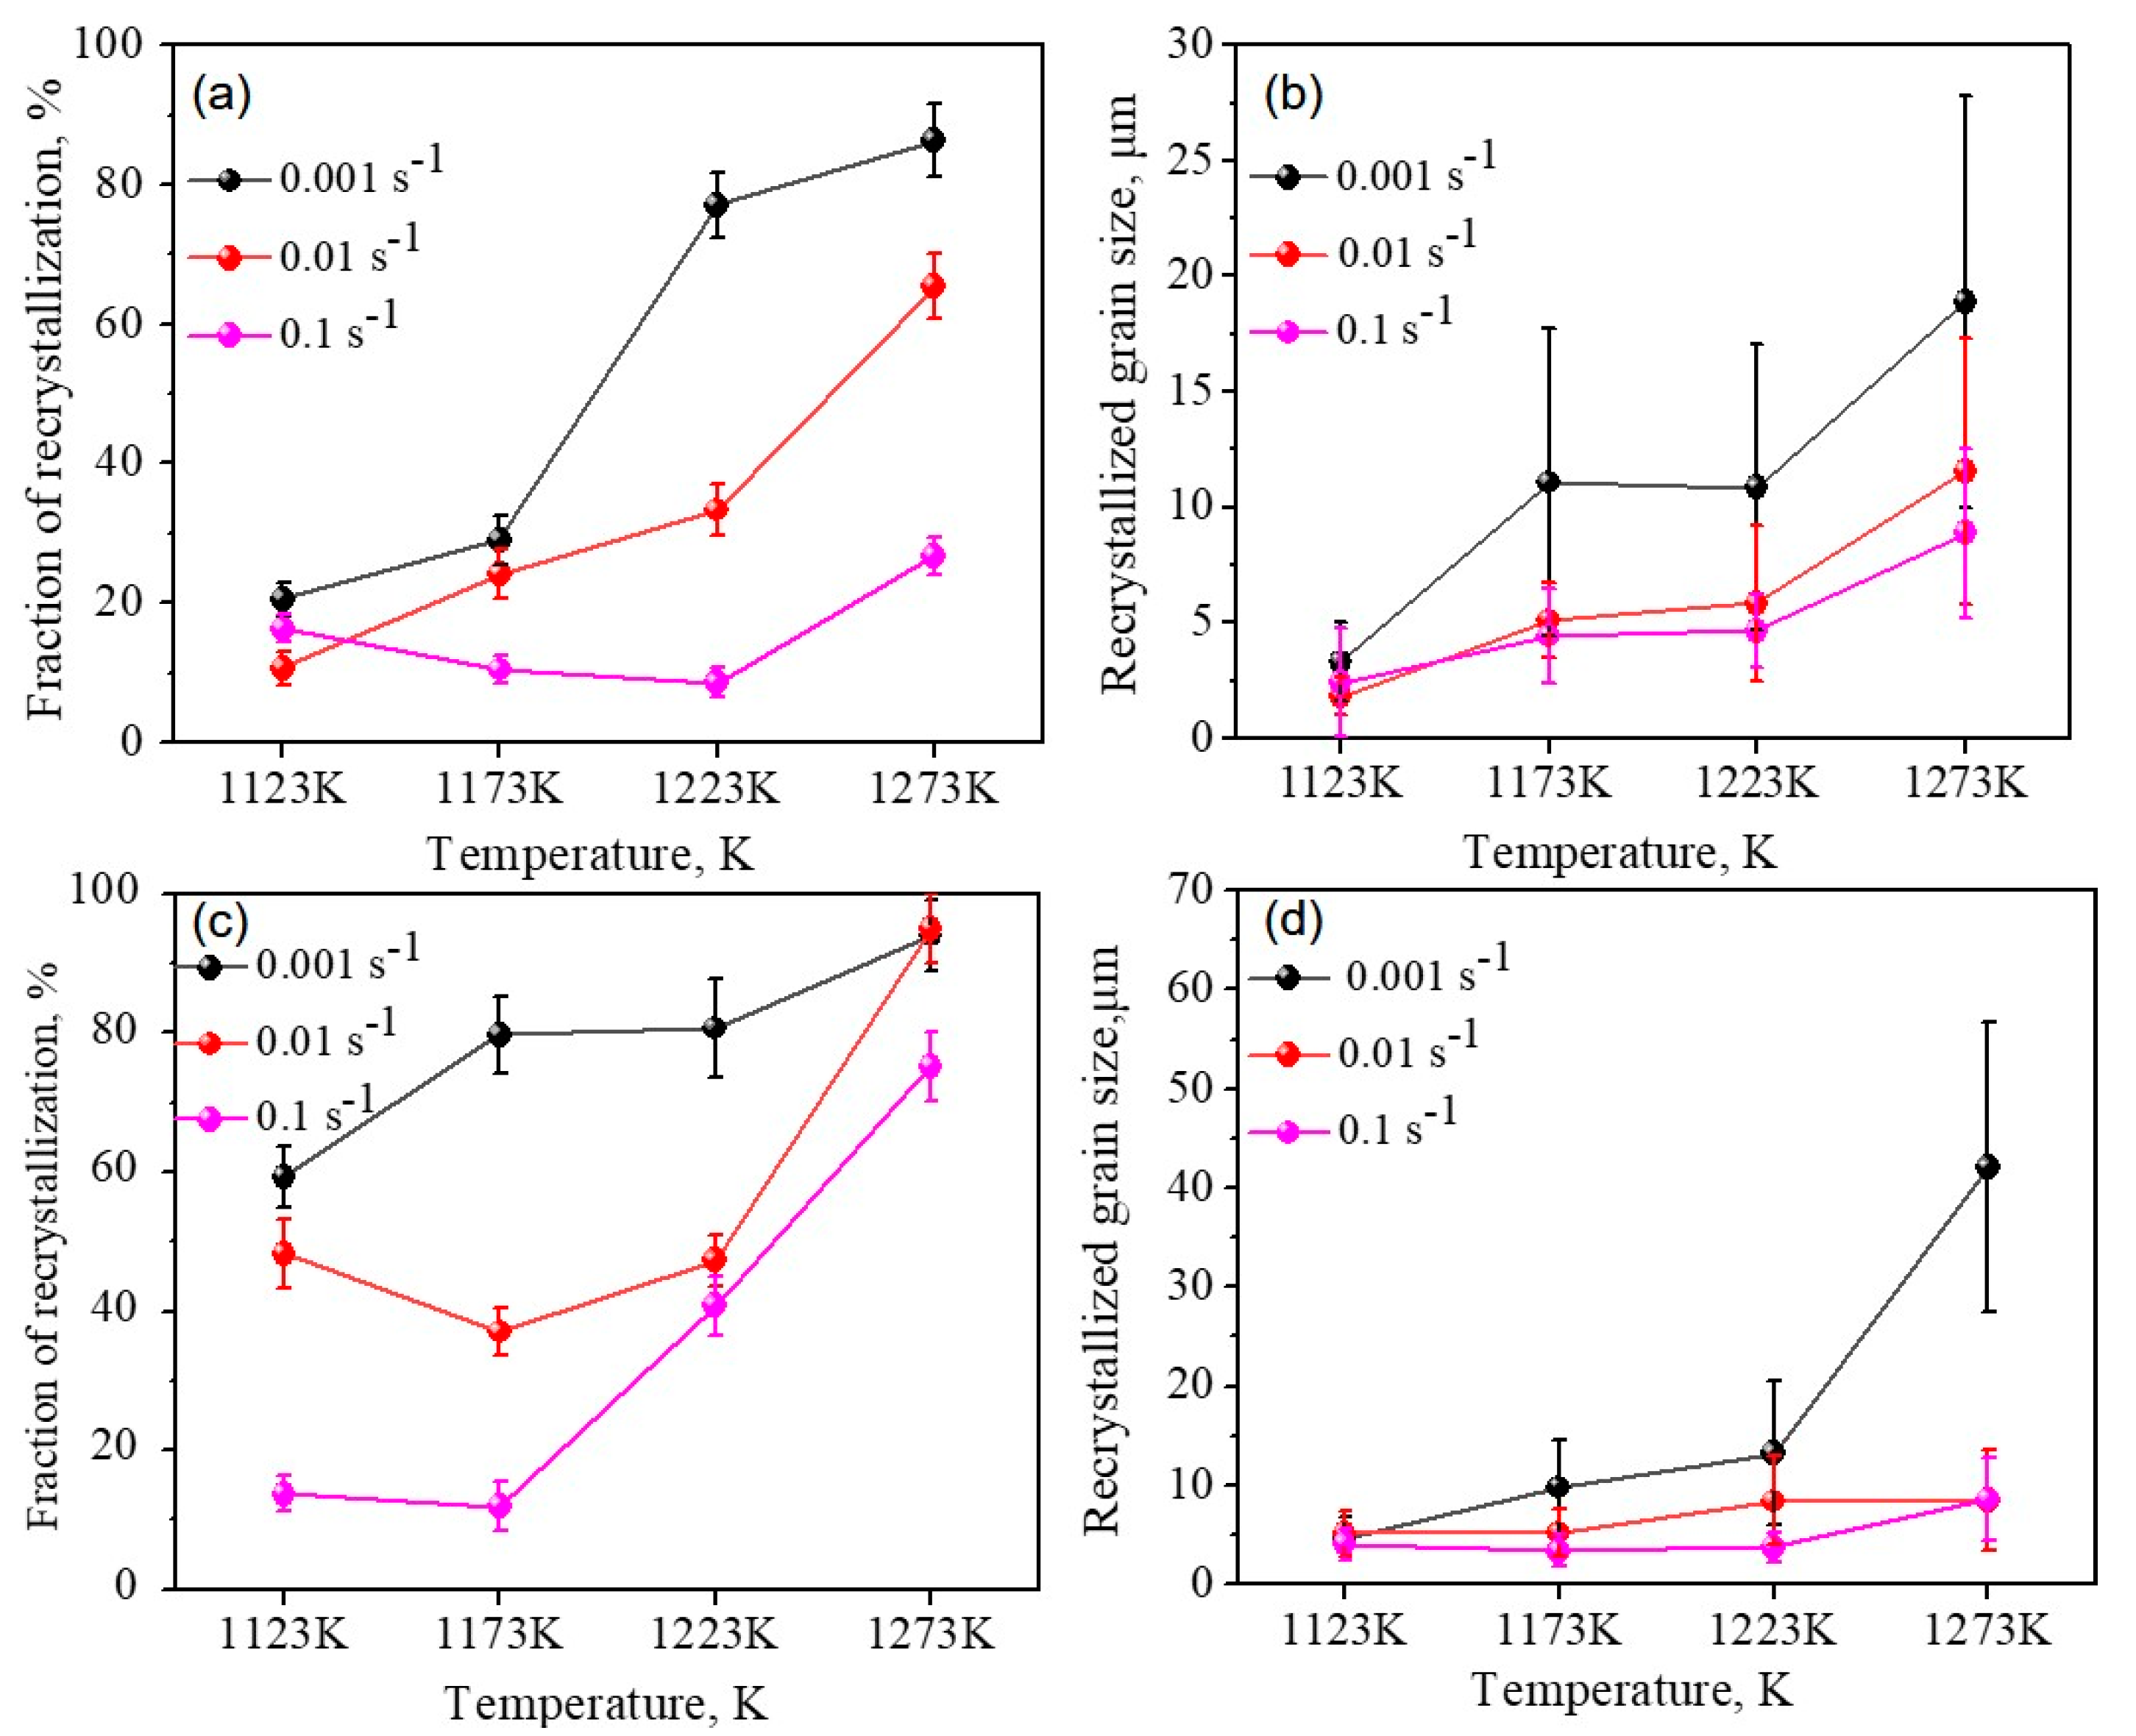
Apart from the SFE and activation energy, the compression condition (temperature and strain rate) also exerted a strong influence on the flow behaviors and microstructure evolutions, as demonstrated in Figure 2, Figure 3, Figure 7, Figure 8, Figure 9 and Figure 10. For a better comparison, the volume fraction of the recrystallized grains and their average size were measured, and the recrystallized grains were distinguished by using a grain orientation spread (GOS) method [51,52]. The grains with a GOS ≤ 2° were determined to be recrystallized grains, and the grains with a GOS > 2° were un-recrystallized ones. Figure 11a,b displays the recrystallization fraction (Figure 11a) and the average size of the recrystallized grains (Figure 11b) of the N-doped HEA. It can be seen that the volume fraction of the DRXed grains increases when the temperature increases and/or the strain rate decreases. For instance, the volume fraction is 16.3% when compressed at 1123 K with 0.01 s−1, but it increases to 86.3% when compressed at 1273 K with 0.001 s−1. An obviously increasing recrystallization fraction could be observed when the alloy was compressed at temperatures between 1173 K and 1223 K with a certain strain rate of 0.001 s−1. The average grain size of the recrystallized grains increases when the temperature increases or when the strain rate decreases. A fine crystallized grain size of about 10 μm or less can be obtained in most conditions except for when being compressed at 1273 K with 0.001 s−1. Therefore, a high temperature of 1223 K and a low strain rate of 0.001 s−1 is an appropriate condition for obtaining a large amount of recrystallized structures with a small grain size.
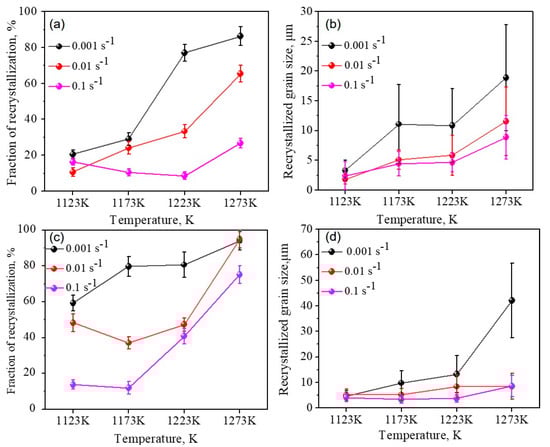
Figure 11.
The volume fraction (a,c) and average grain size (b,d) of the dynamically recrystallized grains in the (a,b) N-doped HEA and (c,d) C-doped HEA hot-compressed to a true strain of 1.0. The compression temperatures were 1123 K, 1173 K, 1223 K, and 1273 K, and the strain rates were 0.001 s−1, 0.01 s−1, and 0.1 s−1.
Figure 11c,d shows the recrystallization fraction (Figure 11c) and the average size of the recrystallization grains (Figure 11d) of the DRXed grains in the C-doped HEA. Similar to the N-doped HEA, the volume fraction of the DRXed grains increased when the temperature increased or decreased when the strain rate decreased. For instance, the volume fraction was 13.7% when compressed at 1123 K with a strain rate of 0.1 s−1, which was increased to 99.3% when the compression condition was changed to 1273 K and 0.001 s−1. Compared to the N-doped HEA, the recrystallization fraction of the C-doped HEA was higher under the same compression conditions, but the average grain size of the recrystallized grains was mainly 10 μm or smaller. Therefore, wider process parameters (at 1273 K with 0.001 s−1, at 1173–1223 K with 0.001 s−1) are appropriate conditions for obtaining a large amount of recrystallized structure with a small grain size.
5. Conclusions
In the present study, the flow behavior and the grain structure evolutions of 0.045 wt.% N-doped and 0.09 at.% C-doped Co45Cr25Fe15Ni15 (at.%) TRIP-HEAs were investigated by hot-compression at 1123, 1273, 1223, and 1473 K up to a true strain of 1.0. The influence of the compression temperature and strain rate (0.1, 0.01, and 0.001 s−1) was clarified. Based on the results, the following conclusions can be drawn:
1. Constitutive equations for combing the flow behaviors and compression conditions were constructed successfully. The hyperbolic-sine of stress has a linear relationship with the Zener–Hollomon parameter. Further, the flow stresses were predicted and fitted using fifth-order polynomial functions. The apparent activation energies of the N-doped and C-doped HEAs are 334.7 kJ/mol and 526.1 kJ/mol, respectively. The larger activation energy than that of the pure metals indicates sluggish diffusion in the HEAs.
2. The stress-strain curves exhibited strain hardening (flow stress increases with strain) at a small strain up to the peak of flow stress, and then the curves exhibited flow softening (flow stress decreases with the increase of strain). The low SFE of the HEAs promoted the storage of dislocations, i.e., strain hardening, while the dynamic recrystallization occurring preferentially at the grain boundaries of the primary grains contributed to the flow softening.
3. The recrystallized grain structure was significantly influenced by the compression conditions. A higher fraction of recrystallized grains were produced when the HEAs were compressed at a relatively high temperature and/or low strain rate. A temperature of 1223 K and a strain rate of 0.001 s−1 is optimal for obtaining homogeneous grain structures for the N-doped HEA, while the optimum conditions for the C-doped HEA are 1173–1273 K with a strain rate of 0.001 s−1. The average size of the recrystallized grains is approximately 10 μm, and no obvious texture is observed.
Author Contributions
Conceptualization, D.W.; methodology, H.Y. and D.W.; validation, H.Y. and D.W.; formal analysis, H.Y., Y.Z., R.X., M.B. and D.W.; investigation, H.Y., Y.Z., R.X. and M.B.; resources, H.Y. and D.W.; data curation, H.Y. and D.W.; writing—original draft preparation, H.Y. and D.W.; writing—review and editing, D.W.; visualization, H.Y., R.X., Y.Z., M.B. and D.W.; supervision, H.Y.; project administration, H.Y. and D.W.; funding acquisition, H.Y. and D.W. All authors have read and agreed to the published version of the manuscript.
Funding
The authors gratefully appreciate the financial support provided by the National Natural Science Foundation of China (51674079) and the China Postdoctoral Science Foundation (2016M600211). This work was supported by Grant-in-Aid for Scientific Research from the Japan Society for the Promotion of Science (JSPS) KAKENHI (Grant No. 19K14838, 21K03766).
Data Availability Statement
All data in this study are available from the corresponding author upon reasonable request.
Acknowledgments
This work was partially supported by the “Creation of Life Innovation Materials for Interdisciplinary and International Researcher Development” project. This work is a cooperative program (Proposal No. 20G0420) of the Cooperative Research and Development Center for Advanced Materials, Institute for Materials Research, Tohoku University.
Conflicts of Interest
The authors declare no conflict of interest.
References
- Yeh, J.W.; Chen, S.K.; Lin, S.J.; Gan, J.Y.; Chin, T.S.; Shun, T.T.; Tsau, C.H.; Chang, S.Y. Nanostructured High-Entropy Alloys with Multiple Principal Elements: Novel Alloy Design Concepts and Outcomes. Adv. Eng. Mater. 2004, 6, 299–303. [Google Scholar] [CrossRef]
- Cantor, B.; Chang, I.; Knight, P.; Vincent, A. Microstructural development in equiatomic multicomponent alloys. Mater. Sci. Eng. A 2004, 375, 213–218. [Google Scholar] [CrossRef]
- Gludovatz, B.; Hohenwarter, A.; Catoor, D.; Chang, E.H.; George, E.P.; Ritchie, R.O. A fracture-resistant high-entropy alloy for cryogenic applications. Science 2014, 345, 1153–1158. [Google Scholar] [CrossRef] [Green Version]
- Otto, F.; Dlouhý, A.; Somsen, C.; Bei, H.; Eggeler, G.; George, E. The influences of temperature and microstructure on the tensile properties of a CoCrFeMnNi high-entropy alloy. Acta Mater. 2013, 61, 5743–5755. [Google Scholar] [CrossRef] [Green Version]
- Laplanche, G.; Kostka, A.; Horst, O.; Eggeler, G.; George, E. Microstructure evolution and critical stress for twinning in the CrMnFeCoNi high-entropy alloy. Acta Mater. 2016, 118, 152–163. [Google Scholar] [CrossRef] [Green Version]
- Liu, S.; Wu, Y.; Wang, H.; He, J.; Liu, J.; Chen, C.; Liu, X.; Lu, Z. Stacking fault energy of face-centered-cubic high entropy alloys. Intermetallics 2018, 93, 269–273. [Google Scholar] [CrossRef]
- De Cooman, B.C.; Estrin, Y.; Kim, S.K. Twinning-induced plasticity (TWIP) steels. Acta Mater. 2018, 142, 283–362. [Google Scholar] [CrossRef]
- Wei, D.; Li, X.; Heng, W.; Koizumi, Y.; He, F.; Choi, W.M.; Lee, B.J.; Kim, H.S.; Kato, H.; Chiba, A. Novel Co-rich high entropy alloys with superior tensile properties. Mater. Res. Lett. 2018, 7, 82–88. [Google Scholar] [CrossRef] [Green Version]
- Wei, D.; Li, X.; Jiang, J.; Heng, W.; Koizumi, Y.; Choi, W.M.; Lee, B.J.; Kim, H.S.; Kato, H.; Chiba, A. Novel Co-rich high performance twinning-induced plasticity (TWIP) and transformation-induced plasticity (TRIP) high-entropy alloys. Scr. Mater. 2019, 165, 39–43. [Google Scholar] [CrossRef]
- Wei, D.; Li, X.; Schönecker, S.; Jiang, J.; Choi, W.M.; Lee, B.J.; Kim, H.S.; Chiba, A.; Kato, H. Development of strong and ductile metastable face-centered cubic single-phase high-entropy alloys. Acta Mater. 2019, 181, 318–330. [Google Scholar] [CrossRef]
- Wei, D.; Anniyaer, A.; Koizumi, Y.; Aoyagi, K.; Nagasako, M.; Kato, H.; Chiba, A. On microstructural homogenization and mechanical properties optimization of biomedical Co-Cr-Mo alloy additively manufactured by using electron beam melting. Addit. Manuf. 2019, 28, 215–227. [Google Scholar] [CrossRef]
- Wei, D.; Koizumi, Y.; Takashima, T.; Nagasako, M.; Chiba, A. Fatigue improvement of electron beam melting-fabricated biomedical Co–Cr–Mo alloy by accessible heat treatment. Mater. Res. Lett. 2018, 6, 93–99. [Google Scholar] [CrossRef] [Green Version]
- Lei, Z.; Liu, X.; Wu, Y.; Wang, H.; Jiang, S.; Wang, S.; Hui, X.; Wu, Y.; Gault, B.; Kontis, P.; et al. Enhanced strength and ductility in a high-entropy alloy via ordered oxygen complexes. Nature 2018, 563, 546–550. [Google Scholar] [CrossRef]
- Yi, H.-L.; Wei, D.; Wang, Y.; Wang, L.; Fang, M.-Y.; Yang, K.; Kato, H. Hot deformation and dynamic recrystallization behavior of CoCrNi and (CoCrNi)94Ti3Al3 medium entropy alloys. Metals 2020, 10, 1341. [Google Scholar] [CrossRef]
- Lv, S.; Zu, Y.; Chen, G.; Zhao, B.; Fu, X.; Zhou, W. A multiple nonmetallic atoms co-doped CrMoNbWTi refractory high-entropy alloy with ultra-high strength and hardness. Mater. Sci. Eng. A 2020, 795, 140035. [Google Scholar] [CrossRef]
- Smeltzer, J.A.; Marvel, C.J.; Hornbuckle, B.C.; Roberts, A.J.; Marsico, J.M.; Giri, A.K.; Darling, K.A.; Rickman, J.M.; Chan, H.M.; Harmer, M.P. Achieving ultra hard refractory multi-principal element alloys via mechanical alloying. Mater. Sci. Eng. A 2019, 763, 138140. [Google Scholar] [CrossRef]
- Yi, H.L.; Wei, D.; Xie, R.Y.; Zhang, Y.F.; Kato, H. A strategy for enhancing the mechanical property of the precipitation-strengthened medium-entropy alloy. Mater. Sci. Eng. A 2021, 819, 141390. [Google Scholar] [CrossRef]
- Hall, E.O. The deformation and ageing of mild steel: II characteristics of the L ders deformation. Proc. Phys. Soc. Sect. B 1951, 64, 742–747. [Google Scholar] [CrossRef]
- Petch, N.J. The cleavage strength of polycrystals. J. Iron Steel Inst. 1953, 174, 25–28. [Google Scholar]
- Humphreys, J.F.; Hatherly, M. Recrystallization and Related Annealing Phenomena, 2nd ed.; Elsevier: Amsterdam, The Netherlands, 2012; pp. 215–266. [Google Scholar]
- Wei, D.-X.; Koizumi, Y.; Chiba, A. Discontinuous yielding and microstructural evolution of Ti-40 at.% Al alloy compressed in single α-hcp phase region. J. Alloy. Compd. 2017, 693, 1261–1276. [Google Scholar] [CrossRef]
- Wei, D.-X.; Koizumi, Y.; Nagasako, M.; Chiba, A. Refinement of lamellar structures in Ti-Al alloy. Acta Mater. 2017, 125, 81–97. [Google Scholar] [CrossRef]
- Wei, D.-X.; Koizumi, Y.; Li, Y.; Yamanak, K.; Chiba, A. Submicron lamellar porous structure formed by selective dissolution of Ti-Al alloy. Mater. Des. 2016, 98, 1–11. [Google Scholar] [CrossRef]
- Yi, H.L.; Wei, D.; Xie, R.Y.; Zhang, Y.F.; Kato, H. Microstructure refinement of a transformation-induced plasticity high-entropy alloy. Materials 2021, 14, 1196. [Google Scholar] [CrossRef] [PubMed]
- Eleti, R.R.; Bhattacharjee, T.; Zhao, L.; Bhattacharjee, P.P.; Tsuji, N. Hot deformation behavior of CoCrFeMnNi FCC high entropy alloy. Mater. Chem. Phys. 2018, 210, 176–186. [Google Scholar] [CrossRef]
- Stepanov, N.; Shaysultanov, D.; Yurchenko, N.; Zherebtsov, S.; Ladygin, A.; Salishchev, G.; Tikhonovsky, M. High temperature deformation behavior and dynamic recrystallization in CoCrFeNiMn high entropy alloy. Mater. Sci. Eng. A 2015, 636, 188–195. [Google Scholar] [CrossRef]
- Jeong, H.; Park, H.; Park, K.; Na, T.; Kim, W. High-temperature deformation mechanisms and processing maps of equiatomic CoCrFeMnNi high-entropy alloy. Mater. Sci. Eng. A 2019, 756, 528–537. [Google Scholar] [CrossRef]
- Patnamsetty, M.; Saastamoinen, A.; Somani, M.C.; Peura, P. Constitutive modelling of hot deformation behaviour of a CoCrFeMnNi high-entropy alloy. Sci. Technol. Adv. Mater. 2020, 21, 43–55. [Google Scholar] [CrossRef] [PubMed] [Green Version]
- He, G.; Zhao, Y.; Gan, B.; Sheng, X.; Liu, Y.; Tan, L. Mechanism of grain refinement in an equiatomic medium-entropy alloy CrCoNi during hot deformation. J. Alloy. Compd. 2020, 815, 152382. [Google Scholar] [CrossRef]
- Vaidya, M.; Pradeep, K.; Murty, B.; Wilde, G.; Divinski, S. Bulk tracer diffusion in CoCrFeNi and CoCrFeMnNi high entropy alloys. Acta Mater. 2018, 146, 211–224. [Google Scholar] [CrossRef]
- Tsai, K.-Y.; Tsai, M.-H.; Yeh, J.-W. Sluggish diffusion in Co–Cr–Fe–Mn–Ni high-entropy alloys. Acta Mater. 2013, 61, 4887–4897. [Google Scholar] [CrossRef]
- He, J.; Zhu, C.; Zhou, D.; Liu, W.; Nieh, T.; Lu, Z. Steady state flow of the FeCoNiCrMn high entropy alloy at elevated temperatures. Intermetallics 2014, 55, 9–14. [Google Scholar] [CrossRef]
- Sellars, C.M.; Tegart, W.J. Hot workability. Int. Metall. Rev. 1972, 17, 1–24. [Google Scholar] [CrossRef]
- Phaniraj, C.; Samantaray, D.; Mandal, S.; Bhaduri, A. A new relationship between the stress multipliers of Garofalo equation for constitutive analysis of hot deformation in modified 9Cr–1Mo (P91) steel. Mater. Sci. Eng. A 2011, 528, 6066–6071. [Google Scholar] [CrossRef]
- Sellars, C.; McTegart, W. On the mechanism of hot deformation. Acta Met. 1966, 14, 1136–1138. [Google Scholar] [CrossRef]
- McQueen, H.J.; Ryan, N.D. Constitutive analysis in hot working. Mater. Sci. Eng. A 2002, 322, 43–63. [Google Scholar] [CrossRef]
- Zener, C.; Hollomon, J.H. Effect of strain rate upon plastic flow of steel. J. Appl. Phys. 1944, 15, 22–32. [Google Scholar] [CrossRef]
- McQueen, H.J.; Jonas, J.J. Treatise on Materials Science and Technology, Vol.6: Plastic Deformation of Materials; Academic Press: New York, NY, USA, 1975; pp. 393–493. [Google Scholar]
- Lin, Y.C.; Chen, M.S.; Zhong, J. Effect of temperature and strain rate on the compressive deformation behavior of 42CrMo steel. J. Mater. Process. Technol. 2008, 205, 308–315. [Google Scholar] [CrossRef]
- Haghdadi, N.; Zarei-Hanzaki, A.; Abedi, H.R. The flow behavior modeling of cast A356 aluminum alloy at elevated temperatures considering the effect of strain. Mater. Sci. Eng. A 2012, 535, 252–257. [Google Scholar] [CrossRef]
- Hull, D.; Bacon, D. Introduction to dislocations. Mater. Today 2011, 14, 502. [Google Scholar] [CrossRef]
- Verlinden, B.; Driver, J.; Samajdar, I.; Doherty, R.D. Thermo-Mechanical Processing of Metallic Materials, Pergamon Materials Series; Elsevier Ltd.: New York, NY, USA, 2007; pp. 49–110. [Google Scholar]
- Quan, G.Z.; Mao, Y.P.; Li, G.S.; Lv, W.Q.; Wang, Y.; Zhou, J. A characterization for the dynamic recrystallization kinetics of as-extruded 7075 aluminum alloy based on true stress–strain curves. Comput. Mater. Sci. 2012, 55, 65–72. [Google Scholar] [CrossRef]
- Yu, T.; Hansen, N.; Huang, X. Linking recovery and recrystallization through triple junction motion in aluminum cold rolled to a large strain. Acta Mater. 2013, 61, 6577–6586. [Google Scholar] [CrossRef] [Green Version]
- Duly, D.; Baxter, G.; Shercliff, H.; Whiteman, J.; Sellars, C.; Ashby, M. Microstructure and local crystallographic evolution in an Al1 wt% Mg alloy deformed at intermediate temperature and high strain-rate. Acta Mater. 1996, 44, 2947–2962. [Google Scholar] [CrossRef]
- McQueen, H.J.; Evangelista, E. Substructures in aluminium from dynamic and static recovery. Czechoslov. J. Phys. 1988, 38, 359–372. [Google Scholar] [CrossRef]
- Zhu, Q.; Sellars, C. Evolution of microbands in high purity aluminium–3%magnesium during hot deformation testing in tension–compression. Scr. Mater. 2001, 45, 41–48. [Google Scholar] [CrossRef]
- Hertzberg, R.W.; Vinci, R.P.; Hertzberg, J.L. Deformation and Fracture Mechanics of Engineering Materials; John Wiley & Sons Inc.: Hoboken, NJ, USA, 2013; p. 80. [Google Scholar]
- Lin, Y.; Chen, X.M. A critical review of experimental results and constitutive descriptions for metals and alloys in hot working. Mater. Des. 2011, 32, 1733–1759. [Google Scholar] [CrossRef]
- Zhao, Y.; Liao, X.; Zhu, Y.; Horita, Z.; Langdon, T. Influence of stacking fault energy on nanostructure formation under high pressure torsion. Mater. Sci. Eng. A 2005, 410–411, 188–193. [Google Scholar] [CrossRef]
- Eleti, R.R.; Bhattacharjee, T.; Shibata, A.; Tsuji, N. Unique deformation behavior and microstructure evolution in high temperature processing of HfNbTaTiZr refractory high entropy alloy. Acta Mater. 2019, 171, 132–145. [Google Scholar] [CrossRef]
- Zhu, Z.; Yang, T.; Shi, R.; Quan, X.; Zhang, J.; Qiu, R.; Song, B.; Liu, Q. The effects of annealing at different temperatures on microstructure and mechanical properties of cold-rolled al0.3cocrfeni high-entropy alloy. Metals 2021, 11, 940. [Google Scholar] [CrossRef]

Publisher’s Note: MDPI stays neutral with regard to jurisdictional claims in published maps and institutional affiliations. |
© 2021 by the authors. Licensee MDPI, Basel, Switzerland. This article is an open access article distributed under the terms and conditions of the Creative Commons Attribution (CC BY) license (https://creativecommons.org/licenses/by/4.0/).