Article

Fast Image Classification for Grain Size Determination

1
Department of Telecommunication Engineering, National Kaohsiung University of Science and Technology, Kaohsiung 811213, Taiwan
2
China Steel Corporation, Kaohsiung 81233, Taiwan
3
Metal Industries Research & Development Centre (MIRDC), Taichung 407, Taiwan
*
Author to whom correspondence should be addressed.
Metals 2021, 11(10), 1547; https://doi.org/10.3390/met11101547
Submission received: 17 August 2021 / Revised: 13 September 2021 / Accepted: 24 September 2021 / Published: 28 September 2021

Abstract

:
With the increasing application of steel materials, the metallographic analysis of steel has gained importance. At present, grain size analysis remains the task of experts who must manually evaluate photos of the structure. Given the software currently available for this task, it is impossible to effectively determine the grain size because of the limitations of traditional algorithms. Artificial intelligence is now being applied in many fields. This paper uses the concept of deep learning to propose a fast image classifier (FIC) to classify grain size. We establish a classification model based on the grain size of steel in metallography. This model boasts high performance, fast operation, and low computational costs. In addition, we use a real metallographic dataset to compare FIC with other deep learning network architectures. The experimental results show that the proposed method yields a classification accuracy of 99.7%, which is higher than existing methods, and boasts computational demands, which are far lower than with other network architectures. We propose a novel system for automatic grain size determination as an application for metallographic analysis.

1. Introduction

Many industrial processes require information about grain size, a critical metallic microstructure characteristic that significantly influences design parameters such as strength and toughness. Therefore, grain size determination of materials is important in metallic microstructure studies. Industry standards such as ASTM E112 [1] and ISO 643 [2] describe a variety of procedures for determining grain size.
In the microstructure analysis of metal, traditional methods use image processing to obtain measurements such as grain size and size distribution. However, with the success of deep learning in pattern recognition have come significant advances in object classification in the field of computer vision. In recent years, deep learning technology has been widely used to extract features from digital images, resulting in achievements in fields such as image classification, object detection, and image segmentation. The primary interest in automatic methods based on deep learning is because they enable precise measurements and facilitate rapid analysis. In this work, we explore and experiment with methods for grain size classification based on deep learning. The research work and contributions of this paper include the following aspects:
1. Neither too much nor too little feature extraction are suitable for grain size classification. We propose a fast image classifier (FIC), a novel neural network architecture based on a convolutional neural network (CNN) model.
2. For real-time classification, we use a neural network with only 42 layers to replace the traditional method for grain size classification.
3. Compared with the classical deep learning network, the proposed algorithms reduce the number of network layers and weights, decreasing the computing cost while improving the performance of grain size classification over existing methods.
The remainder of the paper is organized as follows. Section 2 briefly introduces related work. A detailed description of the proposed strategy for grain size classification is given in Section 3. Experimental results and comparisons with representative existing methods are discussed in Section 4, and Section 5 concludes and mentions future work.

2. Related Work

A material’s grain size is an important parameter in engineering, given its influence in mechanical properties such as strain, ductility, and resistance to stress. All the major material properties (strength, creep, fatigue resistance, electrical and magnetic properties) are known to depend upon grain size. Therefore, in order to investigate the connection between microstructure and properties in martensitic steels, it is important to measure the prior austenite grain size [3]. To determine the prior austenite grain size, the prior austenite grain boundaries need to be delineated. After this, the prior austenite grain size needs to be measured [4]. Fuchs et al. [5] proposed an efficient method for in-situ austenite grain growth observations based on high-temperature laser scanning confocal microscopy (HT-LSCM). In 2001, Colás [6] studied the relationship between grain size and thermal treatments by using stainless steel and low alloy steel, respectively. Currently (2021), standards for grain size determination are set in ASTM E112 and ISO 643. There are three distinct methods for the determination of grain size: the comparison procedure, the intercept procedure, and the planimetric procedure.
In the comparison procedure, the greatest similitude between the grain structure and the comparison chart of sizes is determined, whereas in the intercept and planimetric procedures the amount of grains inside a known test area is considered. Since the planimetric and intercepts procedures yield grain size accuracy of ±0.5 units and ±0.25 grain size units of repeatability and reproducibility, most measurement operators used ASTM standard E112 to determine grain size. Standard procedures are used to determine the grain sizes and average grain size. However, there are limitations in determining the grain size distribution. In general, when making repeated checks on the same specimen using the comparison procedure, the operator is prejudiced by the first estimate. Although the intercept and planimetric procedures are good solutions for determining grain size, they are more time-consuming due to image pre-processing. However, this image processing does improve the visual appearance of the metallic microstructure, enhancing the features and structures present and thereby promoting reproducibility and repeatability [7].
Work has been done to explore the use of machine vision and image processing in microstructure science. Lixin et al. [8] propose dan edge detection algorithm based on fuzzy logic to determine the grain sizes of metallographic images. Lu et al. [9] proposed grain identification by processing two polarized images which permits one to obtain the edges. Gajalakshmi et al. [10] proposed an image processing algorithm to determine the average grain size in a metallic microstructure by counting the number of grains using Canny edge detection and support vector regression (SVR). Dengiz et al. [11] employed a fuzzy logic algorithm and a neural network (NN) algorithm for grain boundary detection in images of superalloy steel microstructure during sintering. Recent deep learning methods for object classification have been dominated by CNN-based algorithms. Ma et al. [12] propose a weighted propagation U-net (WPU-net) for grain boundary detection in polycrystalline materials and develop a new solution to reconstruct the 3D structure of the sample using a CNN to perform grain object tracking between slices. George et al. [13] proposed a CNN structure to recognize good and bad grain structures in Cu-alloy.
In traditional image processing, because each test image must be compared with all the stored training images, much storage space is required, consuming both memory and CPU resources. Here, however, we attempt to ensure that testing efficiency is much greater than training efficiency. Thus the proposed CNN reaches the other extreme in this trade-off: although the training is time-consuming, once it is completed, the classification of new test data is fast. Such a model reflects real-world requirements. To the best of our knowledge, no paper discusses CNN models for determining grain size. To address the aforementioned problem, we propose the fast image classifier (FIC) for CNN-based grain size determination. This model provides automatic evaluation of grain size given metallic microstructure images.

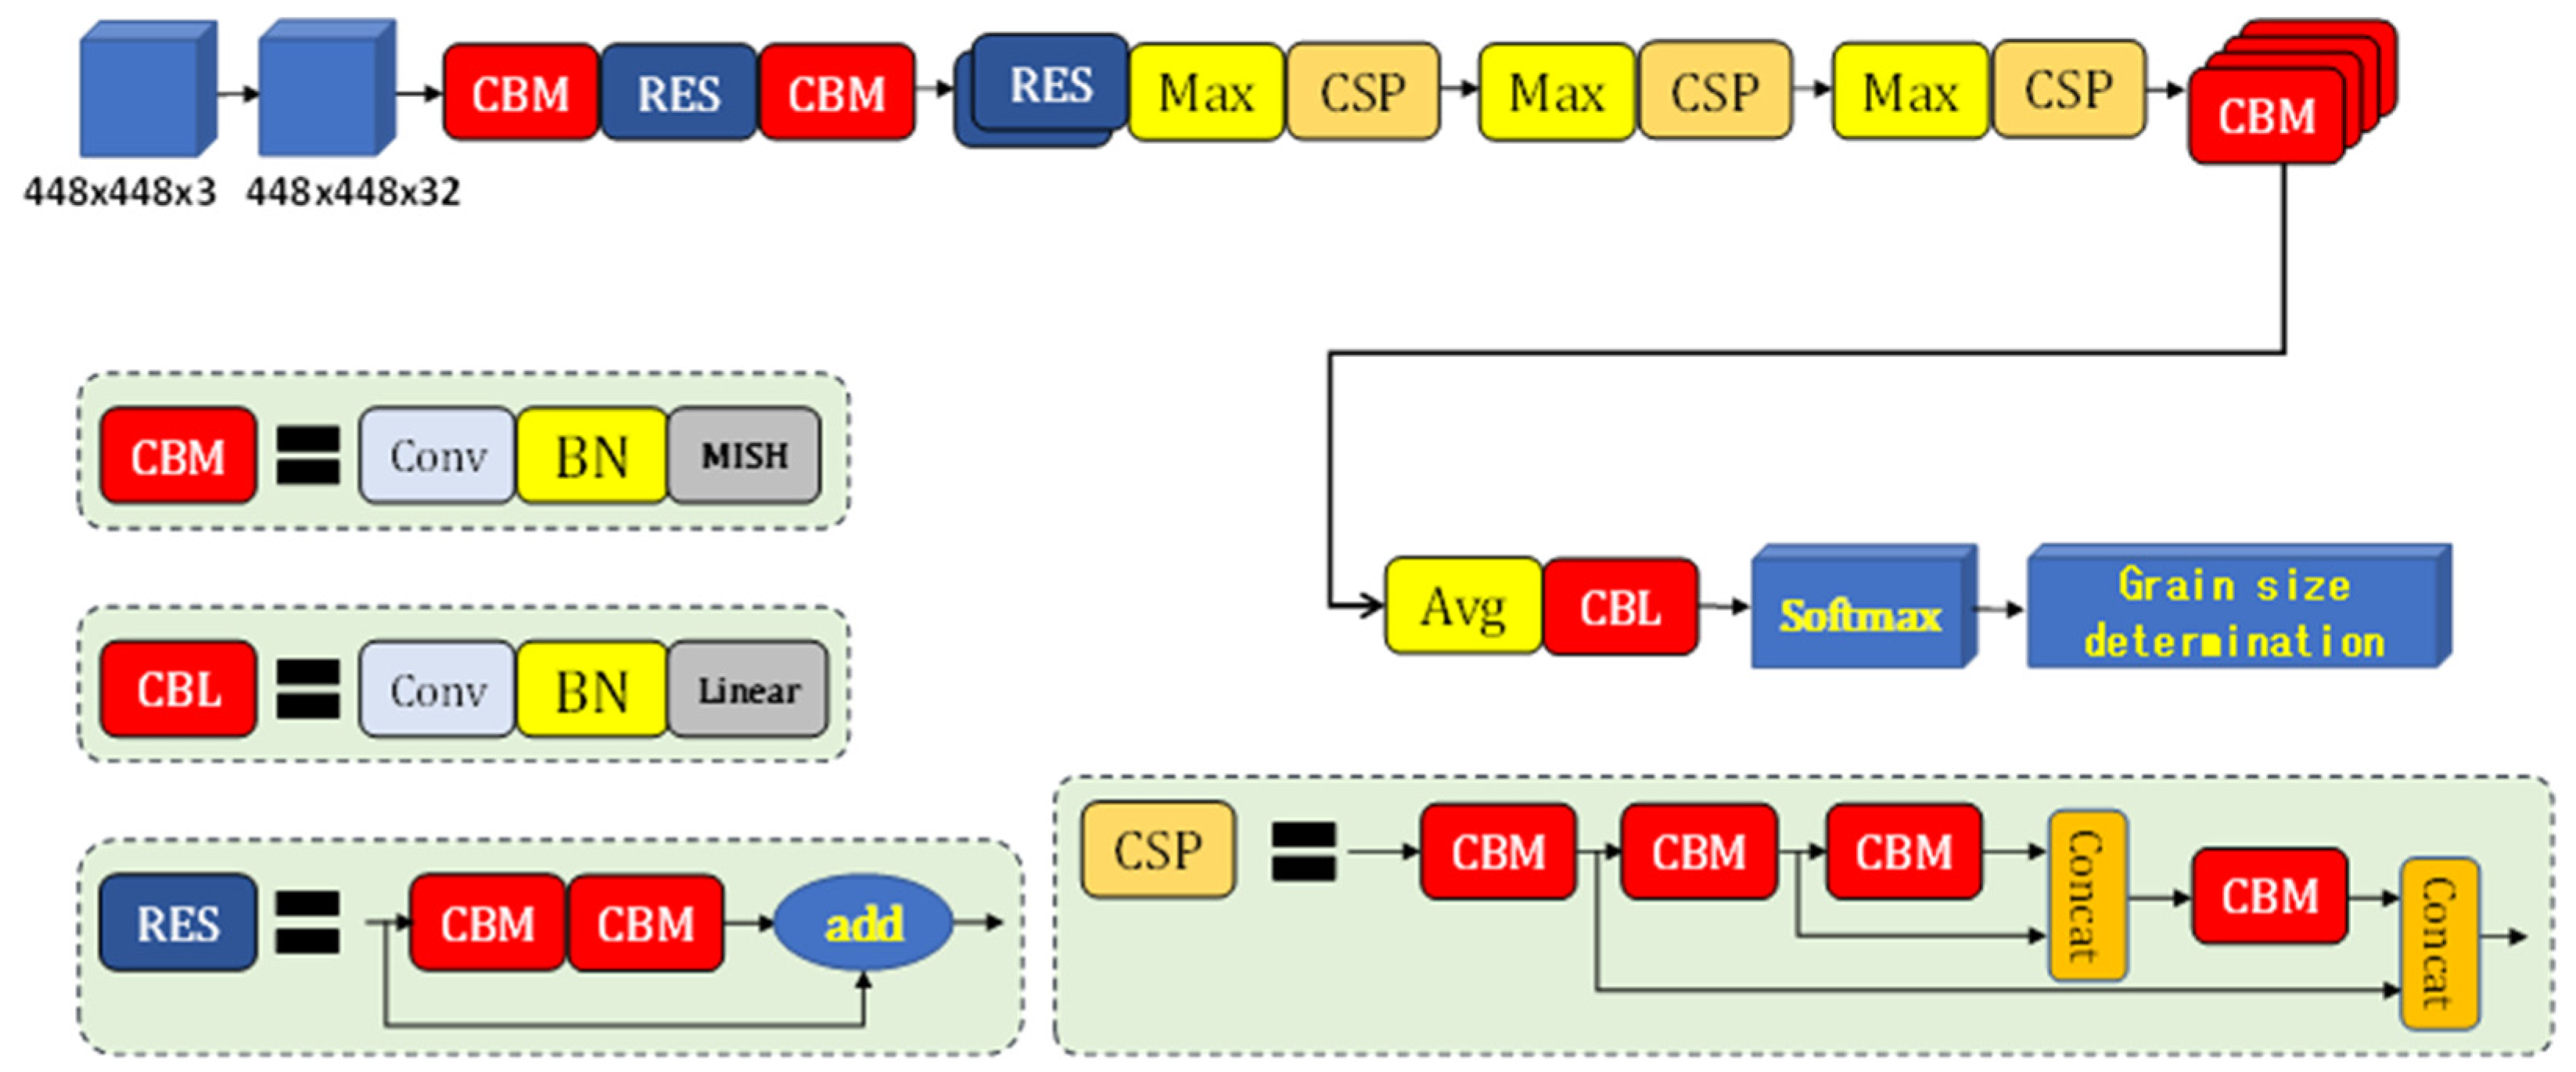
3. Fast Image Classifier

Image classification, which determines the prescribed category for a given image based on the image content, was developed to decrease the gap between computer vision and human vision by “training” the computer by using data. Novel methods for image classification belong to the subfield of artificial intelligence (AI) known as deep learning. Deep learning models persistently break down information with a homogeneous structure that is similar to the way that humans make determinations. In deep learning, we consider neural networks that identify an image based on its features. This section describes the proposed framework for determining grain size with metallic microstructure images. The details of a series of solutions and steps are described below.

Feature Extraction Using Convolutional Neural Networks

In this paper, we apply several CNN networks to extract features from grain size images. We mainly adopt residual networks (ResNet) [14] and cross-stage partial networks (CSPNet) [15] to extract local descriptors from each image. ResNet [14], one of the most successful architectures in image classification, provides shortcut connections that allow a signal to bypass a layer and move to the next layer in the sequence, which makes it possible to train hundreds or even thousands of layers and still achieve compelling performance. CSPNet is the backbone of YOLOv4 [15], which is used to enhance the learning capacities of CNN models and reduce computing costs. Our system adopts the system architecture shown in Figure 1 when given an image from a digital camera or a database.
In contrast to other deep learning network architectures, the FIC model reserves more information by not downsampling at the first level, as shown in Figure 1. Next, the feature extraction networks of the FIC model use three ResNets and CSPNets to extract more information. The FIC model applies various convolutions to extract features such as edges, textures, colors, and inconsistent lighting patterns from the grain size images, yielding size scale convolutions such as 3 × 3 and 1 × 1. Here, a 1 × 1 convolution is applied to reduce the channel dimension and thus computation cost without harming performance. Max pooling layers are used mainly to reduce the matrix dimensions, which also accelerates computation. For example, we use max pooling for a 4 × 4 matrix to produce a 2 × 2 matrix. In addition, softmax cross-entropy [16] is the canonical loss function for multi-class classification in deep learning. Therefore, softmax is used to predict the probability of different grain sizes. The details of the FIC model’s layers are presented in Table 1.
Table 2 compares well-known network architectures with the proposed model in terms of model size, as shown in Table 2. Here, “size” indicates the size of the neural network architecture. Clearly, ResNets and CSPNet both reduce the size of the FIC model. However, methods such as Darknet53, with bigger models, degrade operational performance. The FIC model is positioned as a lightweight model for real-time grain size evaluation that uses efficient convolution layers and neural network design.

4. Experimental Results and Analysis

In this section, we evaluate the FIC model on the MIRDC metallographic dataset. All the experiments were implemented using the CUDA C++ API on a machine with NVIDIA 2080Ti GPUs (Nvidia Corporation, Santa Clara, CA, USA). We collected the grain size dataset from the metallographic analysis laboratory of the Metal Industries Research and Development Centre (MIRDC). All of the grain size images were collected using the Zeiss Axiovert 200 Mat optical microscope (Carl Zeiss Light Microscopy, Göttingen, Germany), as shown in Figure 2. The input grain size images were resized to 736 × 416 pixels. The weight parameters were initialized randomly for all experiments, and the learning rate was set to 0.01. During training, once the error rate stopped decreasing, the learning rate was multiplied by 0.001.

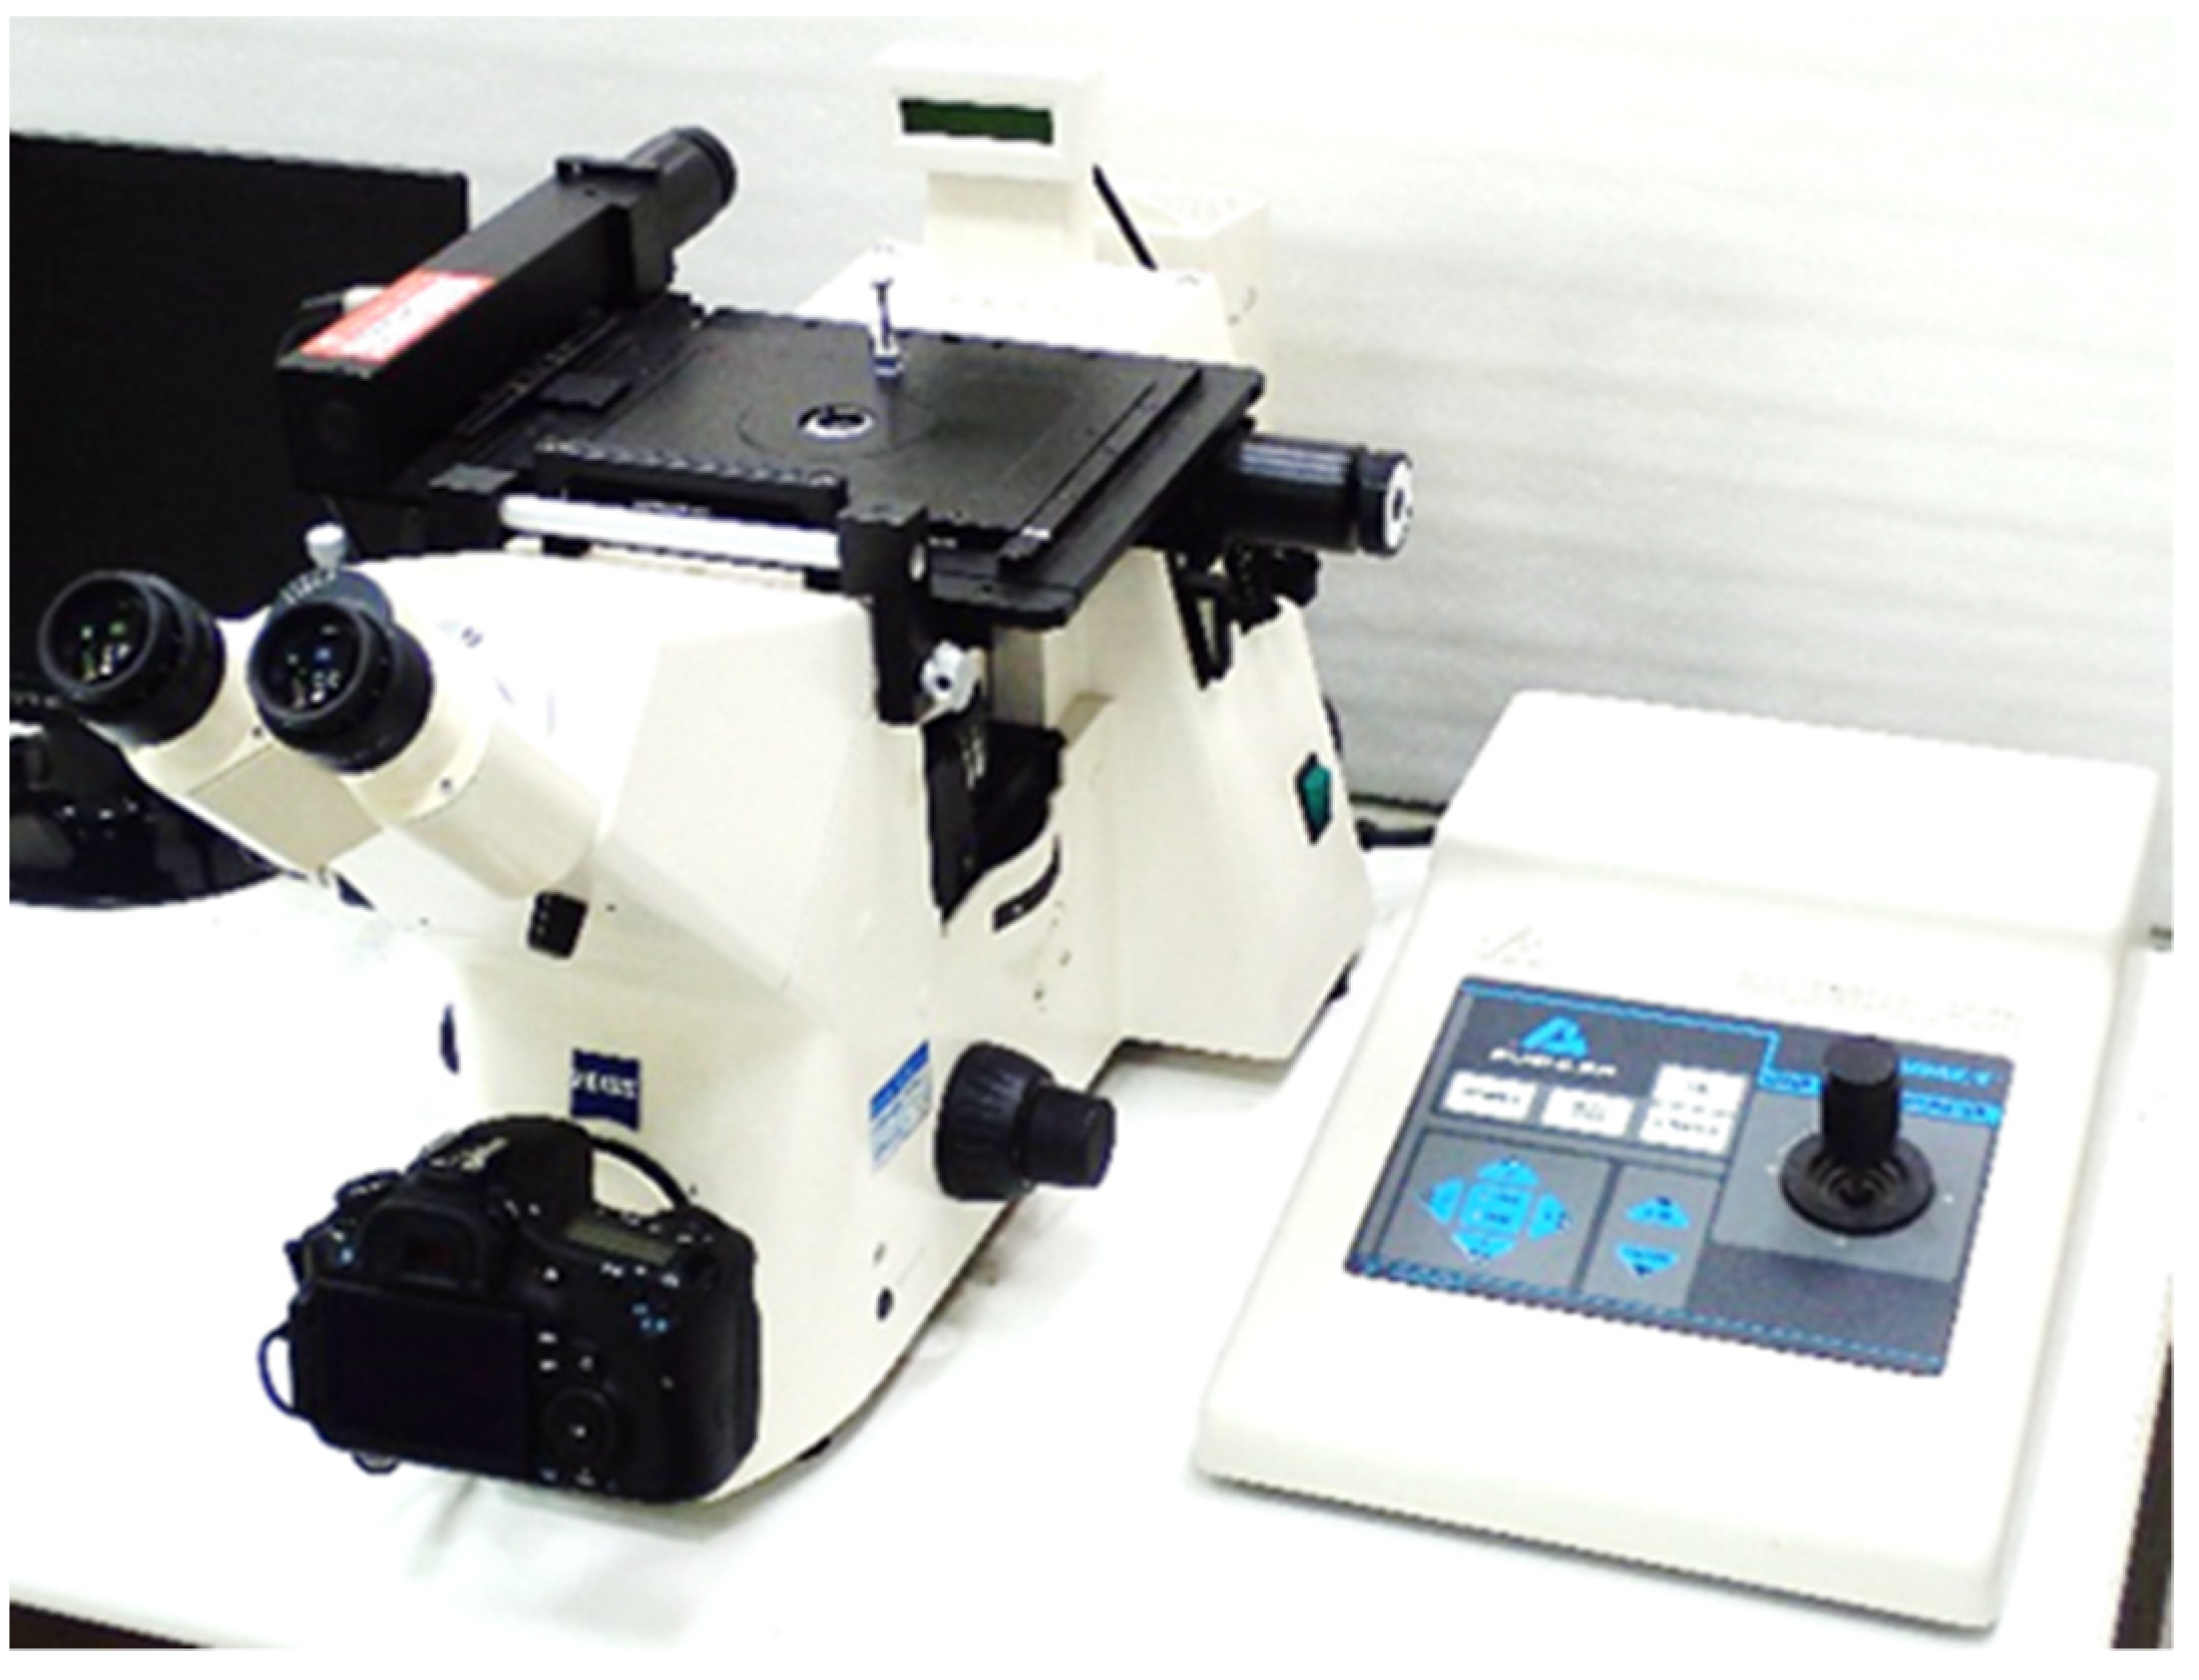
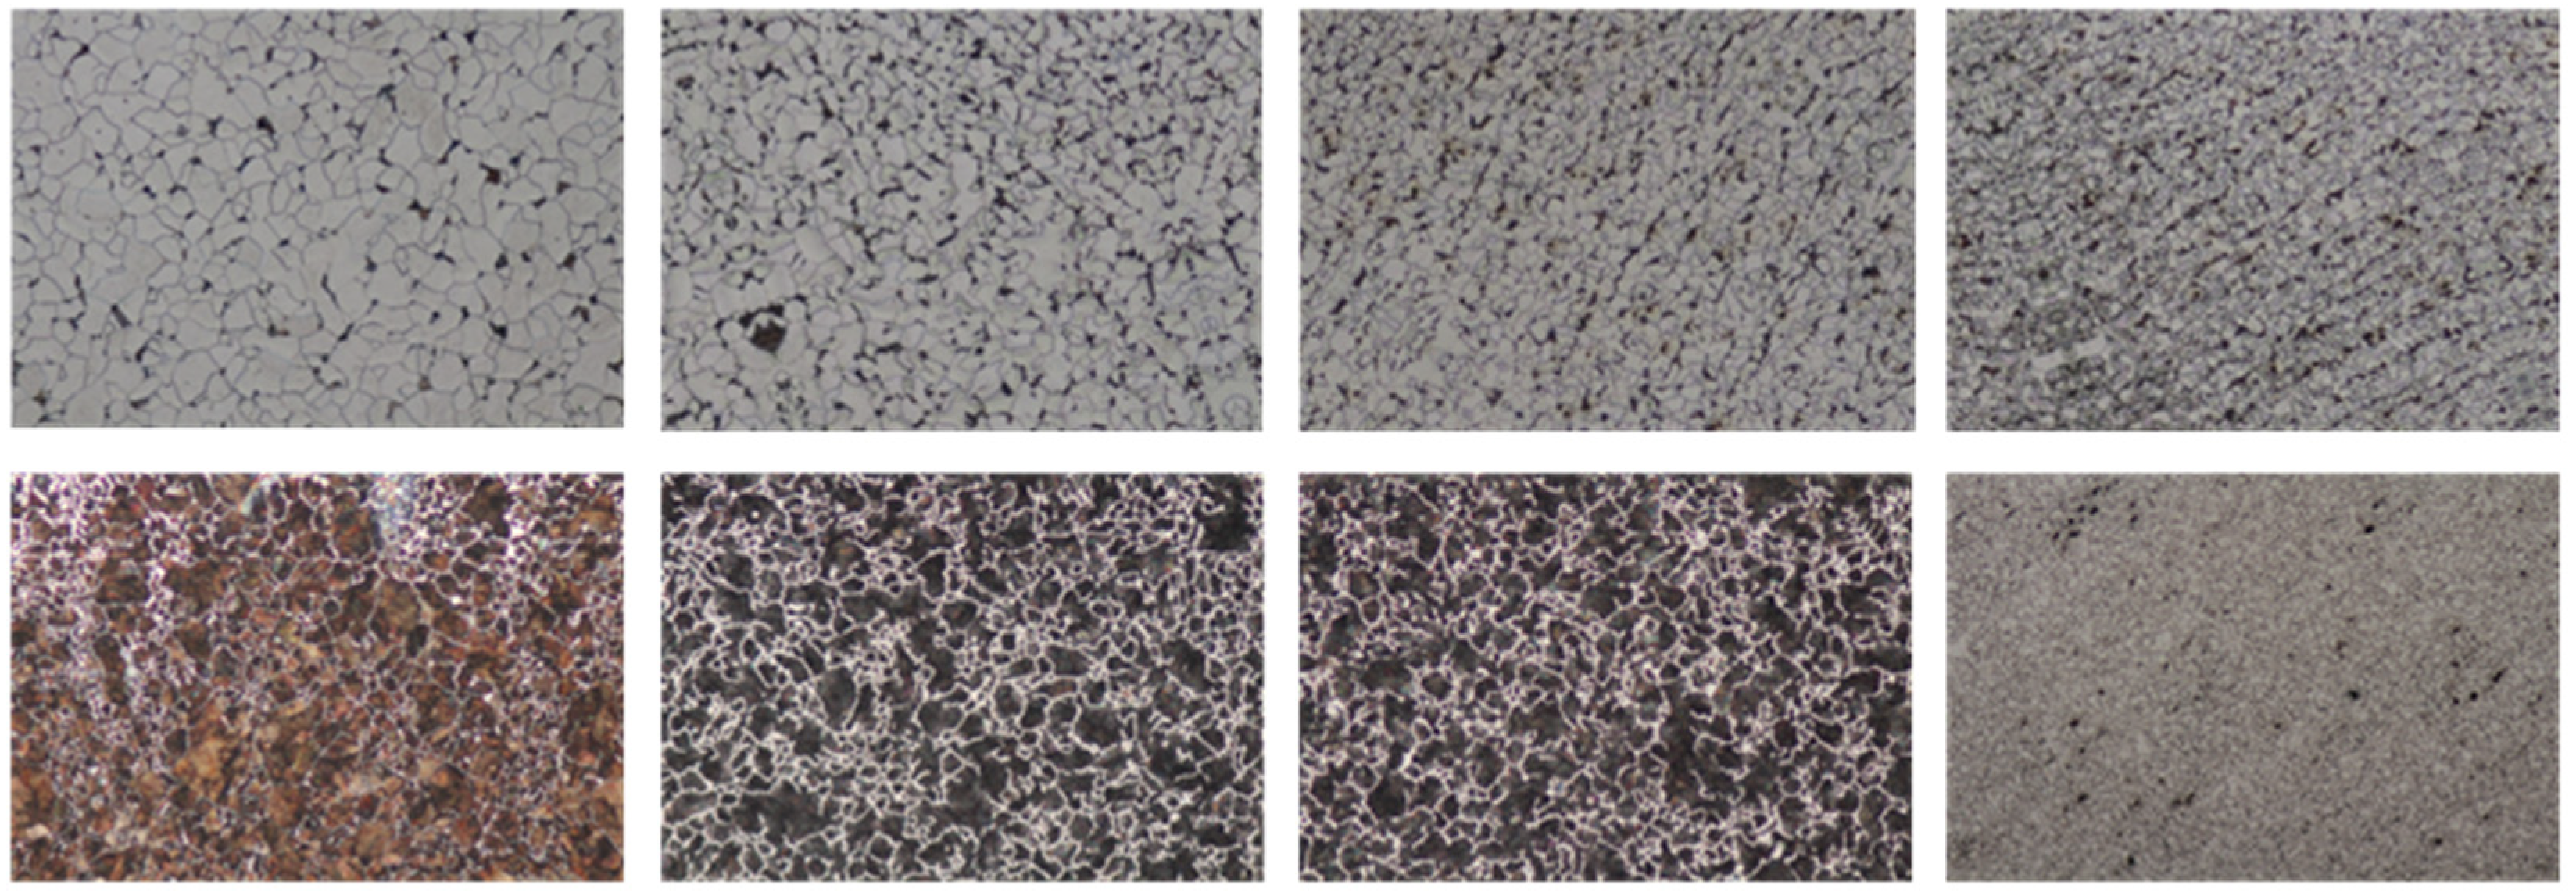
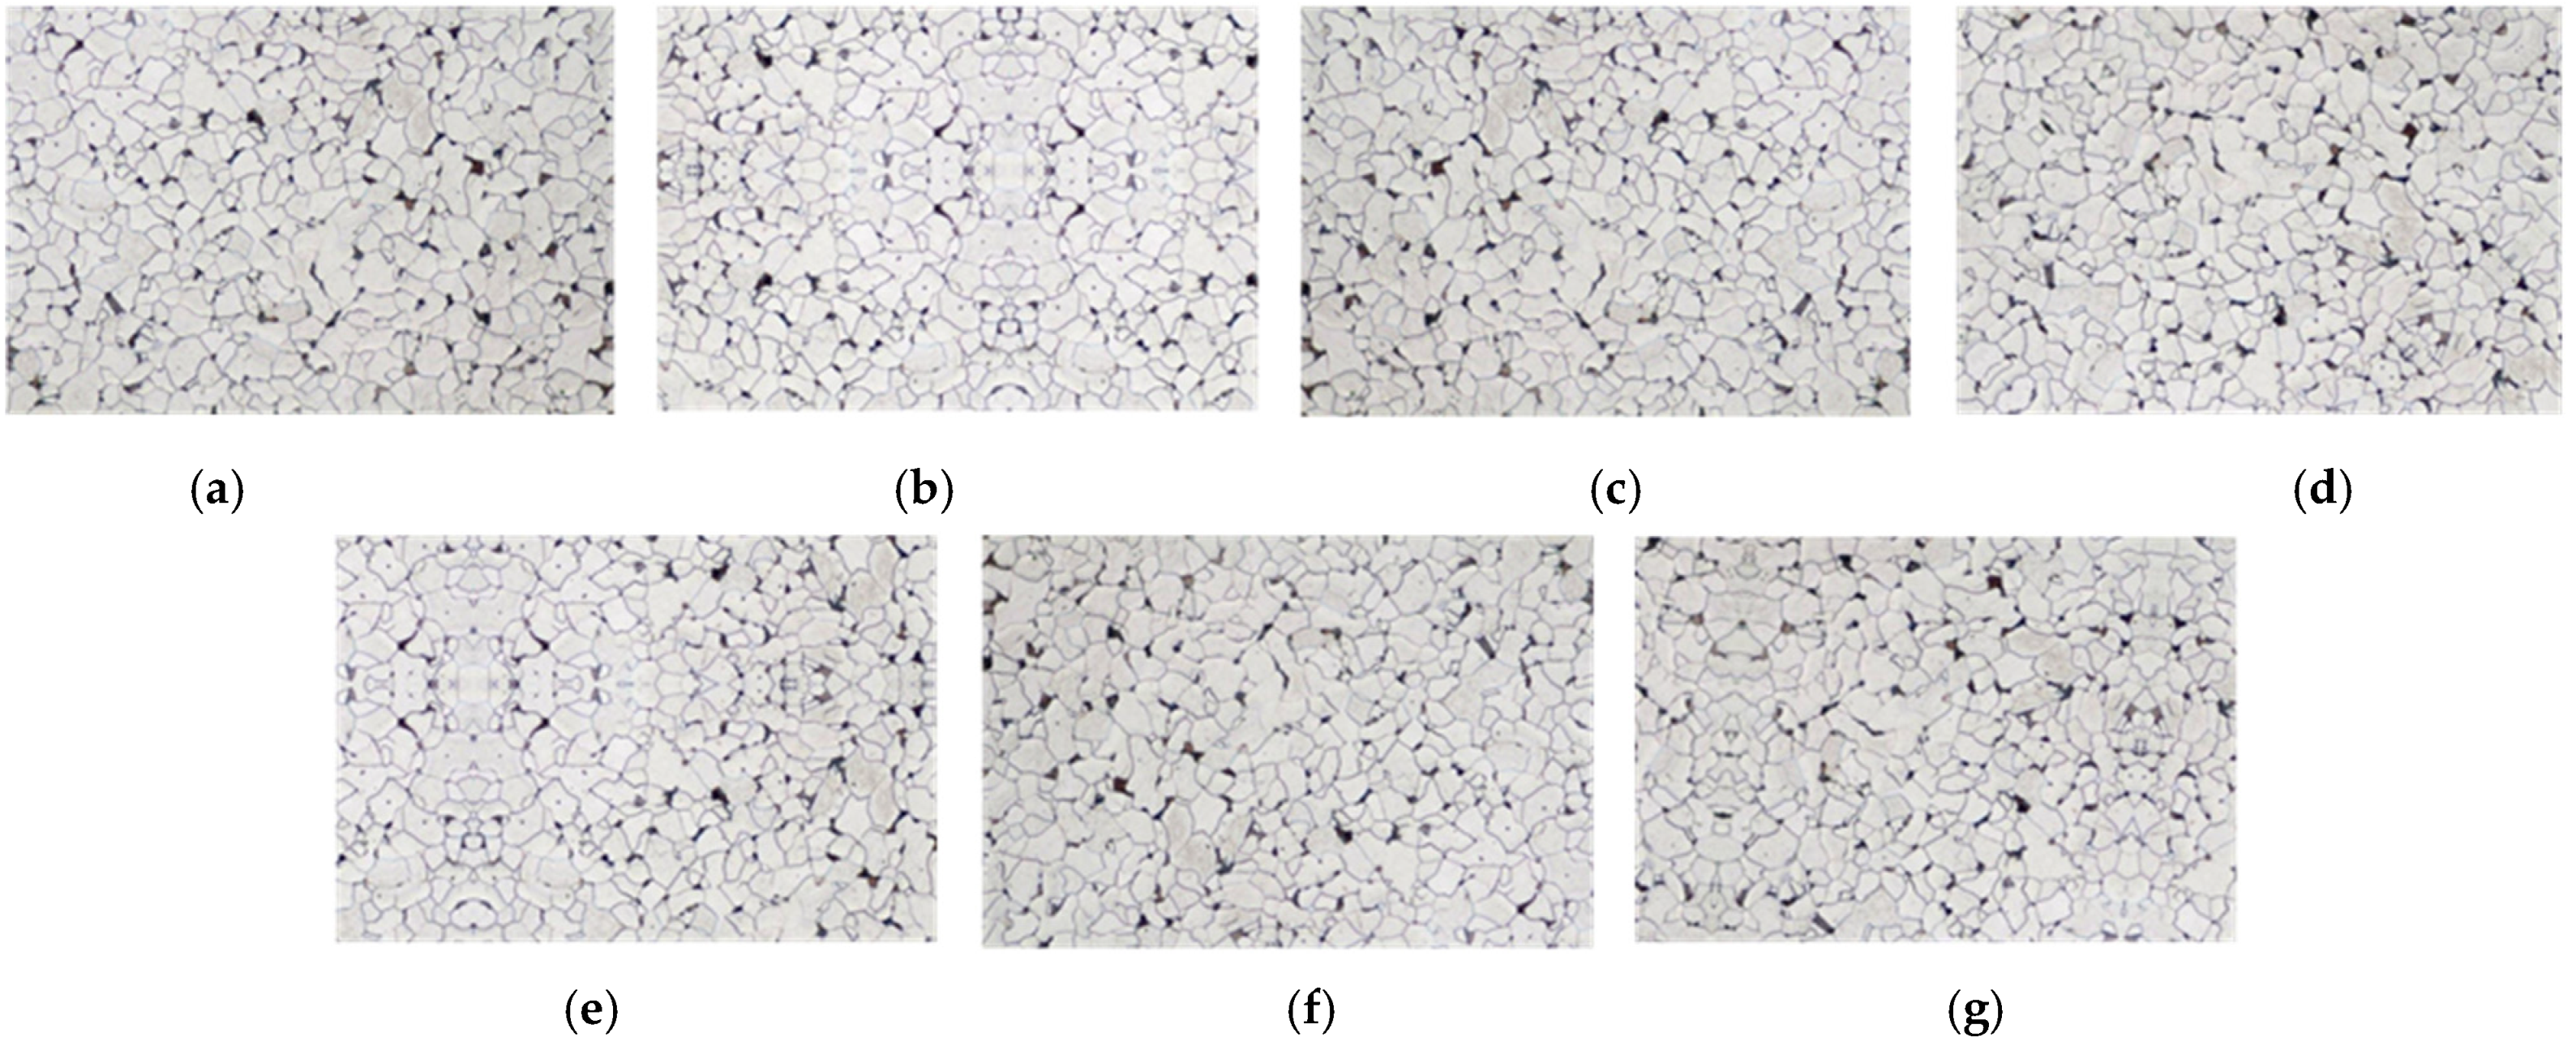
4.1. Grain Size Dataset

Currently there are no appropriate grain size datasets for training the proposed model. Thus we collected two kinds of grain size images (austenite and ferrite) from the metallographic analysis laboratory of MIRDC. Due to the differences between austenite and ferrite grain size structures, we compiled two standard series of graded images. In the two datasets, we evaluated the grade of grain size images by using the two standard graded wall chart image series for the comparison method. According to the ASTM E112 standard, the ferrite grain sizes are divided into grades 0 to 10, and the austenite grain sizes are divided into grades 0 to 8. Low-grade grain sizes correspond to poor metal strength and toughness. With modern quality control in the manufacturing process with technological advancements, such low-grade grain sizes are rare. Therefore, in the two datasets, we collected grain sizes of four grades under 100× magnification or the ferrite grain size dataset, that is, grade 7 to 10; likewise, for the austenite dataset, we collected grain sizes of grades 5 to 8, as shown in Figure 3.
In the ferrite dataset, each grade comprises 250 to 300 grain size images. Therefore, the grain size dataset is composed of 1092 24-bit JPEG images. In addition, there are 2248 images in the austenite dataset, each grade of which comprises 550 to 700 images. Generally, as bigger datasets result in better deep learning models [17], one way to improve model performance is to augment the data. Data augmentation is used to artificially expand the size of a training dataset by creating modified versions of images in the dataset. In addition, data augmentation helps reduce overfitting when training a deep neural network.
As shown in Figure 4, we used the three most common data augmentation techniques for grain size images: flipping, cropping, and rotation, each of which is associated with two parameters. Thus, in this study, we used data augmentation with six operations to train the models for each image. In total, we evaluated the proposed method using 7644 ferrite grain size images with four grades and 15,736 austenite grain size images with four grades. We divided the two grain size datasets into training and testing sets by randomly splitting the dataset. In our experiments, the training and testing data was selected at a ratio of 80:20 for training and testing, and five-fold cross validation was conducted.

4.2. Validation Metrics

In this paper, the grain size evaluation effect is divided into overall classification accuracy, classification accuracy of different categories, and classification time consumption. The classification accuracy of an image includes the accuracy of the overall image classification and the accuracy of each classification. Assuming that n i j represents the number of grain size images in grade i divided into grade j, the accuracy of the overall classification is as follows:
a c c u r a c y a l l = i n i i / i , j n i j
The accuracy of each individual classification is as follows:
a c c u r a c y i = n i i / j n i j
The run time is the average time to read an image to produce a classification result.

4.3. Experimental Results and Analysis

As seen in Table 3, the recognition rate of the FIC model is generally the same for different grain size grades, exceeding 98; accuracy is particularly high when classifying ferrite images of grades 7 and 8 and austenite images of grade 5. This shows that larger grain sizes are advantageous for feature extraction.
In addition to performance, speed is important for neural network architectures. Therefore, we also used the ferrite grain size dataset to compare our method with state-of-the-art CNN classifiers in terms of classification accuracy and BFlops (billions of float operations per second), as shown in Table 4. These classifiers include Darknet53 [15], DenseNet201 [18], VGG16 [19], ResNet50 [14], and the proposed method. The experimental results show that FIC is the fastest classifier and VGG16 is the slowest, mostly because VGG16 has 138 million parameters, leading to greater computational costs. In DenseNet201 [18] and ResNet50 [14], the main network architectures of feature extraction are obviously not enough for image classification, resulting in the lower accuracy. In addition, although Darknet53 has the highest accuracy on the training and testing sets, its BFlops of 56.88 is unacceptable for real-time image classification. Thus, the FIC accuracy is not the best, but its performance approximates that of Darknet53, making it useful for real-time image classification.
In this experiment, some ferrite grain sizes were still not accurately evaluated by the proposed algorithm. Analysis of the testing results revealed that grain sizes between grades 9 and 10 were too similar, and revealed an uneven grain size distribution. This will likely be a difficult problem for future research. Automatic grain size classification is essential for metallic microstructure data. We hope to further improve the classifier using more advanced model ablation and auxiliary methods to facilitate the accurate classification of grain size specimens, thus making it easier for operators to use these methods to evaluate grain size effectively.

5. Conclusions

In this work, we proposed the CNN-based FIC model and used it to determine grain size for carbon steel. In addition, we presented two kinds of datasets to evaluate the effectiveness of FIC in determining grain size. The experimental results show that the proposed method yields high performance in terms of accuracy, and even outperforms state-of-the-art algorithms. To speed up the process of the development of steel products with more accurate judgment for grain size, and to lighten the heavy load of professional operators and prevent evaluation misses and false classification, a grain size classification system is essential. In future work, we will collect a larger dataset to further improve the algorithm and boost classification accuracy. We believe that FIC will be of use in many successful image classification applications.

Author Contributions

Conceptualization, J.-C.L. and H.-H.H.; methodology, J.-C.L.; software, S.-C.L.; validation, S.-C.L., C.-H.C. and H.-C.H.; resources, C.-H.C.; data curation, S.-C.L.; writing—original draft preparation, J.-C.L.; writing—review and editing, H.-H.H.; visualization, S.-C.L.; supervision, H.-C.H.; project administration, H.-C.H.; All authors have read and agreed to the published version of the manuscript.

Funding

This research received no external funding.

Acknowledgments

The authors gratefully acknowledge China Steel Corporation and Metal Industries Research & Development Centre (MIRDC) for their assistance with grain size images.

Conflicts of Interest

The authors declare no conflict of interest.

References

  1. Standard Test Method for Determining Average Grain Size; ASTM E112-13; ASTM International: West Conshohocken, PA, USA, 2013.
  2. Steels—Micrographic Determination of the Apparent Grain Size; ISO 643:2003; International Organization for Standardization: Geneva, Switzerland, 2003.
  3. Giumelli, A.K.; Militzer, M.; Hawbolt, E.B. Analysis of the austenite grain size distribution in plain carbon steels. ISIJ Int. 1999, 39, 271–280. [Google Scholar] [CrossRef]
  4. de Andrés, C.G.; Bartolomé, M.J.; Capdevila, C.; Martín, D.S.; Caballero, F.G.; López, V. Metallographic techniques for the determination of the austenite grain size in medium-carbon microalloyed steels. Mater. Charact. 2001, 46, 389–398. [Google Scholar] [CrossRef] [Green Version]
  5. Fuchs, N.; Bernhard, C. Potential and limitations of direct austenite grain growth measurement by means of HT-LSCM. Mater. Today Commun. 2021, 28, 102468. [Google Scholar] [CrossRef]
  6. Colás, R. On the variation of grain size and fractal dimension in an austenitic stainless steel. Mater. Charact. 2001, 46, 353–358. [Google Scholar] [CrossRef]
  7. Barreto, H.P.; Villalobos, I.R.T.; Agdaleno, J.J.; Navarro, A.M.H.; Hernández, L.A.M.; Guerrero, F.M. Automatic grain size determination in microstructuresusing image processing. Measurement 2013, 46, 249–258. [Google Scholar] [CrossRef]
  8. Lixin, Z.; Zhengguang, X.; Shuailing, W.; Xuechong, R.; Meiling, W. Grain size automatic determination for 7050 al alloy based on a fuzzy logic method. Rare Met. Mater. Eng. 2016, 45, 0548–0554. [Google Scholar]
  9. Lu, B.; Lin, Z.; Wang, H. Grain identification of polarizing images with level set method. In Proceedings of the IEEE 3rd International Conference on Communication Softwareand Networks 2011, Xi’an, China, 27–29 May 2011; Volume 45, pp. 0548–0554. [Google Scholar]
  10. Gajalakshmi, K.; Palanivel, S.; Nalini, N.J.; Saravanan, S.; Raghukandan, K. Grain size measurement in optical microstructure using support vector regression. Int. J. Light Electron Opt. 2017, 138, 320–327. [Google Scholar]
  11. Dengiz, O.; Smith, A.E.; Nettleship, I. Grain boundary detection in microstructure images using computational intelligence. Int. J. Light Electron Opt. Comput. Ind. 2015, 56, 854–866. [Google Scholar] [CrossRef]
  12. Ma, B.; Liu, C.; Wei, X.; Gao, M.; Ban, X.; Wang, H.; Huang, H.; Xue, W. WPU-Net: Boundary learning by using weighted propagation in convolution network. arXiv 2019, arXiv:1905.09226. [Google Scholar]
  13. Baggs, G.S.; Guerrier, P.; Loeb, A.; Jones, J.C. Automated Copper Alloy Grain Size Evaluation Using a Deep-learning CNN. arXiv 2020, arXiv:2005.09634. [Google Scholar]
  14. He, K.; Zhang, X.; Ren, S.; Sun, J. Deep Residual Learning for Image Recognition. arXiv 2015, arXiv:1512.03385. [Google Scholar]
  15. Bochkovskiy, A.; Wang, C.Y.; Mark Liao, H.Y. YOLOv4: Optimal speed and accuracy of object detection. In Proceedings of the Conference on Computer Vision and Pattern Recognition CVPR, Nanjing, China, October 16–18 2020; pp. 14–19. [Google Scholar]
  16. Bridle, J.S. Probabilistic interpretation of feedforward classification network outputs, with relationships to statistical pattern recognition. In Neurocomputing; Springer: Berlin/Heidelberg, Germany, 1990; pp. 227–236. [Google Scholar]
  17. Chen, S.; Abhinav, S.; Saurabh, S.; Abhinav, G. Revisting unreasonable effectiveness of data in deep learning era. In Proceedings of the ICCV, Venice, Italy, 22–29 October 2017; pp. 843–852. [Google Scholar]
  18. Huang, G.; Liu, Z.; Maaten, L.V.; Weinberger, K.Q. Densely Connected Convolutional Networks. arXiv 2016, arXiv:1608.06993. [Google Scholar]
  19. Zhang, X.; Zou, J.; He, K.; Sun, J. Accelerating Very Deep Convolutional Networks for Classification and Detection. IEEE Trans. Pattern Anal. Mach. Intell. 2016, 38, 1943–1955. [Google Scholar] [CrossRef] [Green Version]
Figure 1. FIC architecture.
Metals 11 01547 g001
Figure 2. Zeiss Axiovert 200 Mat optical microscope.
Metals 11 01547 g002
Figure 3. Grain size images. The top rows are grade-7 to -10 ferrite images from left to right, and the bottom rows are grade-5 to -8 austenite images.
Metals 11 01547 g003
Figure 4. Data augmentation with six operations to train models for each image. (a) Original ferrite image; (b,e) cropped images; (c,f) flipped images; and (d,g) rotated images.
Metals 11 01547 g004
Table 1. FIC network architecture.
LayerOperation TypeInput FilterSize/StrideOutputLayer
0Convolution448 × 448 × 3323 × 3/1448 × 448 × 32-
1Convolution448 × 448 × 32643 × 3/2224 × 224 × 64-
2Convolution224 × 224 × 64321 × 1/1224 × 224 × 32ResNet
3Convolution224 × 224 × 32643 × 3/1224 × 224 × 64
4Shortcut224 × 224 × 64--224 × 224 × 64
5Convolution224 × 224 × 641283 × 3/2112 × 112 × 128-
6Convolution112 × 112 × 128641 × 1/1112 × 112 × 64ResNet
7Convolution112 × 112 × 641283 × 3/1112 × 112 × 64
8Shortcut112 × 112 × 64--112 × 112 × 128
9Convolution112 × 112 × 128641 × 1/1112 × 112 × 64ResNet
10Convolution112 × 112 × 641283 × 3/1112 × 112 × 128
11Shortcut112 × 112 × 128--112 × 112 × 128
12Max pooling112 × 112 × 128-2 × 2/256 × 56 × 128-
13Convolution56 × 56 × 1281283 × 3/156 × 56 × 128CSPNet
14Route13--56 × 56 × 64
15Convolution56 × 56 × 64643 × 3/156 × 56 × 64
16Convolution56 × 56 × 64643 × 3/156 × 56 × 64
17Concatenation15, 16--56 × 56 × 128
18Convolution56 × 56 × 1281281 × 1/156 × 56 × 128
19Concatenation13, 18--56 × 56 × 256
20Max pooling56 × 56 × 256-2 × 2/228 × 28 × 256-
21Convolution28 × 28 × 2562563 × 3/128 × 28 × 256CSPNet
22Route21--28 × 28 × 128
23Convolution28 × 28 × 1281283 × 3/128 × 28 × 128
24Convolution28 × 28 × 1281283 × 3/128 × 28 × 128
25Concatenation23, 24--28 × 28 × 256
26Convolution28 × 28 × 2562561 × 1/128 × 28 × 256
27Concatenation21, 26--28 × 28 × 512
28Max pooling28 × 28 × 512-2 × 2/214 × 14 × 512-
29Convolution14 × 14 × 5125123 × 3/114 × 14 × 512CSPNet
30Route29--14 × 14 × 256
31Convolution14 × 14 × 2562563 × 3/114 × 14 × 256
32Convolution14 × 14 × 2562563 × 3/114 × 14 × 256
33Concatenation31, 32--14 × 14 × 256
34Convolution14 × 14 × 2565121 × 1/114 × 14 × 512
35Concatenation29, 34--14 × 14 × 1024
36Convolution14 × 14 × 10245121 × 1/114 × 14 × 512-
37Convolution14 × 14 × 5125123 × 3/114 × 14 × 512-
38Convolution14 × 14 × 5122561 × 1/114 × 14 × 256-
39Convolution14 × 14 × 2565123 × 3/114 × 14 × 512-
40Avgpool14 × 14 × 512-Global1 × 1 × 512-
41Connected1 × 1 × 51241 × 1/11 × 1 × 4-
42Softmax
Table 2. Existing methods vs. proposed method.
ModelDarknet53DenseNetVGG16ResNet50FIC Model
Size159MB61MB1729MB81MB37MB
BFlops56.8832.63122.7928.0116.33
Table 3. FIC performance for different grain sizes.
Grade5678910
Ferrite 100%100%99.13%99.68%
Austenite100%98.98%99.13%99.38%--
Table 4. CNN classifier performance.
MethodAccuracyBFlops
Darknet5399.81%56.88
DenseNet20197.52%32.63
VGG1645.00%122.79
ResNet5098.88%28.01
FIC model99.70%16.33
Publisher’s Note: MDPI stays neutral with regard to jurisdictional claims in published maps and institutional affiliations.

